
Abstract
Objective
To investigate the effect of visual degradation on simulated flight performance, perceived stress, and perceived task difficulty.
Background
Establishing visual standards for pilots is crucial, although it may limit the pool of eligible candidates and impact pilot retention. Despite this, there is limited understanding regarding the influence of vision on pilot performance.
Method
Twenty participants (0-300 flight hours) completed a flight simulation task using the ALSIM AL250 in two experiments. Distance static visual acuity (VA) ranged from 6/6 (20/20) to 6/60, with scenarios including no vision. Experiment 1 (n = 10) tested landing performance for 6 VA conditions, while experiment 2 (n = 10) involved a more difficult circuit task (traffic pattern) with 8 VA conditions. Participants completed stress and difficulty questionnaires between trials. Flight performance variables assessed were vertical speed, altitude, attitude, pitch, and roll.
Results
In both flight simulation experiments, vision degradation did not affect novice pilots’ landing performance, but complete loss of vision led to loss of control. Participants in experiment 1 experienced stress at lower perturbation level than in experiment 2.
Conclusion
Vision degradation up to 6/60 had no discernible impact on novice pilots’ simulated approach to landing or flight circuit and landing. Total vision loss led to loss of aircraft control. Perceived stress and difficulty increased with reduced vision.
Application
This research opens the door to reexamine the visual standards for pilots and serve as a simple tool to manipulate perceived stress and difficulty in operational tasks.
Introduction
Undoubtedly, vision is required for the safe operation of an aircraft. Distance vision is needed for assessing the visual environment outside of the cockpit, near and intermediate vision are needed for monitoring instrumentation within the cockpit. Therefore, it is surprising to see the lack of evidence that exists to support the current medical standards for vision. Without the research and evidence to support it, we cannot say definitively this standard is appropriate. Thereby, it may be unintentionally discriminatory, potentially limiting the pool of eligible pilots as well as causing a problem for pilot retention since there is well documented decline in vision with age (Kikukawa et al., 1999). The Canadian Human Rights Act prohibits the denial of employment opportunity based on disability unless it can be demonstrated that the applicant cannot meet the Bona Fide Occupational Requirements (BFOR) of the job (Canadian Human Rights Reporter Supplement, 1982). Therefore, it is necessary to determine if the current visual standards are necessary to perform the job.
The International Civil Aviation Organization (ICAO) is a specialized agency of the United Nations that develops and promotes global standards and recommended practices for aviation safety, security, efficiency, and environmental protection, facilitating the harmonization of regulations across its 193 member states (ICAO, 2012). ICAO sets the minimum vision standard requirements for pilots, air traffic controllers, and other aviation personnel (ICAO, 2012). The development of vision standards in aviation dates to the early 20th century, as aviation operations expanded rapidly. These initial standards for civil aviation initially mirrored that of the railway industry (Ballantyne, 1940). Since then, the vision standards have been updated to incorporate advances in technology which have primarily been informed by expert opinion (Backman, 1984). ICAO’s annex 1 specifies static distance visual acuity standards, mandating a minimum of 6/9 or better in each eye separately with or without correction, and 6/6 or better binocularly (ICAO, 2012). The current distance visual acuity (reading the eye chart) requirement for civil aviation pilots in Canada is 6/9 which is equivalent to 20/30 in Imperial notation (the individual being tested needs to be 6 m away from an object that a person with “normal” vision could see at 9 m away) corrected or uncorrected monocularly (in each eye separately) for a commercial airline pilot but must be 6/6 binocularly, and 6/12 (20/40) corrected or uncorrected monocularly, but no worse than 6/60 (20/200) uncorrected monocularly for a private pilot license (Transport Canada, 2019). The current near visual requirement is N5 (6/9 equivalent at 40 cm) at a viewing distance of 30–50 cm (Transport Canada, 2019).
Studies on vision in civil aviation are limited. Rabin (1994) looked at time-limited visual resolution in pilot trainees by using a single forced choice letter recognition task to measure both visual acuity and small letter contrast sensitivity. Results highlighted the greater sensitivity to changes in small letter contrast than visual acuity to factors that affect visual resolution such as defocus and stimulus intensity. Miura et al. (2002) found that increasing the allowable age of Japanese airline transport pilots from 60 to 63 years was not associated with a decline in safety despite the fact that visual acuity is known to worsen with increasing age (Kikukawa et al., 1999). Mann and Hovis (1996) examined the effect of decreased near visual acuity, caused by optical blur, on a simulated flight approach using instrument flight rules (IFR). Two of their participants lost control at a visual acuity degradation level of 6/19 and one at 6/36. While that paper provided valuable information as to the effects of optical blur at near distances, there has been no work done to replicate or expand on this topic. This work is also limited in that it never investigated the performance of the landing task. The simulation ended at the decision height which is the specific height during the approach at which a decision must be made to initiate a missed approach or continue to land based on distant visual cues (Mann & Hovis, 1996). It is crucial to assess the landing aspect of the flight, not just the approach as over half of all fatal accidents occur during final approach and landing phases (Boeing, 2021).
Although very little work has been done regarding vision in civil aviation, more work has been done examining the visual medical requirement in military aviation. It is important to note that visual acuity in military aviation is important for more than just flight safety. In an examination of the prevalence of contact lens wear in the Royal Australian Air Force, scientists in Australia discussed the waste of human resources associated with restrictive visual standards for pilots (Mork & Watson, 1993). A form of refractive error that requires optical correction is astigmatism. Andrus et al. (2017) tracked outcomes for individuals who entered pilot training on a waiver for excessive astigmatism. They found that pilot participants showed a statistically significant increase in astigmatism over a 5-year period but none of the participants were involved in a mishap where eyes or vision was a contributing cause in the mishap, determined using Safety Center data. Froom et al. (1987) concluded that helicopter pilots with minor decreases in visual acuity (up to 6/9) were not at increased absolute risk for serious air accidents. Additional work was done following the Japan Air Self Defense Force lowering their uncorrected monocular acuity standard from 6/6 (20/20) to 6/7.5 (20/25) in which Kikukawa et al. (1999) examined the distance acuity of nonaviation individuals who met the new vision requirement for student pilots over 25 years. They determined that those with the best initial acuity showed a smaller decline in their distance acuity when compared to those who had worse initial acuity. However, it is thought that with careful visual medical examinations any risk of lowering the visual standards could be mitigated (Kikukawa et al., 1999).
While static visual acuity is used in many situations as the primary measure of vision including in aviation, it may not the best predictor of flight performance. Ginsburg et al. (1982) examined pilot instructors on active duty to relate their contrast sensitivity to their performance in a target recognition simulation task where they found contrast sensitivity to be predicative of performance in complex aviation tasks. This underscores that the role of visual acuity and contrast sensitivity are used for more than just flight safety in military aviation. Further work on contrast sensitivity was done by Stager and Hameluck (1986) where they simulated a search and rescue task in 55 selected and trained Canadian military technicians and found contrast sensitivity to be a better predictor than visual acuity. Other aspects of vision such as stereopsis and its role in vision-based flight tasks have been brought into question many times and there is little consensus concerning its impact on performance (Deas et al., 2017; Hartle et al., 2020; Howard, 1919; Wilmer, 1919). Deas et al. (2017) showed that the presence of stereopsis in comparison to monocular condition improved the accuracy of altitude judgments during a low hover, rotary-wing operation. Hartle et al. (2020) compared the performance of undergraduate observers with that of a group of military rotary-wing aircrew where they found binocular vision provides a significant advantage over monocular vision for estimation of depth, regardless of relevant operational experience.
Beyond physical health, pilots face various and unique stressors including threats to safety, unpredictable environmental factors, and increased workplace demands (Babu et al., 2019; Lee & Liu, 2003; Roscoe, 1993). Psychological health is vital for pilots who have ultimate responsibility for the safety of their passengers. Pilots tend to underreport their stressors to present the most favorable psychological picture of themselves potentially to preserve their medical certification which is a requirement for licensing (Butcher, 1994). In practice, the complexity of piloting activities can lead to extreme and simultaneous increases in both mental workload and stress (Causse et al., 2021). Callister et al. (1992) found that skeletal muscle sympathetic nerve activity (MSNA) is influenced by one’s perceptions of stress, and these stress perceptions depend, at least in part, on the task difficulty. The current study used single numerical ratings to assess pilot perceptions of their stress and task difficulty during a simulated flight and landing for different levels of vision. Assessing the landing portion of flight was critical as previous work has shown increased task difficulty during this phase of flight (Wang et al., 2020). Although the current study does not measure workload directly, there are instances in which workload and stress are associated. For instance, a task generating a high mental workload can lead to an increased mental stress because the individual is overwhelmed with the task difficulty or time pressure (Causse et al., 2021; Warm et al., 2008).
Currently, there is a lack of scientific evidence to connect the vision standards of pilot eligibility and pilot flight performance. To fill in this gap, the research goal was to examine the effects of distance static visual acuity and contrast sensitivity on simulated flight performance and perceived stress and difficulty levels of novice pilots. Simulated flights were completed by pilots with various visual degradations to provide evidence to support the current medical standards for vision or begin to define new ones. While we recognize static visual acuity is not necessarily the best predictor of performance, we chose it as a measure of vision degradation as it is what is currently being used to measure vision during aviation medical examinations (Transport Canada, 2019). We hypothesize that flight performance will not be significantly different when vision is slightly degraded from normal vision when novice pilots complete either a simulated short flight circuit or an approach to landing in clear, calm weather conditions. The rationale behind this choice of conditions was that if pilots were unable to safely operate the aircraft under these conditions, it would be unnecessary to test their performance in more challenging situations. It is important to note that novice pilots are trained to fly relying mostly on the visual information outside of the aircraft and only supported by the instruments within the cockpit; therefore, the degradation of distance visual acuity should significantly affect their ability to obtain this visual information. If our hypothesis is correct then current vision requirements could be more restrictive than needed, possibly limiting the pool of eligible new pilots and making it harder to retain pilots, an especially important consideration given the global pilot shortage (Boeing, 2024). While assessing various levels of pilot experience will be necessary, the current study begins by investigating novice pilots, to try to determine the point at which vision degradation affects their flight performance, assuming that they are likely to be less tolerant of decreased vision than more experienced pilots.
Methods
This study was reviewed and approved by the University of Waterloo Research Ethics Board (ORE# 43564). Informed consent was obtained from all participants and adhered to the tenets of the Declaration of Helsinki.
Apparatus
The ALSIM AL250 Flight Simulator (ALSIM Flight Training Solutions, Le Leroux-Bottereau, France) configured as a single engine aircraft was used to perform simulated flights. Participant vision was degraded using Cambridge Simulation Glasses (Cambridge Simulation Glasses, Cambridge, UK) which systematically scatter light. Level one glasses corresponds to a decrease in vision of 0.08 logMAR (1 line on the letter chart) and level two glasses create a decrease in vision of 0.16 logMAR. Further degradation can be created using multiple pairs of these glasses. Figure 1 shows the effect of the Cambridge Simulation Glasses by comparing vision without the glasses to vision with one pair of level 2 glasses. Distance static visual acuity, contrast sensitivity, and stereoacuity were measured for all levels of visual degradation. Distance static visual acuity was measured using Early Treatment Diabetic Retinopathy Study (ETDRS) (Precision Vision, Illinois, USA) letter charts, contrast sensitivity was measured using Mars charts (The Mars Perceptrix Corporation, New York, USA), and stereoacuity was measured using the Randot test (Stereo Optical Company, Inc, Illinois, USA). Images through the Cambridge Simulation Glasses into the ALSIM AL250 cockpit. Left image is with no visual degradation. Right image is photographed through a pair of level 2 glasses: simulating a degradation of 0.16 logMAR.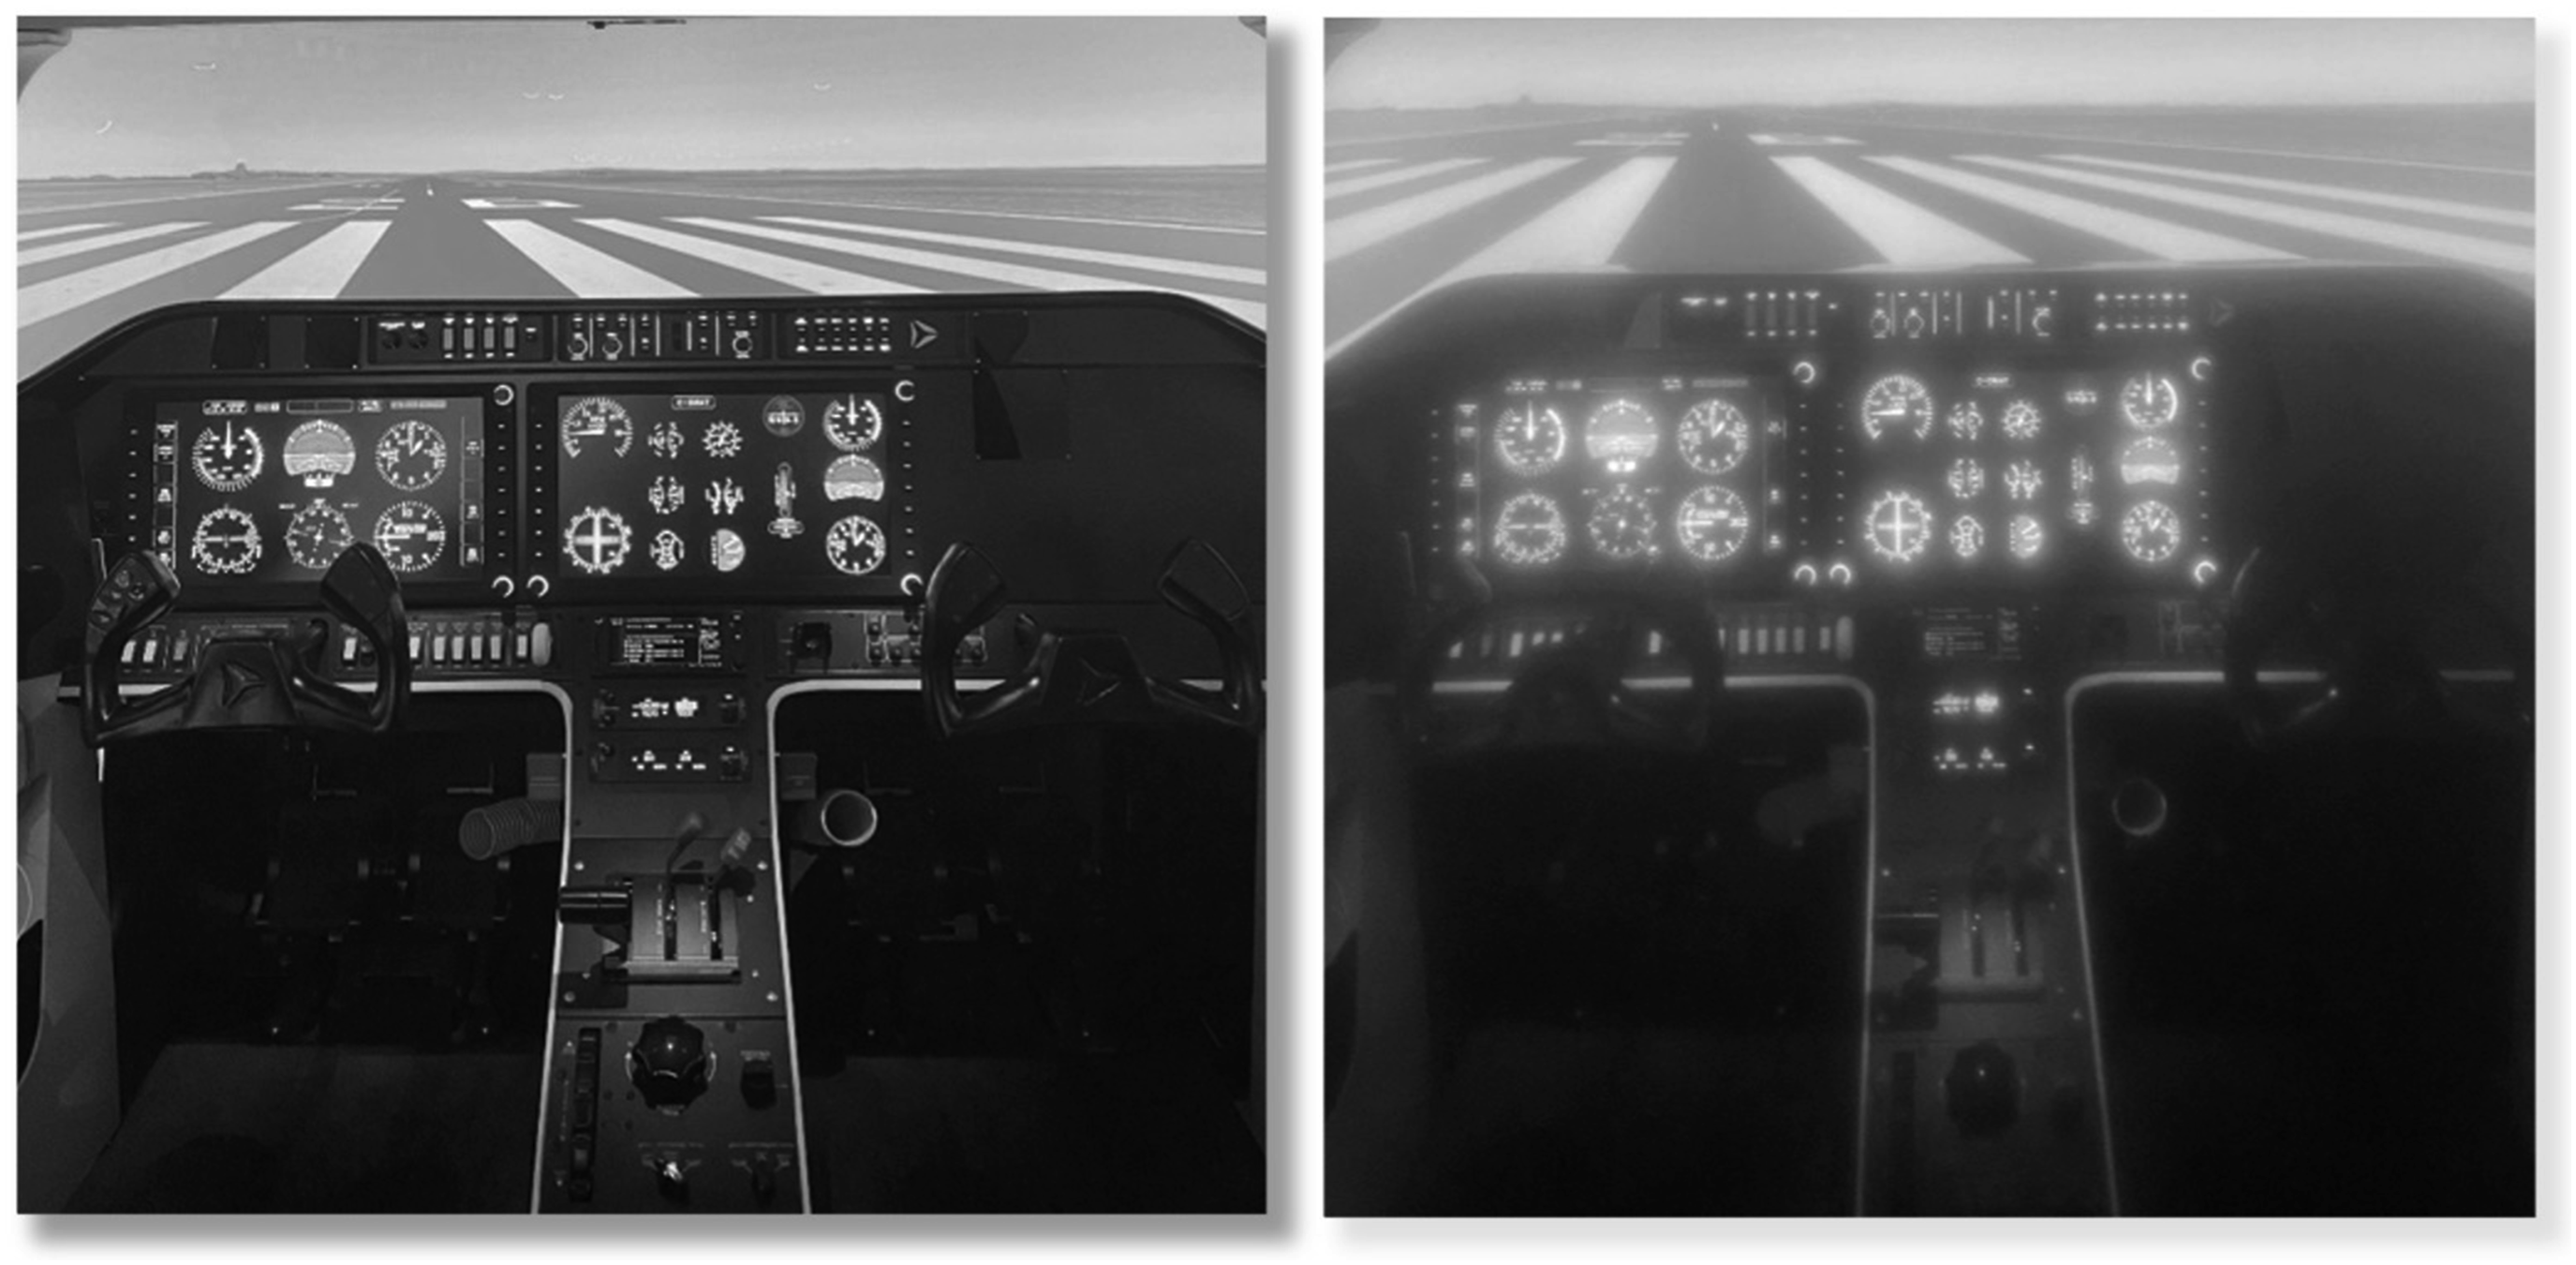
Experiment 1
Participants
Ten individuals (9 males, 1 female) participated in this study ranging in age from 18 to 25 years. Participants were recruited from the student or alumni population at the University of Waterloo. All participants were either current aviation students or had previously graduated from the aviation undergraduate program at the University of Waterloo. To be included participants had to have flight hours ranging from 0 to 300 flight hours and have normal or corrected-to-normal vision. While we did include participants that had 0 flight hours all participants had at minimum begun their pilot training programs therefore were still classified as pilots for the purpose of this study. Participants were excluded if they had been previously diagnosed with any visual or neurological disorders.
Task
All simulated flights took place on a calm (no wind), clear day and participants were tasked with performing simulated landings using visual flight rules (VFR) at the Waterloo Regional International Airport (YKF) on Runway 26 with no other aircraft traffic. Participants performed a simulated approach and landing under 6 randomized visual degradation conditions 6/6, 6/12, 6/18, 6/30, 6/60, and no vision. Participants’ vision was degraded to a specific distance static visual acuity level while the levels of their other visual capabilities varied as distance static visual acuity is what is currently used during the pilot medical examination. Between each trial, participants answered a 10-point Likert-like Scale questionnaire asking how difficult they found each trial; how stressful they found each trial; followed by the opportunity to describe the point at which they perceived a reduction in flight performance. Each trial stopped when participants completed the flight either by successfully landing or by losing control of the aircraft (i.e., crash). There was one trial per visual condition, this within-subject design offers a variety of benefits including more power to detect differences. Flight performance measures were collected from the simulator and performance measures were analyzed by examining the variability of airspeed, vertical speed, pitch, and roll in which variability is the standard deviation. The slope of the line-of-best fit was used to evaluate the rate of altitude descent. Additionally, landing accuracy was analyzed by comparing the point of touchdown to the 500 ft markers on the runway and the landing hardness measure was the vertical speed at time of touchdown. Data were analyzed in JASP (JASP Team, 2025) using the Friedman Test and post hoc pairwise comparisons were conducted using the Conover’s Post Hoc Test. To control for the increased risk of Type I error due to multiple comparisons, a Bonferroni adjustment was applied to the significance threshold. Data from the stress and difficulty questionnaires were analyzed by conducting two one-way ANOVAs comparing both difficulty and stress with vision independently.
Results
Pilot participants in experiment 1 had a median of 162 flight hours with a range of 5–256 flight hours. Flight performance data did not meet the assumption of normality; therefore, a nonparametric statistic approach was employed. Results from the Friedman test showed a significant difference in the variability of vertical speed, pitch (n = 8), and roll (n = 8) between visual conditions (χ2 (5) = 24.026, p = <0.001, W = .481; χ2 (5) = 24.429, p = <0.001, W = 0.611; χ2 (5) = 27.000, p = <0.001, ηp
2
= .781). Due to a technical difficulty, performance measures were not fully recorded for two participants, resulting in a participant size of 8 for the analysis of roll. Conover’s Post Hoc Test with a Bonferroni adjustment found that both the variability of vertical speed, pitch, and roll was significantly higher when the task was performed with no vision compared to all other conditions, which were not significantly different from each other. This is predictable as all participants lost control of the aircraft during the no vision trials. The variability of airspeed as well as the slope of altitude descent were not significantly different across visual conditions. Figure 2 depicts the average of all analyzed flight performance measures during landing. Vertical speed variability (N = 10) (a), airspeed variability (N = 10) (b), roll variability (N = 8) (c), pitch variability (N = 8) (d), and slope of altitude descent (N = 10) (e) as a function of visual acuity for novice pilots (N = 10) that completed a simulated approach and landing. Error bars represent standard error of the mean.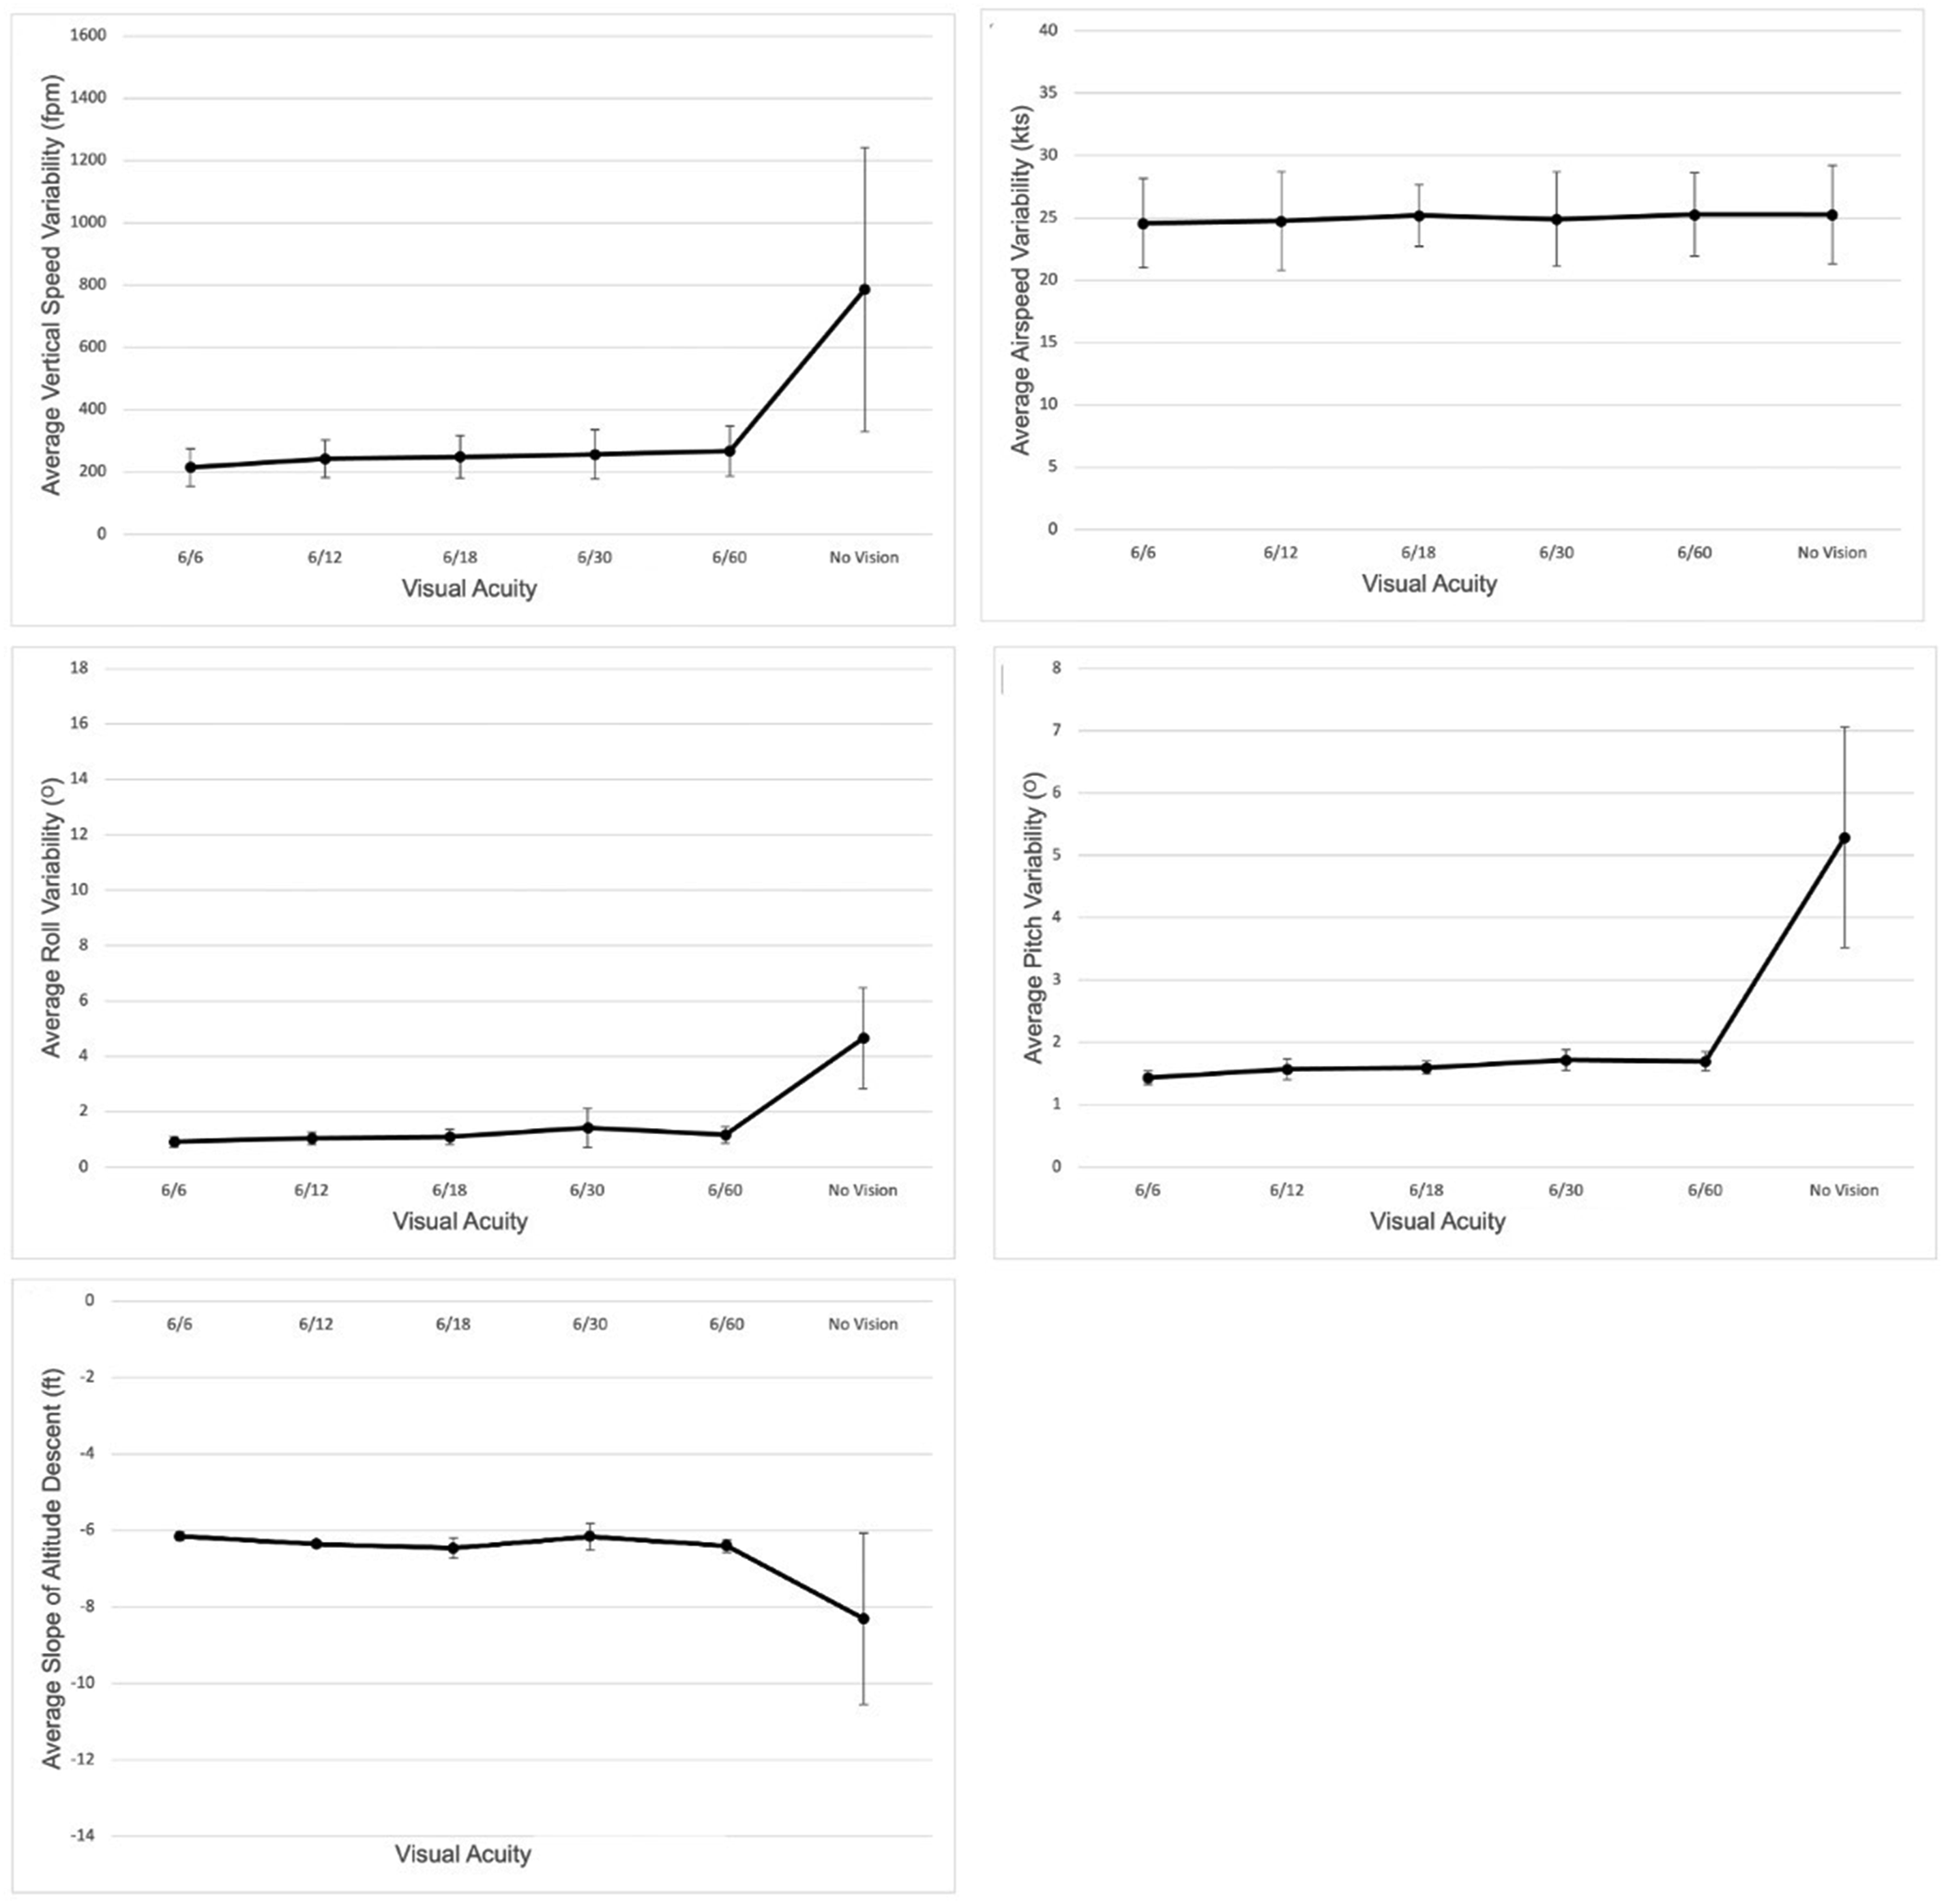
Landing hardness and landing accuracy data were analyzed using the Friedman test followed by Conover’s post hoc test with a Bonferroni correction. Analysis of landing hardness showed a significant difference between the average vertical speed at point of landing between trials with no vision in comparison to all other vision degradation trials. Analysis of landing accuracy showed a significant difference in the average total distance from the 500 ft markers on the runway between trials with no vision in comparison to all other vision degradation trials. A loss of control of the aircraft (crash) in the ALSIM simulator results in the engine shutting off upon contact with the ground. As all participants lost control of the aircraft on the trial with no vision condition, the landing hardness and landing accuracy were still included in the analysis. Figure 3 depicts the average landing hardness and average landing accuracy for simulated approach and landing flights. Average landing hardness for participants who completed a simulated approach and landing flight with different levels of visual acuity degradation including trials with no vision (a). Excluding trials with no vision (b). Average landing accuracy for participants who completed a simulated approach and landing flight with different levels of visual acuity degradation including trials with no vision (c). Excluding trials with no vision (d). Error bars represent standard deviation.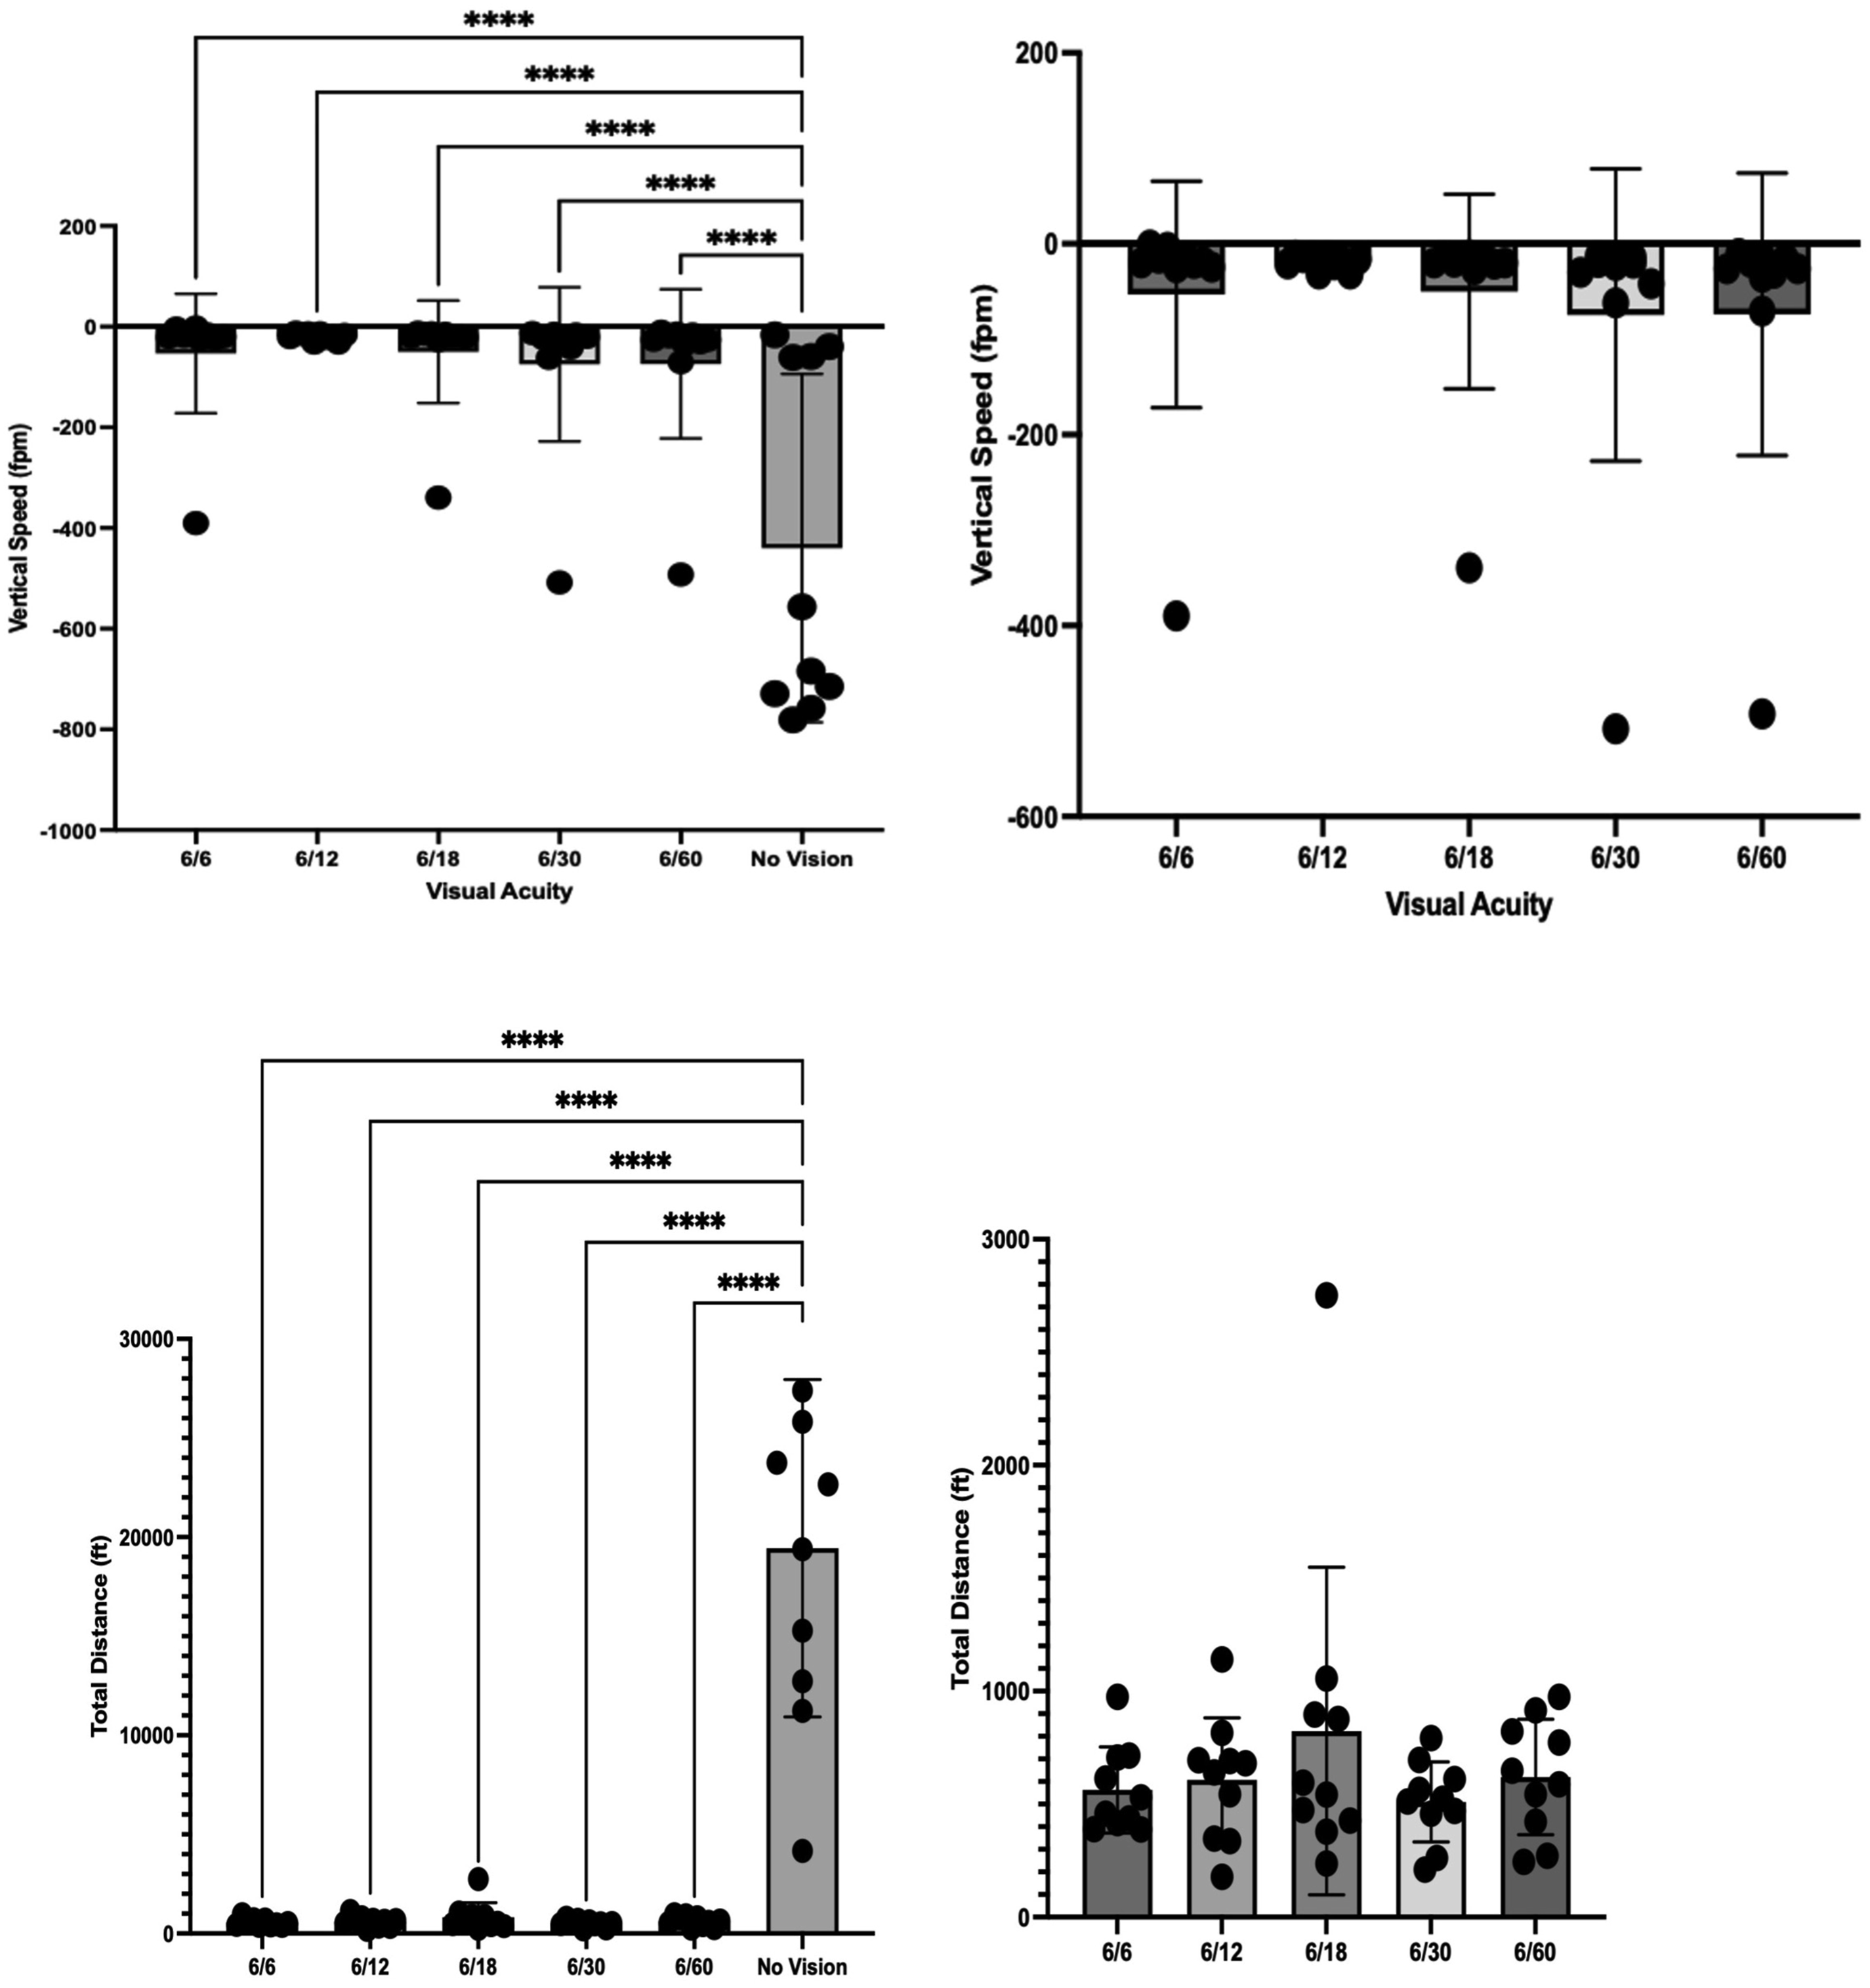
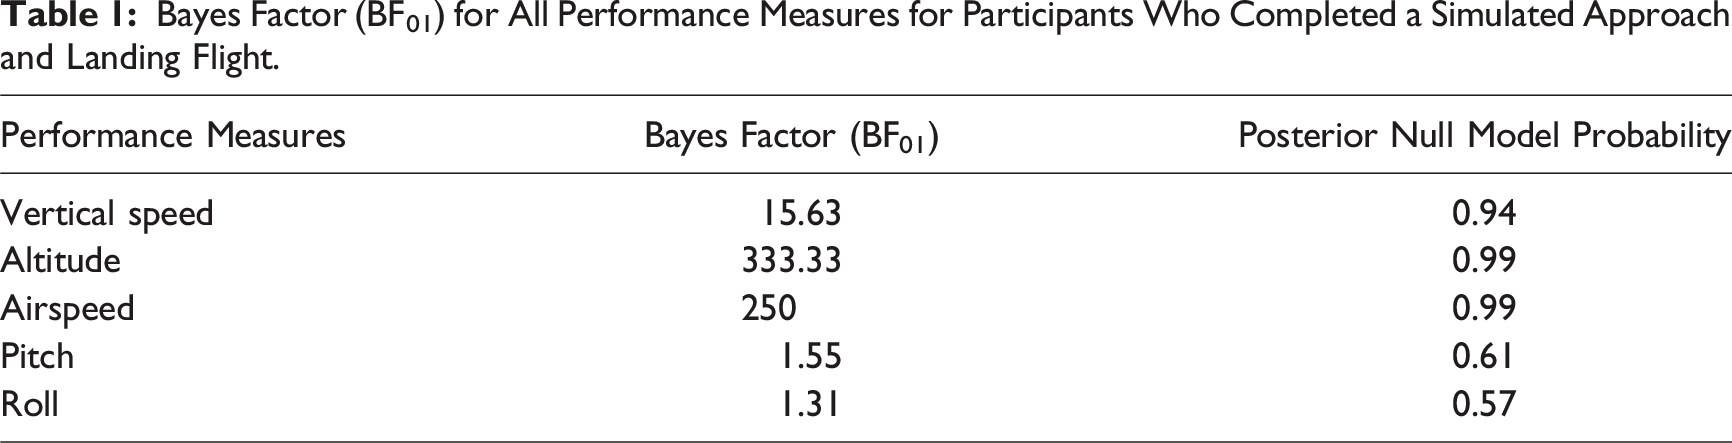
Bayes Factor (BF01) for All Performance Measures for Participants Who Completed a Simulated Approach and Landing Flight.
Perceived stress and difficulty data met the assumptions of normality and homogeneity of variance. Repeated measures ANOVAs indicated significant effects of distance static visual acuity on reported stress and reported difficulty levels (F (5,45) = 28.08, p < 0.0001, ηp
2
= . 757, F (5,45) = 35.27, p < 0.0001, ηp
2
= .797, respectively). Perceived stress and difficulty increased as vision was degraded. Tukey HSD post hoc analysis was conducted to determine which visual acuities were associated with a significant difference in participants’ responses. Perceived stress and difficulty became statistically significant from best corrected (6/6) at a distance static visual acuity of 6/12. Figure 4 includes results from 10 participants who completed a simulated final approach to landing. Reported difficulty and stress at different levels of visual acuity for experiment 1. Participants (N = 10) completed a simulated approach and landing flight. The dark bars represent the average reported stress. The grey bars represent the average reported difficulty. Error bars represent standard deviation.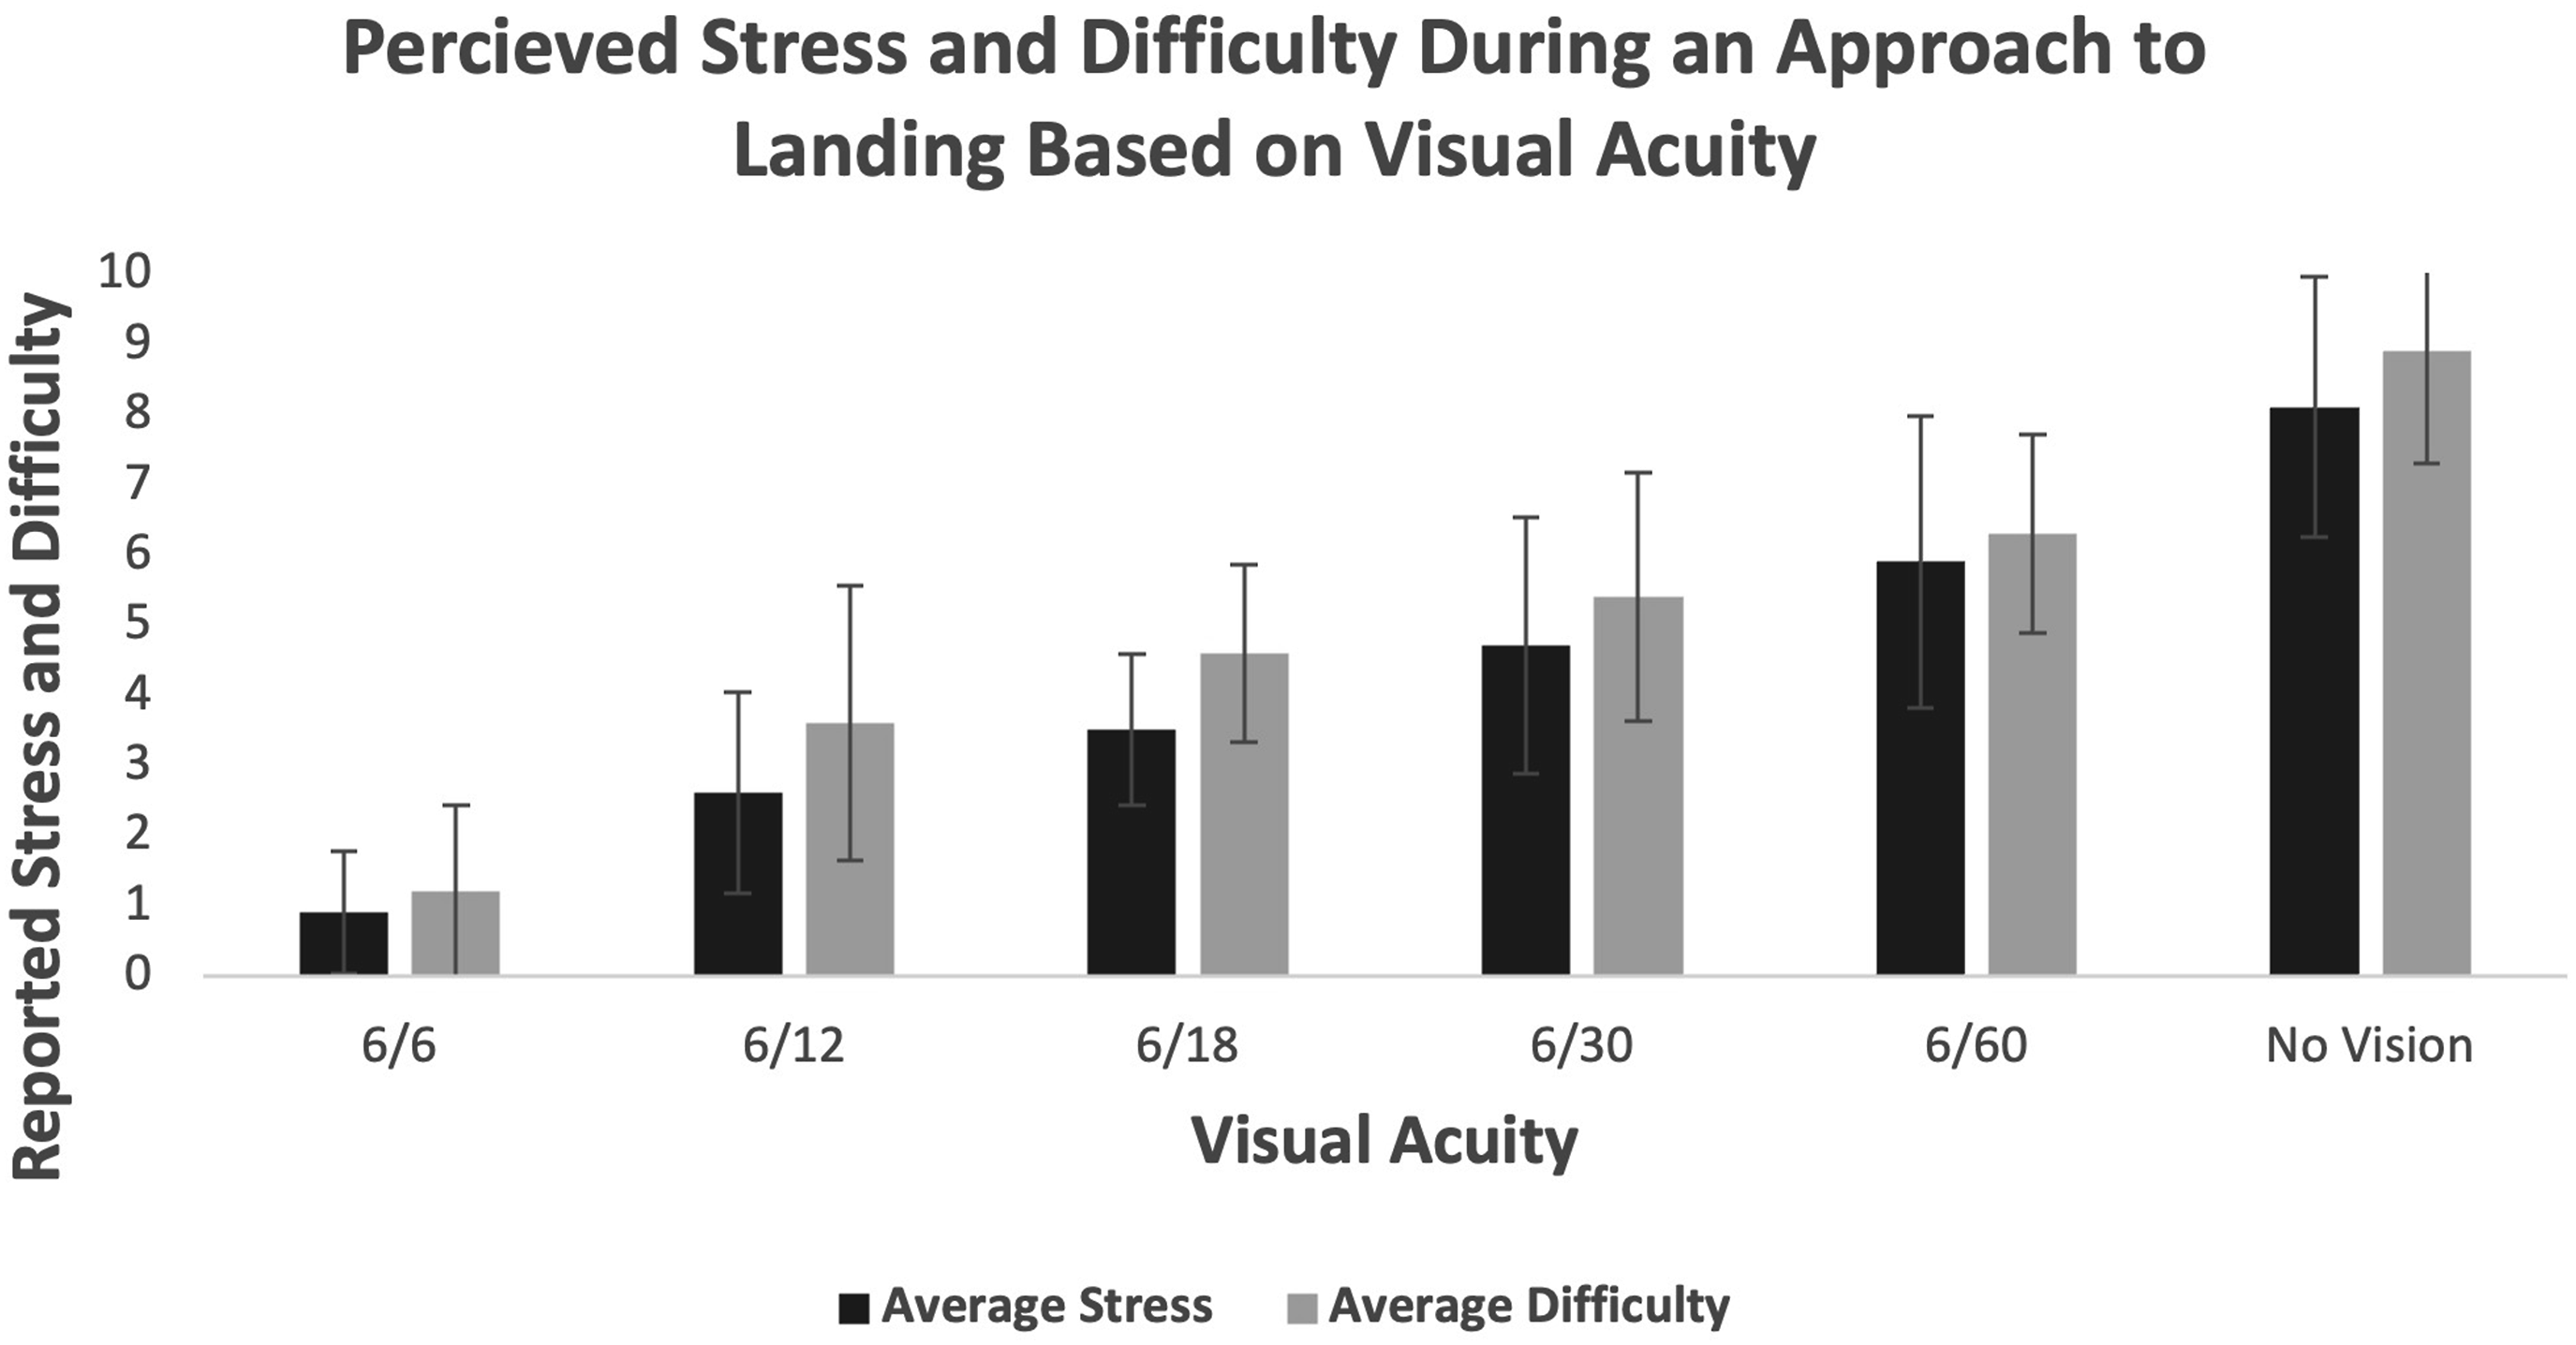
Experiment 2
Participants
Ten individuals (8 males, 2 female) participated in this study ranging in age from 18–25 years. Inclusion and exclusion criteria were similar to Exp 1. Pilot participants had median of 142 flight hours with a range of 0–300 flight hours.
Task
Participants performed a simulated downwind-base to final and landing with 8 randomized visual degradation conditions 6/6, 6/9, 6/12, 6/18, 6/30, 6/48, 6/60, and no vision. Two additional trials were added to experiment 2 (6/9 and 6/48) that were not included in experiment 1 as it was hypothesized that during a more complex aviation task (short flight circuit) there may be a different point in which vision begins to affect performance. A short flight circuit is more complex than an isolated approach to landing task as the participants are required to complete two turns and align themselves with the runway prior to landing whereas in the isolated approach to landing they started aligned with the runway. The process of aligning the aircraft with the runway is a highly visual task; therefore, we hypothesized that we would see an effect to flight performance at a lower static distance visual acuity level than in experiment 1. The additional visual degradation levels were chosen as 6/9 which represents the current distance visual acuity minimum for a CPL, and 6/48 gives finer granularity at the poorer visual acuity levels which is where decrease in performance would be expected based on the nonsignificant results of experiment 1. All performance measures evaluated were for the final approach and landing phase of flight.
Results
As with experiment 1, all participants lost control of the aircraft on the trial with no vision. Flight performance data did not meet the assumption of normality; therefore, a nonparametric statistic approach was employed. The Friedman Test indicated a significant difference in the variability of vertical speed, roll, and pitch between visual conditions (χ2 (7) = 18.800, p = 0.009, W = .269; χ2 (7) = 15.700, p = 0.028, W = .224; χ2 (7) = 25.667, p = <0.001, W = .367). Conover’s post hoc analysis with a Bonferroni adjustment made to the significance threshold found that vertical speed variability was significantly higher when the task was completed with no vision in comparison to 6/6, 6/12, and 6/30. Roll variability was significantly higher when the task was completed with no vision when compared to trials with 6/30 vision degradation. Pitch variability was significantly higher when the task was performed with no vision compared to all other conditions, which were not significantly different from each other. No significant differences were found in slope of altitude descent or variability of airspeed. Figure 5 depicts the average of all performance measures during the downwind-base-final and landing flight. Vertical speed variability (a), airspeed variability (b), roll variability (c), pitch variability (d), and slope of altitude descent (e) as a function of visual acuity for novice pilots ( N = 10). Error bars represent standard error of the mean.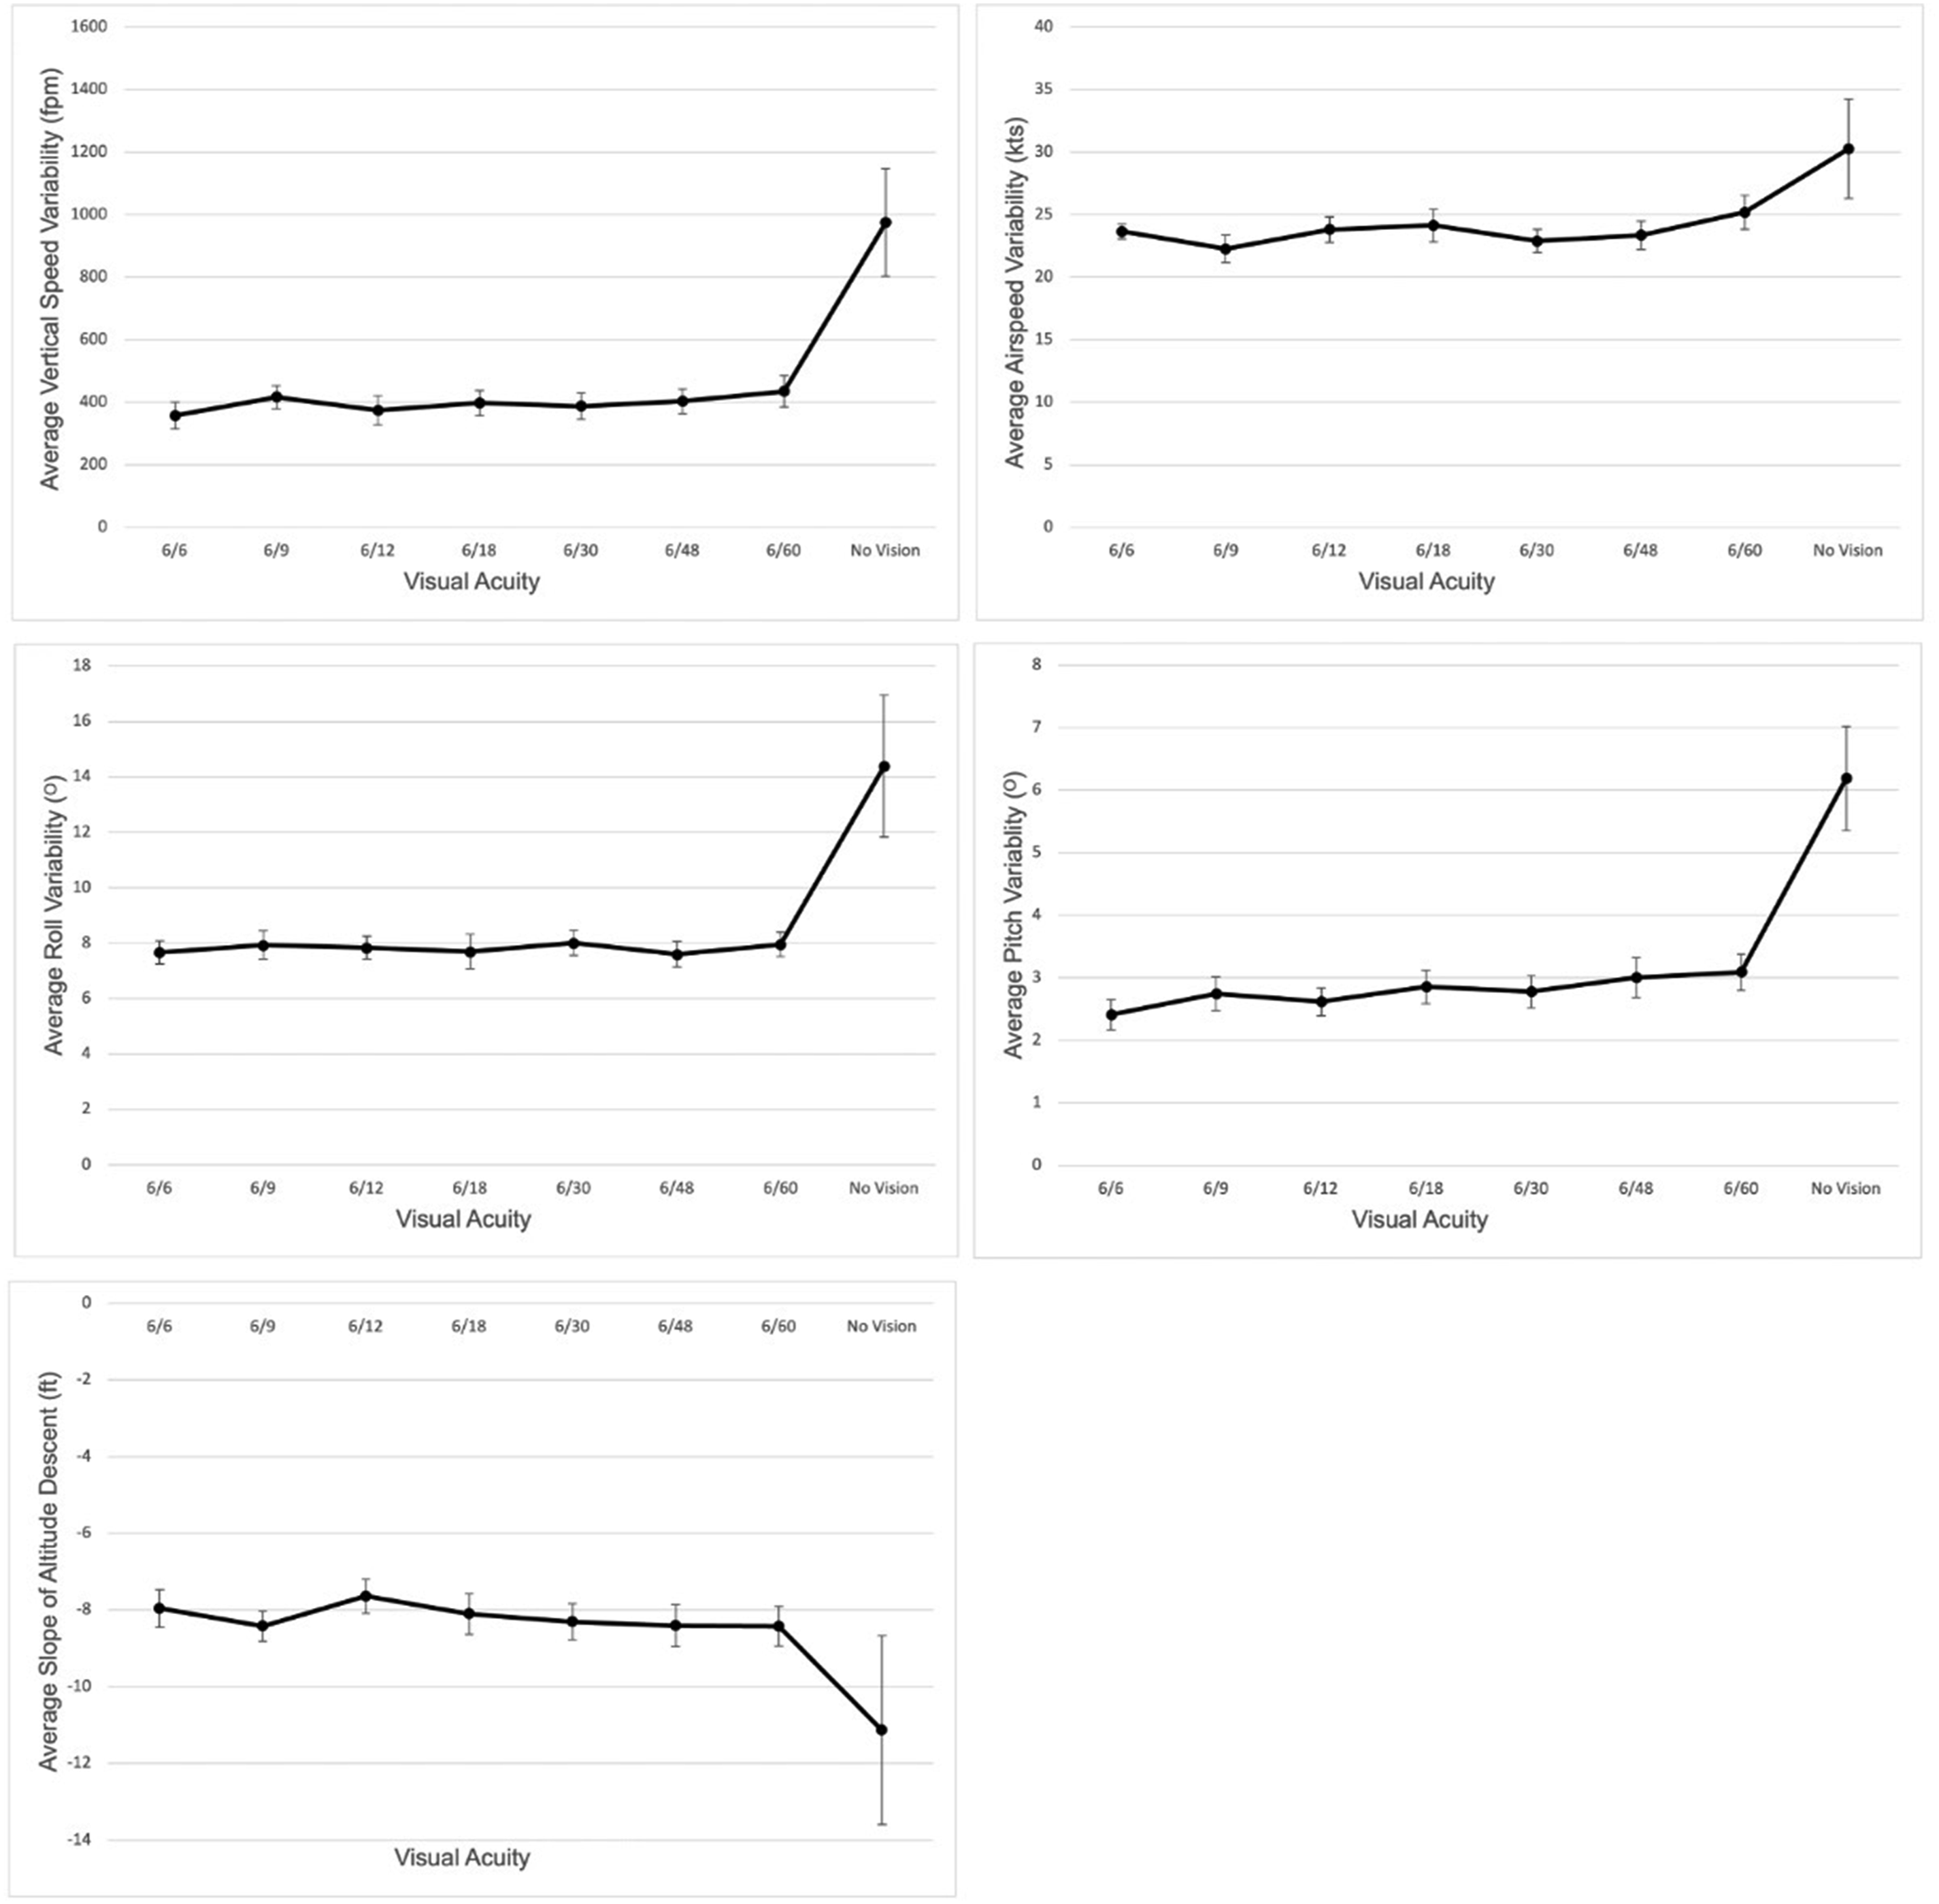
The landing hardness and landing accuracy of the trials where participants lost control of the aircraft were still included in the analysis, despite them being considered “a crash.” The Friedman test followed by Conover’s post hoc test with a Bonferroni correction of landing hardness showed a significant difference between the average vertical speed at a point of landing between trials with no vision in comparison to all other vision degradation trials. The Friedman test followed by Conover’s post hoc test with a Bonferroni correction of landing accuracy showed a significant difference for the average total distance from the 500 ft markers on the runway between trials with no vision in comparison to all other vision degradation trials. Figure 6 depicts the average landing hardness and the average landing hardness for simulated flight circuit and landing flight. Average landing hardness for participants who completed a simulated flight circuit and landing flight with different levels of visual acuity degradation including trials with no vision (a). Excluding trials with no vision (b). Average landing accuracy for participants who completed a simulated flight circuit and landing with different levels of visual acuity degradation including trials with no vision (c). Excluding trials with no vision (d). Error bars represent standard deviation.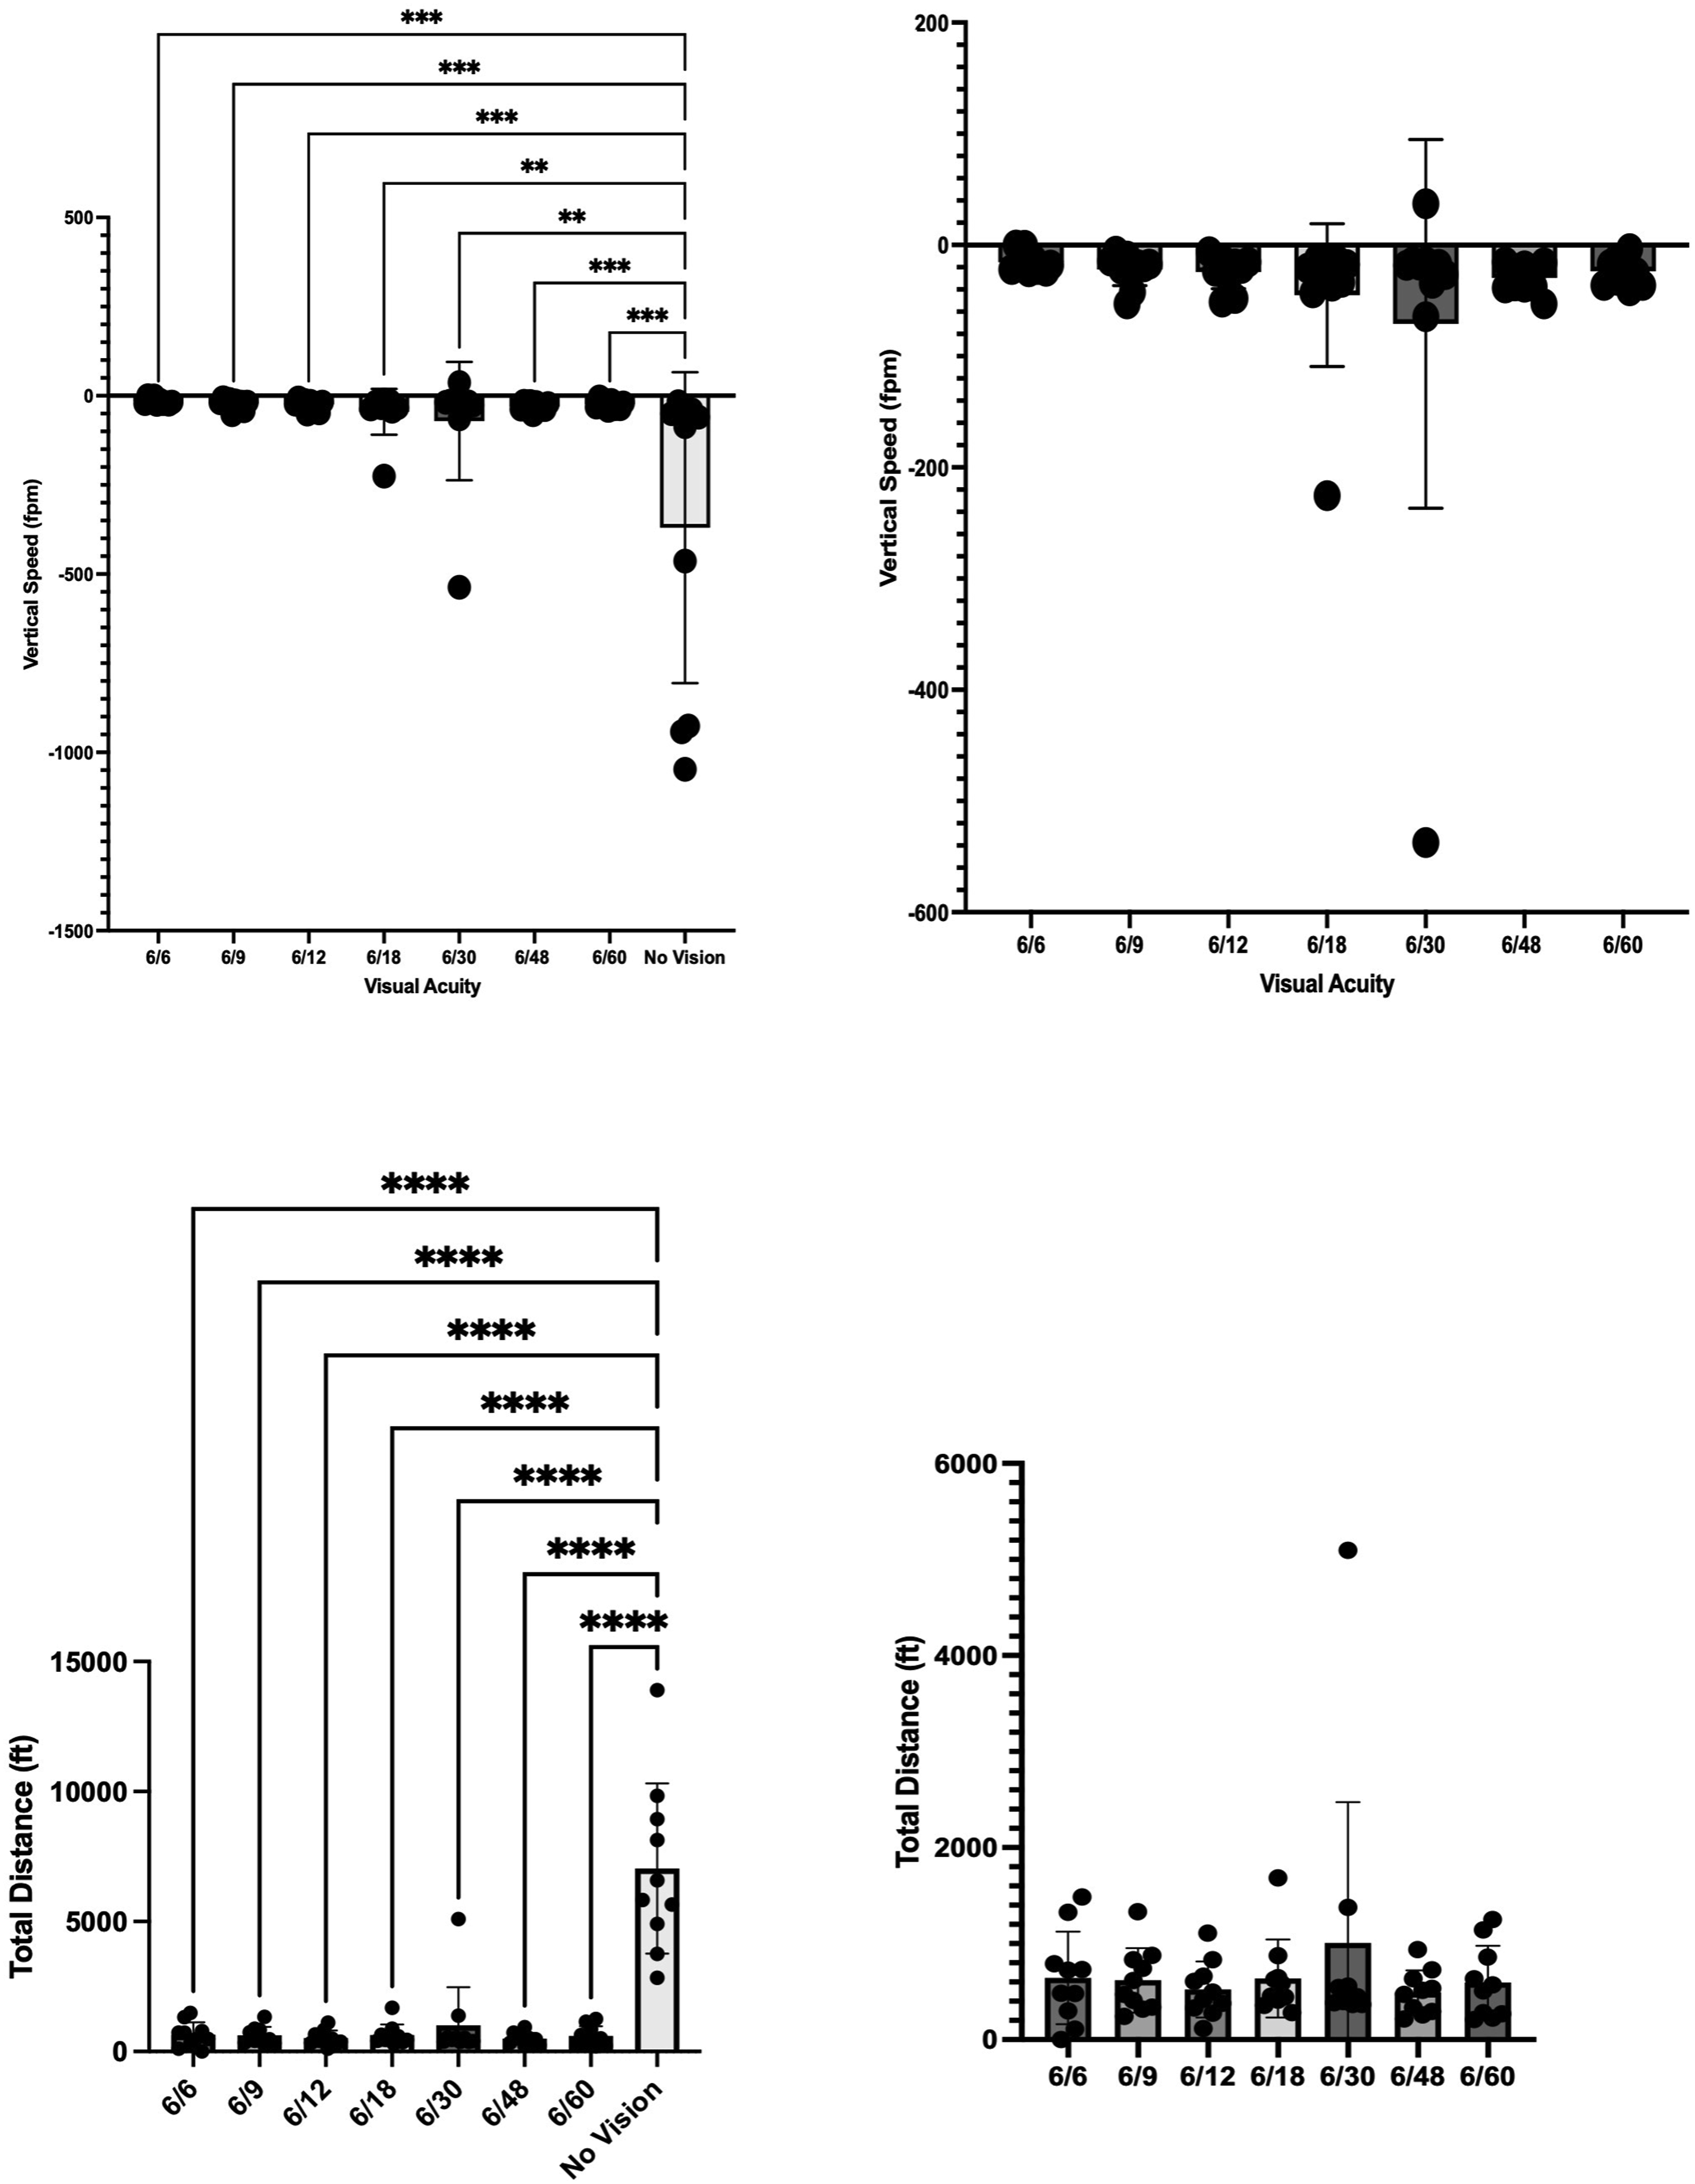
Bayes Factor (BF01) for All Performance Measures for Participants Who Completed a Simulated Flight Circuit and Landing.
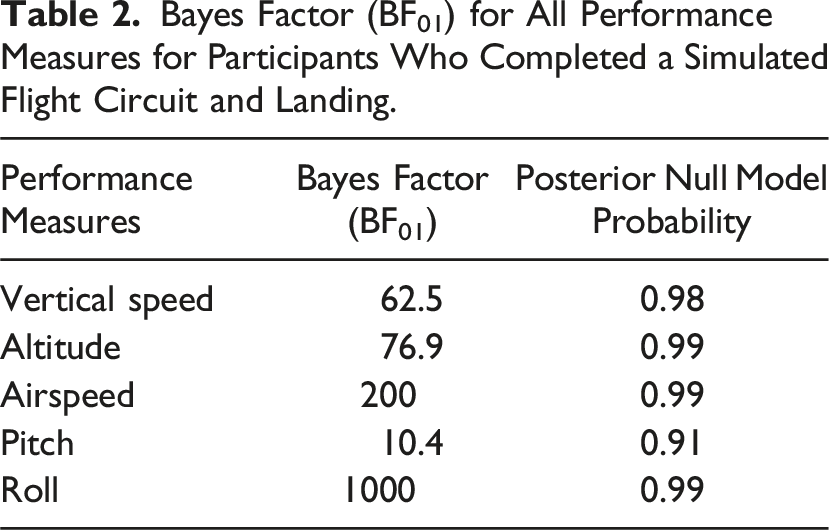
Figure 7 includes results from 10 participants who performed a simulated downwind to final approach and landing flight. Perceived stress and difficulty data met the assumptions of normality and homogeneity of variance. Repeated measures one-way ANOVA determined that there was a significant effect of distance static visual acuity on reported stress and difficulty levels ((F (7,63) = 25.94, p < 0.0001, ηp
2
= .742) (F (7,63) = 26.19, p < 0.0001, ηp
2
= .744), respectively). Similar to the approach to landing data, both perceived stress and perceived difficulty increased as vision decreased. Tukey’s HSD post hoc analysis was conducted to determine the distance static visual acuity level at which the ratings of stress and difficulty became significantly different from best corrected vision. This analysis indicates that differences in stress and difficulty became significant at distance static visual acuity of 6/30 and 6/48, respectively. Reported difficulty and stress at different levels of visual acuity for participants that completed a simulated downwind-base-final and landing flight. The black bars represent the average reported stress. The grey bars represent the average reported difficulty. Error bars represent standard deviation.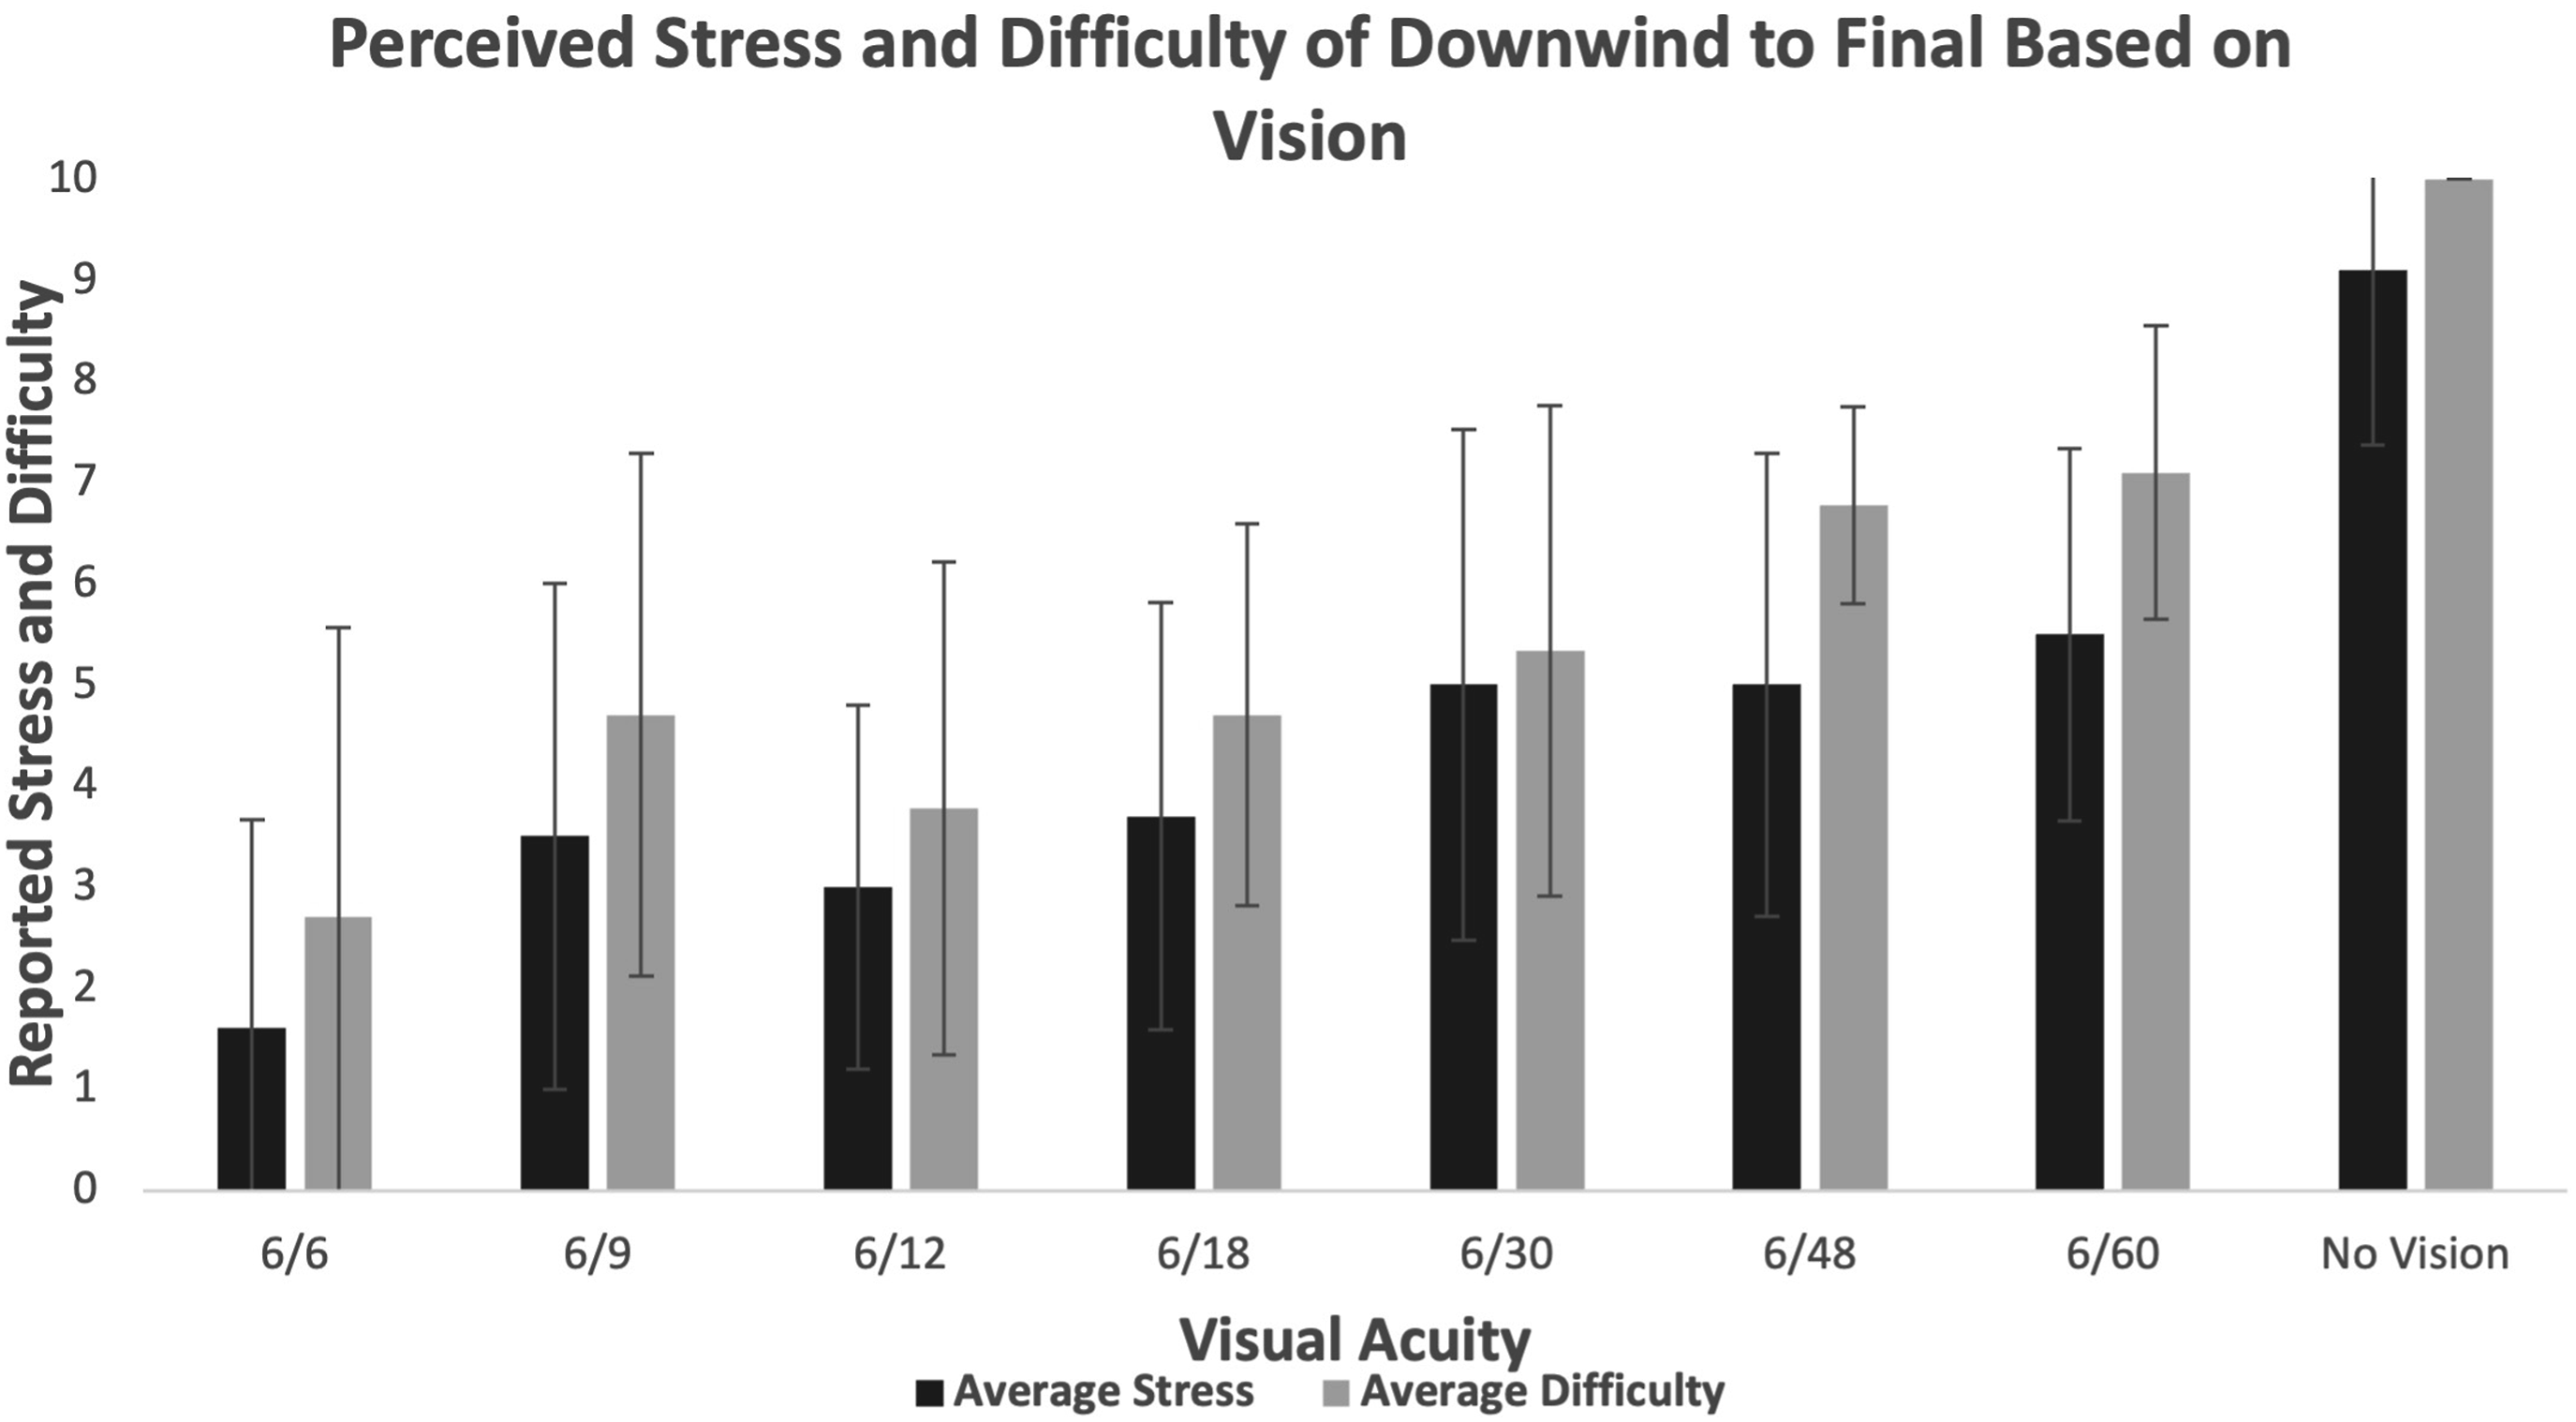
With the use of scattering lenses, distance static visual acuity, contrast sensitivity, and stereoacuity are all affected. There was a high positive correlation between stereoacuity and distance static visual acuity (r = 0.75). Figure 8 depicts the relationship between participant contrast sensitivity and the variability of vertical speed, airspeed, pitch, roll and slope of altitude descent for 20 pilot participants during just their final approach and landing portion of flight where each point represents a single participants contrast sensitivity for each outcome measure. Participant data from both experiments are included in this set as participants did not have to reach a specified contrast sensitivity level for each level of degradation, but rather it varied between participants, whereas their visual acuity had to be degraded to a specific acuity level. This figure demonstrates the overall lack of impact of contrast sensitivity on various flight performance variables. 8Vertical speed variability (a), airspeed variability (b), pitch variability (c), roll variability (d), and slope of altitude descent (e) as a function of contrast sensitivity for 10 novice pilots who completed a simulated approach and landing.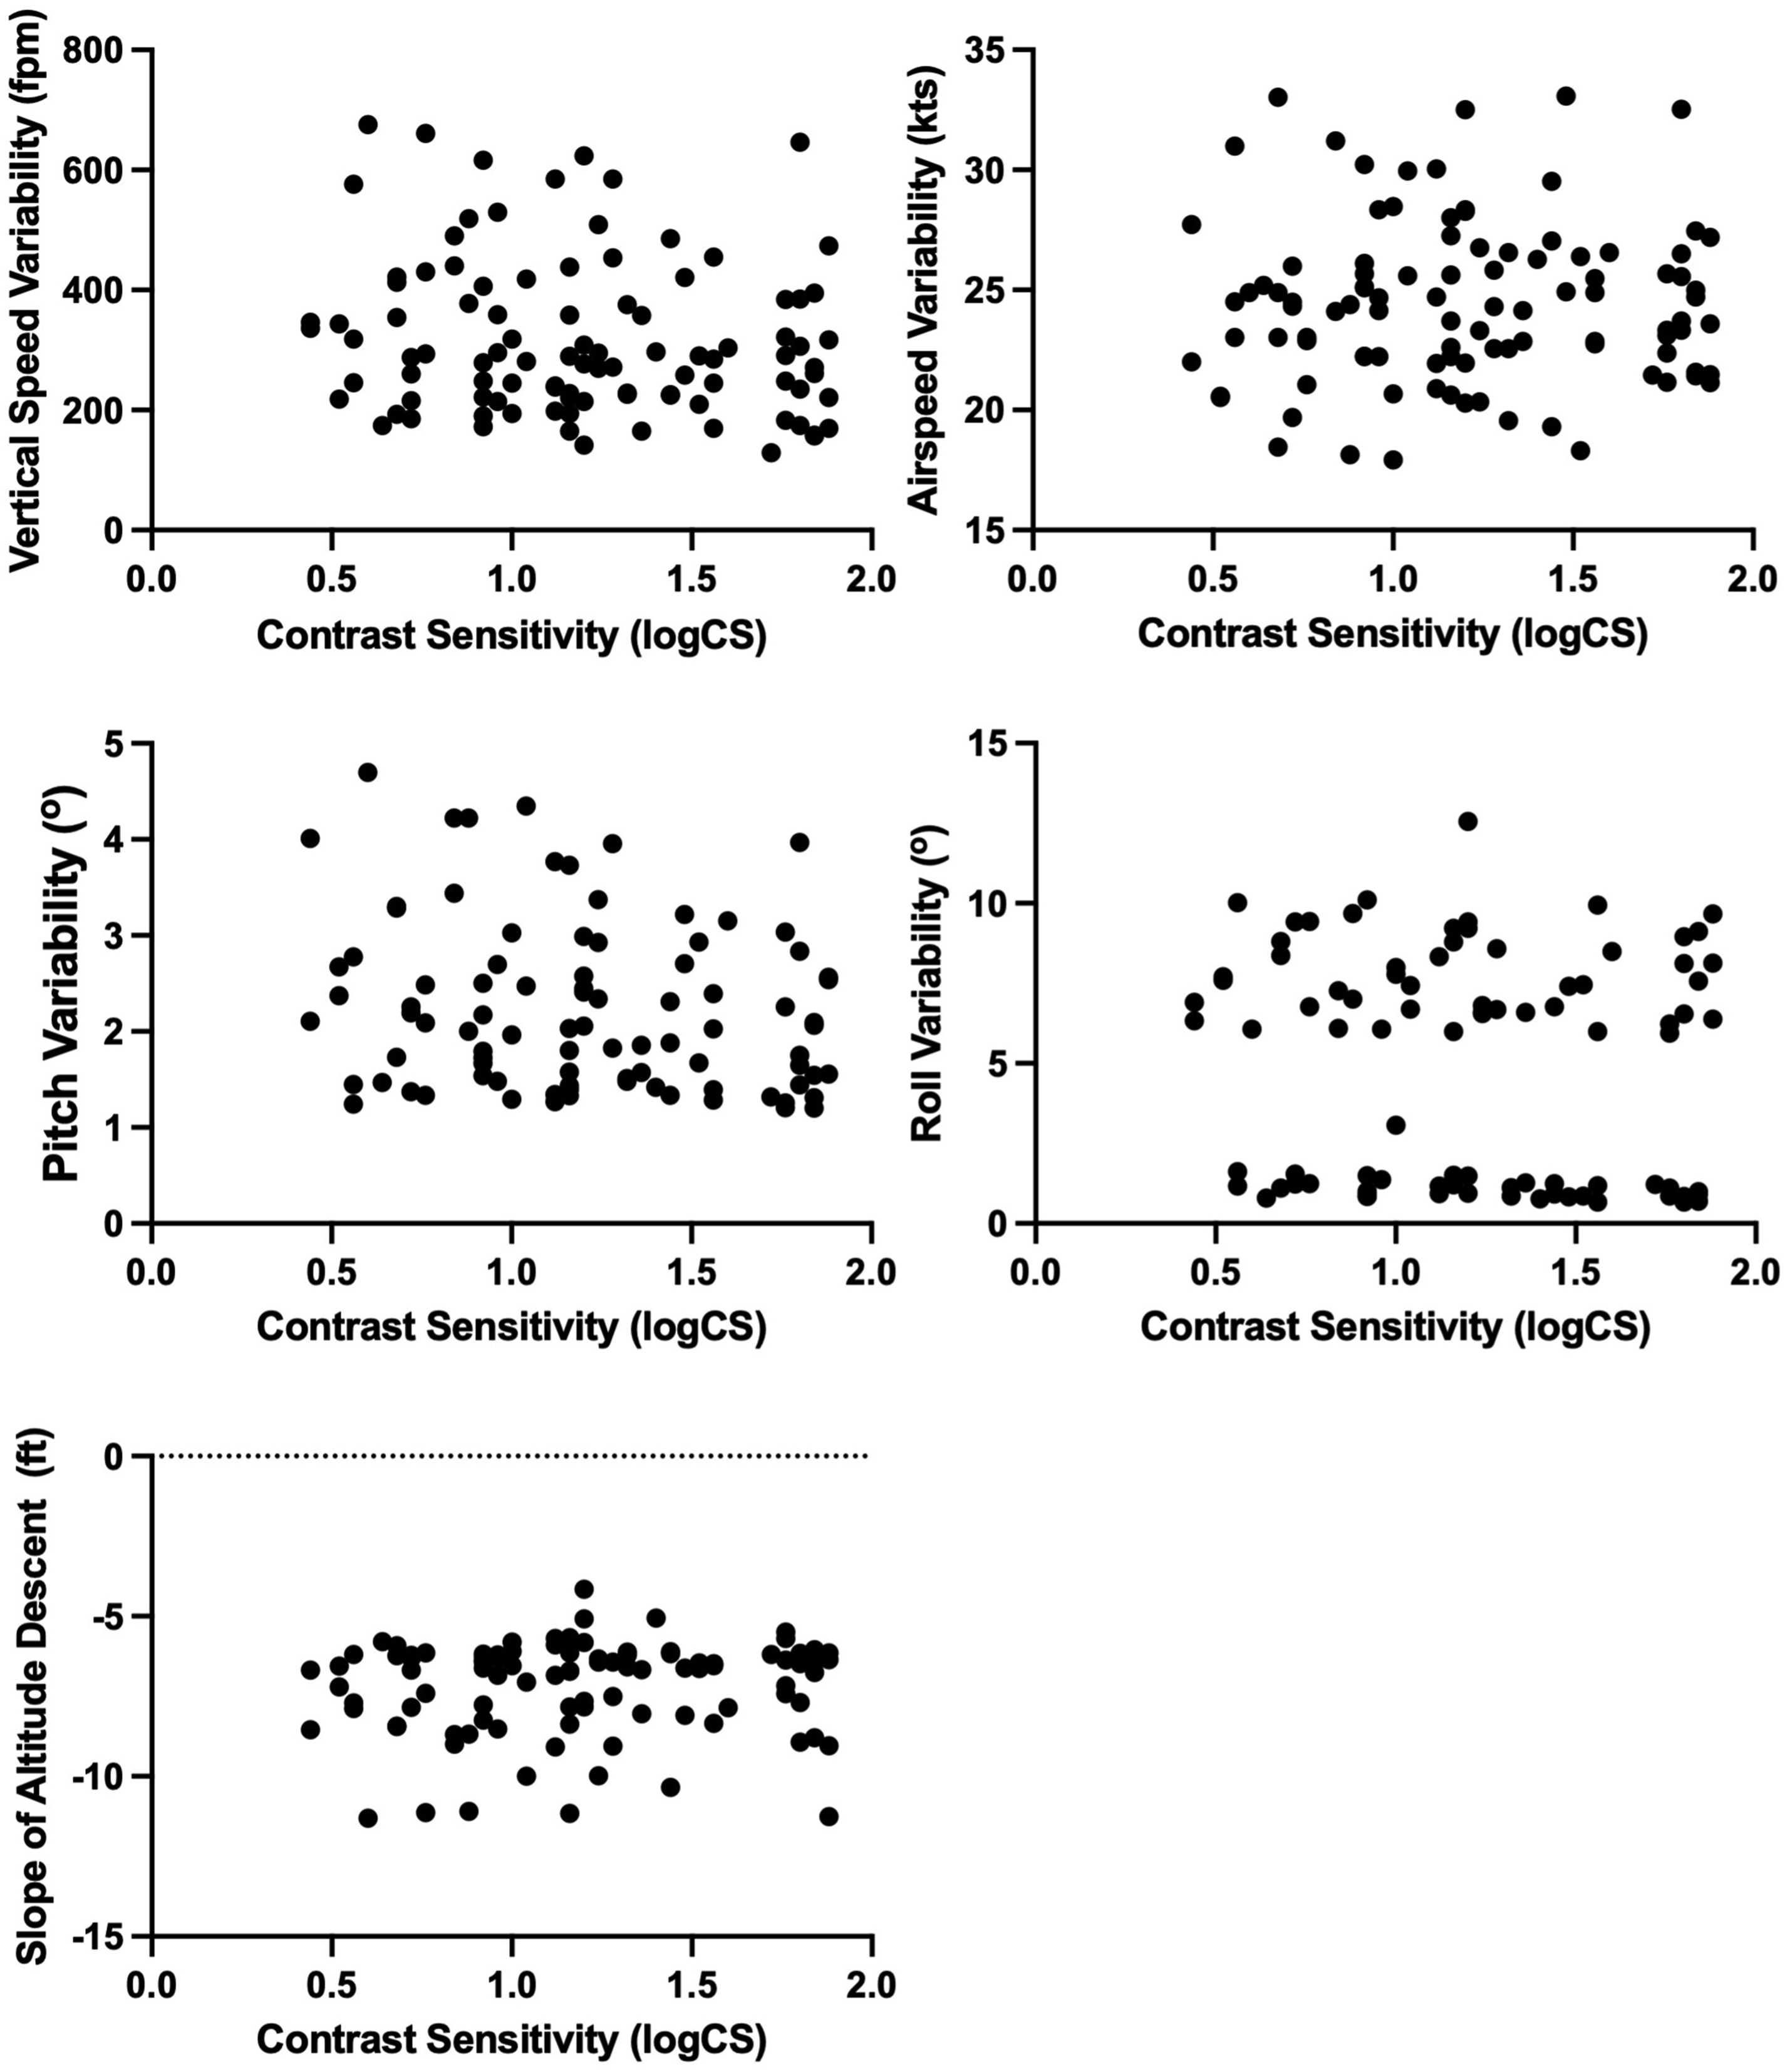
Discussion
This study shows that novice pilots, on a clear, calm day, can maintain simulated flight performance in landing tasks with significantly reduced static visual acuity (6/60 at 6M). When vision was removed entirely all pilots lost control of the aircraft (crashed). It was expected that if vision was degraded beyond the levels used in this study performance deficits would occur, but it is unknown what that level would be. Some of the analyzed variables were more affected by loss of vision than others. For example, we found that in the simulated flight circuit, the variability of vertical speed, roll, and pitch had a significant effect for all levels of static visual acuity when compared to no vision condition, whereas airspeed and slope of altitude descent did not.
The simulation in this study took place in clear, calm weather conditions based on the assumption that if pilots were unable to safely operate the aircraft on a clear, calm day at these levels of visual degradation, they would also be unsafe in poor weather conditions and there would be no need to test these. Given the outcome of the study the next steps will be to test the effects of visual degradation (including more severe degradation beyond 6/60 as well as different types of degradation such as loss of visual field) on flight performance in other weather conditions and emergency response situations. Additionally, the tasks assessed were a final approach and landing. Therefore, the results are only applicable to these tasks, not to all flight tasks. Other flight tasks will need to be tested. The final approach and landing flight task was chosen as in a Boeing study (2021) they determined that over half of all fatal accidents occur during the final approach and landing phases, making this a high-risk task that presumably is demanding to perform. It is important to note that the participants in experiment 2 had to adequately complete the beginning of the circuit and line up with the runway in order to complete the approach and landing portion of the flight. This research raises the question, if flight performance during this task is not affected with vision degraded as poor as 6/60 (20/200), are the current visual standards of 6/9 corrected or uncorrected monocularly and 6/6 binocularly for a commercial airline pilot, and 6/12 corrected or uncorrected monocularly, but no worse than 6/60 uncorrected monocularly for a private pilot license (Transport Canada, 2019) appropriate or are they unnecessarily discriminatory? This is not to say that the vision requirements can be reduced to 6/60, but it does suggest that they should be re-examined. Data are limited for civil aviation, but studies published on military recruits show that for over half of those deemed medically unfit to fly, the reason is eye/vision related (Groner et al., 2022). An earlier study found that 70% of American commercial aviation applicants who failed medical examinations were disqualified for vision-related reasons, and 50% of rejections from the air branch of the American military were for vision-related reasons (Ballantyne, 1940). A vision standard for pilots that is based on evidence, and which allows for a relaxation of visual requirements where such reduction does not compromise safety performance, could increase the number of pilots entering and staying in the workforce.
Additionally, the results show that as visual degradation increased, perceived stress, and perceived task difficulty increased. The level at which reported stress or difficulty become significant appears to be task dependent. In the approach to landing simulation, a milder visual degradation resulted in significant reports of stress and difficulty compared to during the circuit task where a more severe degradation was imposed before significant stress or difficulty were reported. The reason for this discrepancy is unknown but could be due to the higher variability in the responses in exp 2. We did not ask the participants what levels of stress they would deem acceptable. Further work in this regard is required.
Regardless, both perceived stress and perceived task difficulty require noticeably decreased vision before they become significant (6/12 in experiment 1, 6/30 and 6/48 respectively in experiment 2). This prompts us to consider that novice pilots can tolerate moderate decreases in vision without affecting perceived stress levels or perceived task difficulty in a simulation environment. The levels of degradation causing stress or difficulty found in experiment 2 are worse than the current vision requirements for pilots (6/9 corrected or uncorrected monocularly for a commercial airline pilot, 6/12 corrected or uncorrected monocularly, but no worse than 6/60 uncorrected monocularly for a private pilot license).
In this study, a single numerical ranking system was used to assess the perceived stress and difficulty of each trial. The main benefit of this is its simplicity and the efficiency with which it can be conducted. However, the relation between increased workload due to decreased vision and perceived stress is unknown. It is generally accepted that mental workload is a more multidimensional construct (Lee & Liu, 2003). In future work it is recommended that investigators consider a more multidimensional tool such as the modified Cooper-Harper, National Aeronautics and Space Administration Task Load Index (NASA TLX), the Overall Workload (OW) scales, or the Subjective Workload Assessment Technique (SWAT). These tools may be more effective in assessing how static visual acuity affects subjective workload in pilots.
This research highlights the necessity to provide more evidence as to what visual medical requirements should be. This paper builds on the previous work done by Mann and Hovis (1996) who looked at the effects of near vision degradation on simulated flight performance. There are several limitations of this study that must be acknowledged. First, the small sample size reduces statistical power and the generalizability of the results. Larger studies would provide greater confidence in the robustness of these findings and might reveal additional nuances in performance under varying visual conditions. That being said, the Bayesian analysis gives considerable support for the null hypothesis and any effects at the levels of visual acuity tested would be small requiring very large numbers of participants to elucidate. Second, the range of vision tested was limited to specific degradations, which may not capture the broader spectrum of visual impairments encountered in real-world scenarios. Expanding the range of visual acuities until flight performance was degraded would give a cut-off point, not determined by the current study. However, it is hard to imagine regulators setting standards at the values found in the study let alone values worse than these. Visual acuity is not the only measure of visual function and other aspects of vision (such as visual fields) still need to be investigated. Third, the weather conditions simulated in this study were limited. For example, adverse weather scenarios, varying levels of light, and differing the runway conditions were not included. These factors are important in understanding how degraded vision interacts with situational demands in real-world settings. Fourth, the study focused exclusively on the landing task. While landing is a visually intensive and critical phase of flight, it represents only one component of piloting duties. Investigating how vision degradation affects other tasks, such as navigation, instrument reading, or emergency procedures, would provide a more comprehensive picture. Fifth, the participants in this study were novice pilots, who may rely more heavily on visual cues than experienced aviators. The result may not be generalizable to more seasoned pilots, who may develop strategies to mitigate the effects of reduced vision. Lastly, there are numerous variables that remain untested. These untested variables may influence the findings and should be explored in future research. Clearly there is still much work to be done before operationally defendable vision standards can be determined, but the study’s striking result that novice pilots can land a simulated airplane with considerable visual degradation underscores the need for such work. It is important to understand the relationship between visual acuity and flight performance in novice pilots.
While the current study represents a significant and essential foundational step, as mentioned significant gaps in evidence to inform visual medical certification standards remain. For example, is visual acuity the most important/useful visual function to measure? What if any other visual functions should be considered? How does the interaction of visual acuity and other sensory modalities affect pilot performance? What role does cognitive load play in mediating or exacerbating the effects of reduced visual acuity? Does longstanding reduced vision have different effects than induced or sudden onset degradation? What are the longitudinal effects of visual acuity degradation on pilot career progression? By addressing these questions, the scientific community can deepen our understanding of the interplay between vision and flight performance. These efforts will contribute to the development of more precise and equitable visual standards. We invite researchers across disciplines take up these challenges.
Conclusion
This work highlights the need to develop evidence based visual standards for pilots. In clear, calm conditions without any emergency, novice pilot participants were able to land the aircraft on the runway without any effect to their simulated flight performance with vision degraded to 6/60. Reported stress and task difficulty both increase as vision worsens. This work provides the first evidence to question whether current visual standards are unnecessarily strict and suggests that attempts should be made to make these standards evidence based. It may be possible to safely widen the pool of eligible pilots and potentially allow experienced pilots to retain their medical certificates later in their careers. This work shows some tolerance for decreased vision on flight performance and links visual degradation to perceived stress and task difficulty. However, more work is required to determine the point at which decreased vision makes overall flight performance unsafe.
Key Points
• Twenty novice pilots competed either a simulated approach and landing (N = 10) or a simulated flight circuit (N = 10) • Flight performance outcome variables included variability of vertical speed, airspeed, pitch, roll, slope of altitude descent, landing hardness, and landing accuracy. • Flight performance variables during these simulated flight tasks were not affected by degraded vision up to the poorest visual acuity tested but were affected when vision was removed entirely. • Single numerical ratings were used to assess novice pilot perceived stress and task difficulty during a simulated flight and landing for different levels of vision. • Novice pilots reported high stress and task difficulty levels during trials with higher levels of vision degradation.
Footnotes
Declaration of Conflicting Interests
The author(s) declared no potential conflicts of interest with respect to the research, authorship, and/or publication of this article.
Funding
The author(s) disclosed receipt of the following financial support for the research, authorship, and/or publication of this article: Waterloo Institute for Sustainable Aeronautics Staff for assistance with the flight simulator. This research was supported by New Frontiers Research Fund Exploration (50383-10016).