
Abstract
Flight simulator sickness (SS) is a well-known phenomenon in aviation training, which can impact the safety and effectiveness of pilot training programs. Identifying and characterizing which flight maneuvers result in increased SS symptoms could help instructors tailor training to increase pilot retention and potentially improve training. The aim of this study was to explore the impact of different flight maneuvers on SS in a fixed-base simulator (ALSIM AL250). Our results indicate that a flight session with more intense flight maneuvers (landing with wind and taxiing) resulted in an increase in sickness symptoms (Total Sickness [p = .012] and Oculomotor Disturbance [p = 0.035] of the SSQ) compared to no changes after a session with less intense flight maneuvers (steep turn). These results demonstrate a need to explore which flight maneuvers are more likely to result in increased sickness symptoms and its effects on training and retention of student pilots.
Introduction
Simulator training in the field of aviation has a deep history, some of the earliest simulator’s date back to the 1910’s (Kearns et al., 2016). The advancement of technology has increased the fidelity of these simulators tremendously and as such has increased flight simulator use for training. Flight simulators can be safer, more cost efficient, and more environmentally sustainable for pilot training however, a disadvantage of flight simulators is the potential to experience simulator sickness (SS; Kim et al., 2023; Porcino et al., 2021). Due to the increase in flight simulator use for training it is important to characterize SS that may be experienced by pilots and students, particularly in fixed-base simulators where only visual cues are available (Porcino et al., 2021).
Simulator sickness (SS) is a form of motion sickness where motion itself is not required. SS may be caused by visual motion cues where visual vection is generated (Johnson, 2007; Kim & Park, 2020; Kim et al., 2020). Visual vection is the visually induced sense of self-motion (Denquin et al., 2021; Johnson, 2007; Porcino et al., 2021). Self-motion perception is critical for navigation and facilitates our ability to interact with objects in our environment (Fetsch et al., 2010). When the observer moves relative to a fixed environment the result is an optical flow cue—the same is true for a virtual environment that moves relative to a fixed observer (Fetsch et al., 2010; Kim et al., 2020). In real world scenarios we use other non-visual motion cues to resolve some ambiguities that may result from our visual cues due to eye and head movements (Fetsch et al., 2010). Our vestibular system informs the observer about their head position relative to gravity; this system, unlike the visual system, is unaffected by eye and object movements (Cullen, 2019; Fetsch et al., 2010). Therefore, the system will combine visual and vestibular motion cues to disambiguate the signals and provide more accurate self-motion and directional information (Fetsch et al., 2010).
The sensory conflict theory is the most supported theory proposed to explain the cause of SS (Kim & Park, 2020; Kim et al., 2023; Porcino et al., 2021; Zhang et al., 2016). This theory, proposed by Reason and Brand, explains that motion sickness develops when there is a mismatch between the experienced integrated sensory information and what is expected by the “internal model” (Zhang et al., 2016). Within a fixed-base flight simulator, where vestibular information is not available, the information integrated by the system will not match. The visual system receives translational motion information, and the vestibular system perceives that no motion is occurring. This mismatch is proposed to result in simulator sickness (Kim et al., 2023; Porcino et al., 2021).
A study by Kim et al. (2023) looked at the effect of adding motion on SS in a flight simulator. Participants were split into a “no motion” and “motion” group then had to complete basic flight maneuvers (take-off, turns, ascent, and descent). The “no motion” group used a fixed-base simulator, and the “motion” group used a simulator that had congruent flight motion cues (Kim et al., 2023). Kim et al. (2023) found that the “no motion” group experienced greater nausea, disorientation, and total sickness scores on the simulator sickness questionnaire (SSQ) compared to the motion group. This indicates that the fixed-base (“no motion”) simulator was prone to cause more SS symptoms than the simulator where motion cues were available and the mismatch between the visual and vestibular system was less severe.
These findings have strong implications regarding fixed-base flight simulator use in pilot training as pilots may be less willing to return to simulator training if they experience SS (Johnson, 2005, 2007). As a result, it is important to try and characterize the impact of SS on training in fixed-base simulators and determine the impact, if any, that flight maneuvers may have on SS within these fixed-base simulators.
The aim of this study was to explore the impact of different flight maneuvers on SS in a fixed-base simulator (ALSIM AL250 flight simulator). Our hypothesis is that completing a landing flight maneuver with induced winds as well as taxiing will result in higher SS symptoms in student pilots in the ALSIM AL250 flight simulator compared to performing a steep turn.
Methods
Participants
Thirty student pilots at University of Waterloo, Canada were recruited. All thirty participants (10 women; mean age 18.8 ± 1.9; flight hours at time of Study 1 2.5 ± 4.7) took part in an experiment (Study 1: An Experimental Comparison of the Effectiveness of Various Levels of Simulator Fidelity on Pilot Training) conducted prior to the primary manipulation presented here (Study 2). Of the thirty collected in Study 1 Twenty-Two participants (8 women; mean age 18.7 ± 2; flight hours at time of Study 2 2.5 ± 3.6) returned and completed Study 2.
Ethics Statement
Participants completed a written consent form. All experiments were performed in accordance with the 2008 Declaration of Helsinki and were approved by the ethical committee of the University of Waterloo, Canada. All participants were debriefed and informed of the purpose of the study at the end of the experiments.
Apparatus
Both experiments were conducted in the Waterloo Institute for Sustainable Aeronautics research flight simulator; ALSIM AL250 (see Figure 1) with a Cessna 172 configuration.
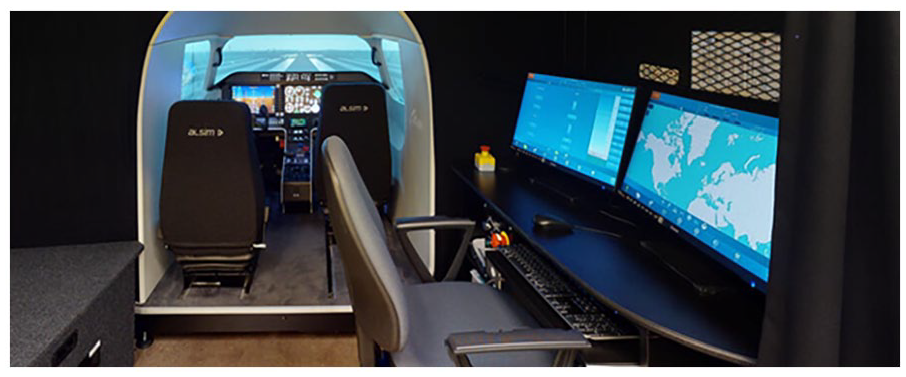
ALSIM AL250 Simulator at the Waterloo Institute for Sustainable Aeronautics.
Protocol
All participants received written and verbal instructions for the experiment; a briefing performed by a flight instructor was performed prior to the flight. Participants were given a Simulator Sickness Questionnaire (SSQ) questionnaire to complete before and after each flight session.
Session 1 (Study 1): The flight included three maneuvers graded by the flight instructor: (1) Pre-flight, Engine Start and After Start, (2) Takeoff, and (3) Steep Turn. The approximate time of flight was 20 min.
Session 2 (Study 2): The flight included five maneuvers graded by the flight instructor: (1) Pre-flight, Engine Start and After Start, (2) Takeoff, (3) Circuit, (4) Landing (with wind), and (5) Taxiing. The approximate time of flight was 20 min.
Analysis
Data Analysis
Nausea, Oculomotor Disturbance, Disorientation, and Total Sickness scores were calculated from the SSQ. The SSQ requires participants to respond to their ratings of 16 symptoms on a scale of 0 (not at all), 1 (mild), 2 (moderate), and 3 (severe; Bimberg et al., 2020; Kennedy et al., 1993; Simón-Vicente et al., 2022). The sub scores of Nausea, Oculomotor Disturbance, and Disorientation are calculated from a sum of 7 of the 16 symptoms (see Bimberg et al., 2020; Kennedy et al., 1993 for a breakdown of these sums) and then multiplied by a factor of 9.54, 7.58, and 13.92, respectively. The Total Sickness score is a sum of the subsection sums multiplied by a factor of 3.74. These calculations were completed for the pre-flight SSQ and post flight SSQ.
Statistical Analysis
A 2 (Study: Study 1 (S1)/Study 2 (S2)) × 2 (Pre/Post SSQ: Pre/Post) repeated measures ANOVA was run for the Total Sickness scores, as well as all three sub scores (Nausea, Oculomotor Disturbance, and Disorientation) of the SSQ. Following this, all significant interaction effects were broken down and followed up by appropriate pairwise comparisons and all results were reported with an alpha level of .05. All data was analyzed using R version 4.1.0.
Results
Four two-way repeated measures ANOVA (RMANOVA) were performed to evaluate the effect of different flight maneuvers across two studies on pre and post SSQ Total Sickness (TS) scores, Nausea, Oculomotor Disturbance, and Disorientation sub scores.
SSQ Total Sickness Scores RMANOVA
The results from the 2 × 2 RMANOVA for the SSQ Total Sickness scores are described in this section (see Figure 2).
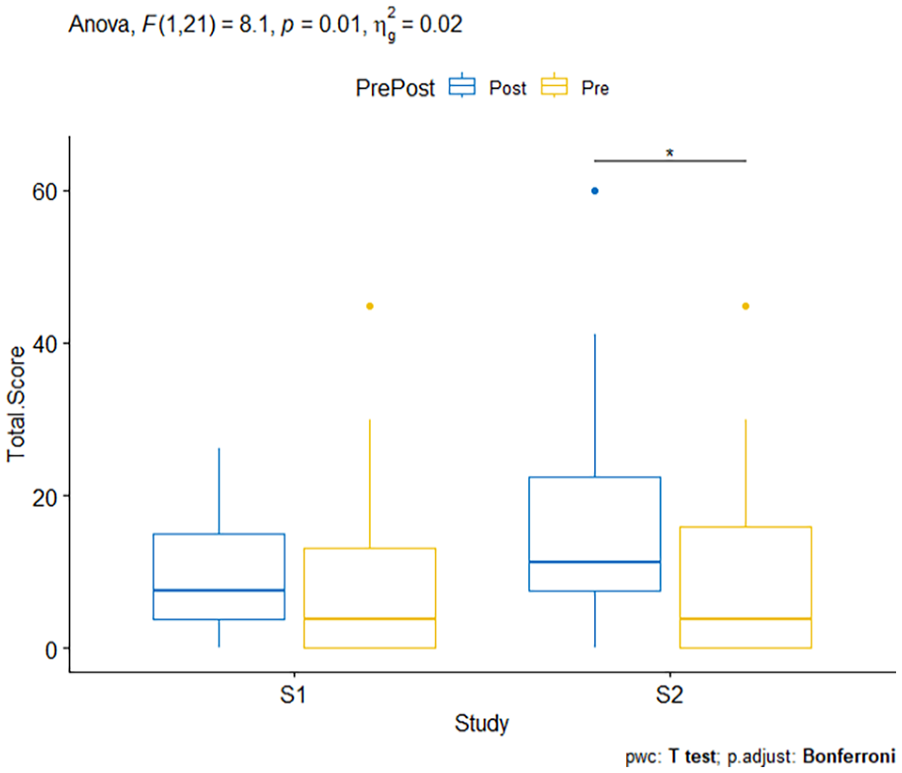
Box plot showing results from two-way RMANOVA for SSQ Total Scores.
Main Effect of Study
No significant main effect of study was observed [F(1,21) = 3.359, p = .081, ηg2 = 0.017], suggesting that the overall effect of the study design was not different between the studies.
Main Effect of Pre/Post SSQ
Similarly, there was no significant main effect of Pre/Post SSQ [F(1,21) = 3.075, p = .094, ηg2 = 0.027] suggesting that the overall exposure to a simulator session did not lead to higher SSQ scores.
Study × Pre/Post Interaction Effect
A significant interaction between study type and Pre/Post SSQ on SSQ Total Sickness scores was found [F(1,21) = 8.102, p = .01, ηg2 = .021], indicating different effects of the maneuvers across the two study conditions. Specifically, the post-test scores in Study 2 increased significantly, suggesting that the maneuvers in this study led to higher sickness scores. This effect of Pre/Post SSQ was then analyzed for each study. p-Values were adjusted using the Bonferroni multiple testing correction method. The effect of Pre/Post SSQ was significant for Study 2 (p = .048; mean pre-TS SSQ = 8.84, SE = 2.68, SD = 12.6; mean post-TS SSQ = 16.5, SE = 3.34, SD = 15.6) but not for Study 1 (p = 1; mean pre-TS SSQ = 9.18, SE = 2.67, SD = 12.5; post-TS SSQ = 9.69, SE = 1.72, SD = 8.05).
Pairwise comparisons using a one-tailed paired t-test, shows that the Post SSQ Total Sickness scores for Study 2 were significantly higher than the Pre SSQ scores in Study 2 (p = .012). This comparison was not significant for Study 1 (p = 0.401; see Figure 2).
SSQ Nausea Sub Scores RMANOVA
The results from the 2 × 2 RMANOVA for the SSQ Nausea Sub Scores are described in this section. (See Figure 3). Overall, results indicate SSQ nausea related symptoms did not change with exposure to a simulator session and/or due to changes in the study design (Study 1: mean pre-SSQ = 8.67, SE = 2.42, SD = 11.4; mean post-SSQ = 8.67, SE = 2.26, SD = 10.6 and Study 2: mean pre-SSQ = 6.50, SE = 2.21, SD = 10.4; mean post-SSQ = 12.6, SE = 4.37, SD = 20.5).
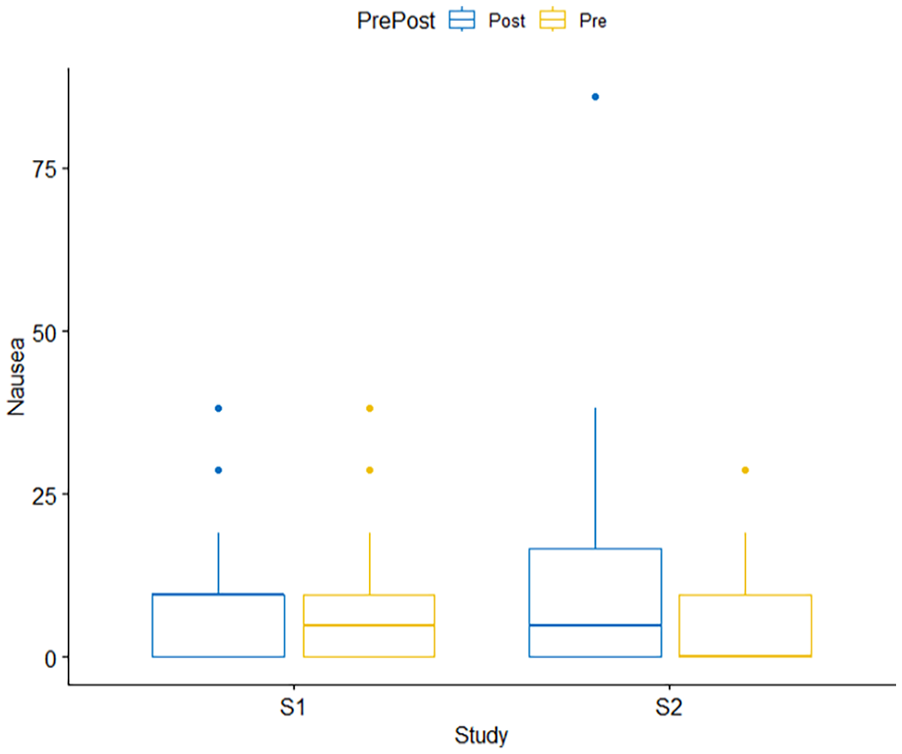
Box plot showing results from two-way RMANOVA for SSQ Nausea Sub Scores. There were no significant main or interaction effects.
Main Effect of Study
There was no significant main effect of study [F(1, 21) = 0.183, p = .673, ηg2 = 0.001].
Main Effect of Pre/Post SSQ
The was no significant main effect of Pre/Post SSQ [F(1,21) = 1.094, p = .308, ηg2 = .012].
Study × Pre/Post Interaction Effect
There was no significant interaction between study and Pre/Post SSQ [F(1,21) = 2.789, p = .11, ηg2 = .012].
SSQ Oculomotor Disturbance Sub Scores RMANOVA
The results from the 2 × 2 RMANOVA for the SSQ Oculomotor Disturbance Sub Scores are described in this section (see Figure 4).
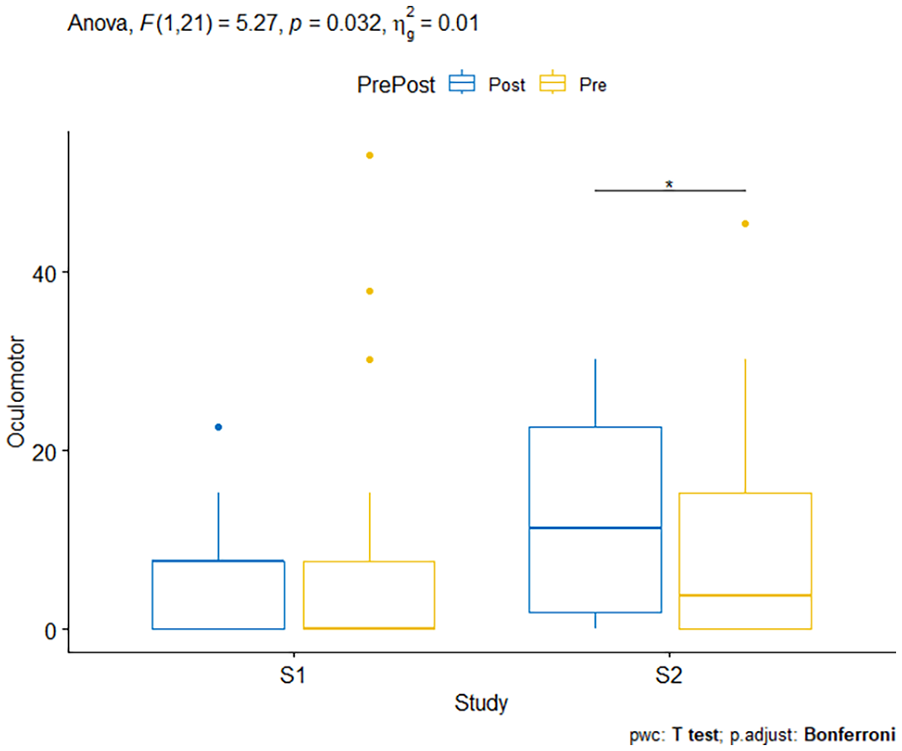
Box plot showing results from two-way RMANOVA for SSQ Oculomotor Disturbances Sub Scores.
Main Effect of Study
There was no significant main effect of study [F(1, 21) = 3.116, p = .092, ηg2 = .021].
Main Effect of Pre/Post SSQ
The was no significant main effect of Pre/Post SSQ [F(1,21) = .401, p = .534, ηg2 = .003].
Study × Pre/Post Interaction Effect
There was statistically significant interaction between Study and Pre/Post SSQ on SSQ Oculomotor Disturbance, F(1,21) = 5.268, p = .032, ηg2 = .013. The effect of Pre/Post SSQ was then analyzed for each study. p-Values were adjusted using the Bonferroni multiple testing correction method. The effect of Pre/Post SSQ was not significant for Study 1 (p = 1) and Study 2 (p = .138).
Pairwise comparisons using a one-tailed paired t-test, however, shows that the Post SSQ Total Scores for Study 2 were significantly higher than the Pre SSQ scores in Study 2 (p = .035). These results suggest the different maneuvers affected the oculomotor disturbance related symptoms of the SSQ, specifically, the maneuvers of study 2 appear to affect the oculomotor disturbance scores to a greater degree than the maneuvers of study 1. This comparison was not significant for Study 1 (p = .712; see Figure 4).
SSQ Disorientation Sub Scores RMANOVA
Results from the 2 × 2 RMANOVA for the SSQ Disorientation Sub Scores are described in this section (see Figure 5).
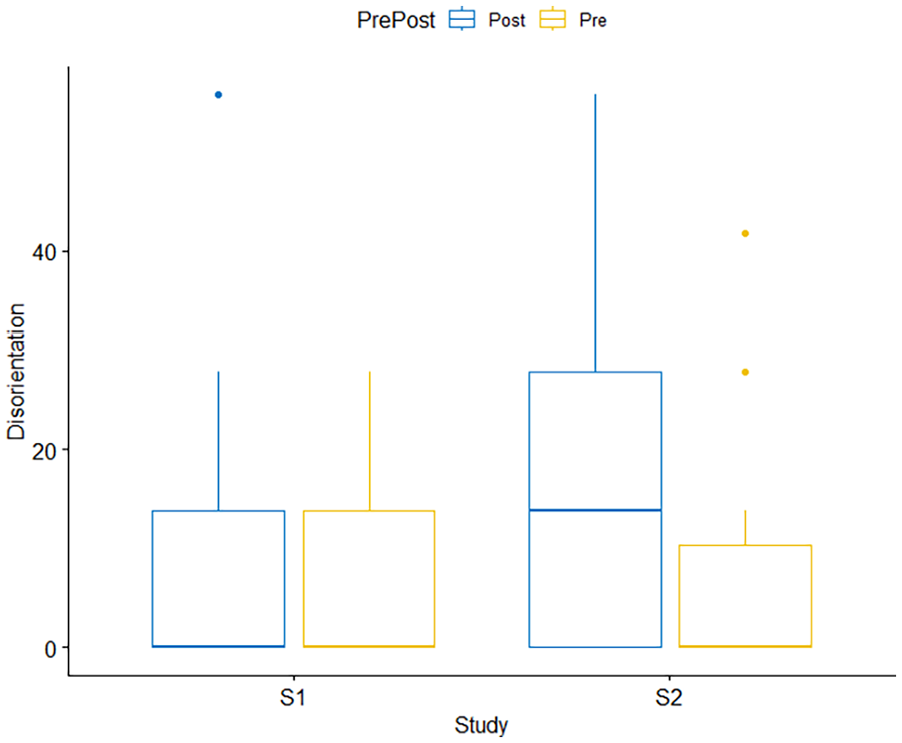
Box plot showing results from two-way RMANOVA for SSQ Disorientation Sub Scores. There were no significant interaction effects.
Main Effect of Study
There was no significant main effect of study [F(1, 21) = 3.316, p = .083, ηg2 = 0.029].
Main Effect of Pre/Post SSQ
There was a significant main effect of Pre/Post SSQ [F(1,21) = 9.421, p = .006, ηg2 = 0.088]. Pairwise comparisons of Pre/Post SSQ show that Post SSQ scores were significantly higher than the Pre SSQ scores collapsed across both studies (p = .000665; mean pre-SSQ disorientation = 6.01, SE = 1.59, SD = 10.6; mean post-SSQ disorientation = 14.6, SE = 2.60, SD = 17.2; See Figure 6). These results suggest that overall exposure to a simulator session resulted in increased disorientation related symptoms of the SSQ.
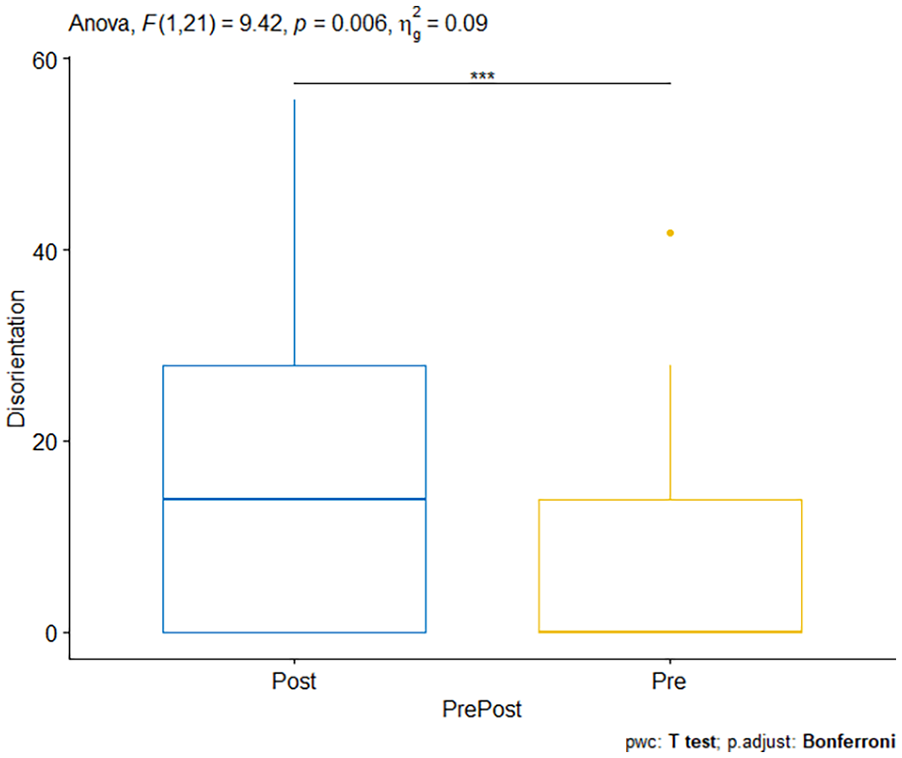
Box plot showing the main effect of pre/post SSQ scores for SSQ Disorientation Sub Scores. ***Demonstrates significant findings.
Study × Pre/Post Interaction Effect
There was no significant interaction between study and Pre/Post SSQ [F(1,21) = 4.103, p = .056, ηg2 = 0.022] (Study 1: mean pre-SSQ = 5.70, SE = 1.98, SD = 9.27; mean post-SSQ = 10.1, SE = 3.06, SD = 14.4 and Study 2: mean pre-SSQ = 6.33, SE = 2.55, SD = 11.9; mean post-SSQ = 19.0, SE = 4.05, SD = 19.0).
Discussion
The objective of this study was to examine the effects of different flight maneuvers on SS experienced by student pilots. The study underscores the persistent challenge of SS which arises when the brain receives conflicting signals from various sensory systems including the inner ear (vestibular), eyes (visual), and proprioceptors, leading to motion sickness due to the brain’s struggle to reconcile differing perceptions of motion (Johnson, 2005).
Our results showed that there was a significant increase in post flight Total Sickness (TS) scores for Study 2 (landing with wind and taxiing) compared to preflight TS scores. This was not found for Study 1 (steep turn). This is in accordance with our hypothesis where the more intense flight maneuvers resulted in more SS symptoms in student pilots.
When exploring the SSQ sub scores we found that there were no significant effects on the Nausea sub score (see Figure 3). Significant effects were found on the Oculomotor Disturbance sub score that indicated similar effects to the TS scores (see Figure 4). Finally, we found a main effect of preflight compared to postflight Disorientation sub scores. Postflight Disorientation sub scores were significantly higher compared to preflight Disorientation sub scores (this was a main effect collapsed across both studies; see Figure 6).
The results from the TS’s and Oculomotor Disturbance sub scores indicate that where Study 1 did not result in significant SS symptoms, Study 2 did result in student pilots experiencing increased SS symptoms. The results from the Disorientation sub score showed that student pilots did experience an increase in disorienting SS symptoms postflight when collapsing across both studies.
The results can be further decomposed to look at how changes in flight maneuvers performed may have impacted SS symptoms. A study by Webb et al. (2009) found that recommendations to decrease the maneuver intensity during simulator training of helicopter pilots results in a decrease in SS symptoms. This highlights the effect of certain maneuvers being more likely to cause SS symptoms compared to other flight maneuvers; this is consistent with the results found here where Study 2 involved more intense flight maneuvers such as landing with wind. When landing with wind in a fixed base simulator the sudden drops or movements of the aircraft are not felt but can be seen by the pilot; this conflict in sensory information could be responsible for the increases seen in SS symptoms. These sudden drops are sensed by the visual system as motion accelerations that do not correspond to the lack of stimulation of the otolith vestibular organs; these incongruent perceived accelerations can produce higher degrees of SS (Porcino et al., 2021). When landing with wind, these vertical accelerations are variable and in different directions; the changes in acceleration may contribute to the SS symptoms experienced by the student pilots (Porcino et al., 2021).
Additionally, a taxiing task was performed by the student pilots in Study 2. Results from driving simulator studies can help us understand how this taxiing maneuver could result in increased SS symptoms. A study by Almallah et al. (2021) found that drivers experienced increased SS symptoms when driving in a rural environment compared to an urban environment. They speculate that the increased travel speeds in rural roads or the low number of buildings in the virtual environment increase the discrepancy between the visual and vestibular system resulting in an increase in SS symptoms (Almallah et al., 2021). A similar lack of buildings and visual cues is present during runway/airport taxiing, it is possible that some of the increases in SS symptoms may also be due to the taxiing maneuver performed by the student pilots.
SS can impact the effectiveness and safety of pilot training programs. Practical insights from the study suggest that identifying specific flight maneuvers associated with increased SS symptoms could aid instructors in customizing training programs.
Limitations
A limitation of this study is that we are unable to distinguish between flight maneuvers that occurred in each study; meaning we cannot ascertain which maneuvers caused the increase in SS symptoms in Study 2 (landing with wind versus taxiing) compared to Study 1. Additionally, the eligibility criteria of Study 1 excluded the recruiting of participants who rated themselves as moderately—severely susceptible to motion sickness (>5) on a 1 to 10 Likert scale. This eligibility criteria limited the studied sample to a population of participants with a low to moderate sickness susceptibility. Interestingly, when asked about sickness susceptibility in Study 1, the average response was a susceptibility of 2 ± 1 compared to the same participants rating in Study 2 where the average susceptibility was 2.8 ± 2. The same participants rated their susceptibility differently between the two studies; it is hard to determine the effect that these differences in susceptibility may have on our results.
Future Directions
A study further exploring the different types of flight maneuvers common in student pilot training would be beneficial to begin characterizing which maneuvers are more likely to cause SS symptoms; this could lead to a list of recommended flight maneuvers to complete or avoid in fixed-base simulators. Additionally, incorporating a continuous measure of SS symptoms could prove useful in being able to discern between different flight maneuvers completed during each flight; this would allow us to further narrow down which flight maneuvers within a flight are directly causing an increase in SS symptoms in student pilots.
Additionally, an interesting result was revealed by post study conversations with the flight instructor. All collections in Study 2 were done by the same flight instructor in a span of 2 days, after day 1 the instructor commented that they, as the observer, felt higher SS symptoms as the day went on. This result could be further explored as the impact of repeated simulator sessions on instructors may have unknown impacts on training quality and evaluations, as well as it may reduce instructor motivation when a long simulator session is scheduled.
Conclusion
Flight simulators continue to be widely used for pilot training. As such, understanding how simulator sickness is induced in flight simulators is crucial to improving training and ensuring pilot retention. SS not only affects training effectiveness but also influences trainee motivation and performance. Minimizing the risk of SS is crucial to maintaining trainee engagement and optimizing learning outcomes. Beyond aviation, the study underscores the broader implications of SS in simulator-based training across various domains, including medicine, military, and transportation. Addressing SS not only enhances safety and efficiency but also fosters innovation in simulator design and training methodologies.
Footnotes
Declaration of Conflicting Interests
The author(s) declared no potential conflicts of interest with respect to the research, authorship, and/or publication of this article.
Funding
The author(s) disclosed receipt of the following financial support for the research, authorship, and/or publication of this article: This work is supported in part by the Canadian Armed Forces. Additional thanks to Brad Moncion for his expertise and assistance throughout the study.