
Abstract
Objective:
This study tested whether simulator-based training of pilot responses to unexpected or novel events can be improved by including unpredictability and variability in training scenarios.
Background:
Current regulations allow for highly predictable and invariable training, which may not be sufficient to prepare pilots for unexpected or novel situations in-flight. Training for surprise will become mandatory in the near future.
Method:
Using an aircraft model largely unfamiliar to the participants, one group of 10 pilots (the unpredictable and variable [U/V] group) practiced responses to controllability issues in a relatively U/V manner. A control group of another 10 pilots practiced the same failures in a highly predictable and invariable manner. After the practice, performance of all pilots was tested in a surprise scenario, in which the pilots had to apply the learned knowledge. To control for surprise habituation and familiarization with the controls, two control tests were included.
Results:
Whereas the U/V group required more time than the control group to identify failures during the practice, the results indicated superior understanding and performance in the U/V group as compared to the control group in the surprise test. There were no significant differences between the groups in surprise or performance in the control tests.
Conclusion:
Given the results, we conclude that organizing pilot training in a more U/V way improves transfer of training to unexpected situations in-flight.
Application:
The outcomes suggest that the inclusion of U/V simulator training scenarios is important when training pilots for unexpected situations.
Introduction
According to regulations, the initial and recurrent type-rating checks for pilots must involve standardized and therefore relatively predictable scenarios. The training sessions for these checks can be organized in similarly predictable format (Bureau d’Enquêtes et d’Analyses, 2012; Casner, Geven, & Williams, 2013). However, research suggests that skills taught in this manner are “brittle” instead of adaptive (Casner et al., 2013; Landman, Groen, van Paassen, Bronkhorst, & Mulder, 2017b). That is, they transfer well to predictable situations like the tests, but they may not hold up in emergency situations, which are typically novel and unexpected. For this reason, many aviation companies look for ways to extend on the minimally required training. Aviation safety organizations have recognized the benefits of such extensions and offer ways to formalize them (see, e.g., Federal Aviation Administration, 1990).
Unfortunately, it is impossible to train pilots for every conceivable abnormal situation. However, pilots can be trained for common factors in such situations. One of these factors is the presence of startle and surprise, the training for which will become mandatory in the near future (European Aviation Safety Agency, 2015; Federal Aviation Administration, 2015; International Civil Aviation Organization, 2013). Coping with surprise requires effective sensemaking activities, which involves the search for a structured representation, or “frame” of the situation. This frame is used to direct attention, interpret information, and make sense of what is going on (see Klein, Phillips, Rall, & Peluso, 2007; Neisser, 1976; Rankin, Woltjer, & Field, 2016; Zhang, Soergel, Klavans, & Oard, 2008). Sensemaking includes, for instance, seeking information on the instruments, reasoning, or testing out hypotheses. Such activities are particularly difficult when a pilot is startled (Eysenck, Derakshan, Santos, & Calvo, 2007; Landman et al., 2017a) or fatigued (Caldwell, 1997). If an appropriate frame cannot be found the perceived events may lose their meaning and coherence, which may increase stress even further and prevent effective troubleshooting.
Since predictable scenarios require very little sensemaking, they can be expected to be insufficient training to deal with surprise. A simple means to increase unpredictability would be to deny (certain) information about upcoming events. Second, aspects of a problem can vary among practice iterations, making each scenario somewhat different (Paas & Van Merriënboer, 1994; Van Merriënboer, Clark, & De Croock, 2002). Variable practice is thought to enhance a trainee’s recognition of relevant features and rules, since the irrelevant features are different in each practice iteration (Shapiro & Schmidt, 1982). The resultant skills and knowledge are therefore better applicable in situations that are not explicitly practiced (i.e., generalization; Carbonell, Stalmeijer, Könings, Segers, & van Merriënboer, 2014). Finally, different types of problems can be intermixed (and spaced out) so that trainees cannot assume that the same solution is applicable in each next practice iteration. This is thought to improve their ability to pair the appropriate solution to the problem (Lee & Magill, 1985). Such methods are known as “mixed review” in math education (Rohrer, 2009) or “contextual interference” in perceptual-motor learning literature (e.g., Brady, 2004).
In the current simulator study, we investigated whether arranging simulator training in a more unpredictable and variable (U/V) manner improves pilot performance in a surprise test. The test required pilots to apply the learned knowledge and skills in a demanding and partly novel situation. Based on the aforementioned literature, it was hypothesized that U/V practice would improve the pilots’ performance in this test, due to a better understanding of the events and the principles involved.
Method
Participants
Twenty participating airline pilots were randomly assigned to either a U/V practice group or a control group, unless when the groups became unbalanced with regard to the variables listed in Tables 1 and 2. Thus, two type-rating instructors and one pilot with extended light multiengine piston flying experience (i.e., CS-23/FAR part 23) were reassigned to the control group. All pilots, except one in the U/V group, indicated that they had at least 25 hours of light multiengine piston flying experience. Pilots were mainly recruited from a single airline company. Eight pilots from this company were in the U/V group and seven in the control group. This study complied with the tenets of the Declaration of Helsinki, and informed consent was obtained from each participant.
Characteristics of the Participants
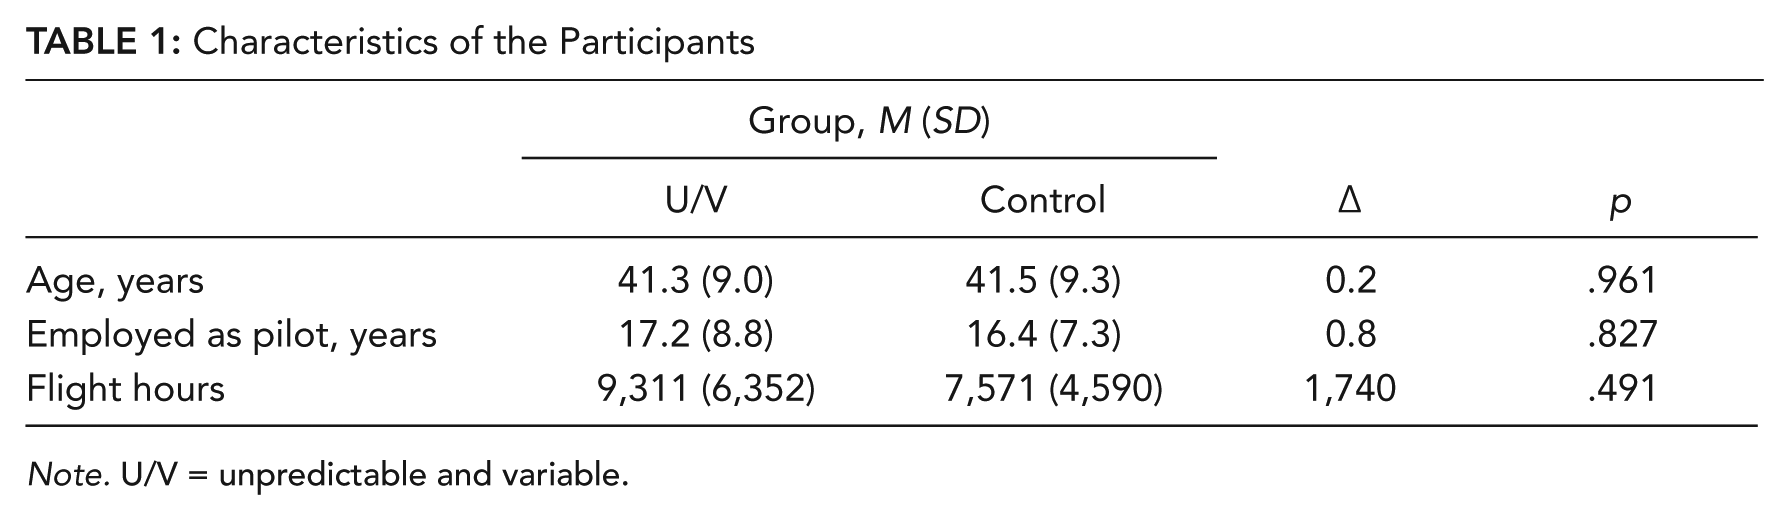
Note. U/V = unpredictable and variable.
Characteristics of the Participants (Continued)
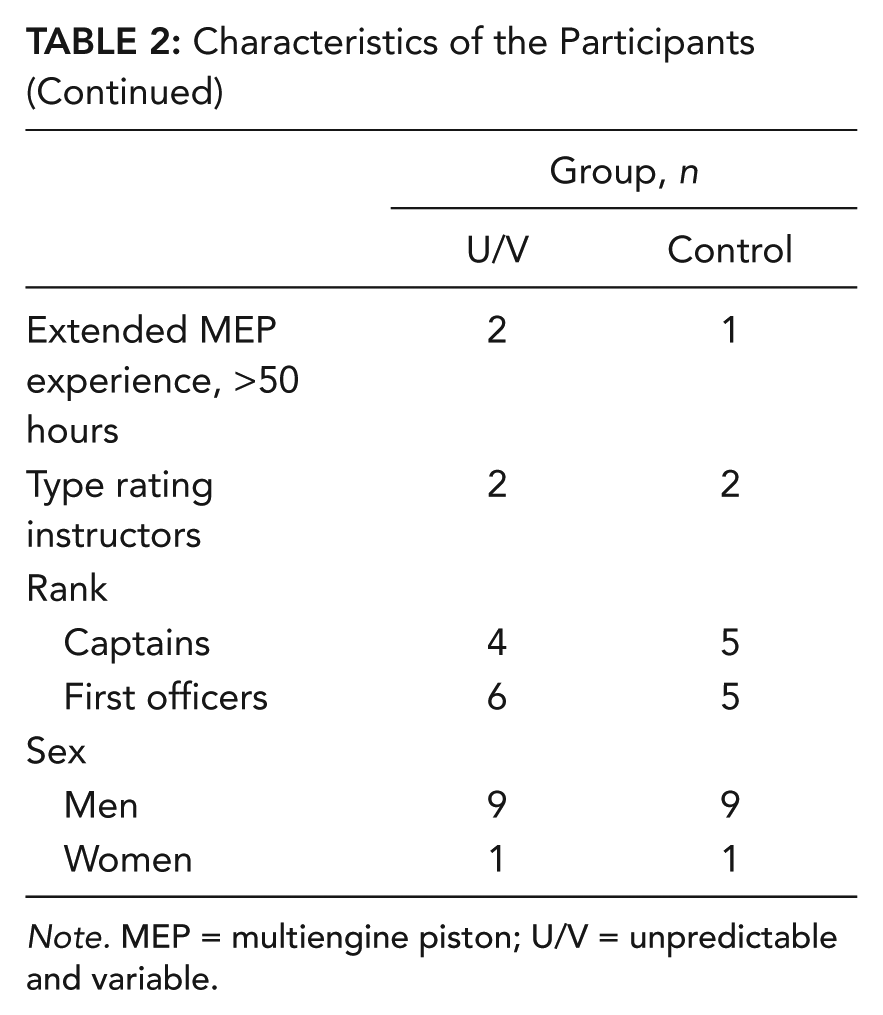
Note. MEP = multiengine piston; U/V = unpredictable and variable.
Apparatus
The experiment was performed in the Simona Research Simulator of the Delft University of Technology in the Netherlands, which features a 6–degrees of freedom hydraulic hexapod motion system and a collimated 180° (horizontal) × 40° (vertical) field-of-view display system. For outside visuals, the FlightGear open-source flight simulator was used. Standard washout filters were used for motion cueing (Reid & Nahon, 1988). A piston aircraft engine sound was played in mono over the pilots’ headphones. Audio pitch was coupled to engine rpm and volume to torque. The cockpit mock-up was styled after a jet airliner and featured a B747-style primary flight display and a Cessna Citation–style engine display. Controls consisted of a right-hand sidestick with pitch trim control, rudder pedals with force feedback, and thrust, flap, and gear levers. A nonlinear aerodynamic model was used from a light twin-propeller aircraft: the Piper PA-34 Seneca III (De Muynck & Hesse, 1990; Koolstra, Herman, & Mulder, 2015). The aircraft model has certain properties and failure options, which allows for the development of challenging flying tasks. The airflow over the wing of each propeller induces extra lift, which causes a roll moment as well as a yaw moment in case of asymmetric thrust. At low speed, the moments generated by asymmetric thrust will exceed the maximum obtainable opposite moments generated by the control surfaces.
Tasks
The design of the experiment is illustrated in Figure 1. Each session listed in the figure is described in turn.
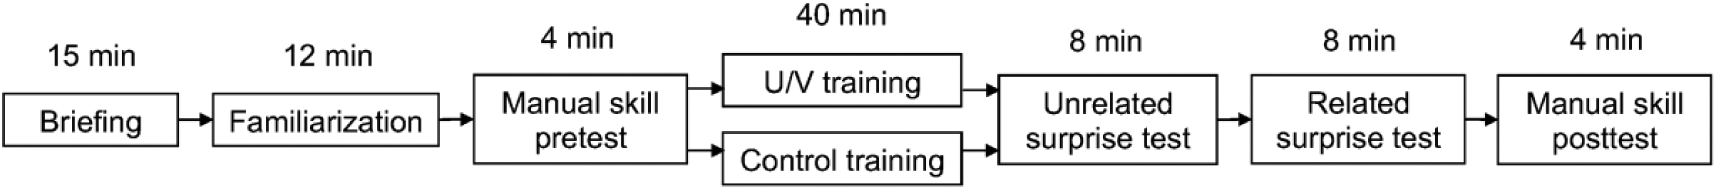
The experimental design. U/V = unpredictable/variable.
Briefing and familiarization
Pilots were informed that they would perform a number of scenarios and respond to malfunctions. They were instructed to complete the task as given (e.g., perform a landing, fly a circuit), unless a crash was imminent. Air traffic control communication and checklists were not included. Pilots were instructed to call out any problem as soon as they noticed it. They were informed about the required settings: a circuit would need to be flown at 1,000 ft with a speed of 130 kt and a power setting of approximately 42 N·m torque. Full throttle was used during takeoff. A flaps setting of 25° was required only during landing. The speed at rotate was 80 kt; the optimal rate of climb (V2) was 92 kt; the approach speed was 85 kt; and the minimum control speed with a single engine was around 80 kt. Pilots were reminded of the settings if they diverged from them during the familiarization and practice. Wind direction and strength (light or moderate) information was provided verbally before each run and indicated by a wind sock located next to the runway. Following the briefing, pilots were seated in the simulator and instructed to fly two familiarization circuits: one without wind and one with light crosswind.
Practice session
Pilots then practiced with managing asymmetric thrust by performing six takeoff runs with a single-engine failure, four flyby runs with a rudder failure, and four flyby runs with a single-engine failure (described later). Aspects of the runs were varied in the U/V group only (see Table 3). The runs were presented in blocks of two (e.g., two takeoff runs; see Table 4). These blocks were alternated in the U/V group only. Before the first run of each block, pilots in the U/V group were merely informed that a malfunction would occur. Between the first run and the second run of each block, they were informed what the malfunction was and how they could respond. Pilots in the control group received all this information before the first run of each block, and they were informed that each subsequent run was a repetition.
Characteristics of the Runs
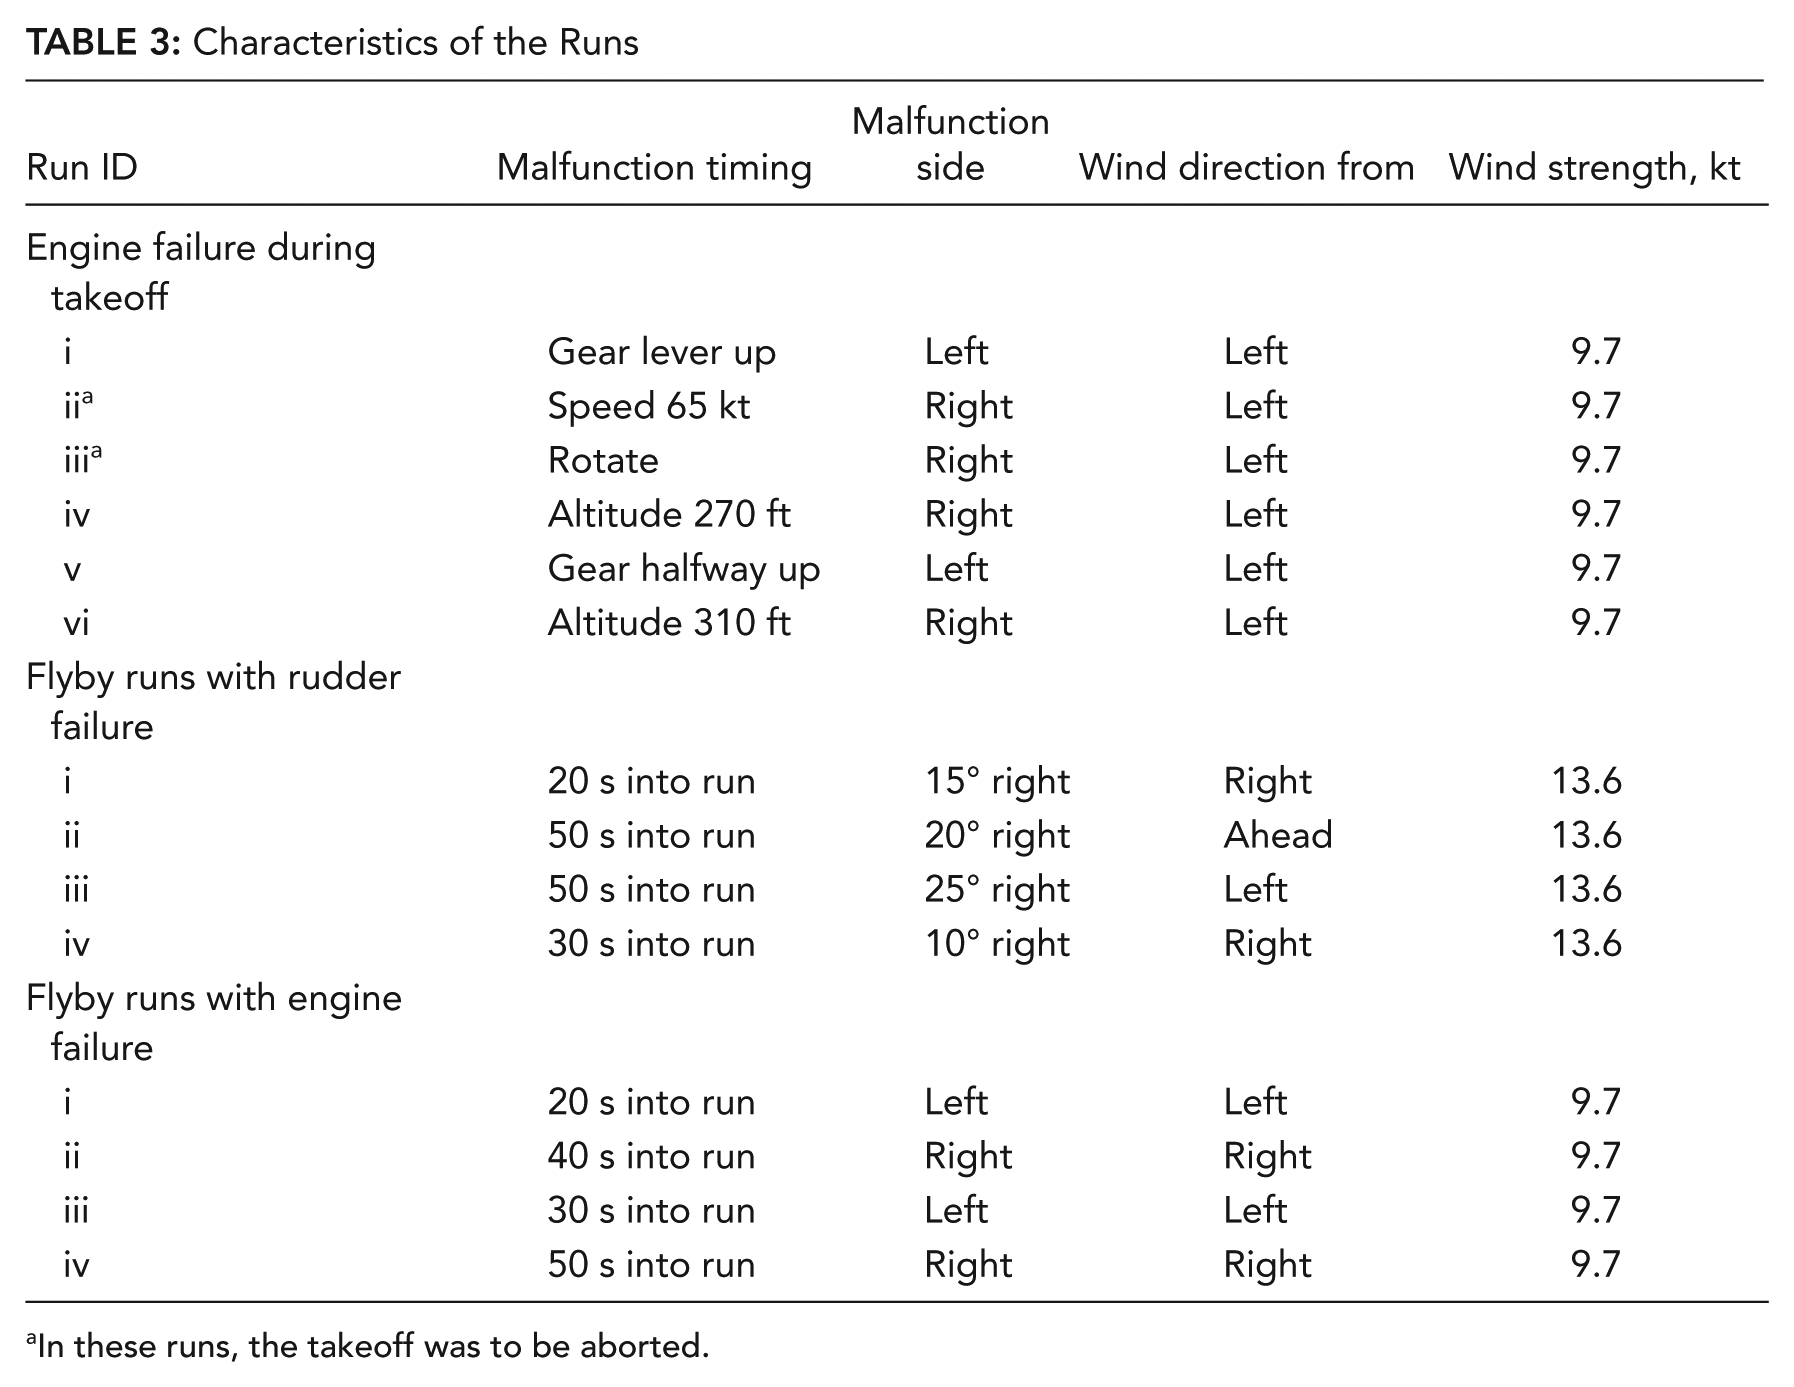
In these runs, the takeoff was to be aborted.
Order of the Runs and the Variations Used in the Practice Session
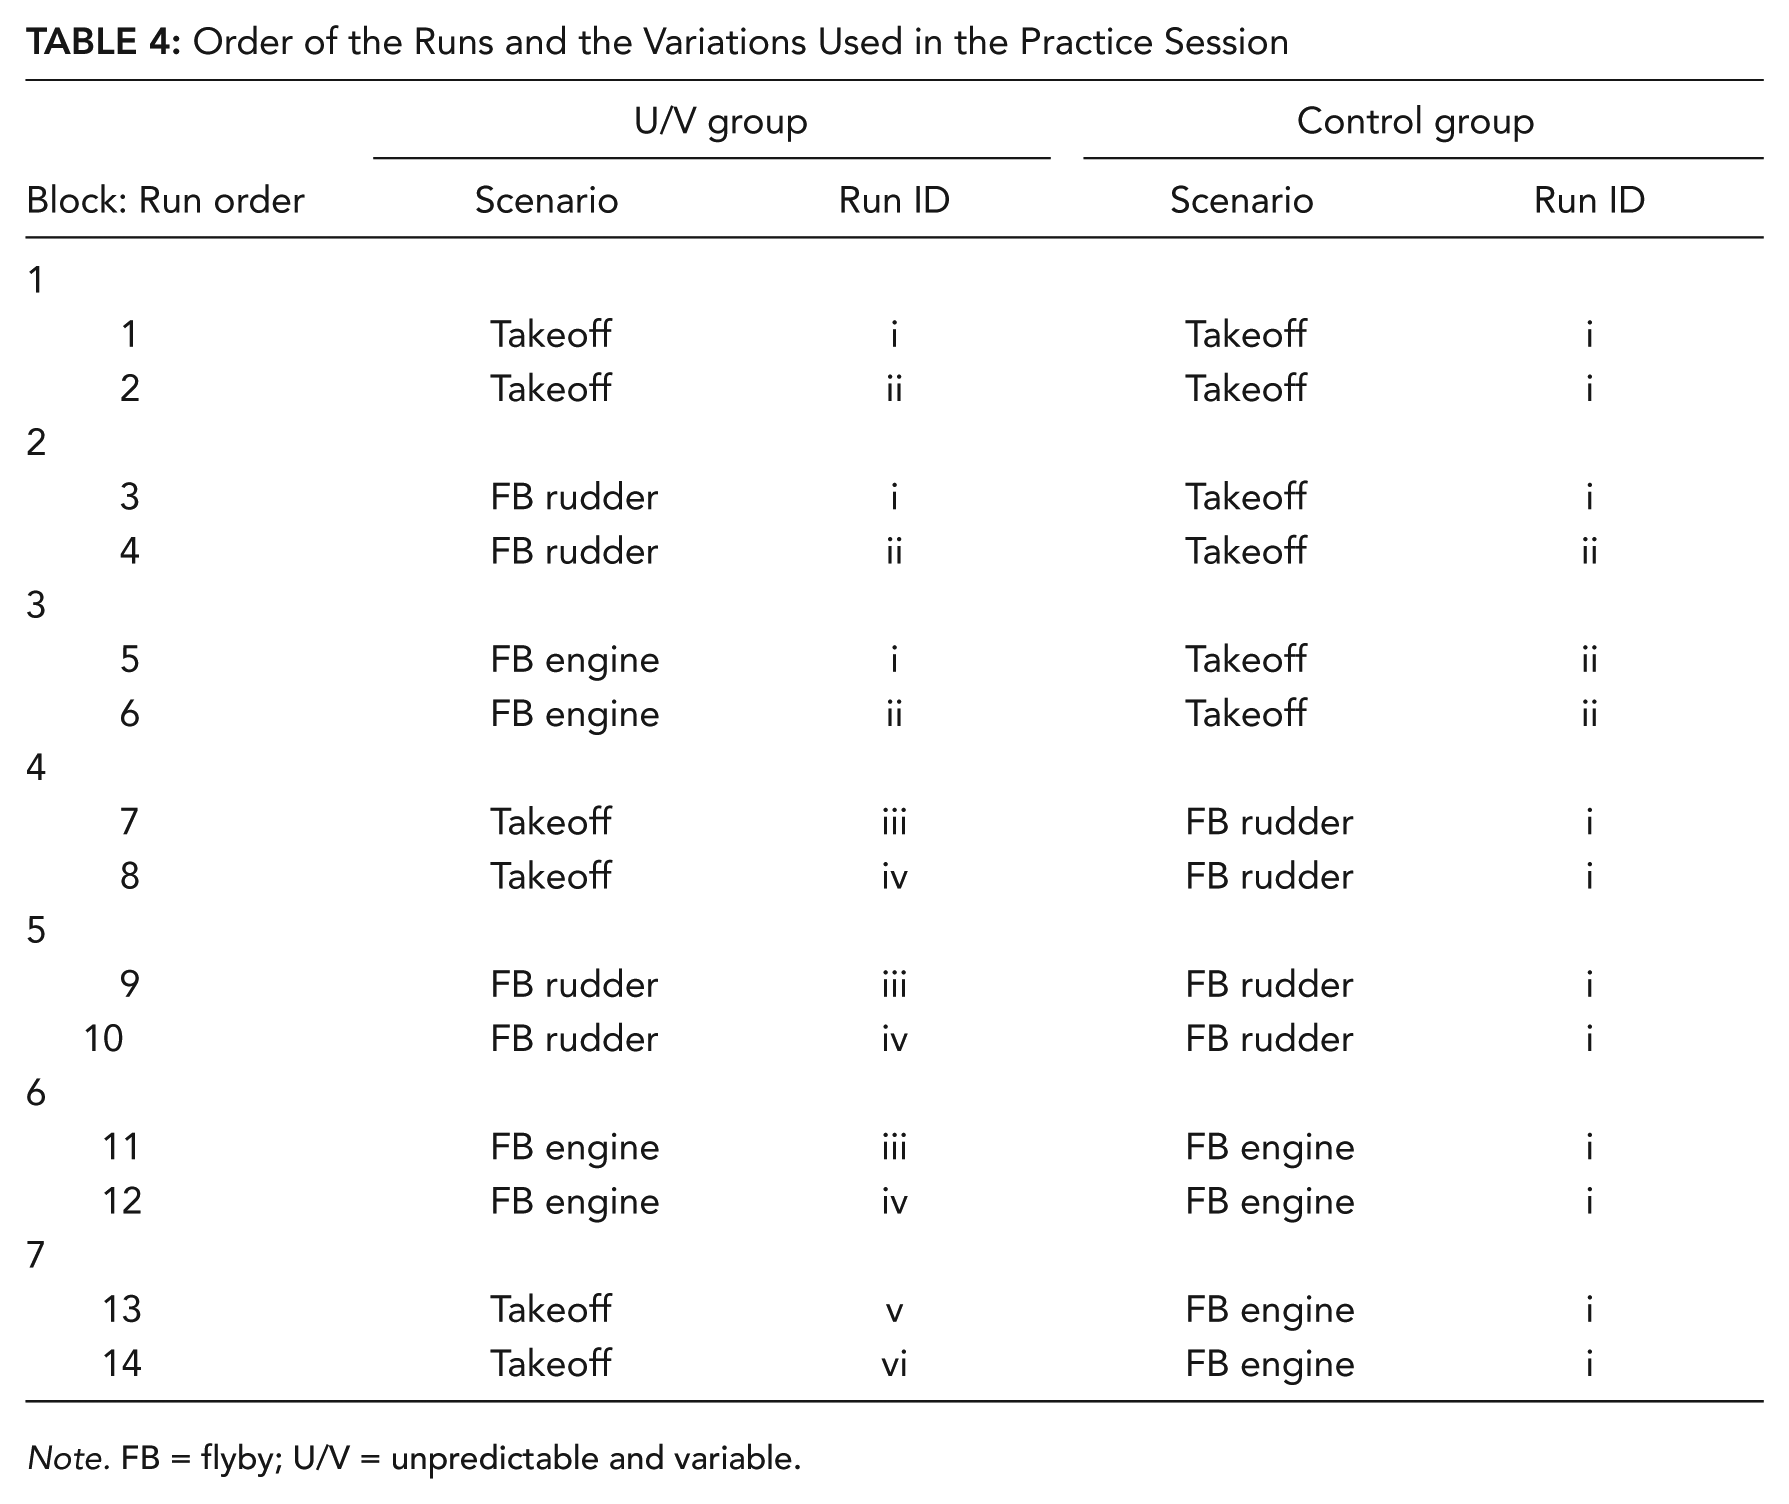
Note. FB = flyby; U/V = unpredictable and variable.
The takeoff runs started with the aircraft on the runway (Runway 18C), with 3,000 ft of runway ahead. The U/V group was only instructed to respond as they saw fit, whereas the control group was told when the engine failure would occur and whether the takeoff was to be aborted or continued. Following the first run in a block, the U/V group was reminded to pay attention to the minimum control speed (80 kt), below which the takeoff was to be aborted. If pilots continued the takeoff following the engine failure, they were instructed to continue to climb 100 ft straight ahead, where the run ended. Both groups included a similar number of to-be-aborted takeoffs.
The flyby runs started with the aircraft in approach, approximately 90 seconds from reaching the runway. The task was to fly over the runway, follow the centerline as closely as possible, and, upon reaching the runway, descend to 100-ft altitude and reduce speed to 85 kt. The gear remained down, and flaps remained at 25°. The malfunction occurred before reaching the runway. For the rudder issue, response instructions included that it could be countered by commanding a throttle differential. For the engine failure, pilots were reminded of the minimum control speed of 80 kt. In the U/V group, extra variation was introduced (besides factors listed in Table 3) by asking pilots to increase their speed in the second half of each flyby, by adding turbulence, and by reducing the visibility in 50% of the runs.
Related surprise test
After the practice session, two surprise tests were performed: first, an unrelated (control) surprise test, which is described in the next section; second, a related surprise test, which was the main test of the study. This test required the application of practiced skills (i.e., management of asymmetric thrust) in a surprising, demanding, and partly novel scenario. The scenario started on the runway of a different airport, featuring a single 4,000-ft-long runway (Runway 03) and a line of trees that was to be crossed following takeoff. There was moderate crosswind, coming from 310° (see Figure 2). Pilots were instructed to fly a left-handed circuit.
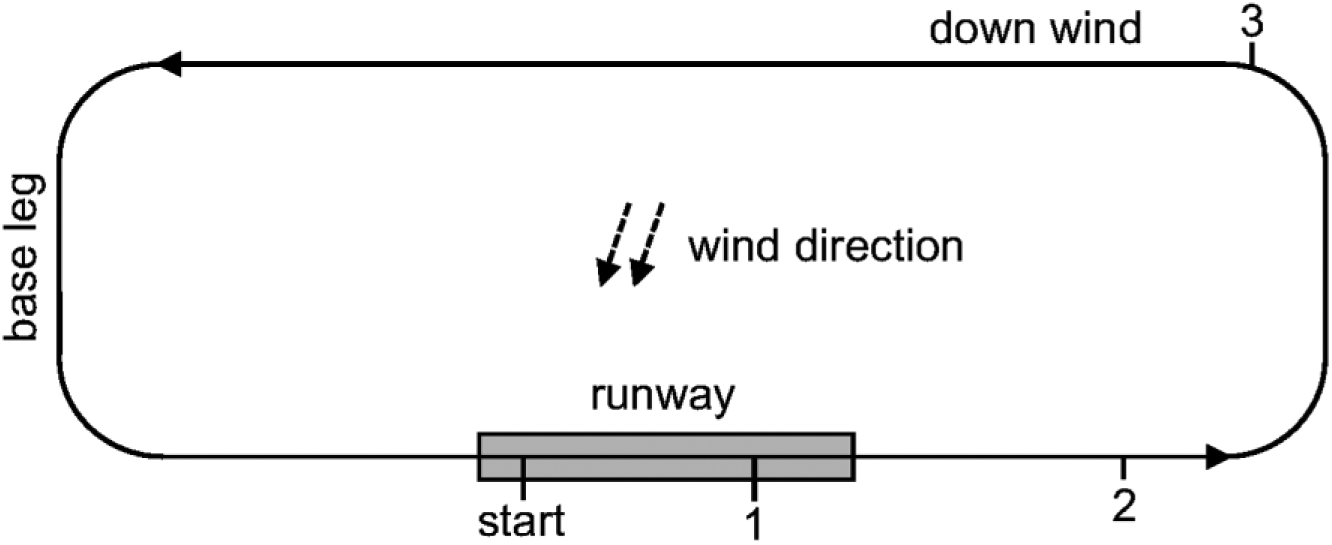
The circuit flown in the related surprise test and the moments at which the malfunctions occur. 1: Right engine starts losing power over 20 seconds. 2: Brief decrease in left engine power, which is immediately restored. 3: Rudder effectiveness decreases to 20%.
As shown in Figure 2, the following malfunctions were inserted into this run. First, during takeoff, when the speed reached 55 kt, thrust in the right engine dropped in 20 seconds to 40%. After a callout (or else after approximately 30 seconds), pilots were instructed to continue the circuit at 800 instead of 1,000 ft, to limit the run’s duration. When 490 ft was reached, there was a brief dip in power (3 seconds) of the still fully functioning (left) engine. Pilots were immediately informed that both engines were unreliable and that they could keep using them both. This event was included to ensure that pilots were able to apply differential throttle as a means to stabilize the plane during the latter part of the run. Finally, the rudder’s effectiveness decreased to 20% when pilots rolled out of the turn toward downwind, decreasing their ability to counter the thrust differential that was caused by the engine failure.
A successful landing was more likely if pilots identified the failures, compensated for the disturbances (potentially by commanding asymmetric throttle), and projected how the decrease in speed during the landing would affect these disturbances. Whereas the first two steps were practiced explicitly in the practice session, finding a solution for the landing was not. At the minimum control speed with a single engine (80 kt), the control surfaces can no longer be used to counter the moments resulting from the engine’s asymmetric thrust. One solution is to maintain high speed during the landing, keeping the control surfaces effective. A second solution is to apply little throttle and make a steeper landing. As an additional measure, the thrust asymmetry caused by the engine failure can be reduced by commanding differential throttle, that is, by reducing power in the fully functioning engine.
Unrelated surprise test
An unrelated surprise test was included as a control test to evaluate whether the groups responded differently to a surprise event that did not feature the practiced principles. Although the groups were balanced as best as possible, inadvertent differences in preexisting skills (e.g., due to company training) or traits could still exist. The test was also included to provide both groups with a surprise so that potential differences in expectations were reduced between the groups. Finally, this test served to separate the related surprise test from the practice. The run started with the same instructions and settings as the related surprise test. From the moment of liftoff, the indicated airspeed decreased 1 kt/s from the actual airspeed. Pilots could identify the problem by checking whether the apparent decrease in speed corresponded with the pitch angle, vertical speed, control responsiveness, or ground speed. If pilots correctly called out the problem, they were instructed to finish the circuit. Otherwise, they were allowed to make an emergency landing.
Manual skill pre- and posttest
After the familiarization section, pilots performed a manual skill pretest, which was repeated as a posttest. This test was included to check whether manual flying skills in the groups were different at the start or whether they were differently affected by the practice. It contained a precision steering task requiring comparable manual skills as the related surprise test (i.e., performing a landing with ailerons only in moderate crosswind). The task started in approach, approximately 2 minutes from touchdown, with moderate crosswind from the left. It was announced that before the runway was reached, the rudder would become fixed in the neutral position. It was also announced that nose wheel steering would become inoperative due to this malfunction and that the nose should be pitched up as long as possible during the rollout. Pilots were asked to follow the glide slope (indicated by the PAPI lights or precision approach path indicators) and to land on the centerline as accurately as possible.
Dependent Variables and Hypotheses
Practice session
The time to correct callouts was obtained with the voice recorder. This time was defined as the time from the start of the malfunction to the utterance of the malfunctioning system (i.e., “engine,” “rudder,” or “speed indicator”). These times were measured in every first run of a block during the practice (see Table 4), as these runs were designed to be (maximally) different in predictability between the groups. The hypothesis was that the U/V group would have more difficulties with determining the problems, thereby causing longer correct callout times.
Further manipulation checks of the practice included the total time that participants were controlling the aircraft and the pilots’ interest and enjoyment, as measured with the Interest and Enjoyment subscale (seven items) of the Intrinsic Motivation Inventory (Ryan, 1982). The outcomes of these checks should be similar for the two groups.
Tests
In the related surprise test, the main performance measure was whether pilots managed to successfully land on the runway. Second, the throttle setting of the fully functioning engine was measured when the minimum control speed of 80 kt was reached. This provided an indication of pilots’ awareness of the problem of commanding too much throttle during landing. Finally, the proportion of time in which pilots applied differential throttle (in the effective direction) was computed in the final stage of the run (i.e., from the rudder failure to touchdown). A differential was defined as a left-right difference of at least 10% of the maximum throttle.
Correct callout times (see practice session) following the single-engine failure and the rudder failure were measured in the related surprise test and following the airspeed indicator malfunction in the unrelated surprise test. Incorrect or missing callouts were counted as missing cases.
In the manual skill pre- and posttest, the root mean square of elevator and aileron corrections was obtained in the last phase of the landing (35 seconds to 5 seconds before touchdown). To discard low-frequency components (e.g., caused by trim), these inputs were first high-pass filtered (forward and backward) with a second-order Butterworth filter with a cutoff frequency of 0.1 Hz.
At the end of the entire simulator session, pilots rated their experiences following the apparent airspeed problem (unrelated surprise test), the single-engine failure, and the rudder failure (related surprise test). From the latter two ratings, one general score was obtained by taking the mean of each pair. Subjective surprise and startle were rated on a 5-point Likert-type scale in answer to the following questions: “How surprised were you when you discovered the issue?” and “How startled or shocked were you when you discovered the issue?” (1 = not at all, 5 = extremely). Understanding was rated similarly by answering “How difficult was it to understand what had happened?” These scores were then reversed.
Improved performance, including faster correct callout times and higher reported understanding, was expected in the U/V group in the related surprise test. This group was expected to feel less threatened and less confused by the problems, causing them to report less startle (Martin, Murray, Bates, & Lee, 2015) and surprise (Foster & Keane, 2015). In the unrelated surprise test, the measures of performance were callout times and reported understanding. These measures, as well as reported surprise and startle, were not expected to differ between the groups in this test. The manual skill tests were expected to show an increase in manual skill from pre- to posttest due to familiarization with the controls. No other differences were expected, since the groups should be equally balanced and become equally familiarized with steering and landing due to the practice.
Data Analysis
Differences between the groups in the surprise tests were tested separately with independent-samples t tests or with Pearson’s chi-square test in case of binominal data. Differences between the groups in correct callout times during the practice were tested with Group × Block mixed-model analyses of variance. Manual skill in the pre- and posttest was analyzed with Group × Test mixed model analyses of variance. Significant main effects of group and significant interaction effects were followed up with group comparisons. The significance level of reported significant results was set at p < .05. Holm-Bonferroni correction for multiple comparisons was applied separately to the performance measures, correct callout times, and subjective measures.
Results
Manipulation Checks of the Practice
Callout times
Figure 3 shows boxplots of the correct callout times, and Table 5 lists the corresponding statistical analyses. Correct callout times were overall longer in the U/V group than in the control group, indicating that the U/V group spent more time making sense of the events. In the flyby runs with rudder malfunction, this was the case in both blocks, whereas in the flyby runs with the engine failure, this was the case in the first block only. The takeoff runs with engine failure were excluded from statistical analysis due to an insufficient number of valid cases in the control group in the first run (n = 1). Missing cases in all scenarios resulted from pilots giving no callout, giving only an incorrect callout, or indicating that they did not know the cause of the problem.
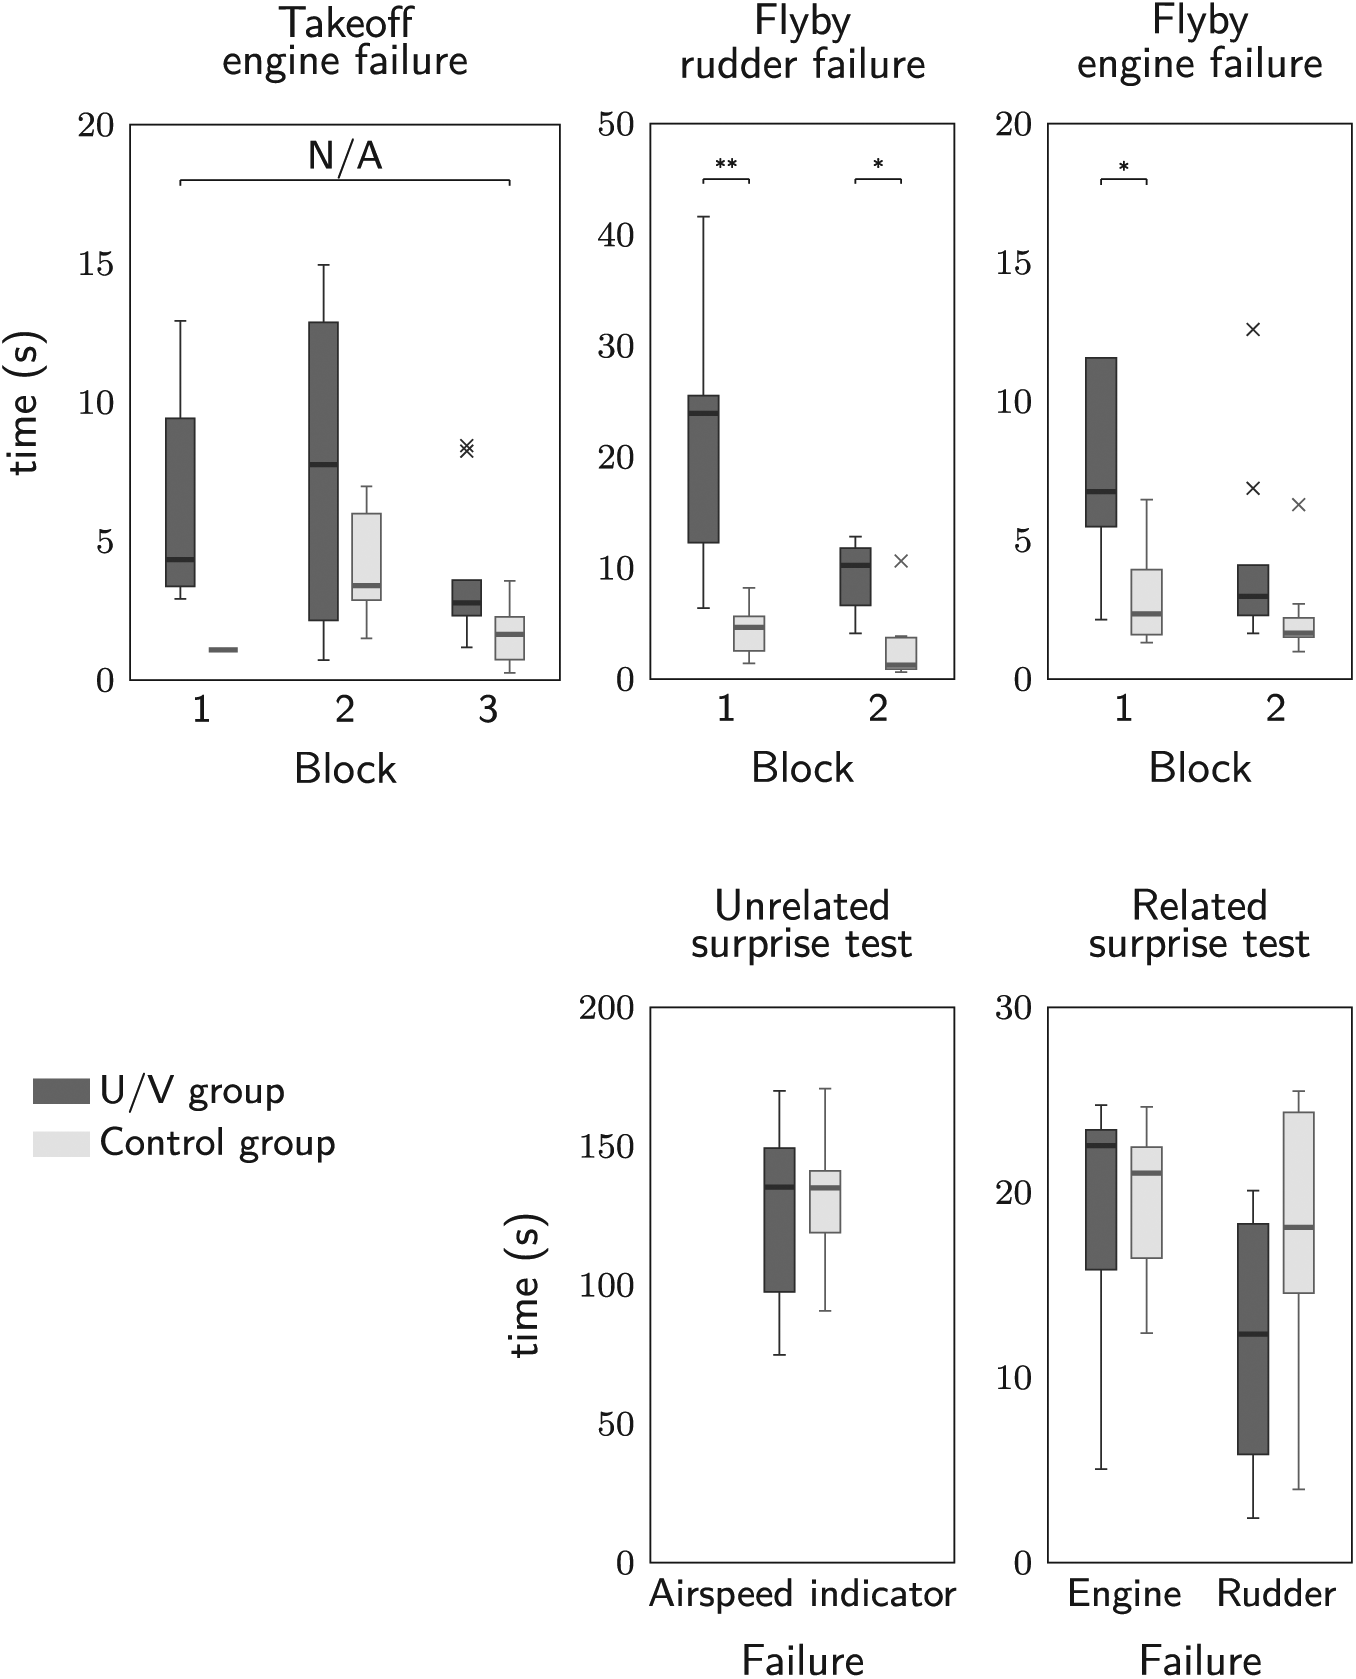
Tukey boxplots of the correct callout times in the practice session (top plots) and the unrelated surprise test and the related surprise test (bottom plots). Values are presented as median, interquartile range, and outliers. *p < .05. **p < .01.
Statistical Analysis of the Correct Callout Times During the Practice
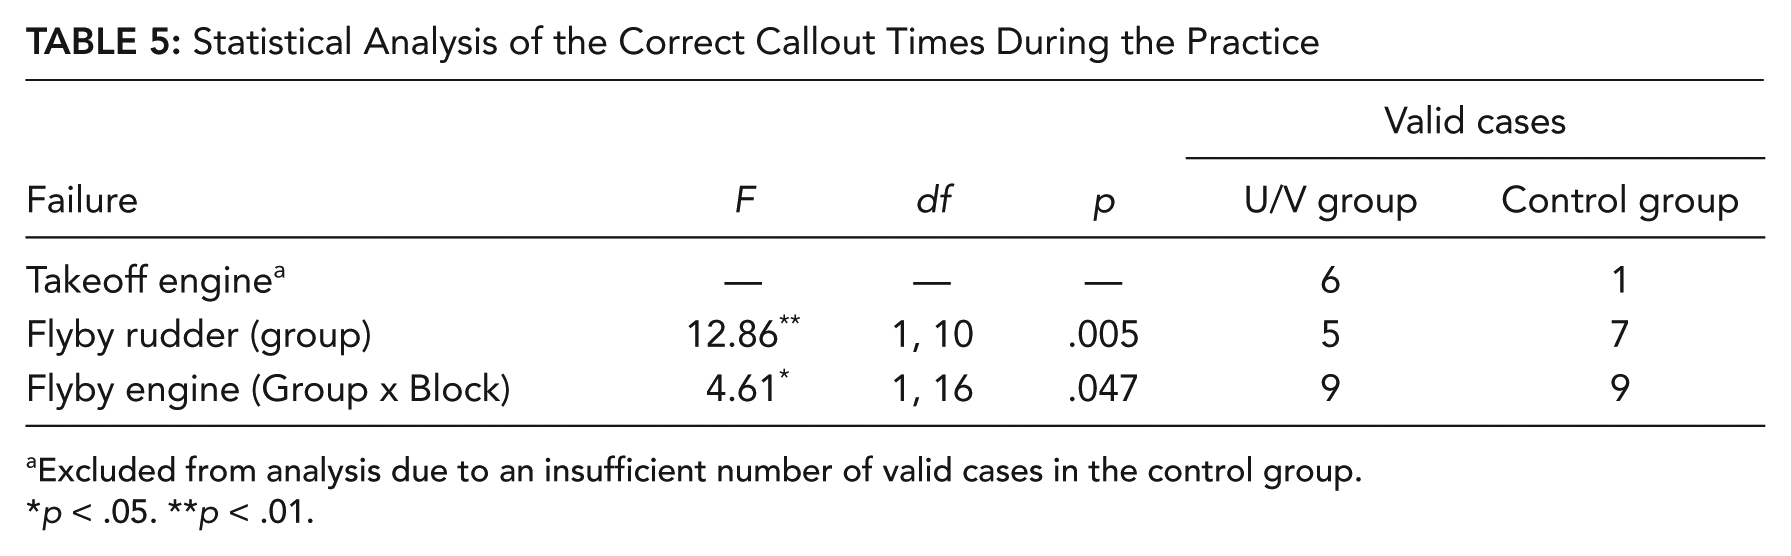
Excluded from analysis due to an insufficient number of valid cases in the control group.
p < .05. **p < .01.
Flight time
The time controlling the aircraft in the practice session did not differ significantly between the groups, p = .670. The mean flight time in the practice session was 29 minutes 47 seconds, SD = 1 minute 14 seconds.
Interest and enjoyment
There was no significant difference in scores on the Interest and Enjoyment subscale of the Intrinsic Motivation Inventory, t = .555, p = .586, indicating that the control practice, mean = 43.90, SD = 3.90, was not perceived as less interesting than the U/V practice, mean = 44.70, SD = 2.36. Both groups rated the practice near the maximum score (i.e., 49), suggesting that the pilots generally found the practice interesting and enjoyable.
Related Surprise Test
Performance
The run was completed with a successful landing on the runway by 9 of 10 pilots in the U/V group and by 2 of 10 pilots in the control group. This difference was significant, χ2(1, 19) = 9.90, p = .002. One pilot in the U/V group and four pilots in the control group landed somewhere else. Four other pilots in the control group lost control in-flight, and the simulation was stopped due to an extreme attitude at a low altitude (<300 ft; see, e.g., Figure 4). Unsuccessful landings always involved moments of losing aileron authority. Three pilots in the control group responded to loss of aileron authority by increasing throttle, which exacerbated the problems. The average throttle setting when 80 kt was reached at the end of the circuit was significantly lower in the U/V group than in the control group (Table 6), meaning that the U/V group appeared to use a more favorable throttle/speed ratio during the landing. The U/V group also applied differential throttle during a larger proportion of the last part of the run (Table 6). Two pilots in both groups did not apply it at all, and two pilots in the control group applied it solely in the opposite direction.
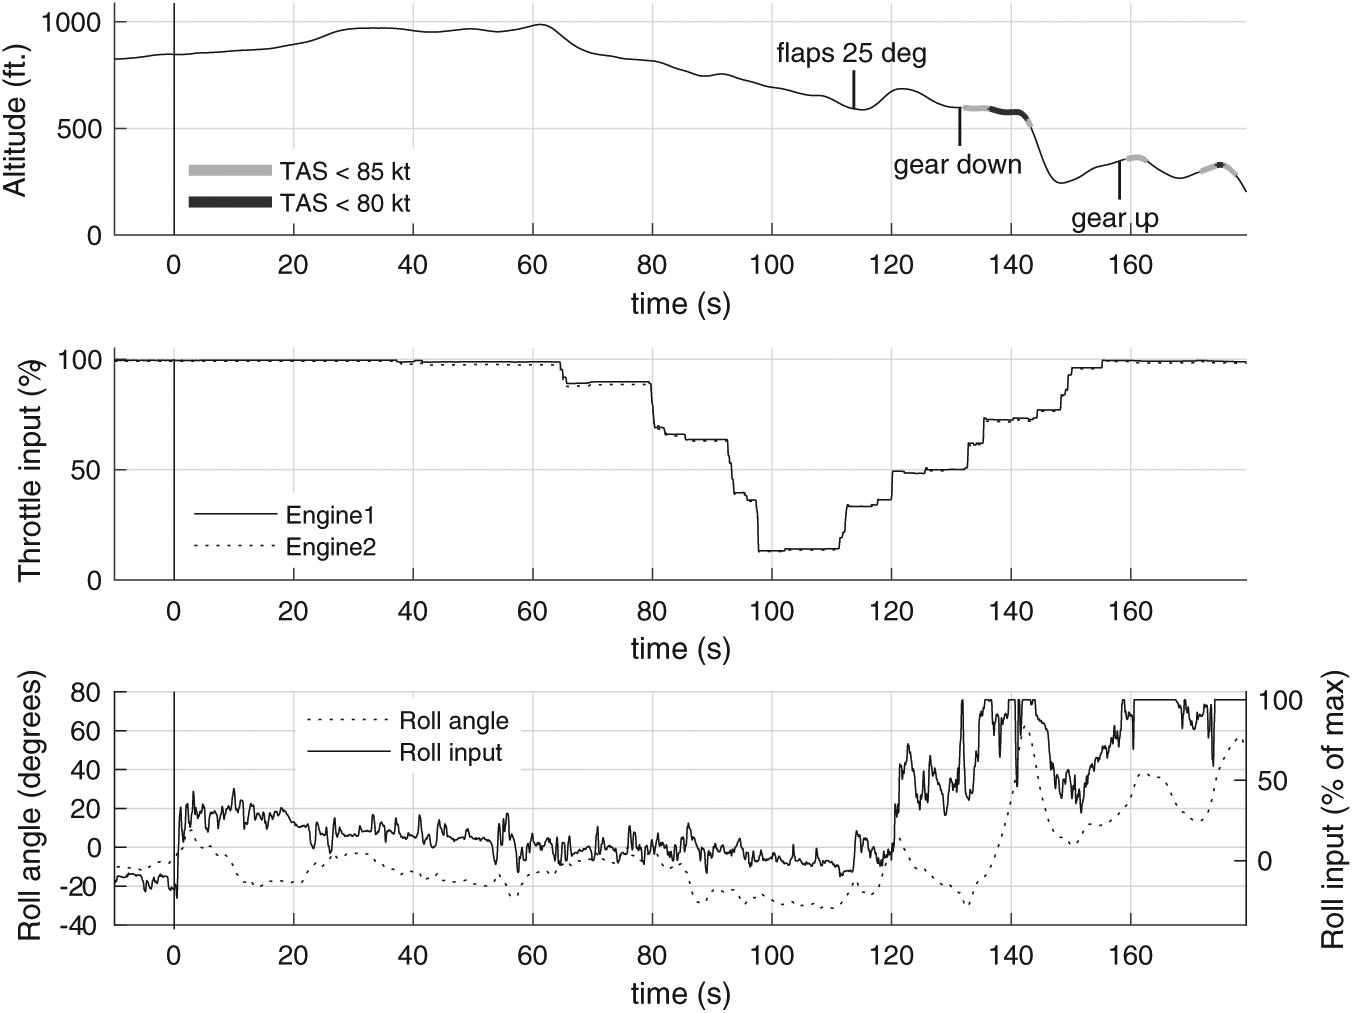
The altitude and speed (top), throttle input (middle), and roll angle and roll inputs (bottom) during a run with of loss of control in the related surprise test.
Group Differences in the Related Surprise Test
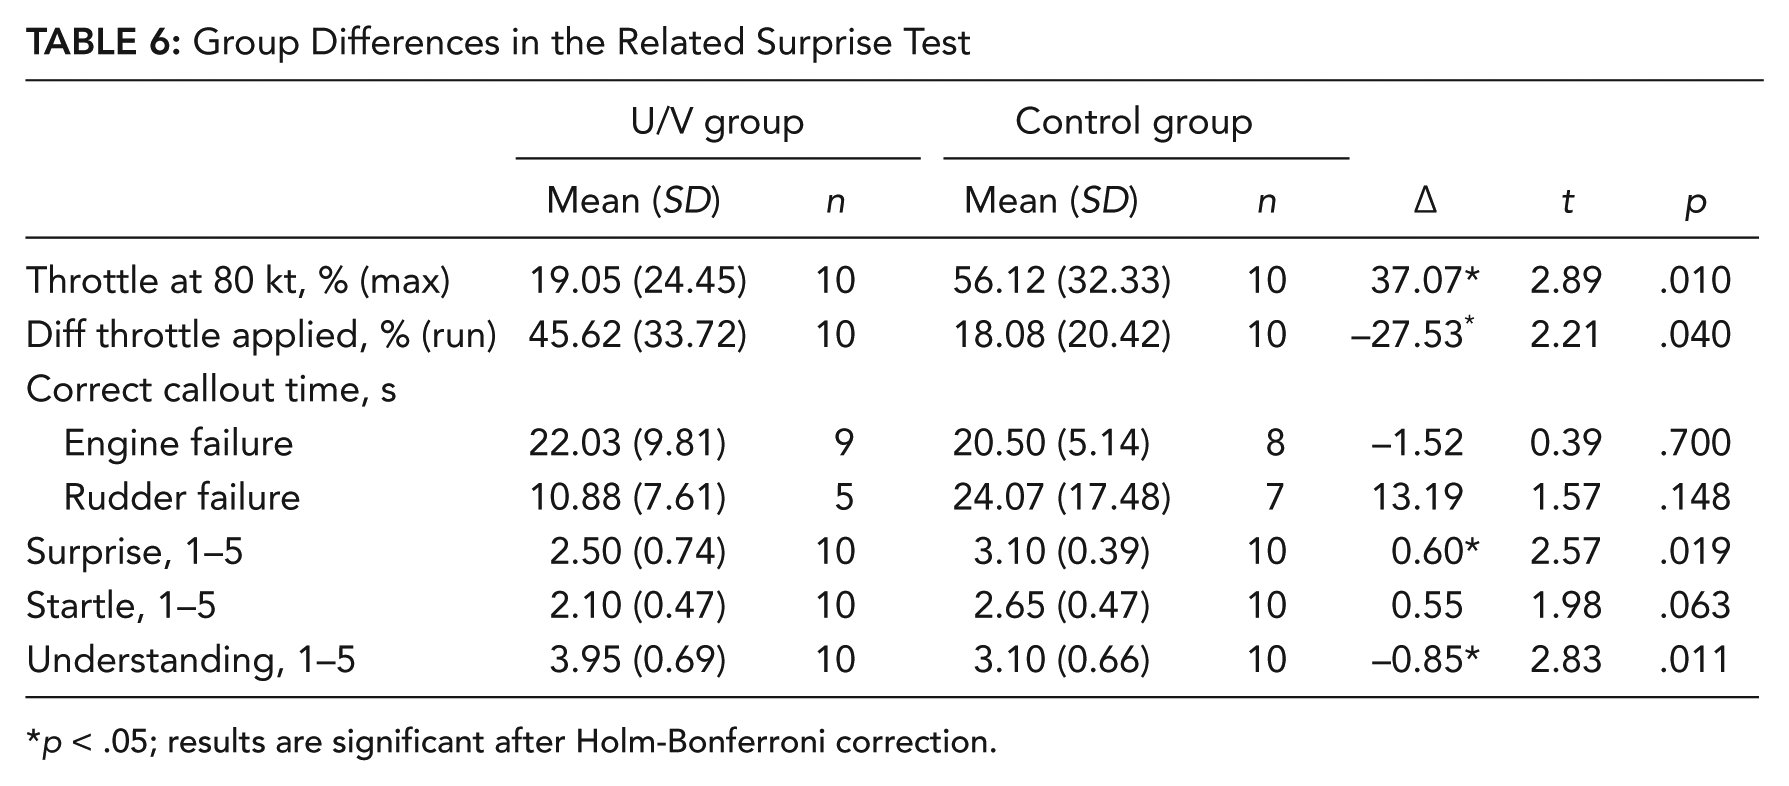
p < .05; results are significant after Holm-Bonferroni correction.
Performance example
Figure 4 shows an example in which a pilot lost control. No differential throttle was applied during the run (middle plot). On base leg, flaps were set to 25°, and gear down was selected (top plot). This caused the speed to rapidly drop below 85 kt around 135 seconds (top plot). The pilot responded to this by increasing throttle (middle plot). In turning towards the runway, aileron authority was lost, as indicated by the increasing bank angle despite maximum inputs in the opposite direction (also positive per convention) at 140 seconds (bottom plot). Altitude was traded for speed at 145 seconds (top plot), and gear up was selected again to decrease drag. Despite these efforts, the decreasing speed caused loss of aileron authority again at 160 seconds and 170 seconds, after which the run was stopped to prevent a crash.
Callout times
There were no significant differences between the groups in correct callout times (see Table 6 and Figure 3). Missing values included four pilots who did not identify the malfunction and four pilots who did not give any callout, perhaps due to being too absorbed in the task. None of the missing cases involved incorrect callouts. When filling in the questionnaire after the test, all pilots indicated that they had noticed increasing controllability issues in downwind.
Subjective ratings
The events were rated as significantly easier to understand and as less surprising by the U/V group versus the control group (Table 6). Startle scores did not differ significantly between the groups, although there was a trend toward lower scores in the U/V group (p = .063). Pilots were on average moderately surprised (around 3.0) by the events, indicating that the surprise manipulation was successful. The maximum rating of surprise was 4 (very) for all events. Startle ratings were on average slight (2.0) to moderate (3.0). The maximum startle rating was 5 in the unrelated surprise test, 4 for the rudder failure, and 3 for the engine failure. One pilot in the U/V group broke off the takeoff. The scenario was repeated with the instruction to continue the takeoff, and the subjective ratings of the engine failure were obtained with regard to the first run.
Unrelated Surprise Test
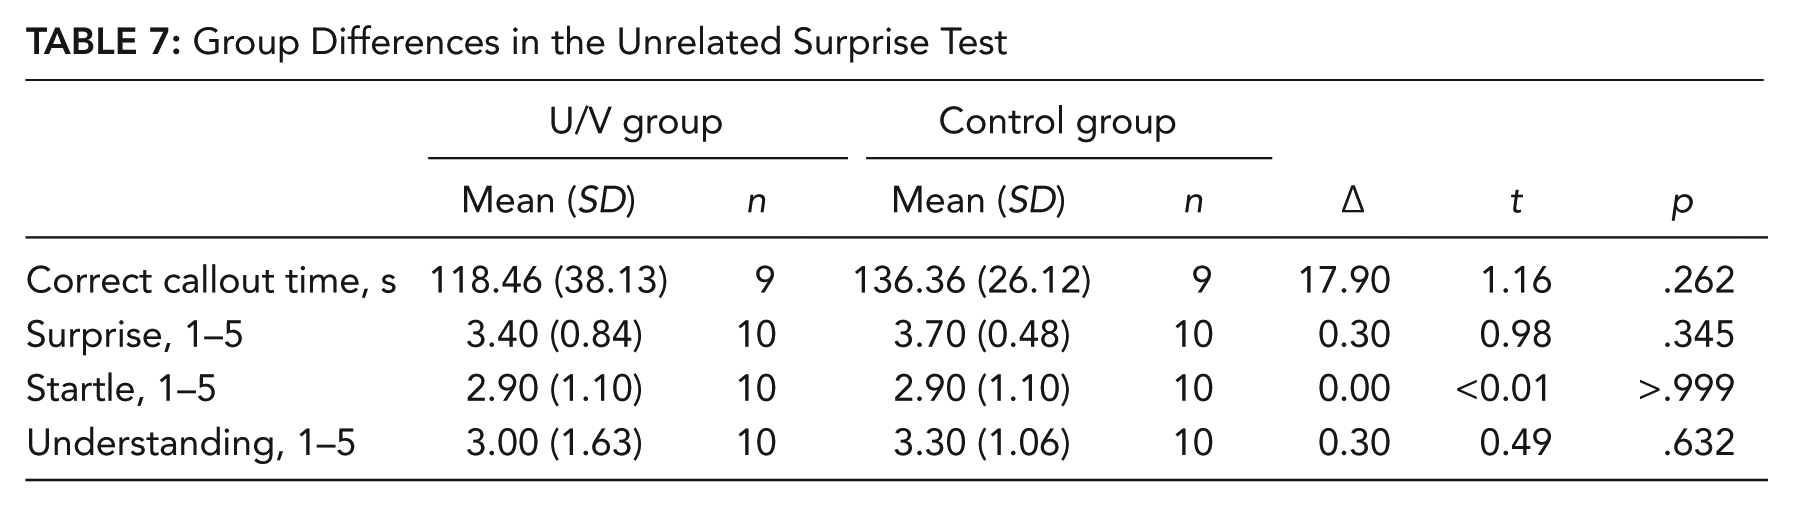
Table 7 lists the outcomes of the unrelated surprise test. There were no significant differences between the groups in any of the measures. One pilot in the U/V group did not identify the problem and performed an emergency landing. One missing case in the control group was caused by a simulator malfunction during the run.
Group Differences in the Unrelated Surprise Test
Manual skill pre- and posttest
In the posttest versus the pretest, both groups used significantly fewer inputs on the ailerons, F(1, 18) = 7.29, p = .015, and on the elevator, F(1, 18) = 23.15,p < .001, indicating increased familiarization with the controls. There were no significant differences between the groups in aileron and elevator inputs (p = .522 and .354, respectively), nor were there significant Group × Test interaction effects (p = .421, p = .831, respectively), indicating that the practice had not affected manual skill of the groups differently.
Discussion
The results of this simulator experiment show that pilots who had received the U/V practice used throttle and airspeed more effectively in a novel and unexpected situation, which resulted in more successful landings. The subjective ratings confirmed that the U/V group found it easier to understand the events in the test and reported, perhaps as a consequence, significantly less surprise (Foster & Keane, 2015). The control tests suggested that the results in the related surprise test were not attributable to preexisting differences between the groups or to differences in habituation to surprise or familiarization with the controls. Three pilots in the U/V group lost aileron authority during the practice session, which may have affected their performance in the related surprise test. However, the difference in successful landings between the groups is still statistically significant when these pilots are excluded. In addition, three pilots in the control group also experienced loss of aileron control early in the related surprise test (before turning to base leg).
The surprise ratings in the tests were generally higher than the startle ratings, indicating that the events were foremost unexpected but did not include very intense or threatening stimuli. Interestingly, the difference between the groups in startle and surprise ratings was similar in magnitude, but that of startle did not reach statistical significance due to a larger variance. Something similar was observed in a previous study (Landman et al., 2017b), so it may be indicative of a higher interpersonal variation in startle responses, or a larger variation in interpretation of the startle rating scale. In this respect, it is worth contemplating the value of averaging surprise and startle responses. Although it is required for the statistical analysis of training effectiveness, individualized pilot training may benefit more from the evaluation of individual surprise and startle responses.
A limitation of the study is that the practice session was very brief and the pilots were not trained to proficiency. There was little time between the practice and the surprise test, so the study provides no insight into long-term effects of U/V practice. Before U/V is implemented in pilot training, factors such as the optimal degree of U/V, which aspects of tasks to make unpredictable or variable, and the optimal stage of training to introduce U/V should be carefully considered. Finally, it cannot be ruled out that unintended differences between the groups existed.
The results are interesting in the light of contemporary theories on surprise and sensemaking (e.g., Klein, Moon, & Hoffman, 2006; Landman et al., 2017a; Zhang et al., 2008). According to this theoretical framework, the U/V group, as compared with the control group, was more stimulated to perform sensemaking activities during the training, which helped them to develop a better “frame” with regards to the effects of asymmetric thrust, control inputs, and airspeed on aircraft behavior. Since this frame was applicable in the related surprise test, it may have helped the U/V group to make sense of the events more quickly and extensively. In line with previous literature on frame or schema construction (e.g., Neisser, 1976; Schmidt, 1975), our results imply that obtaining knowledge about principles that overarch specific training experiences is essential for building resilient complex skills. The current study also suggests that U/V training is a means to obtain such resilience (see also, Van Merriënboer et al., 2002). Future research may be aimed at investigating whether more general problem-solving skills exist (e.g., “flexible procedures”; Field, Rankin, Mohrmann, Boland, & Woltjer, 2017), which can be effectively applied in situations that are entirely new and unpracticed.
In conclusion, the results show that organizing part of pilot training in a U/V way can be an effective means to improve the generalization of skills to in-flight situations that are not explicitly trained. Also, they suggest that one-sided and predictable training is insufficient as a means to prepare pilots for unexpected and novel situations.
Key Points
The addition of unpredictability and variability to a simulator training session improved pilot responses in a surprise test that required an application of the practiced skills.
Control tests suggested that the effects were not attributable to habituation to surprise or familiarization with the controls.
The outcomes indicate that predictable and one-sided training scenarios are insufficient to prepare pilots for unexpected situations in-flight.
Footnotes
Acknowledgements
We thank Herman Koolstra, PhD, for helping us develop and tune startling flight scenarios. In addition, we are grateful for the useful comments provided by the reviewers to improve the final manuscript.
Annemarie Landman received her MSc in Human Movement Sciences from the VU University Amsterdam in 2011. She is currently a PhD candidate at the faculty of Aerospace Engineering, TU Delft.
Peter van Oorschot received his MSc in Aerospace Engineering (Control and Operations) at the TU Delft in 2017.
M. M. (René) van Paassen received his MSc degree and PhD degree in Aerospace Engineering at the TU Delft, in 1988 and 1994, respectively. He is currently an associate professor at the Faculty of Aerospace Engineering, TU Delft.
Eric L. Groen earned his PhD in biology in 1997 from Utrecht University. He is currently is a senior scientist in the Multimodal Interface Research Group, Human Interfaces Department, at TNO Human Factors.
Adelbert W. Bronkhorst received his PhD in audiology in 1990 from the medical faculty of the VU University Amsterdam. He is currently a principal scientist at TNO Human Factors, and professor by special appointment of Applied Cognitive Psychology at the VU University Amsterdam.
Max Mulder received his MSc degree and PhD degree in Aerospace Engineering from TU Delft, the Netherlands, in 1992 and 1999, respectively. He is currently a full professor at the Faculty of Aerospace Engineering, TU Delft.