
Abstract
We propose using Stochastic Frontier Analysis to estimate pupils’ academic underachievement. We model underachievement as the gap between expected achievement and actual achievement, not due to a learning disability. Our data are a panel for 2,228 Belgian pupils observed over 6 years of primary education. We found that the average underachievement gap is 23.5%. That is, the average pupil does not exploit about one fourth of their potential. Gifted pupils appear to underachieve as much as non-gifted pupils. We also found that class size is a determinant of underachievement. The association between class size and underachievement is non-monotonic, with an underachievement minimum at a class size of about 20 pupils.
Underachievement in education is a waste of talent and resources. It is important for both the individual and society that education enables individuals to fully exploit their potential, that is, transform ability into maximum possible outcome. Despite potential performance gains from reducing underachievement, most research has focused on the measurement of low achievement, not underachievement. Broadly defined, low achievers have poor outcomes relative to their peers but do not necessarily underperform given their potential. By contrast, underachievers exhibit a severe discrepancy between expected achievement and actual achievement, not due to learning disabilities (McCoach & Siegle, 2003). While low achievers can easily be identified by observing outcomes, for example, test scores, the identification of underachievers is difficult as potential outcomes are unobservable. It is particularly challenging to identify gifted underachievers who typically have average or even high outcomes, but still perform below their estimated potential. Besides wasting resources and talent, not identifying underachievers risks boredom and demotivation (Acee et al., 2010), potentially leading to a downward spiral in performance. Also, underachievement may be positively associated with the risk of dropout (Peterson, 2000), which has severe consequences in terms of earnings, health, life expectancy, and overall happiness (Oreopoulos & Salvanes, 2011).
Our contribution is twofold. First, we propose to model underachievement using regression-based Stochastic Frontier Analysis (SFA) in the context of an education production function (Hanushek, 1986). SFA is commonly applied to estimate unobserved managerial inefficiency in firm production where inefficiency is the gap between actual and potential output given inputs (Anaya & Pollitt, 2017; Badunenko et al., 2021; Ferrantino & Ferrier, 1995). Intuitively, SFA estimates a frontier (or benchmark) to obtain pupils’ potential test scores given observed characteristics such as ability and socioeconomic status, and compares this frontier with actual test scores. SFA achieves this by decomposing the error term in a regression model into a symmetric normal random variable that represents measurement error, and an asymmetric negative half-normal random variable that represents underachievement. Thus, we define underachievement as the difference between an estimated best practice frontier and an individual’s actual performance.
Our second contribution is to apply the model to investigate the influence of class size on underachievement. Class size is important because it is often at the discretion of the school manager and has budget implications (Denny & Oppedisano, 2013; Hoxby, 2000). While there is a large body of literature on the influence of class size on achievement, to our best knowledge we are the first to analyze the influence on underachievement. Prior results for the influence of class size on achievement are mixed. Whereas some studies found that pupils’ achievement is reduced in larger classes (Bressoux, 2009; Krueger, 1999), other studies found no effect (Dieterle, 2015; Hoxby, 2000), and still others found that pupils’ achievement improves in larger classes (Denny & Oppedisano, 2013). We are able to potentially reconcile these diverse results by applying a specific SFA model that allows for a non-monotonic influence of class size on academic underachievement (Wang, 2002).
We applied the model to unique longitudinal survey data for Belgian pupils. The data include 2,228 pupils from the Flemish community of Belgium, observed over 6 years of primary education. Primary education in Flanders is a good setting to study underachievement because there is no ability grouping or tracking in Flemish primary education, and no standardized exams. The absence of ability grouping may lead teachers to orientate their teaching towards the average student (Van Klaveren & De Witte, 2014), exacerbating underachievement at the tails. Moreover, without a system of external accountability, there is less incentive for teachers to improve the achievement of low-performing students.
The SFA method for measuring underachievement departs from the methods used in the previous literature. Irrespectively of the method used, previous estimates of the share of underachievers vary from as low as 9% (Schick & Phillipson, 2009) to as high as 49% (Reis et al., 2004); see White et al. (2018) for a review. Although methods to measure underachievement vary by disciplinary origin, most of the literature on underachievement is in education and psychology disciplines. We identified two main methods: nomination, and a comparison of aptitude tests with achievement tests. The first method, nomination, uses teachers’, parents’, or peer assessment to identify underachievers (Abelman, 2006; Lau & Chan, 2001; Snyder et al., 2021). For instance, Snyder et al. (2021) asked teachers: “How well is this child performing in reading compared to how well you believe she could?” Nomination is widely used by practitioners such as student counsellors. Although easy to apply, this measure suffers from subjectivity bias and often fails to identify gifted underachievers. The share of underachievers may depend on who does the nominating. For instance, Lau and Chan (2001) found that out of 15 potential underachievers, only three were nominated by both teachers and pupils’ peers. One potential solution may be to ask pupils themselves whether they are underachieving (Gohm et al., 1998). However, pupils are unlikely to be aware of their true potential, especially at a young age. Ziegler and Stoeger (2003) found that most pupils assessed themselves to be of average intelligence, regardless of their IQ score.
The second method identifies underachievers through a comparison of aptitude test scores (e.g., IQ test) with achievement test scores (e.g., mathematics or reading). There are four varieties: the absolute split method, the simple difference score method, the regression method, and the optimal achievement model. First, the absolute split method defines underachievers as pupils who score higher than a certain threshold on the aptitude test but score lower than a certain threshold on the achievement test. This method is typically employed to identify gifted underachievers (Matthews & McBee, 2007; Ritchotte et al., 2014; Schick & Phillipson, 2009). For instance, Schick and Phillipson (2009) define underachievers as students who score above 115 on an IQ test and below 4 on a 5-point scale grade-point average. Second, the simple difference score method calculates a discrepancy score by subtracting the standardized achievement test score from the standardized aptitude test score. If the discrepancy score is higher than a specified threshold, usually one standard deviation, a student is identified as an underachiever (Obergriesser & Stoeger, 2015; Stoeger & Ziegler, 2013; Ziegler & Stoeger, 2003). A third variety regresses achievement test scores on aptitude test scores and defines underachievers as observations that lie a certain distance below the regression line, that is, have a sufficiently large positive error term (Dixon et al., 2006; Preckel & Brunner, 2015). Although these methods are less subjective than nomination, they require an arbitrary threshold, the choice of which influences the amount of underachievement (White et al., 2018). As a fourth variety, the optimal achievement model aims to correct for the arbitrariness of the threshold by converting both aptitude test scores and achievement test scores to logits and using a 95% confidence interval as a threshold for the discrepancy (Phillipson, 2008; Phillipson & Ka-on Tse, 2007). Although this method provides a less arbitrary threshold, it is highly sensitive to outliers and it does not account for any control variables. These regression-based methods are conceptually similar to SFA but there are important differences. In contrast to SFA, standard regression errors are deviations from the average performance, not best practice performance. Also, as it is likely that achievement scores have a random error component, the SFA method explicitly separates this random component from underachievement.
Outside the education and psychology literature, a third method identifies underachievement using Data Envelopment Analysis (DEA; Silva Portela, 2001; Thanassoulis, 1999). This method stems from economics and is widely used to estimate managerial inefficiency in production. DEA estimates a production frontier indicating the potential scores pupils could achieve and compares this with the scores pupils actually achieve. Consequently, DEA solves most problems identified in the previous methods: it is not based on subjective judgment, it does not include an arbitrary threshold, it compares the performance of a student to the best performers in the sample, and it allows for environmental factors. A drawback of DEA models is that they do not allow for a stochastic error; they assume that the outcome variable is measured without error. Given that both aptitude and achievement test scores are an imperfect proxy of aptitude and achievement respectively, this assumption is unlikely to hold. Therefore, DEA may yield biased underachievement estimates (Ehrgott et al., 2018; Ruggiero, 2004; Schiltz et al., 2020). Moreover, even in a conditional DEA model, it is difficult to control for a wide variety of control variables as the underlying kernel function suffers from dimensionality issues (De Witte & Kortelainen, 2013). The method proposed in this paper, Stochastic Frontier Analysis, is conceptually similar to DEA and also stems from production economics. Unlike DEA, however, SFA can include a large number of control variables and it allows for measurement error.
The Flemish Education System
The Flemish education system provides compulsory education between the ages of 6–18, or until a younger age if a student has already obtained a high school diploma. Before children enter compulsory education, they can enroll into kindergarten from the age of 2.5. With a participation rate of about 98.8% (Eurydice, 2018), almost all children attend kindergarten. Although most children enter primary education at age 6, parents may decide to enroll their child into primary education already at the age of 5.
Primary education lasts for 6 years, until the age of 12. A pupil may spend at most 8 years in primary education. The class committee (mostly consisting of the school principal and the teachers) decides whether a pupil may continue to the next school year or must repeat a grade. In school year 2020–2021, grade retention was 2% in Flemish primary education (Flemish Ministry of Education and Training, 2021). If pupils complete all 6 years of primary education, they receive a certificate of primary education. Parents may choose any elementary school for their child; there are no catchment areas or standardized admission tests. Places are allocated on a first come, first served basis until the capacity of the school is reached. Pupils are not grouped according to ability. The school board decides how pupils are distributed among classes and the number of pupils per class. In school year 2019–2020, a total of 442,961 pupils were enrolled into primary education, of which about 10% were of non-Belgian origin and 22% did not speak Dutch at home (Flemish Ministry of Education and Training, 2021). The most represented groups of non-Belgian origin were children with Moroccan and Turkish parents. About 20% were from a disadvantaged socioeconomic background. The student base was equally distributed by gender. In general, one teacher teaches all the subjects, although specialists might teach in some schools. In general, a new teacher is assigned to the class each school year. Thus, teachers generally do not follow their classes over the years. Upon successful completion of primary education, pupils enter a tracking system in secondary education at the age of 12 that includes four main tracks: the general track (ASO), the technical track (TSO), the vocational track (BSO), and the arts track (KSO).
Empirical Method
Our empirical model of underachievement starts with a standard education production function (Hanushek, 1986) that relates an output to inputs as well as control variables. In our study, outputs and inputs are at the level of the individual i and control variables are at the level of the teacher t or school s:

In this model, the error term captures unobserved underachievement and random noise. In a second step, we decompose the error term


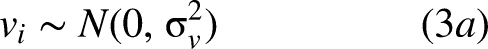
To identify the two error components, we required specific distributional assumptions. Following Wang (2002), we assumed a normal distribution for the stochastic error

Intuitively, the SFA model estimates an achievement frontier indicating the potential test scores pupils could achieve given observable characteristics and compares it with the test scores pupils actually achieved. Figure 1 illustrates this method for a single input: ability measured by IQ. The potential test score is marked by point B and the actual test score by point A. The gap between the two is represented by the line AB which, in turn, is decomposed into underachievement (AC) and measurement error (BC). Thus, given their IQ score, the pupil obtains a test score marked by point A. The counterfactual is that, with lower underachievement, they could have obtained a higher test score marked by point C.
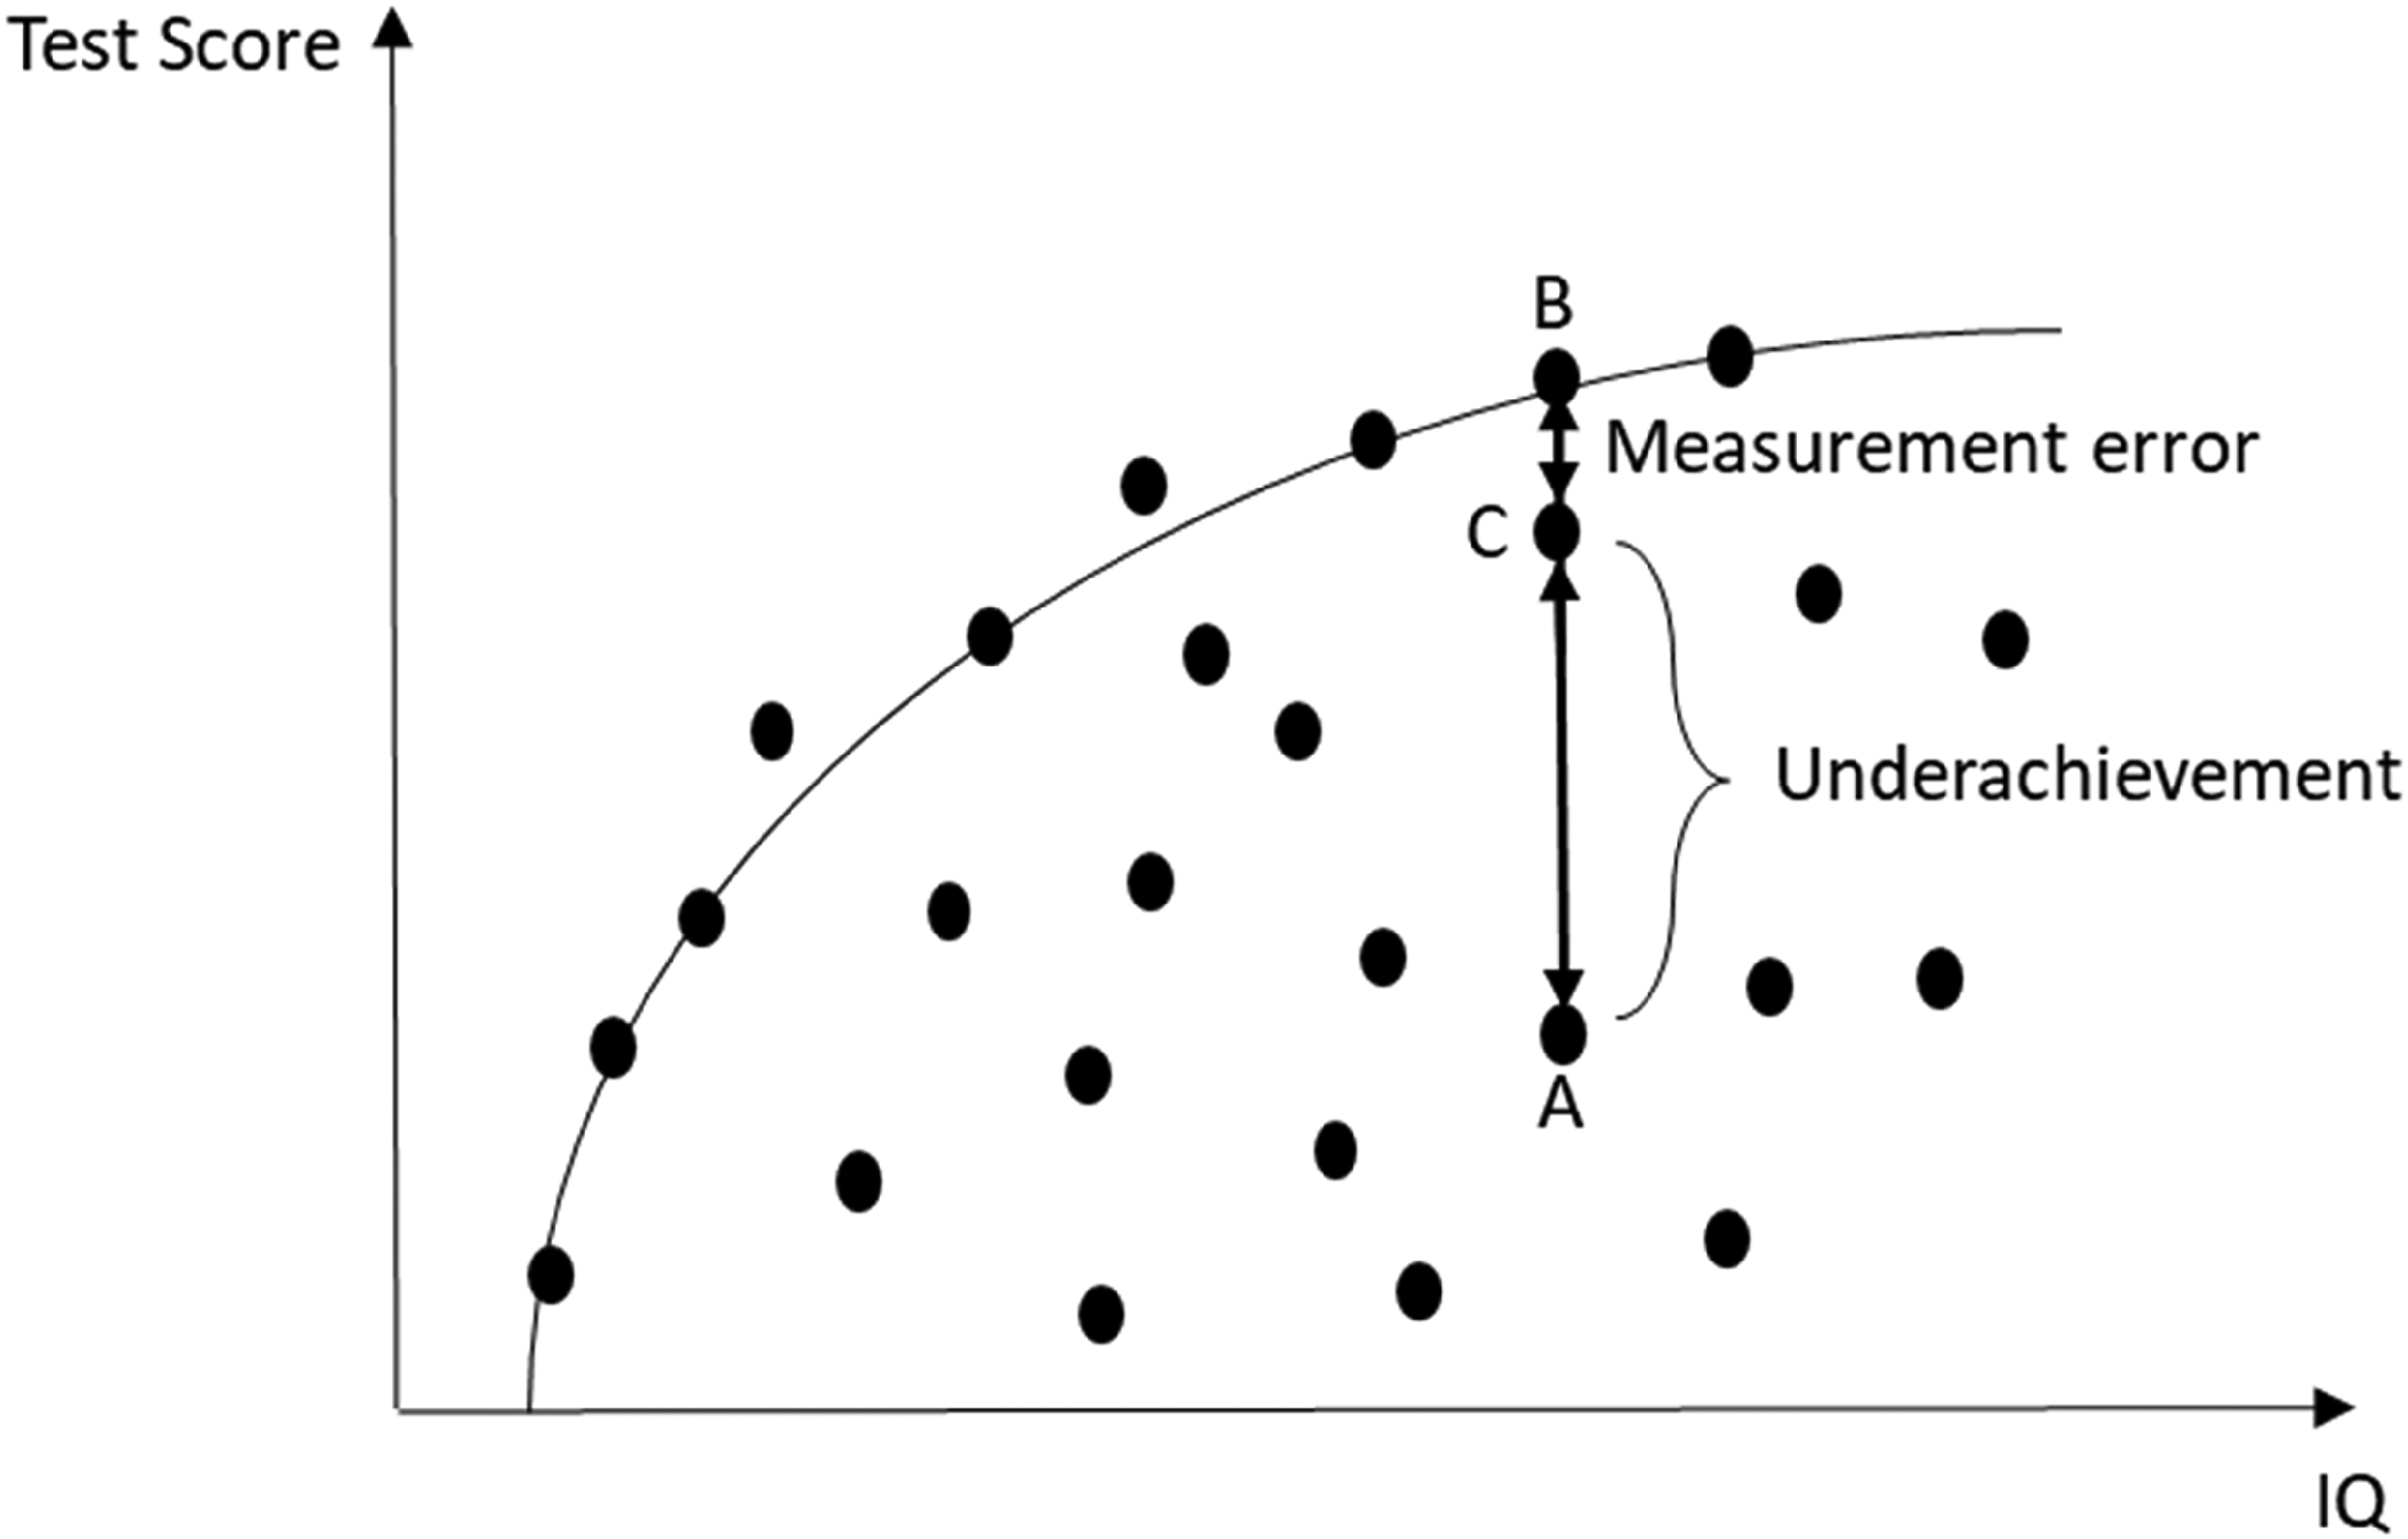
Two-Dimensional Representation of Underachievement Using Stochastic Frontier Analysis.
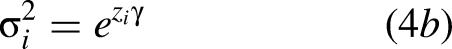
Further, it would be reasonable to think that underachievement itself has its determinants. We augment the model by adding class size as a determinant of underachievement. Instead of influencing achievement directly (as part of the frontier) it influences achievement indirectly through underachievement. Following the approach by Wang (2002), we let the mean and the variance of the underachievement distribution be a function of class size

Data
We applied the proposed Stochastic Frontier Analysis model to data from the Flemish community of Belgium. The dataset, SiBO (Schoolloopbanen in het Basisonderwijs), includes a random sample of 6,138 pupils, nested in 196 schools, which were followed from the last year of kindergarten (2002–2003) until the 1st year of secondary education (2010–2011). Thus, most pupils were born in 1997. The data oversample pupils from a lower socioeconomic background as the goal of the survey was to study school outcomes of disadvantaged pupils.
Our measure of output for the education production function was the mathematics test score from a test taken at the end of each school year. These tests were specifically designed each year to fit the needs of pupils. For instance, kindergarten focused on counting by means of picture associations, while in the 3rd year of primary education, the emphasis lay on multiplication and division. To enable comparison of test scores across the years, we standardize the mathematics test score variable by year to have zero mean and unit variance. As an indication of reliability, the mathematics test has a Cronbach’s alpha of 0.89, well above the conventional threshold of 0.7. Although the data also include language tests (reading and writing), we only use the mathematics score because language tests are subdivided into five different tests, each consisting of two different versions, making it difficult to interpret and compare these tests.
In the selection of inputs, we follow the previous literature on efficiency in education (see De Witte and López-Torres [2017] for an extensive overview). The main input of interest is an IQ test score. We also used the mathematics score in the beginning of the 1st year of primary education instead of IQ in Table A1 in the online supplemental appendix. This is consistent with earlier literature that measures mathematics potential by early mathematics ability (Fong & Kremer, 2020). Given that the results are very similar, we opted for the use of IQ as underachievement is mostly defined in the literature as a discrepancy between a measure of ability and a measure of achievement. The test is inspired by the CIT-3–4 verbal cognitive test (Stinissen et al., 1975) and the non-verbal Raven’s Standard Progressive Matrices Test (Raven, 2000). Whereas the first test is particularly suited for the Flemish primary education pupils, the latter is a test widely used in the underachievement literature (Lau & Chan, 2001; Obergriesser & Stoeger, 2015; Phillipson, 2008; Phillipson & Ka-on Tse, 2007) as well as the psychological literature on gifted pupils overall (see Worrell et al. [2019] for a review). The detailed procedure of the construction of the test can be found in Hendrikx et al. (2008) and the reliability, as measured by Cronbach’s alpha, is 0.93. The cognitive test was administered in the school year 2005–2006 when pupils were in third grade (usually at age 9). As such, mathematics test scores obtained before the third grade might influence the IQ score, leading to reverse causality and biased estimates of underachievement. For instance, Ritchie and Tucker-Drob (2018) found that an additional year of education increases cognitive abilities by approximately 1–5 IQ points. Nonetheless, if we take mathematics test scores at the beginning of the first grade as an alternative proxy for ability, our average estimate of underachievement is robust. It only slightly decreases by 1.1 percentage points (see Table A1 in the online supplemental appendix). Moreover, we do not claim to present causal evidence.
We include the following additional inputs. Gender is an indicator with value 1 for males and 0 for females. Previous literature is mixed on the association between gender and underachievement, with many but not all studies (e.g., Preckel and Brunner [2015]) reporting a higher incidence of underachievers among boys (McCoach & Siegle, 2003; Peterson & Colangelo, 1996). Origin is an indicator that is given a value of 1 if either the pupil or one of the parents was born abroad, and a value of 0 otherwise. Although this variable is rather a crude proxy of pupils’ immigration status, it has been widely used in previous educational studies in Flanders (Mazrekaj & De Witte, 2020; Van Houtte & Stevens, 2015), and is also reported by the Flemish Ministry of Education and Training. The prior literature suggests that pupils with a foreign origin are at a greater risk of underachievement (Siegle, 2013; Thanassoulis, 1999). The proxy for socioeconomic status is the first principal component for the following seven variables: highest diploma father, highest diploma mother, employment status father, employment status mother, occupational level father, occupational level mother, and family income. The data were collected through a questionnaire filled in by the parents when their children were in the 1st year of primary education. A higher value for the socioeconomic status variable indicates a higher socioeconomic status. The correlation between origin and socioeconomic status amounts to 0.35. Prior evidence shows that pupils from a lower socioeconomic background are more likely to underachieve. For instance, Wyner et al. (2007) found that 44% of low-income pupils in the United States who scored in the top 10% in the first grade, did not score in the top 10% in the fifth grade. Moreover, gifted low-income pupils progressed at half the rate of their gifted high-income peers.
Furthermore, we also include an indicator for grade retention given a value of 1 if the pupil repeated the current grade, and a value of 0 if the pupil progressed from the last grade. Earlier studies have found that grade retention can both increase and decrease pupils’ mathematics test scores in primary education, depending on the country studied (see Valbuena et al. [2021] for an overview). We used school and school year fixed effects to compare pupils only within the same school and year. This captures unobserved heterogeneity due to, for example, differences in school policy. Finally, we added four variables to control for teacher characteristics. Previous literature has shown that teachers are instrumental to tackling underachievement. Specifically, in their meta-analysis, Steenbergen-Hu et al. (2020) found that (gifted) underachievers particularly benefit from positive teacher–student relationships and one-to-one mentoring. Moreover, Siegle et al. (2014) found that knowledgeable teachers build students’ self-efficacy to learn, leading to lower underachievement. We included four collected characteristics: gender (1 = male, 0 = female), experience in years, effort (hours at home spent on work per week in addition to regular hours), and (intrinsic) motivation (α = 0.96). The latter is measured as an indicator given a value of 1 if the teacher agreed with the statement “for me, there is no better job than being a teacher.” Given that, within each grade, teachers generally teach only one class, teacher fixed effects are highly collinear with class size, such that we cannot include teacher fixed effects.
We restricted the sample in three ways. First, we only include observations for primary education and drop observations from kindergarten and secondary education because following individuals across these types of education is difficult in the dataset. Second, we restricted the sample to observations that include information on the family’s socioeconomic status. Although achievement and cognitive ability data were collected for the full sample of pupils, the parental survey was administered to a subsample of 3,534 pupils only. The exact subsampling procedure is reported in Reynders et al. (2005). Third, we dropped observations for 303 pupils with reported learning disabilities. As mentioned before, these pupils are generally not included in the definition of underachievement in the literature (McCoach & Siegle, 2003). Fourth, as we also analyze the development of underachievement over time, we removed 900 pupils for whom we do not observe all six grades of primary education. Finally, we dropped 103 pupils with missing values for at least one of the variables.
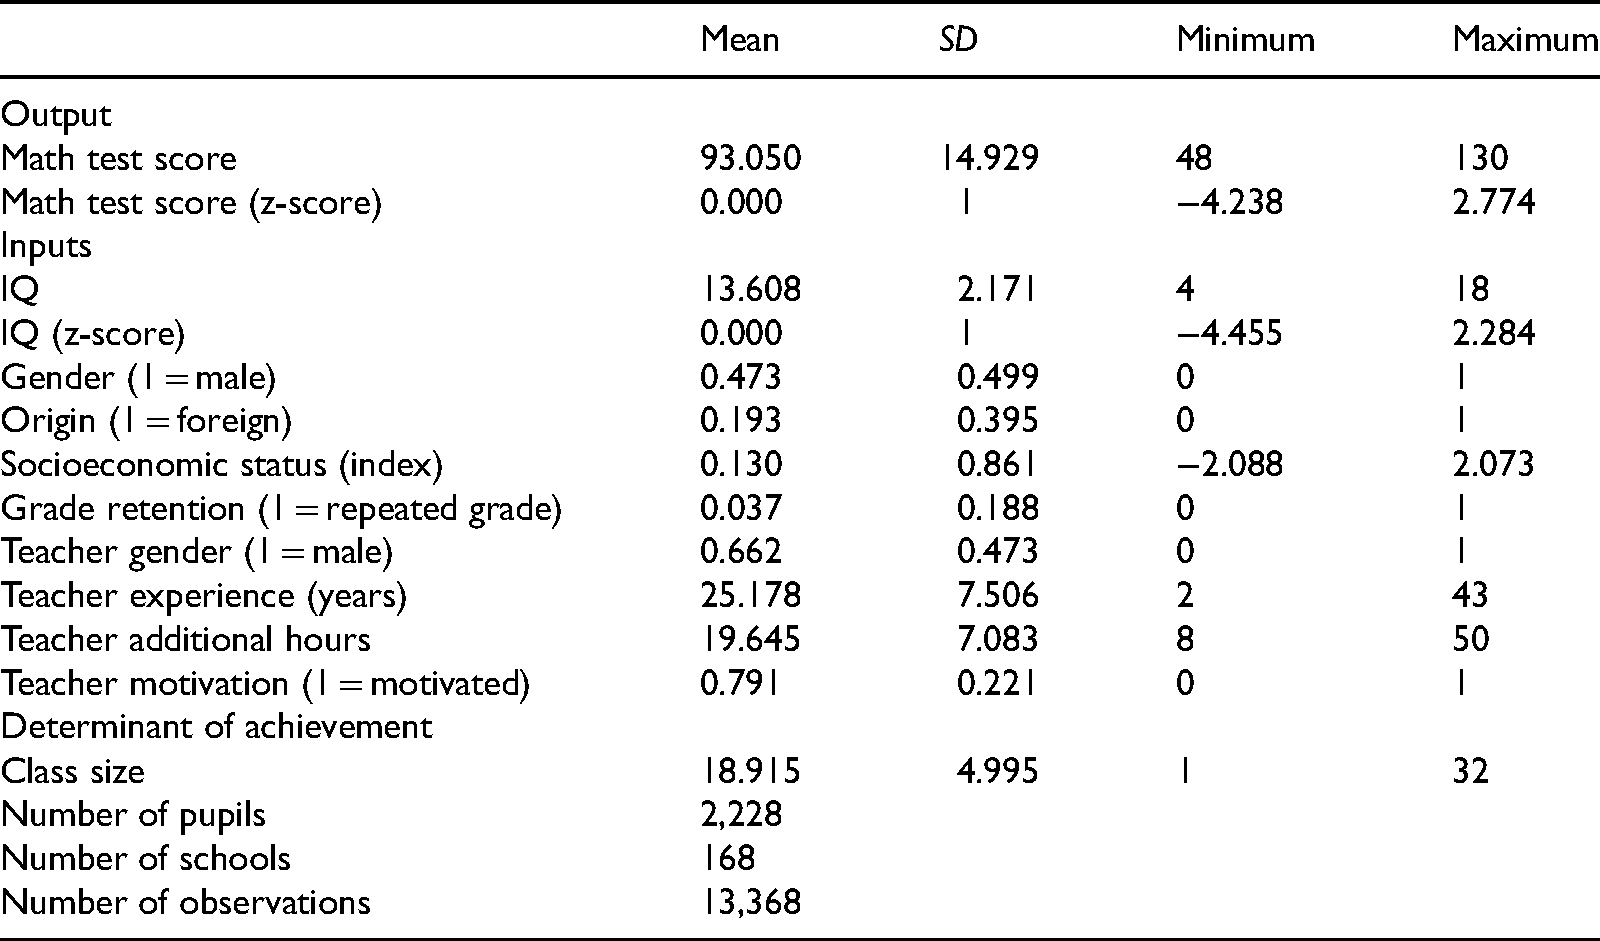
Our final sample is a balanced panel including 2,228 pupils in 168 schools over 6 years of primary education. Descriptive statistics for the pooled sample are provided in Table 1. Our sample includes slightly more girls than boys and about 19% of the pupils have a foreign background. Almost 4% of the pupils repeated a grade at least once. This is slightly higher than the official statistics and can be explained by the oversampling of pupils from a low socioeconomic status. Teachers appear to be mostly male with about 25 years of experience. They spend almost 20 additional hours outside the regular 29 working hours and only about 21% do not feel motivated by their job. Finally, the average class size was 19. Maximum class size was 32 and the minimum class size was 1. The smallest classes are in rural areas, where schools are significantly smaller (removing these very small classes leaves the results virtually unchanged—see Figure A2 and Table A1 in the online supplemental appendix). The class size distribution is roughly normal as shown by Figure A1 in the online supplemental appendix.
Descriptive Statistics.
Results
In this section we give the estimation results for underachievement and the influence of class size. First, we show results for the full sample. Then, we report results by gender, origin, and whether or not the pupil is gifted.
Overall Underachievement
Table 2 gives the estimation results for the full sample. Whereas Column 4 includes all input and control variables, columns 1–3 report nested models. The nested models help us better understand the interactions between the independent variables and whether their inclusion has any influence on underachievement. All models control for school and school year fixed effects, assuring that we compare pupils only within the same school and school year. Put differently, we control for all unobserved school and school year specific influences. Moreover, all models include underachievement and class size as a determinant. Column 1 only includes pupils’ standardized IQ scores as an input which has a positive and sizable association with pupils’ mathematics test scores. If the IQ score increases by one standard deviation, the mathematics test score increases by 0.569 standard deviations. Our main interest (and the advantage of the SFA model) is the estimate for underachievement, which amounts to about 22%, a statistically significant estimate. That is, the average pupil, given their IQ score, could increase their mathematics score by 22%. We found no evidence that class size is a statistically significant determinant of underachievement.
Estimating Overall Underachievement.
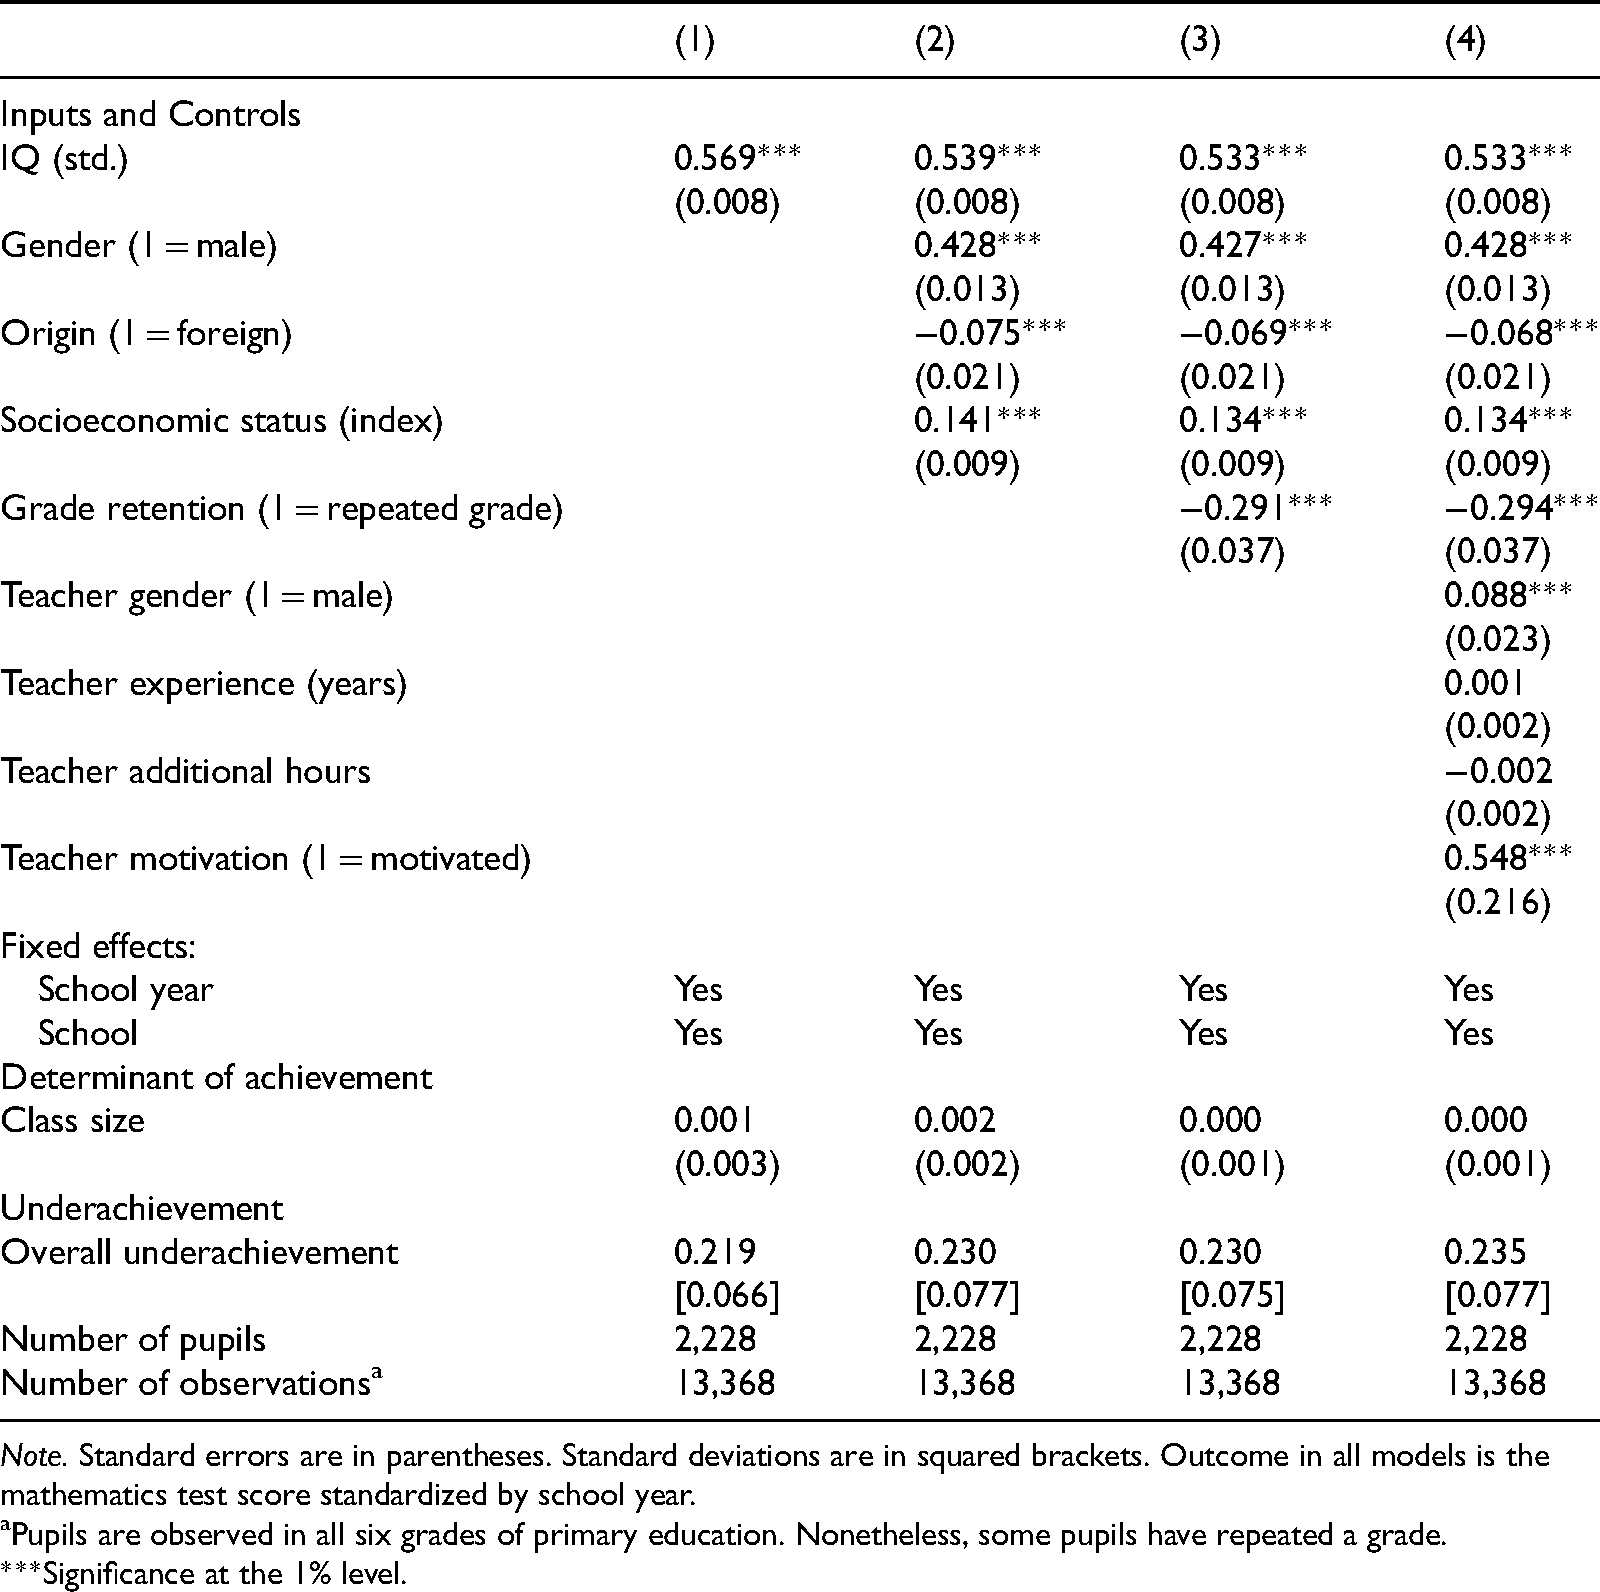
Note. Standard errors are in parentheses. Standard deviations are in squared brackets. Outcome in all models is the mathematics test score standardized by school year.
aPupils are observed in all six grades of primary education. Nonetheless, some pupils have repeated a grade.
***Significance at the 1% level.
In Column 2, we add three additional inputs to the education production function: gender, origin, and socioeconomic status. Note that the association with IQ hardly decreases. This confirms the intuition that ability is independent of these other background variables. However, even when controlling for ability, there is a statistically significant influence for gender, origin, and socioeconomic background. Boys outperform girls on the mathematics test by about 0.43 standard deviations. Having a foreign background (at least one parent born outside Belgium) is associated with a lower score by 0.075 standard deviations. Increasing socioeconomic status by one standard deviation increases the score by about 0.121 standard deviations (0.861*0.141). The influence of socioeconomic background is only about a quarter of the influence of ability.
In Column 3, we add an indicator for grade retention. Pupils who repeat the grade score significantly lower on the mathematics test by about 0.3 standard deviations. In Table A1 in the online supplemental appendix, we also report the results solely for students who have not repeated a grade. These results are very similar to the results presented in Table 2. In the last column in Table 2, our preferred model, we also add teacher characteristics. The coefficients for the pupil inputs remain virtually unchanged; as expected, teacher and pupil characteristics are independent. The results for the teacher characteristics show that achievement is higher when the teacher is male and motivated. However, the influence of the teacher’s gender is much less than the pupil’s gender. Contrary to earlier literature (Compen et al., 2019), teachers’ experience and effort (approximated by teachers’ overtime) do not affect pupils’ achievement. For our preferred model, average underachievement is 23.5%. This is slightly higher than for the other models, but the estimate varies little across columns. Once we control for ability, adding additional control variables does not change the estimate for underachievement. The same is true for the influence of class size.
The estimate of average underachievement of 23.5% hides considerable heterogeneity across pupils. In Figure 2, we plot the distribution of underachievement. We see that underachievement is skewed to the right and ranges from as low as 9% to as high as 81%. That is, there is a long tail of pupils with considerable underachievement. We also consider underachievement per grade in Figure 3. It appears that underachievement peaks in the third grade at almost 31% and then gradually decreases to about 23% in the sixth grade. The lowest underachievement is observed in the second grade at only about 7%. This pattern can be potentially explained by concepts taught in each grade as part of the primary education curriculum in Flanders. The first grade of primary education focuses on learning how to read, whereas the second grade focuses on calculations. Both reading and calculations are relatively novel concepts for pupils, making underachievement unlikely (Acee, et al., 2010). However, some pupils are already familiar with reading before entering primary education, whereas this is uncommon for the calculations taught in the second grade (e.g., time tables). This likely explains why underachievement in the second grade is even lower than in the first grade. In the third and fourth grades there is quite a bit of repetition of the earlier taught concepts, triggering underachievement due to boredom (Acee, et al., 2010). In the final two grades, foreign languages and algebra are taught. These new concepts help reduce underachievement, albeit gradually, as underachievement is difficult to tackle in full once it has occurred (Dixon et al., 2006).
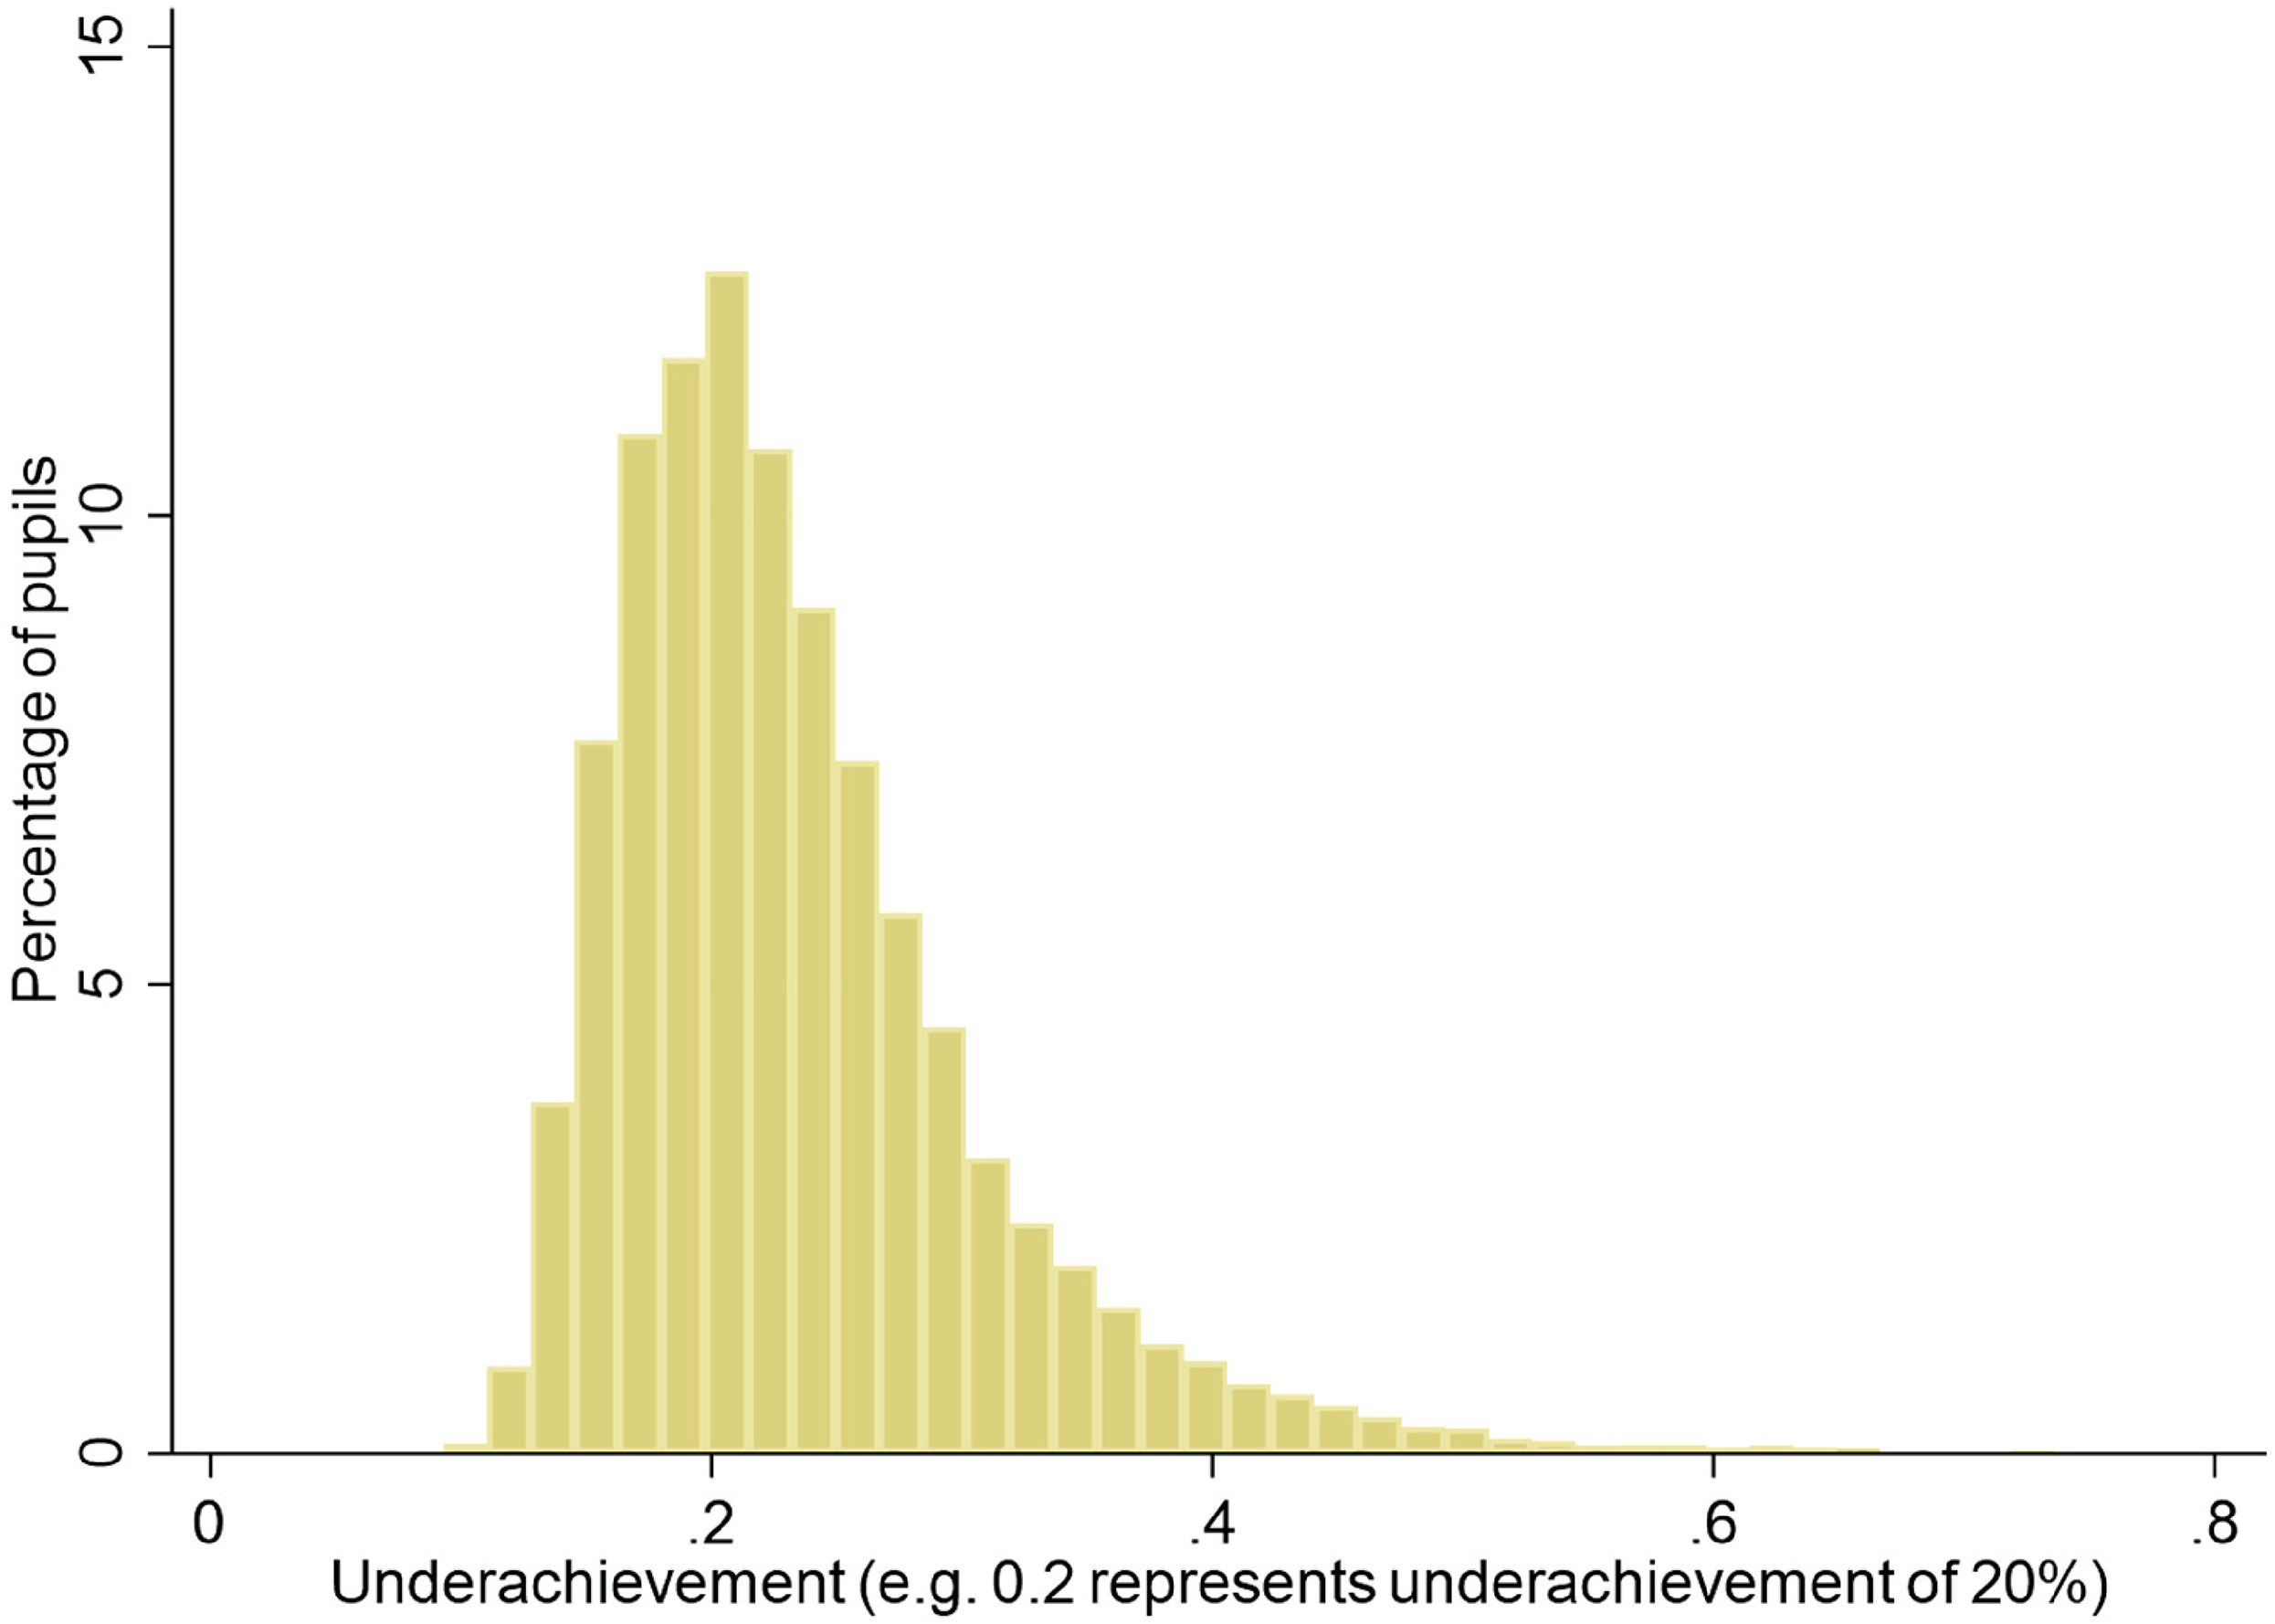
Distribution of Underachievement.
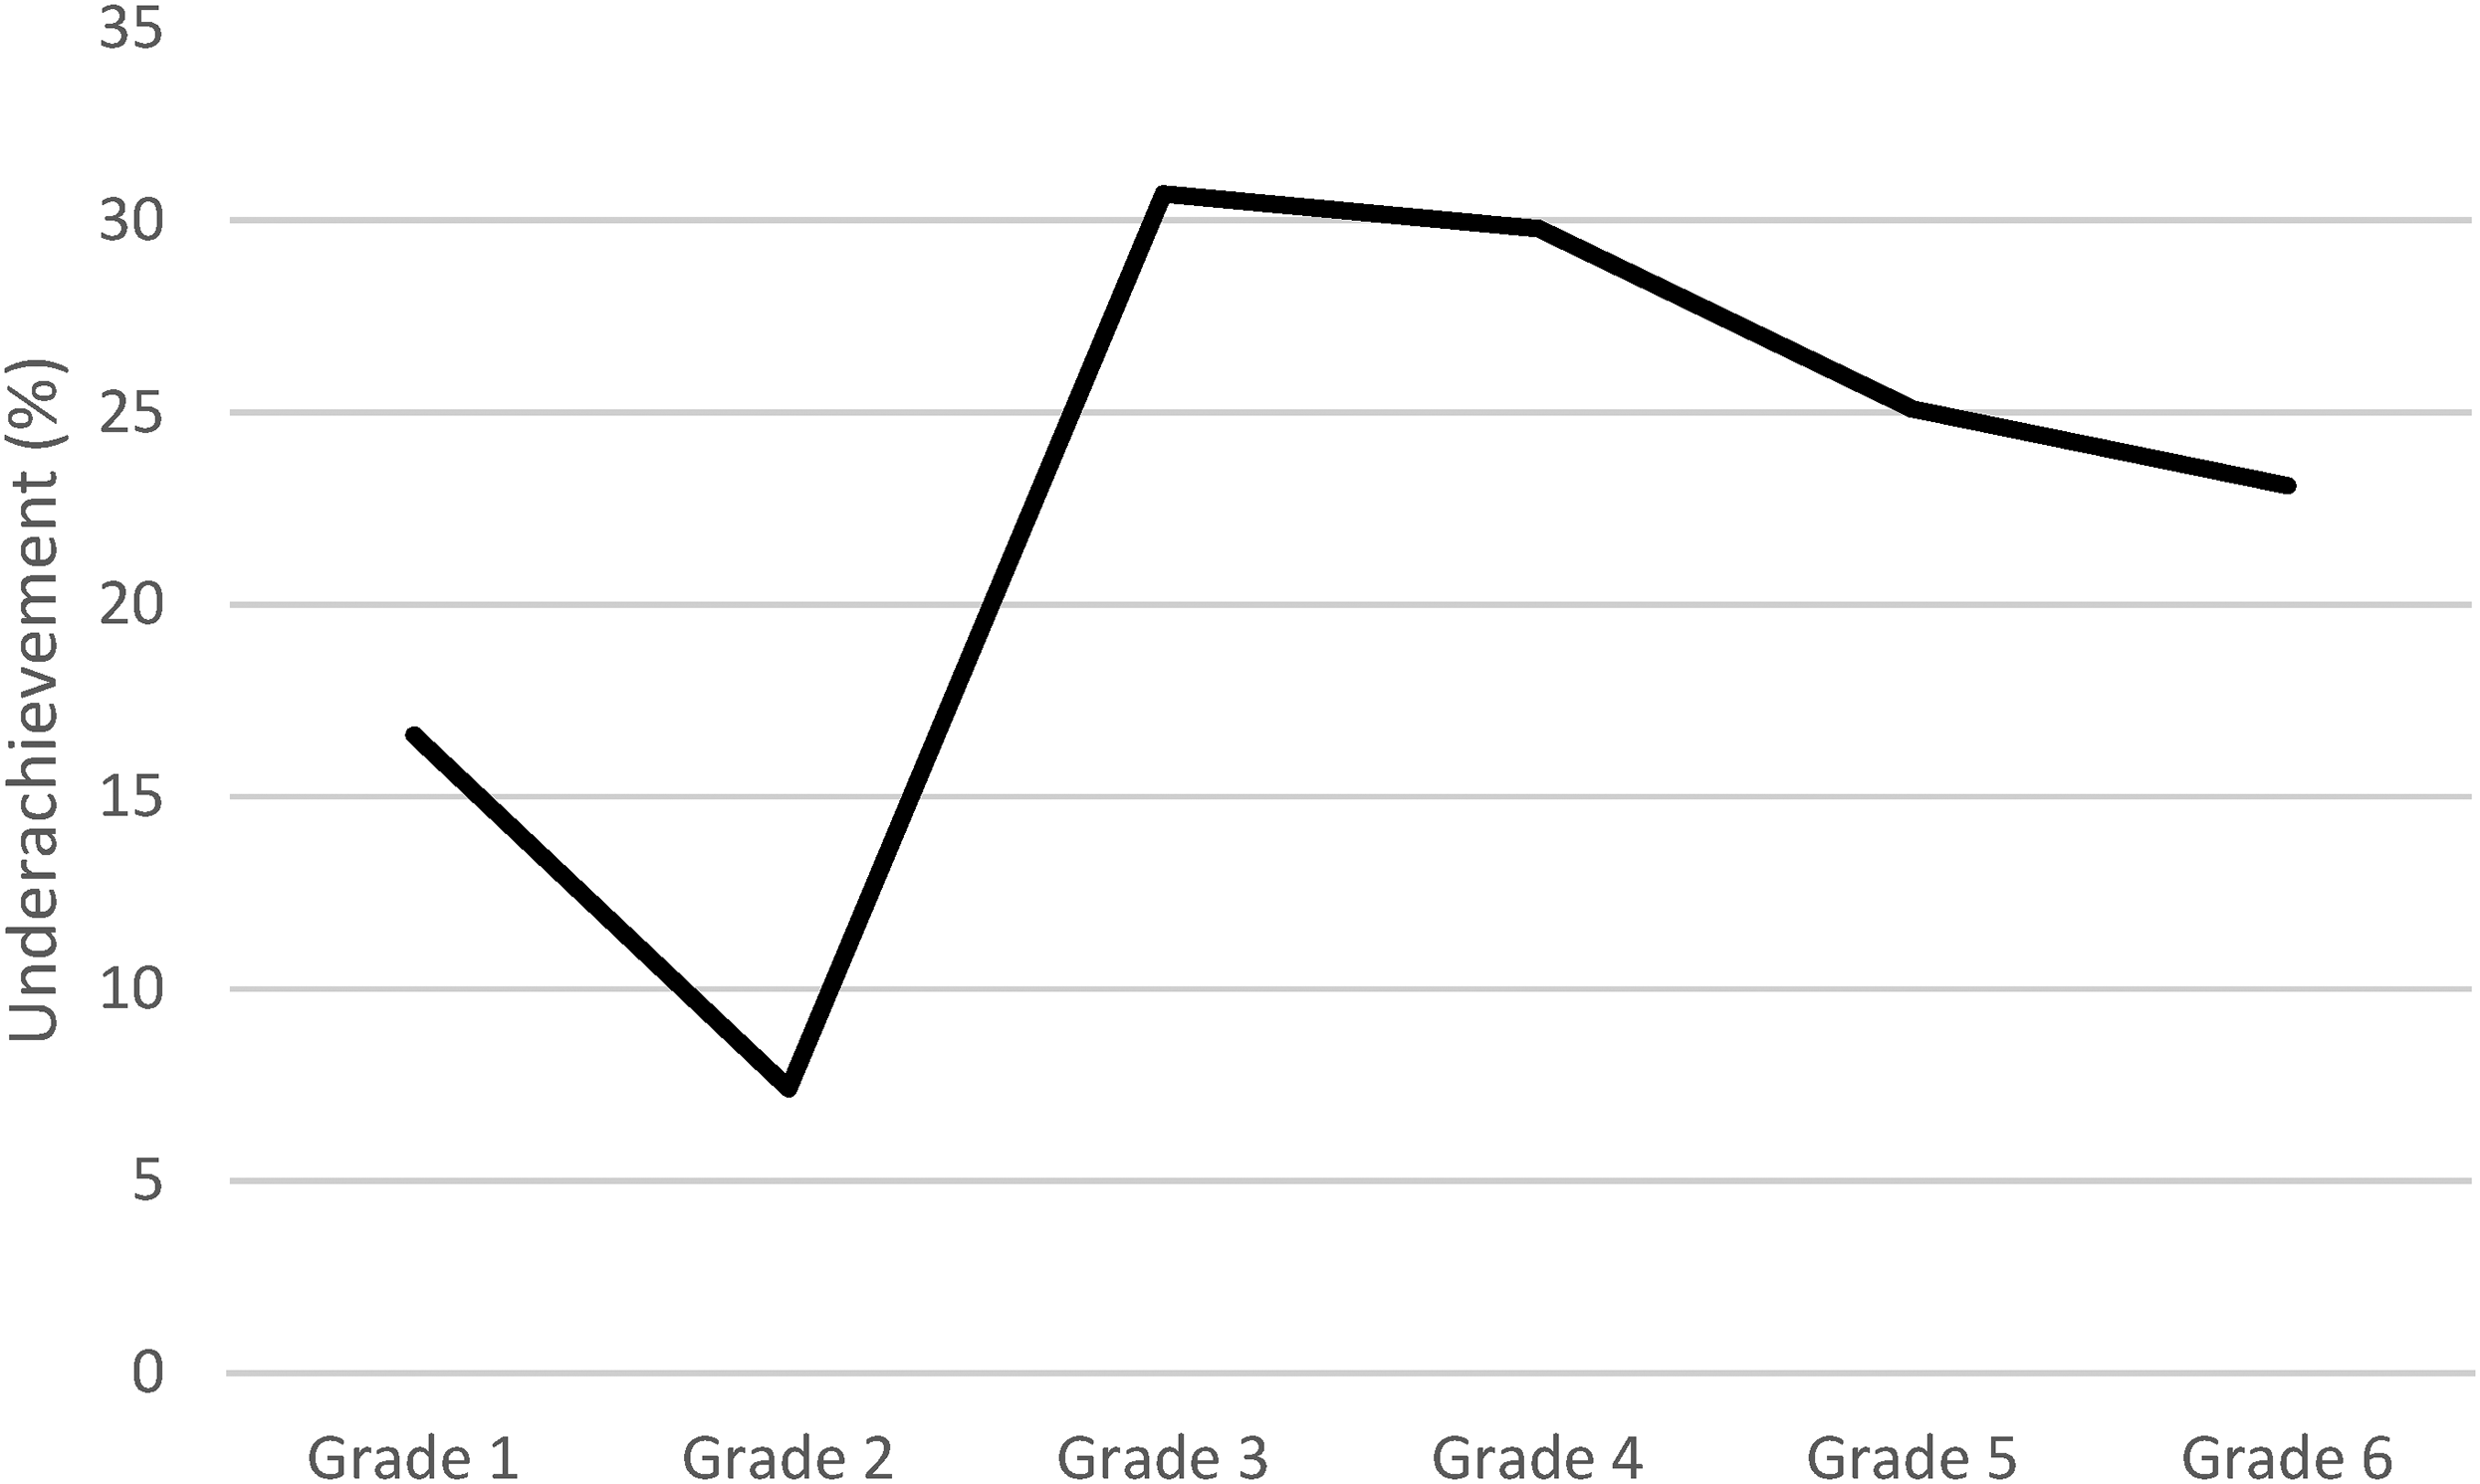
Underachievement by Grade.
Underachievement by Gender, Origin, and Ability
In education policy there is a considerable interest in performance variation by gender, origin, and ability. We re-estimate our preferred model for sub-samples by gender, origin, and ability. Table 3 gives the results. First, we split the sample by gender because the literature on underachievement has produced mixed results. Specifically, some studies found that the incidence of male underachievers is 2–3 times larger than that of female underachievers (McCoach & Siegle, 2003; Peterson & Colangelo, 1996), whereas others have found that males underachieve just as much as females (Preckel & Brunner, 2015). We found that boys’ average underachievement was about one third larger than that of girls. However, a test of the equality of the coefficients shows that this difference is not statistically significant at the 10% level (p = .149). Second, we analyzed underachievement by origin. The prior literature suggests that pupils with a foreign origin are particularly prone to underachievement (Siegle, 2013; Thanassoulis, 1999). We found that pupils of foreign origin underachieved 5.7 percentage points more than pupils of Belgian origin. Again, this difference is not significant (p = .121). Third, we divided the sample into gifted and non-gifted pupils because the prior literature on underachievement has focused almost exclusively on gifted underachievers. To distinguish between gifted and non-gifted pupils, we chose an IQ threshold of top 10%. Thus, gifted pupils are defined as pupils in the top 10% of the IQ score distribution, whereas non-gifted pupils are in the lower 90% of the distribution. We opted for the 10% threshold given that “many consider children who are in the top 10% in relation to a national and/or local norm to be a good guide for identification and services” (National Association for Gifted Children, 2021). The results indicate that gifted pupils’ underachievement is higher (27.4%) than that of non-gifted pupils (22.3%). However, this difference is not statistically significant (p = .481).
Underachievement by Gender, Origin, and Ability.
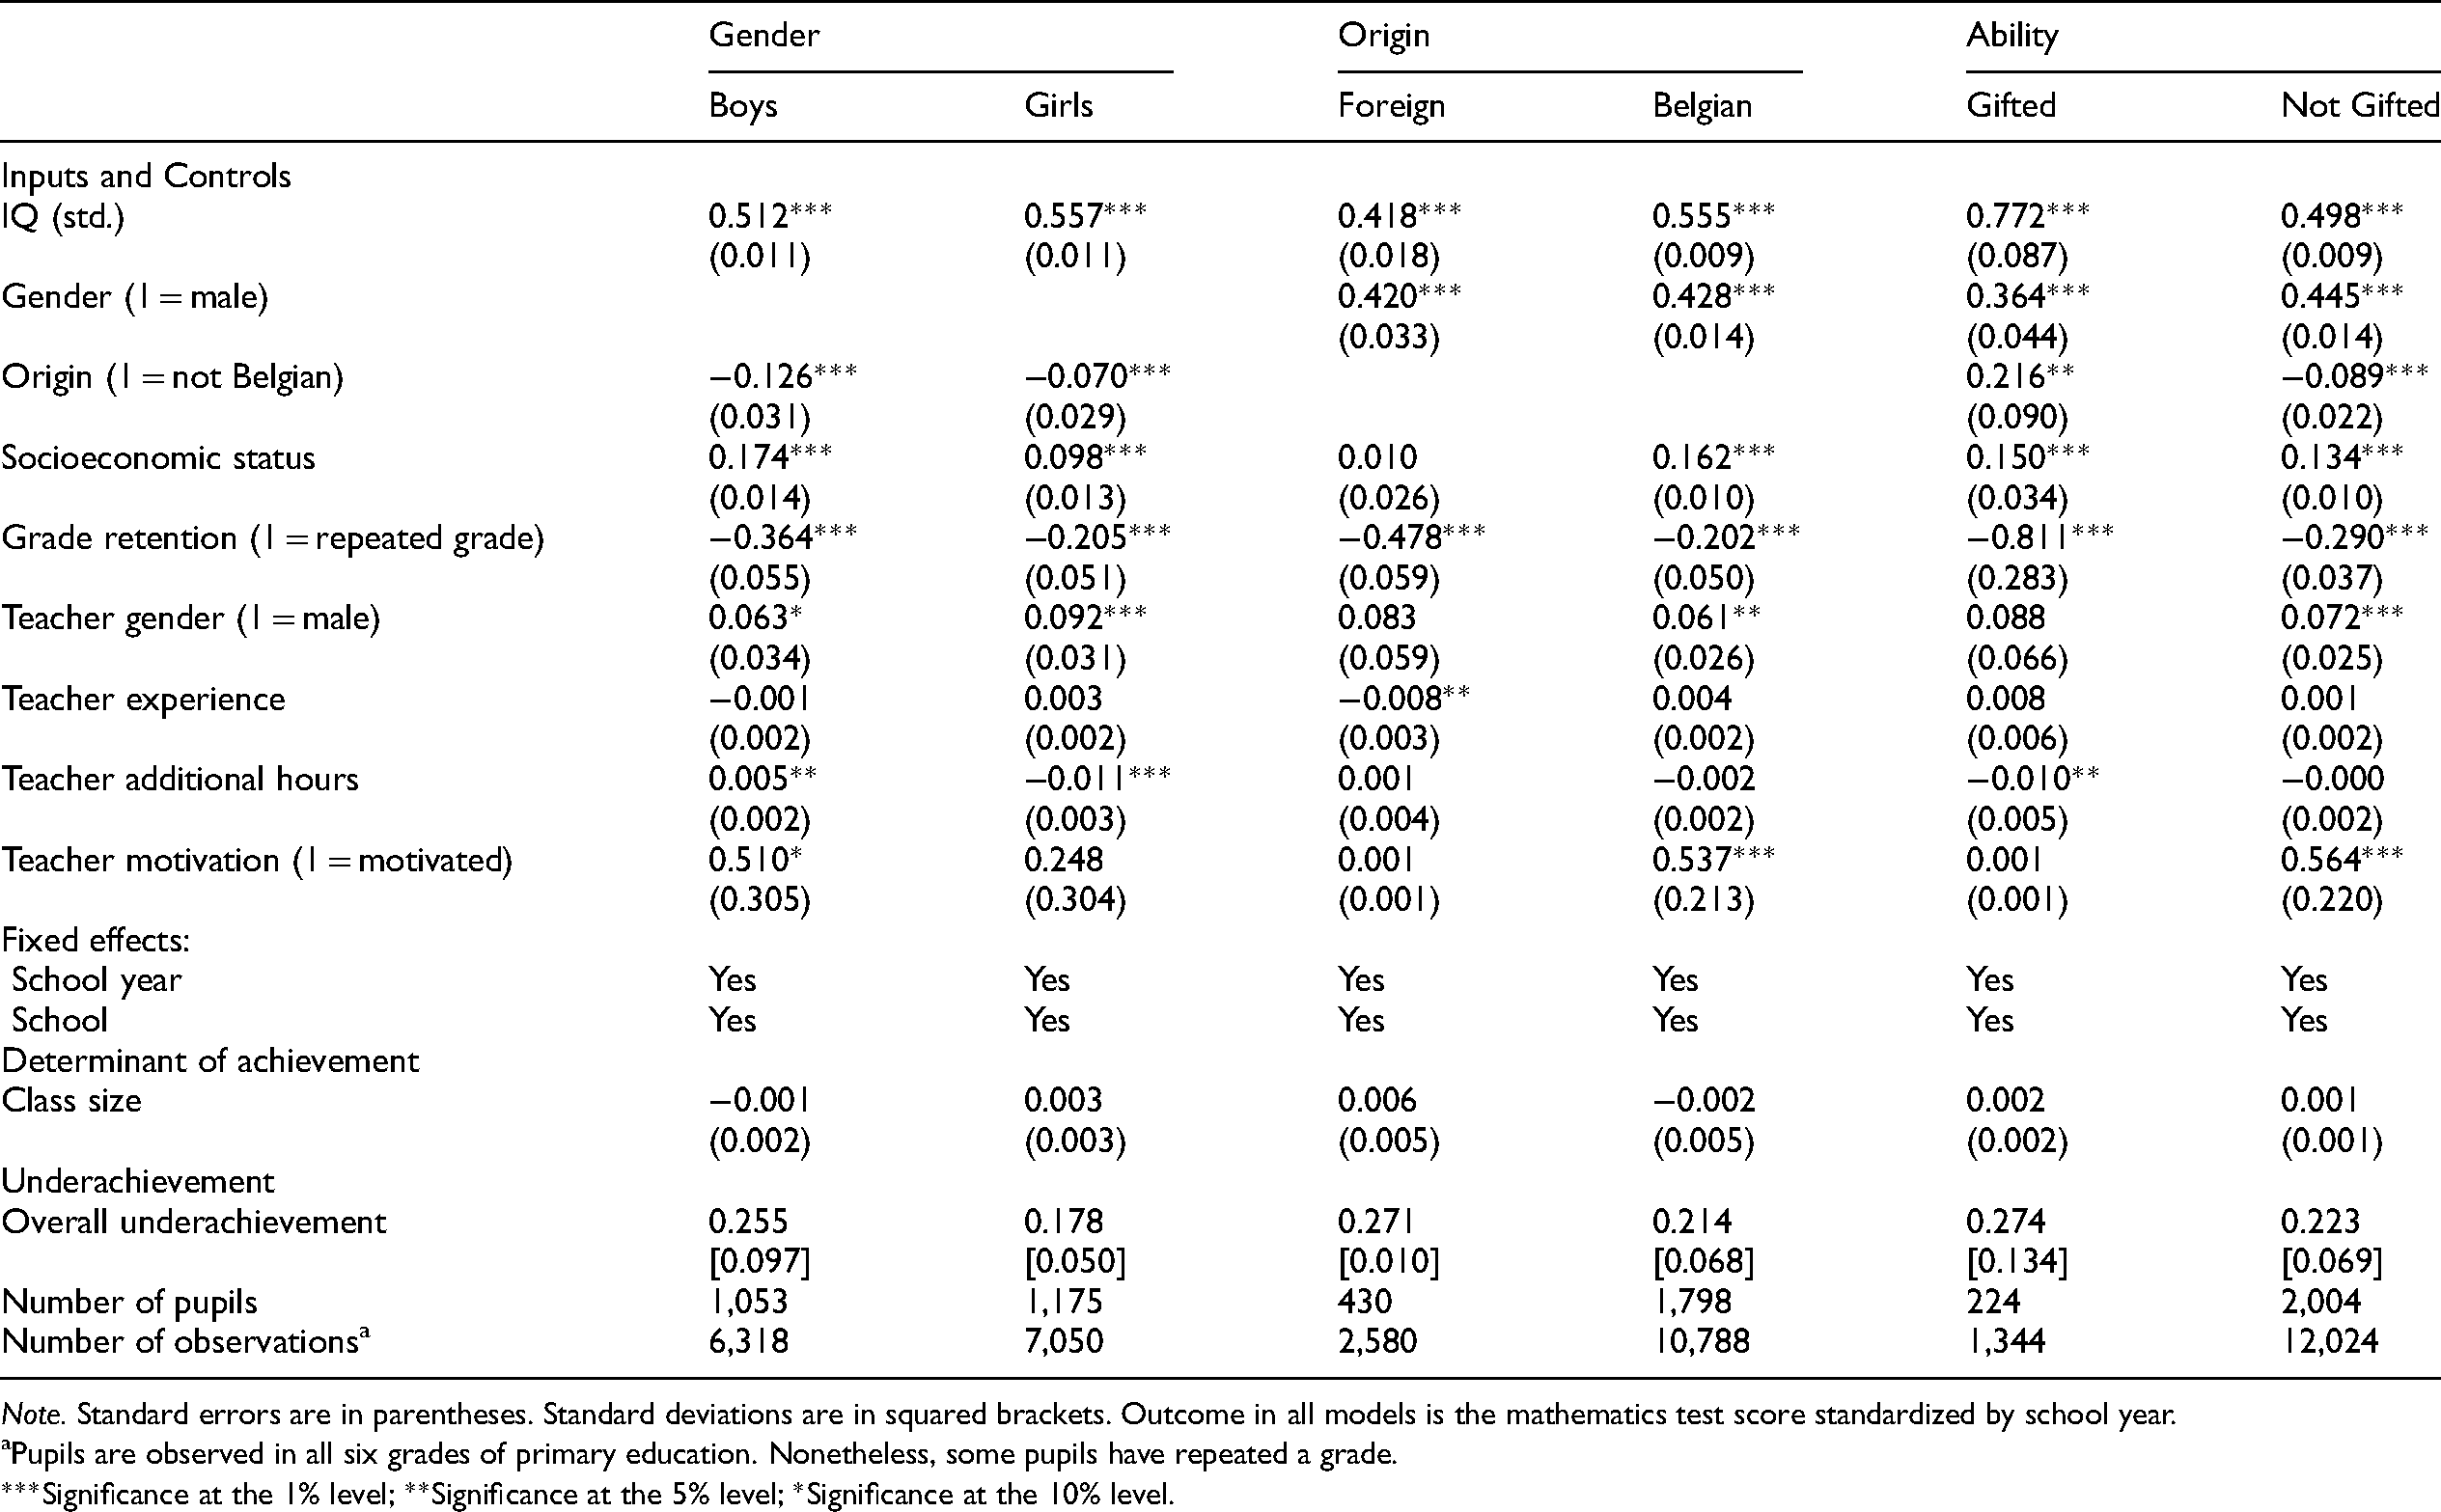
Note. Standard errors are in parentheses. Standard deviations are in squared brackets. Outcome in all models is the mathematics test score standardized by school year.
aPupils are observed in all six grades of primary education. Nonetheless, some pupils have repeated a grade.
***Significance at the 1% level; **Significance at the 5% level; *Significance at the 10% level.
Differential Influence of Class Size on Underachievement
In Table 2, we found that, on average, class size has no influence on underachievement. An important advantage of the SFA model applied here is that it allows the influence of class size on underachievement to be non-monotonic. In other words, the marginal influence of class size can vary with class size. We plotted the marginal influence of class size on underachievement for different class sizes (see Figure 4). Around the average class size, the influence is indistinguishable from zero. However, we see that this is not true away from the mean. For class sizes larger than 20 pupils, underachievement is positively correlated with class size. The marginal influence is negative below a class size of 20 pupils, indicating that, in smaller classes, class size is negatively correlated with underachievement. One potential mechanism for this finding is that smaller classes might imply more classes and thus lower average teacher quality (Jepsen & Rivkin, 2009). Alternatively, Sims (2008) points to the higher frequency of small combination classes (classes that combine pupils from different grades into one small class), in which teachers have to split their attention over different groups.
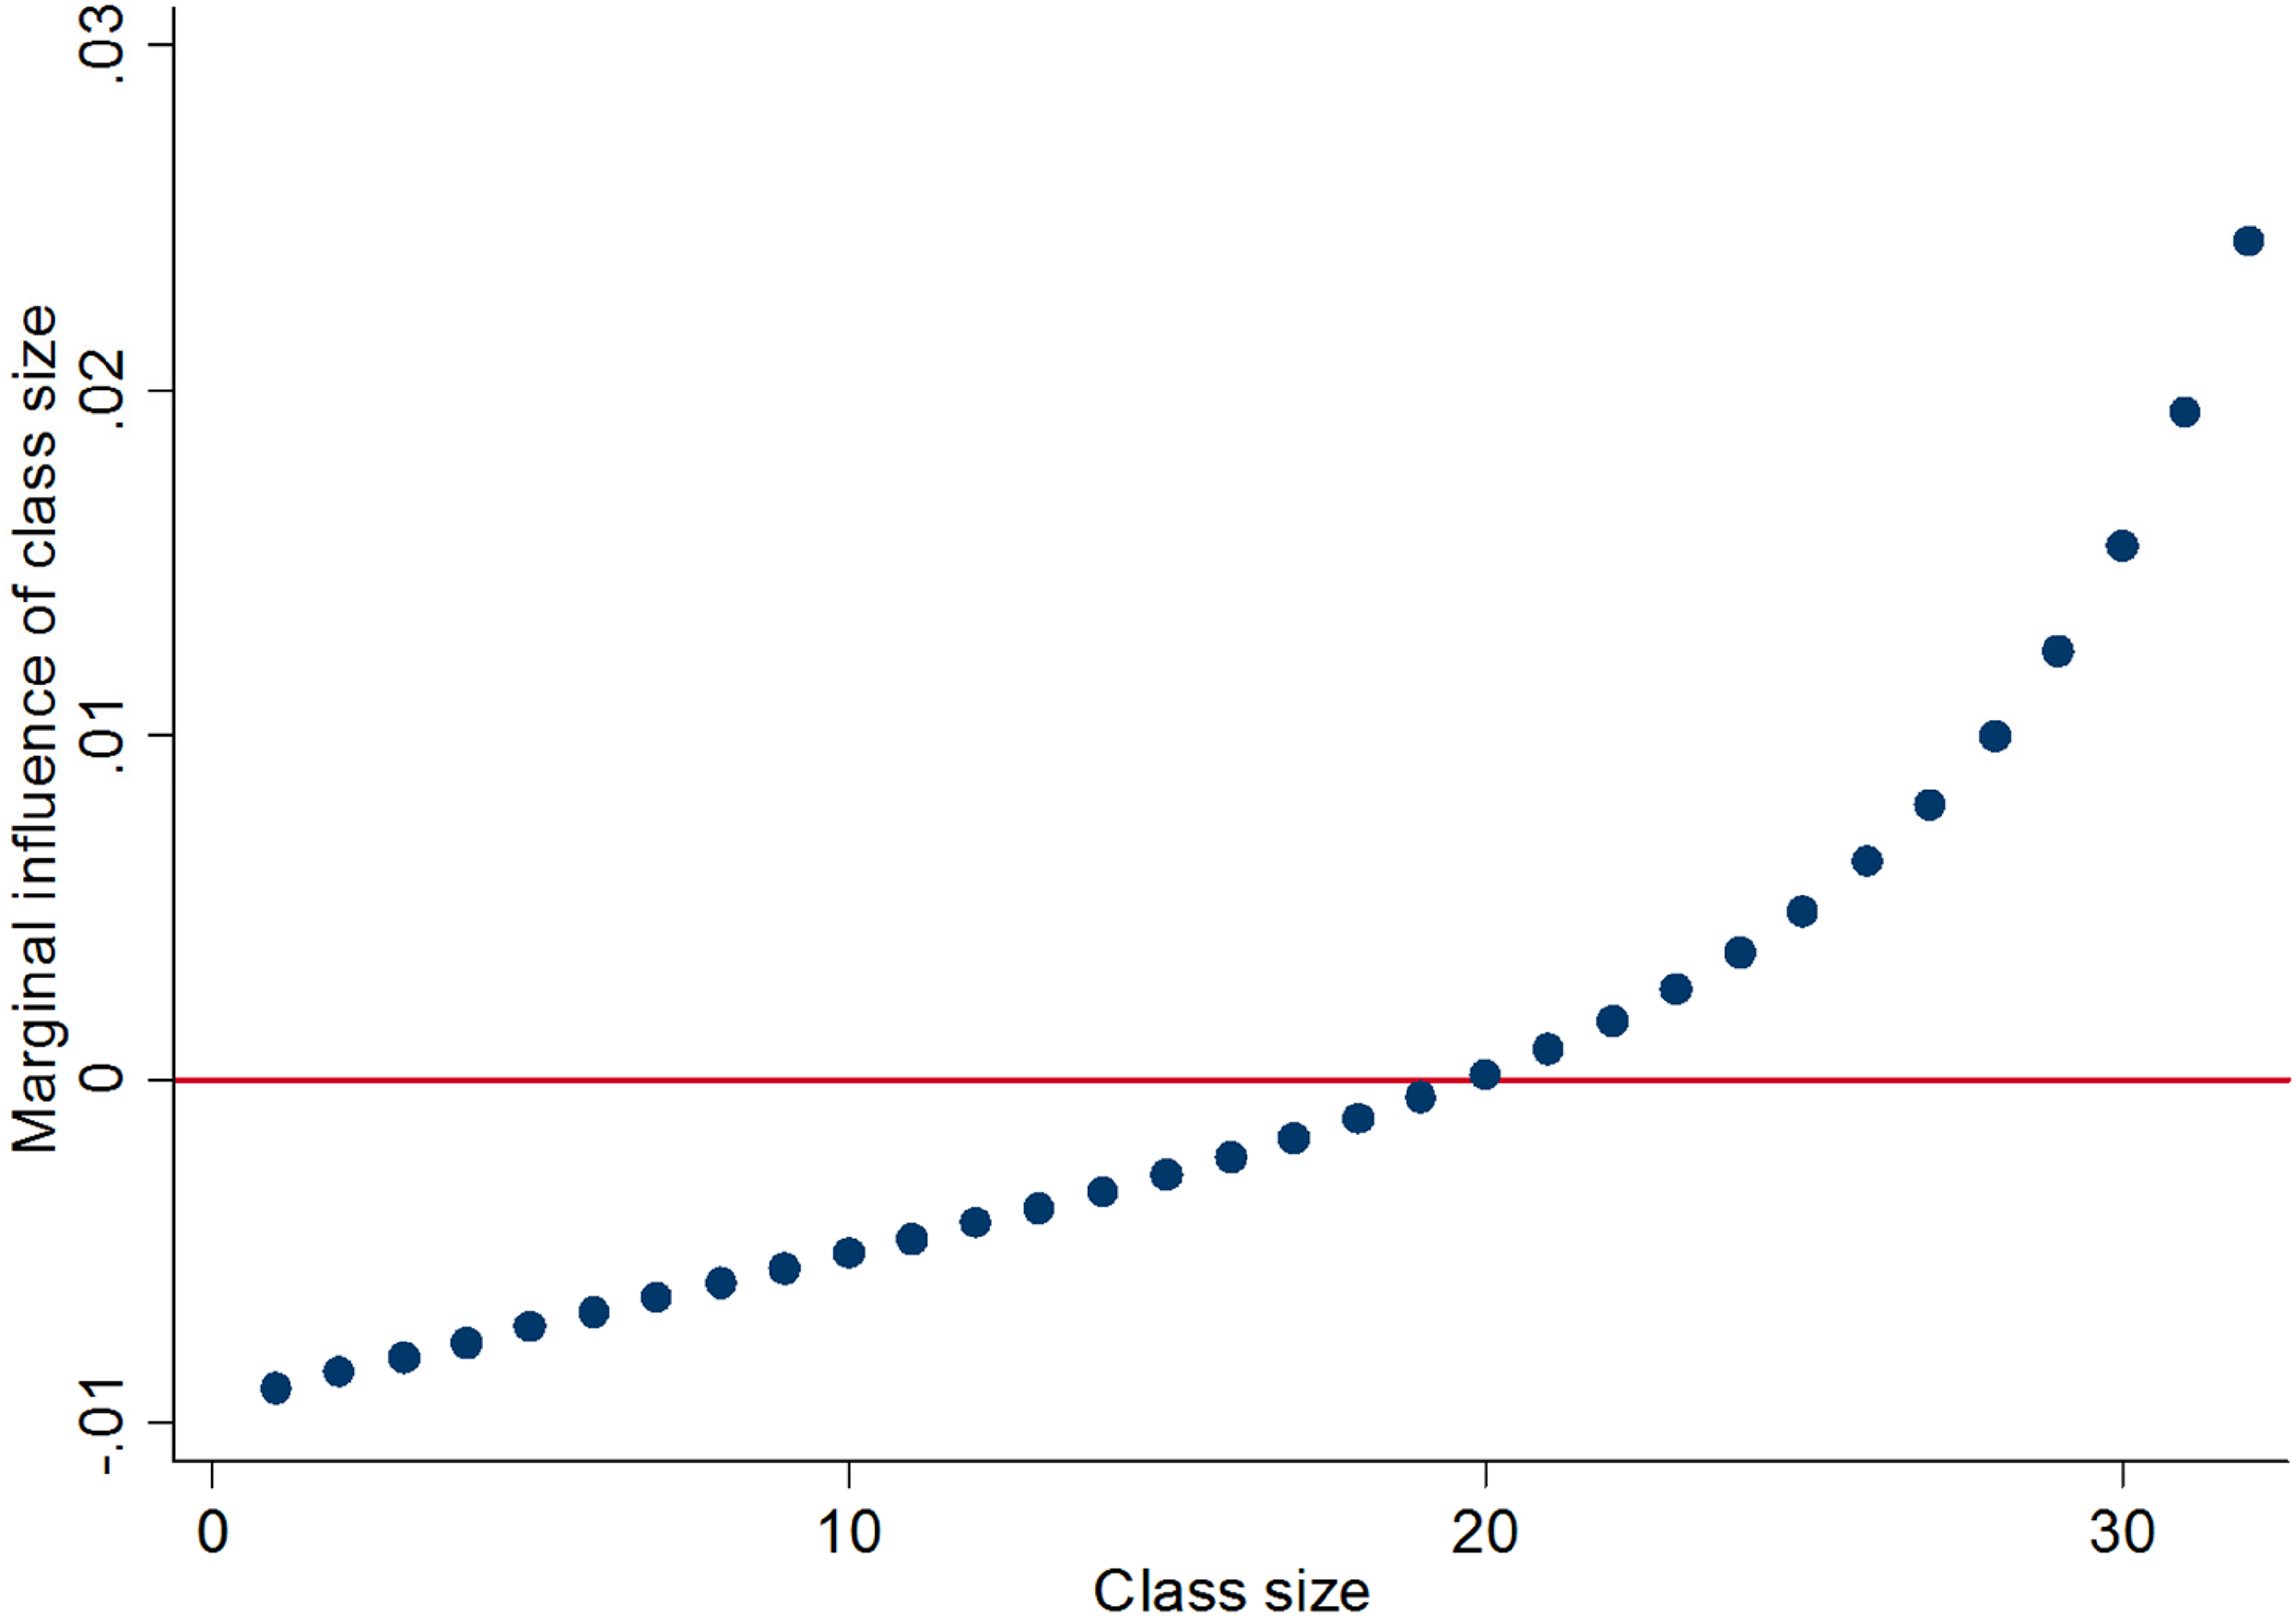
Marginal Influence of Class Size on Underachievement by Class Size.
Conclusion
In this paper, we propose using regression-based Stochastic Frontier Analysis (SFA) to measure underachievement and its determinants in education. The key insight is that underachievement is unobservable—we never observe the counterfactual of maximum achievement—it needs to be modeled and estimated.
The results suggest that in Flemish elementary schools, pupils’ average underachievement is 23.5%. This estimate falls somewhere between the estimates of underachievement in the prior literature (White et al., 2018). However, contrary to the suggestions in the policy debate, we found no evidence that underachievement systematically varies with gender, origin, or ability. This also questions the prior literature’s focus on gifted pupils. Finally, our evidence suggests that the optimal class size for underachievement is 20. One possible mechanism for this result is that with 20 pupils the teacher can optimally trade-off lecturing and one-on-one supervision in class (Bosworth & Caliendo, 2007). In larger classes, teachers are unable to provide individualized instruction to pupils, which is why they resort to lecturing. Moreover, larger classes might have a larger variance in abilities (especially in primary education where pupils are not yet tracked), making it more difficult for teachers to adopt the teaching style to the different ability levels of the pupils (Van Klaveren & De Witte, 2014). For instance, Peters et al. (2017) found that within a classroom, 16%–37% of students scored a year or more above their current grade level, and this was 20%–49% for language in U.S. elementary and middle schools. On the other hand, in classes with less than 20 pupils, class size may actually be negatively associated with underachievement, meaning that larger classes may be beneficial. Underlying mechanisms for this finding might be the lower quality of teachers as a result of a larger number of smaller classes (Jepsen & Rivkin, 2009) and the occurrence of combination classes: pupils from different grades combined in one small class (Sims, 2008).
Although we introduce a new method to measure underachievement, this study is not without limitations. First, we do not claim to present causal evidence. It is possible that unobserved factors change the estimate of underachievement. Moreover, class size as well as teacher factors may be endogenous as schools may allocate pupils to particular classes with particular teachers. Similarly, the data oversampled pupils from a lower socioeconomic background which may have affected the results. Future research may expand the range of inputs or control variables, or combine exogenous shocks with SFA to increase the causal interpretation of the findings. It is also useful to estimate underachievement beyond primary education (see for instance Almukhambetova and Hernández-Torrano [2020]) and to investigate the influence of underachievement on potential high school dropout or later life outcomes. From a methodological perspective, future research could examine the existence of “over-achievement.” Recent advancements in SFA models make use of bootstrapped samples in which the evaluated observation is excluded from the reference sample (Wanke et al., 2020). These technical innovations allow for the measurement of over-achievement. As a final line of future research, qualitative data should accompany these quantitative findings to explore in detail why pupils underachieve (see for instance Desmet et al. [2020]).
Supplemental Material
sj-docx-1-ecx-10.1177_00144029211073524 - Supplemental material for Mind the Gap: Measuring Academic Underachievement Using Stochastic Frontier Analysis
Supplemental material, sj-docx-1-ecx-10.1177_00144029211073524 for Mind the Gap: Measuring Academic Underachievement Using Stochastic Frontier Analysis by Deni Mazrekaj, Kristof De Witte and Thomas P. Triebs in Exceptional Children
Footnotes
Acknowledgments
We would like to thank Hung-Jen Wang, Subal Kumbhakar, Eric Hanushek, John Ruggiero, Lori Taylor, Frank Verboven, Bieke De Fraine, Jan Van Damme, Ides Nicaise, the participants of the Conference of the International Association for Applied Econometrics, as well as the seminar and workshop participants at Carleton University, Loughborough University, Politecnico di Milano, University of Lisbon, Maastricht University, University of Extremadura, and KU Leuven.
Declaration of Conflicting Interests
The authors declared no potential conflicts of interest with respect to the research, authorship, and/or publication of this article.
Funding
Deni Mazrekaj acknowledges funding by the Research Foundation Flanders (FWO) as Aspirant [grant numbers 1172519N and V439919N].
Supplemental Material
Supplemental material for this article is available online.
References
Supplementary Material
Please find the following supplemental material available below.
For Open Access articles published under a Creative Commons License, all supplemental material carries the same license as the article it is associated with.
For non-Open Access articles published, all supplemental material carries a non-exclusive license, and permission requests for re-use of supplemental material or any part of supplemental material shall be sent directly to the copyright owner as specified in the copyright notice associated with the article.