
Abstract
The use of geospatial analytical tools has recently advanced risk perception research, with growing interest in spatial dimension. Available reviews of risk perception studies usually focus on specific types of risk or look at various socio-psychological, cognitive and cultural factors, and there are no systematic reviews of empirical research analysing the effect of proximity on risk perception. This article synthesizes the evidence from 81 empirical studies that investigate the significance of proximity on subjective risk perception. The systematic review focused on summaries of research methods, samples, geographic coverage, measurements and direction of influence of proximity variables on risk perception and types and sources of risk. The majority of the studies analysed implemented quantitative research. The most popular data collection methods were face-to-face interviews and postal surveys, but only half had representative samples. Studies looking into the effect of proximity on risk perception most often analysed environmental and technological risks. Two-thirds of the empirical studies found a significant impact of proximity on risk perception; the majority of these showed a positive correlation, with respondents living closer to hazards having higher risk perceptions. Negative correlations of risk perception with proximity are more characteristic of nuclear risks. Co-occurrence analysis of sources-of-risk and objects-at-risk has identified three most frequent clusters: impact of floods on economic properties; impact of other natural hazards on economic properties and impact of industrial facilities on health and lives.
Introduction
For decades, studies of public risk perception have analysed the complexity of determining factors. These factors encompass a broad range of socio-demographic, psychological, cognitive, cultural, experiential and other types of factors and the theoretical explanations behind them. International comparative studies of risk perception not only allow the identification of universal determinants of risk perception but also facilitate the tracking of changes in risk attitudes over time. However, Müller-Mahn and Everts (2013) note that there is a lack of attention to the space dimension in risk theory. They provide examples of risks that are global by definition but produce locally observable outcomes and consequently shape the complex ‘landscapes of risk’, as Müller-Mahn and Everts (2013: 24) put it. These examples where global risks are embedded in local settings include climate change, the COVID-19 pandemic, terrorism or similar threats. On the contrary, local industrial, technological and infrastructure objects or events like riots or similar that have specific locations and attributed location ‘name tags’ (e.g. Fukushima, Madrid bombing and Wuhan outbreak) represent global risks and sources of risk.
Proximity can be measured objectively (distance of individual to the specific risk object) or can be subjectively reported. Bickerstaff and Simmons (2009: 866) conceptualize the notion of proximity in terms of practices – how things are made present or absent – and this way of thinking about proximity relates to risk subjectivities. For example, there are adverse psychological effects related to individuals’ physical proximity to large technological facilities, where people living in close proximity tend to have less concern (Bickerstaff and Simmons, 2009: 867). People can also misinterpret their proximity when it is subjectively reported. Lyons et al. (2020) identify that science knowledge, media use and direct social contact with people working in risk industries affect subjective perception of proximity to risk objects. The aim of this article is to synthesize evidence from empirical studies that investigate the effect of proximity on subjective risk perception. The article presents the results of a systematic literature review of the proximity variable in risk perception studies.
With the growing body of studies investigating the space aspect in risk perception, it is important to systemize the state of the art. There are several publications that present systematic literature reviews of risk perception. Most of the systematic literature reviews deal with risk perception from natural hazards in general and floods in particular (e.g. Bubeck et al., 2012; Kellens et al., 2013). The spatial dimension was the focus of Klonner et al.’s (2016) study, which summarized how volunteered geographic information is used by citizens in natural hazard analysis. Studies on proximity and perceptions frequently focus on one type of risk (as noted by Lyons et al., 2020); thus, we aim to systematize empirical studies dealing with all types of risk in order to identify general characteristics of the relationship between proximity and risk perception.
We are specifically interested in empirical studies where primary data were collected, where risk perception is conceptualized as a dependent variable and where proximity is treated as an independent variable in the analytical models. The specific tasks of this article include: (1) identifying and retrieving international evidence relevant to the use of proximity variables in risk perception explanatory models and (2) synthesizing systematic review results to inform further research about the effect of proximity on subjective individual risk perception with a special focus on (a) methodologies and sampling strategies; (b) the operationalization of proximity variables and risk perception variables; (c) size and direction of effects of the proximity variable on risk perception and (d) types of risk and objects at risk investigated in empirical studies.
Materials and methods
The systematic literature review approach was followed in our research (Grant and Booth, 2009). Our methodological decisions and procedures are described below.
Identification and sampling procedures
In order to obtain non-biased results and to establish a reliable evidence base, we followed PRISMA-P recommendations (Moher et al., 2015) for the identification, search and sampling of relevant texts. The full flow diagram is presented in Figure 1.
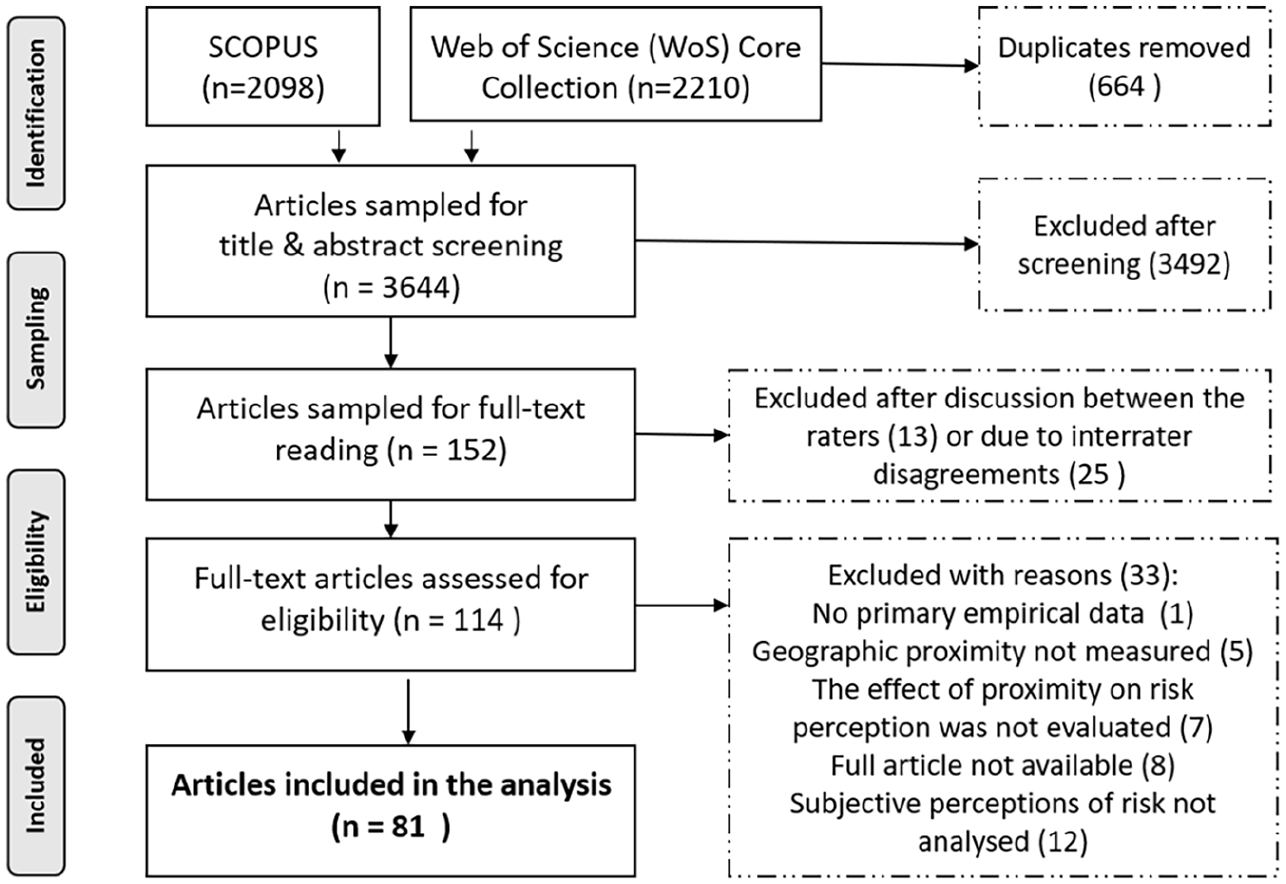
Identification and sampling strategy.
The identification stage included sourcing texts from the Web of Science (WoS) Core Collection and SCOPUS databases. Search keywords included: spatial*, spatial analysis, proximity, distance, risk perception, hazard perception, danger perception and threat perception. Inclusion criteria for entries from both databases: journal article in English, and the year of publication was 2020 or earlier. Additional inclusion criteria for SCOPUS: subject areas included environmental, social, earth and planetary sciences, medicine, psychology, arts and humanities, business management and accounting, economics, econometrics and finance, health professions and multidisciplinary. Additional inclusion criteria for entries from the WoS Core Collection related to the Social Sciences Citation Index (SSCI), Arts & Humanities Citation Index (A&HCI) and Emerging Sources Citation Index (ESCI) indexed fields. Duplicates were removed using EndNote.
Titles and abstracts of all sourced articles were screened manually by two independent researchers. Articles that reported empirical measurements of individual subjective risk perceptions and geographical proximity/distance were included for further full-text screening (e.g. the article by Danso-Amoako et al. (2012) was not included, because it writes about dam failure risks, but not risk perception). Any article presenting theoretical discussion, meta-analysis/systematic review or an expert survey was excluded at this stage (for example, Edwards et al., 2014, included in-depth expert interviews). The next stage included full-text reading by the same two researchers. Articles were excluded based on the following exclusion criteria: No primary empirical data were reported; geographical proximity/distance was not measured (e.g. social distance was measured); subjective perceptions of risk (by lay people) were not the dependent variable; the effect of proximity/distance on risk perception was not evaluated; primary empirical data were not reported or full text was not available.
Interrater reliability was assessed following the suggestions by Cohen (1960) and McHugh (2012). The two independent researchers jointly selected a total of 152 articles. After two rounds of discussion on initial misunderstandings and incongruences, the researchers unanimously agreed to include 81 articles and to exclude 46, with 25 unresolved cases (Shao et al. (2017) represent an unresolved case, where researchers could not agree if the dependent variable of perceived changes in risk fits the exclusion criterion). This corresponds to 84% interrater agreement and is considered a strong level of agreement (McHugh, 2012). Following McHugh’s (2012) approach, we calculated Cohen’s kappa at 0.67. This is considered ‘substantial’ by Cohen (1960; McHugh, 2012). The reliability of data is therefore strong/substantial. The final sample consisted of 81 research articles included for coding and analysis.
Coding scheme
The pre-defined set of codes was developed based on our research questions and previous studies (Gaur and Kumar, 2018). Our code structure consisted of: (1) methodologies, methods and samples; (2) operational definitions of the independent variable (proximity) and dependent variable (risk perception); (3) types of risk and objects at risk and (4) significance of proximity to risk perception. The coding scheme developed by the authors for the systematic literature review is presented in Table 1.
Coding scheme for systematic literature review.
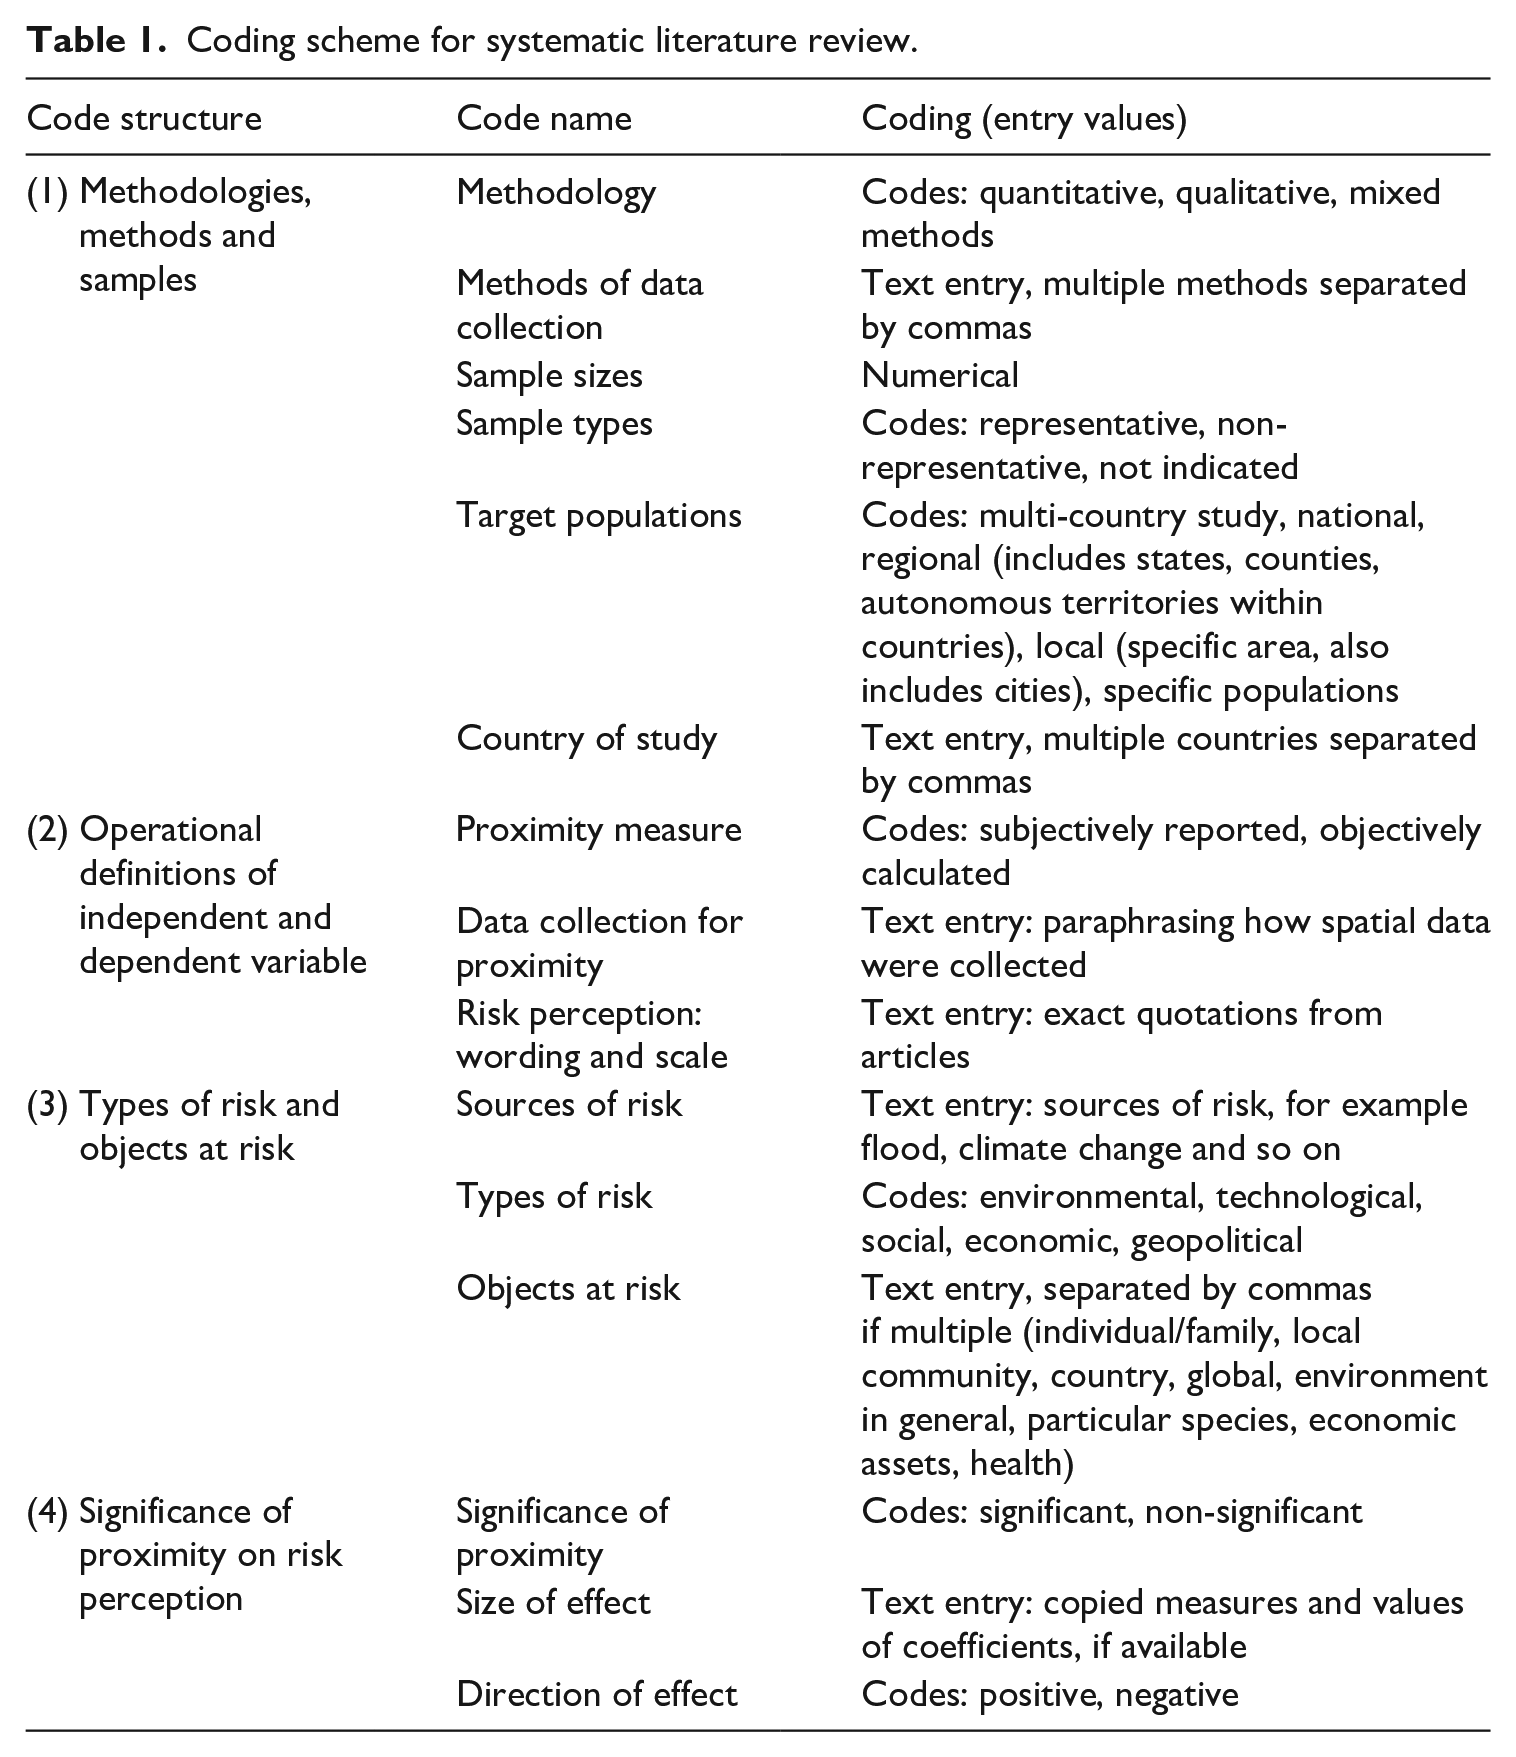
In the third part of the coding scheme (types of risks), the classification of risk types was based on global risk reports by the World Economic Forum (2020) that include five types of risks. Judgement on how to code ‘type of risk’ was made based on the sources of risk; coding of ‘object at risk’ was based on the risk perception questions in the survey or other types of empirical research. The direction of effect was coded considering proximity: positive direction of effect means that individuals closer to risk objects perceive risks as higher, while negative direction means that those who live closer see risks as lower. The coding system was tested on part of the sample by two coders before the final code scheme was confirmed. Excel, SPSS and MAXQDA were used as tools to analyse the coded data.
Results
Time line of publications, methodologies, methods and sampling strategies
The number of articles investigating the relationship between risk perception and proximity was consistently modest until it experienced a dramatic increase in 2008 and then in 2012. Since 2012, the average number of studies published yearly has increased substantially: the mean number of articles per year before 2008 (1994–2007) was 0.75, but after 2008 (2008–2020), that number rises to 6.
The majority of the studies have conducted their fieldwork in the United States. If we consider continents, North America and Europe account for 72.9% of the sample. On the contrary, North American articles often focus on different kinds of risk in comparison with European studies: 59.5% of all North American articles deal with environmental risks (only 31.8% of European ones), whereas in Europe, technological risks are most often researched (63.6%).
The majority of the studies employed a quantitative methodology. Almost 9 out of 10 articles (88.2%) used only quantitative methods, whereas 7.9% combined both quantitative and qualitative methods, and only four articles employed only qualitative methods (in-depth interviews, Q methodology, cognitive maps). The majority of articles used surveys as their primary data collection method, the most popular method being the face-to-face interview (28.3%). Some studies (13.3%) do not specify the kind of survey applied in their research. Notably, 40.8% used representative samples, and 10 articles did not include information on whether samples were representative.
Operational definitions and measurements
Risk perception as the dependent variable
There is a variety of wordings and scales to measure risk perception in the sampled studies. Not all articles report the exact wording of questions related to risk perception (15 studies have not provided the wording). Only a quarter of the articles (20 studies) used the word ‘risk’ in the formulation of questions. Seven studies asked respondents to estimate the likelihood of adverse events, such as earthquakes and tsunamis (Buylova et al., 2020), floods (Brennan et al., 2016; Brody et al., 2017), wildland fires (Ryan and Wamsley, 2008) and others. Other keywords in questionnaires included ‘worry’, ‘damage’, ‘fear’ and ‘danger’. Some questions were related to particular situations or specific objects. For example, ‘I am sure it is only a matter of time before my workplace is subject to another terrorist attack’ (Nissen et al., 2015). A Likert-type scale was the most often used measurement of risk perception (51%). However, not all articles indicate the full wording of scale, and a different number of points were used in Likert-type scales, from 3 to 11. The scales used most often are the 5-point Likert-type scale (20%) and the 4-point Likert-type scale (10.5%). Open-ended questions were used in four studies.
Proximity as the independent variable
Proximity can be measured in two broadly defined ways, using either objective or subjective measures. Objective measures are unequivocal and do not depend on the subjectivity of the respondent (or the researcher). In many studies, the objective measurement of proximity is a continuous figure such as kilometres of distance from the hazard (e.g. Mueller, 2019), or a categorical measurement following a Likert-type scale indicating the grade of distance (e.g. Rana et al., 2020). Objective measures are most frequently used in our sample: 93.4% of all articles use some kind of objective measure, such as computing the distance from the address (taken when interviewing the respondent in the survey) to the source of danger. There are two articles that use only subjective measures of proximity. Combest-Friedman et al. (2012) used the estimated distance (in metres) from households to the coastline to assess the perception of coastal hazards, finding a positive correlation between proximity and risk perception. She et al. (2012), in an experimental design, found that individuals’ perception of the distance between them and an incident point affects their interpretation of the likelihood of the occurrence of a hazardous event.
Effects of proximity on risk perception
Almost three-quarters of the studies in the sample (72.9%; see Table 2) revealed a significant influence of proximity on risk perception, whereas a quarter of the studies reported that the correlation between distance and risk perception was not significant.
Significance and direction of correlation between proximity to hazard and risk perception.
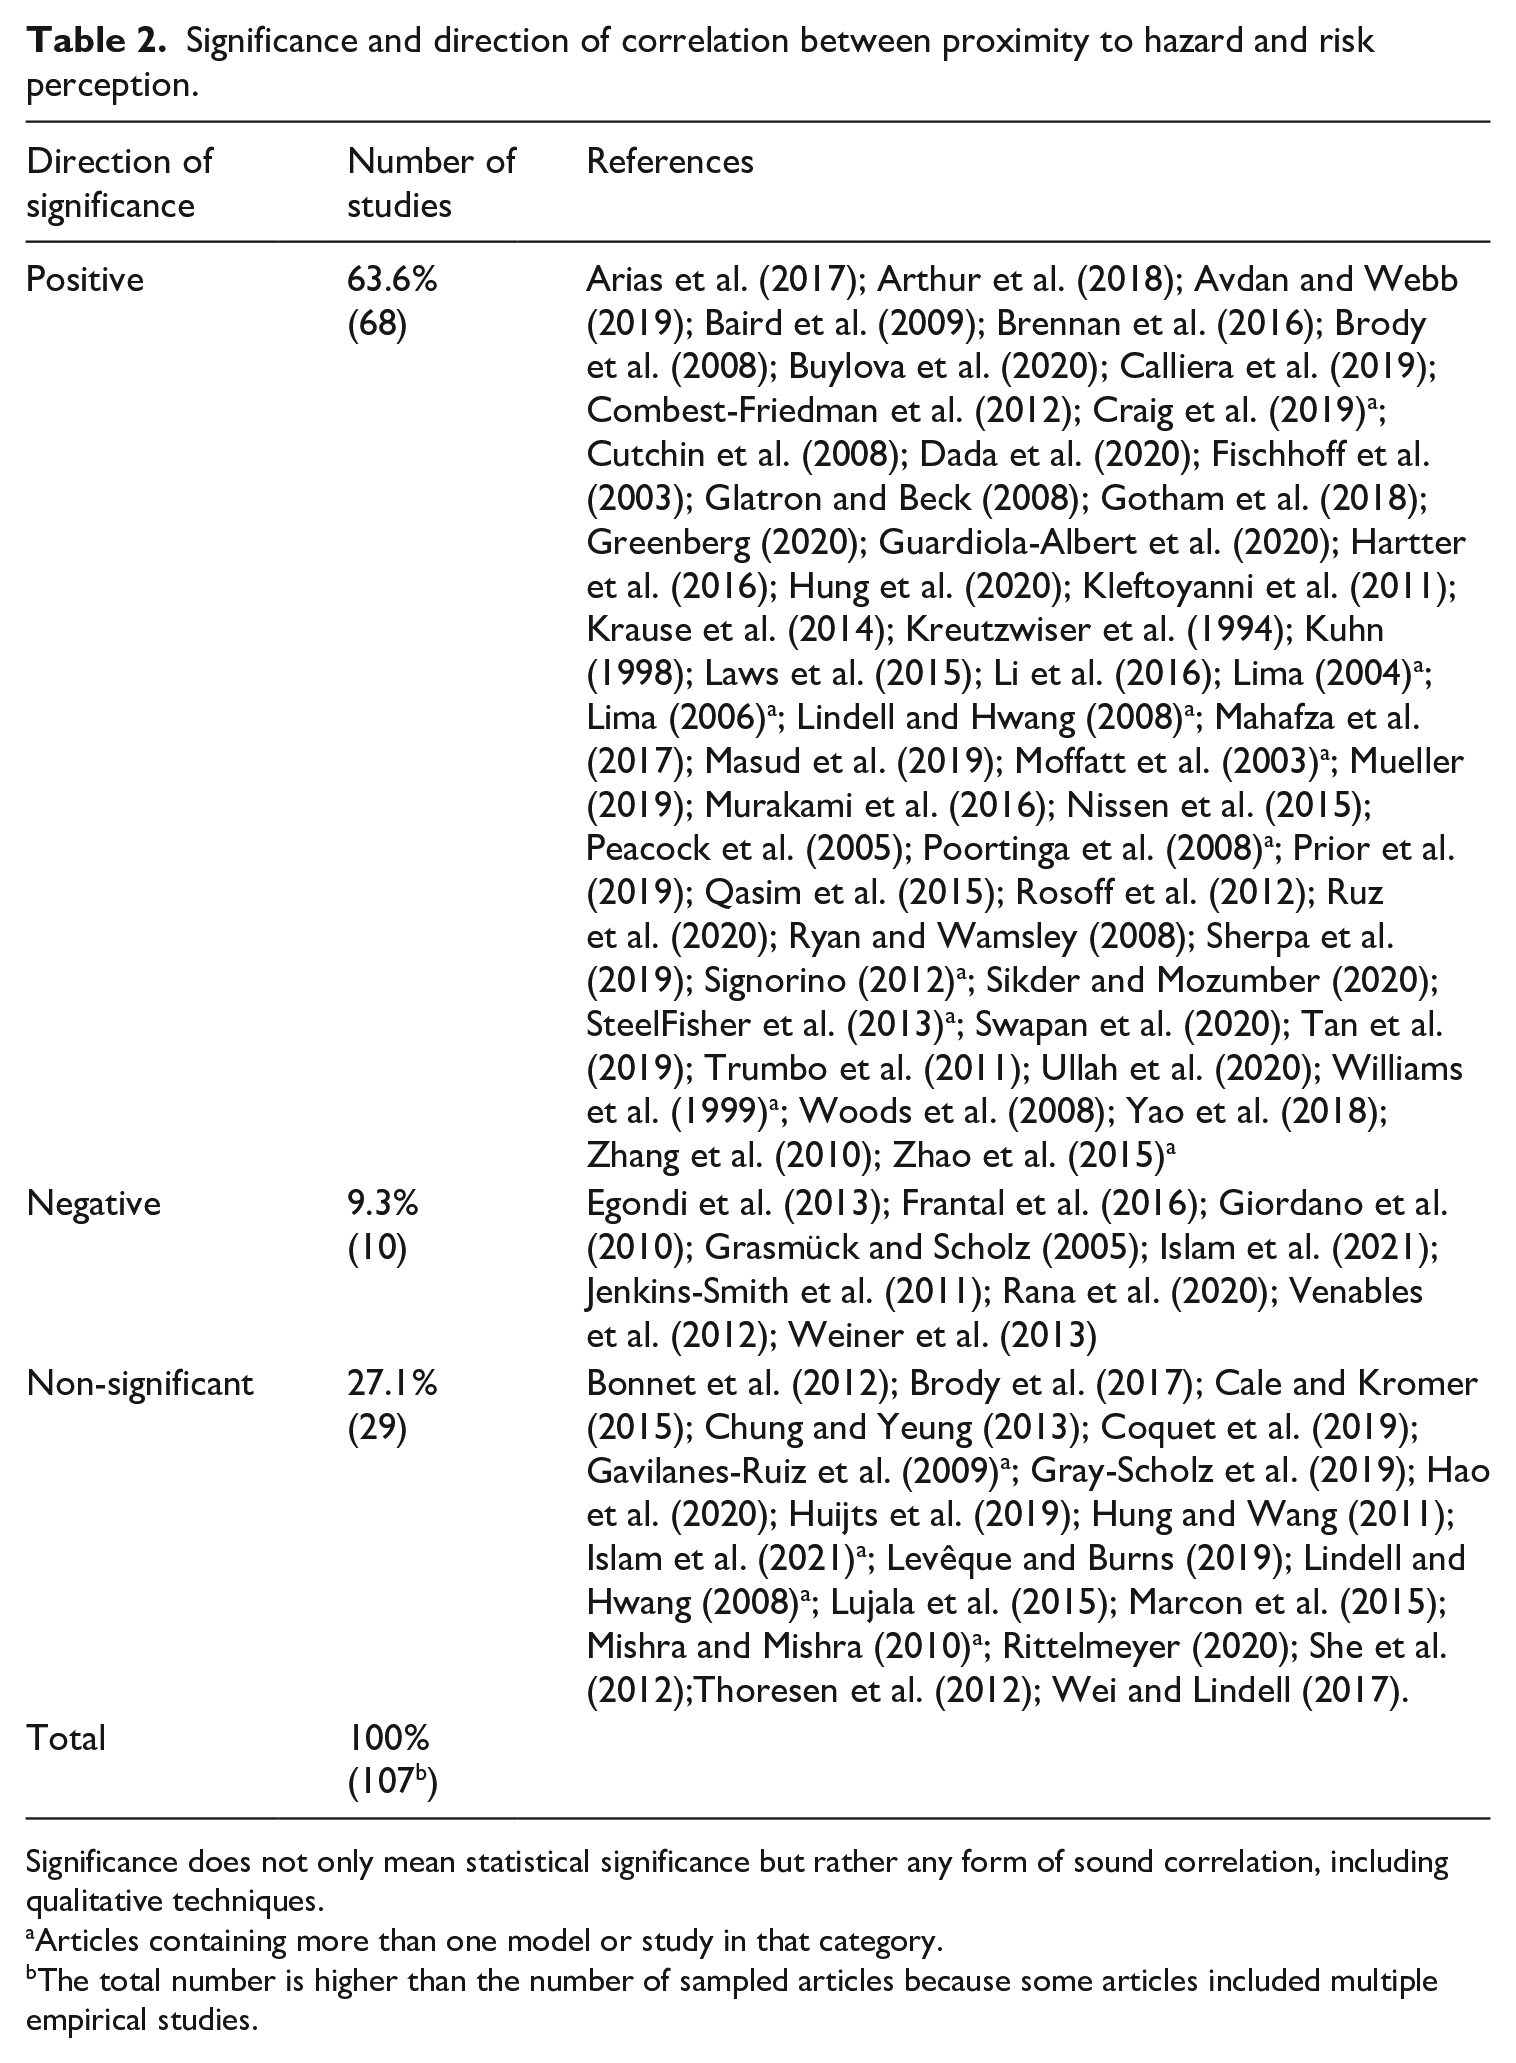
Significance does not only mean statistical significance but rather any form of sound correlation, including qualitative techniques.
Articles containing more than one model or study in that category.
The total number is higher than the number of sampled articles because some articles included multiple empirical studies.
Studies that found non-significant correlations were analysing different types of risk. For example, Chung and Yeung’s (2013) study of Hong Kong residents’ perception of risk towards a nuclear power plant found that distance to the plant was not a significant factor explaining risk perception. Gray-Scholz et al. (2019), researching flood perception in Canada, found that the significant predictor of risk awareness was elevation rather than the distance from the source of danger. Thoresen et al. (2012) pointed out that psychological proximity rather than geographical proximity better explained feelings of fear and distress regarding terrorist attacks in Norway.
Of the studies that found a significant relationship, the majority showed a positive relationship (63.6%). However, the remaining articles finding significance (9.3% of the total sample) state a prima facie counter-intuitive result, finding a negative correlation between proximity and risk perception – that is people feeling safer the closer they are to the source of the danger. A negative correlation is more often revealed in studies analysing nuclear risks (see Table 3), but nuclear risks are not the only kind of hazard showing a negative relationship between proximity and risk perception in our sample. Coquet et al. (2019) studied flood risk perception; Egondi et al. (2013) analysed air pollution risk awareness; Islam et al. (2021) investigated several kinds of risk, such as market risks for crop pricing for farmer settlements, and Grasmück and Scholz (2005) explored perceptions of risk associated with soil contaminated by heavy metals.
Nuclear risk by direction of correlation between risk perception and proximity.
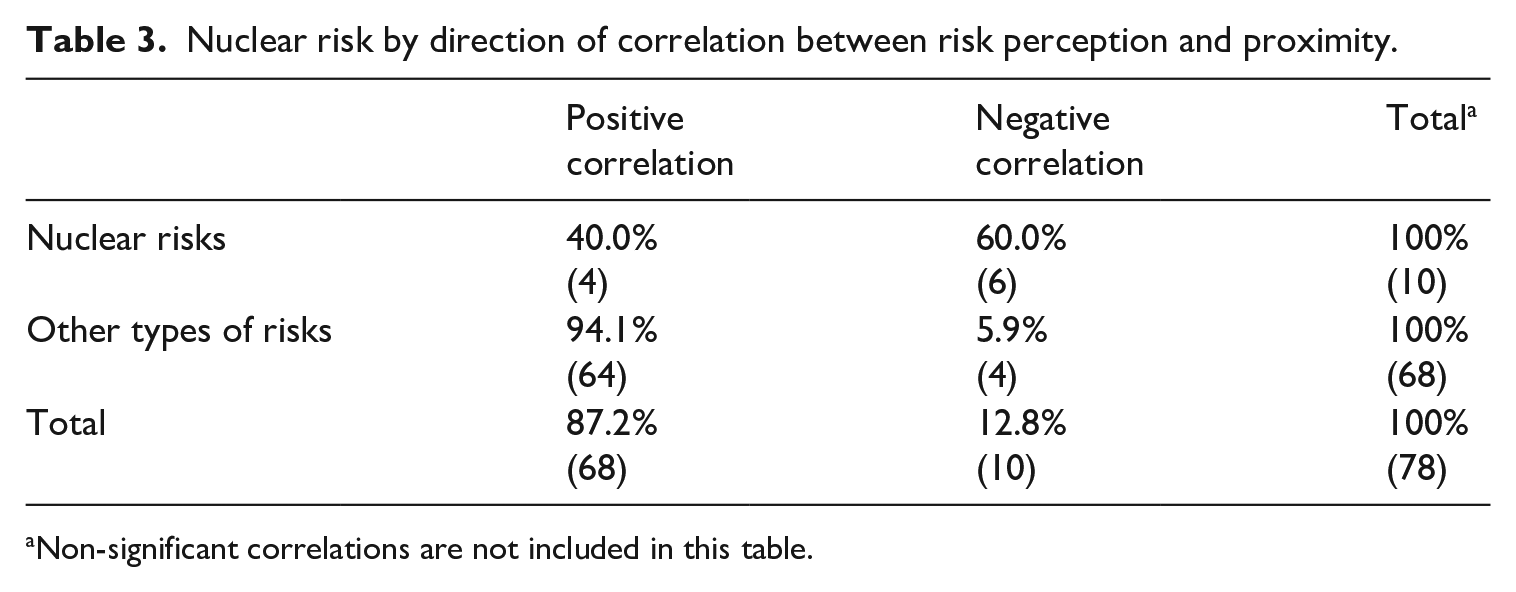
Non-significant correlations are not included in this table.
Reporting of the size of effects of proximity varies a lot in the analysed studies. This variety is related to (1) the different measurements of both the independent variable (proximity) and the dependent variable (risk perception) and (2) different analysis methods used in the studies (e.g. correlations, regression models, etc.). Only 30.3% of studies clearly reported the size of effect of proximity (when this effect was significant).
Types of risk and objects at risk
The World Economic Forum’s (2020) typology of risks was used to code the articles. The type of risk was coded considering the source of the risk analysed in articles; one article included several types of risk, so the total percentage of types of risk is higher than 100% (see Figure 2).
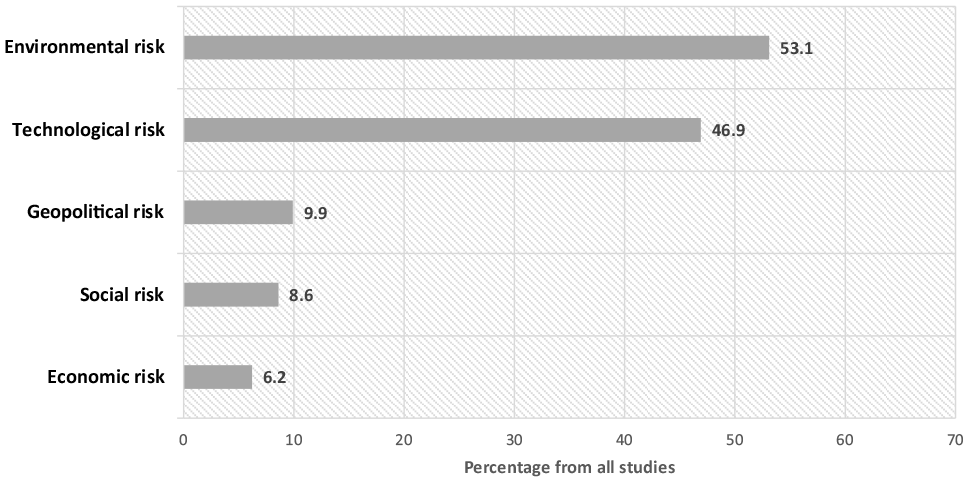
Types of risk analysed in articles, % (N = 81).
Environmental risks (43 articles) and technological risks (38 articles) dominate in the pool of articles dealing with the influence of proximity on risk perception. This tendency might be related to the character of these risks, as these types of risk have a clearer spatial dimension and they are often related to the specific locations (e.g. floods, highways, industrial facilities or similar). Technological and environmental risks are often interrelated – for example, industrial facilities often cause high air or water pollution in the local area.
The proximity dimension of geopolitical risk perception was mainly related to terrorist attacks in studies analysing cases related to the 9/11 World Trade Centre terrorist attack in 2001 (Fischhoff et al., 2003), and the Oslo and Utøya Island attack in 2011 (Nissen et al., 2015; Thoresen et al., 2012). Terrorist risk perception is often related to past experience of close proximity to an attack site. Social and economic risks are analysed in a small number of empirical studies, and they are usually mentioned together with other types of risk. These studies often focus on the complex risks related to the area where respondents live. Social risks, analysed in empirical studies, also include crime, poverty and flu epidemics.
We coded the sources of risk in more detail to be able to classify the types of risk analysed in empirical studies. The relational theory of risk (Boholm and Corvellec, 2011: 178) regards risk as ‘a product of situated cognition positing a relationship of risk linking a risk object and an object at risk’. We thus studied what sources of risk (risk objects) are reported within the analysed articles, and what objects are identified as being at risk. A diversity of sources of risk and objects at risk is communicated in the research articles. The most studied sources of risk have been floods, various natural hazards, industrial facilities and nuclear facilities (see Table 4).
Sources of risk and objects at risk studied in the articles (% and number of articles; N = 81 articles).
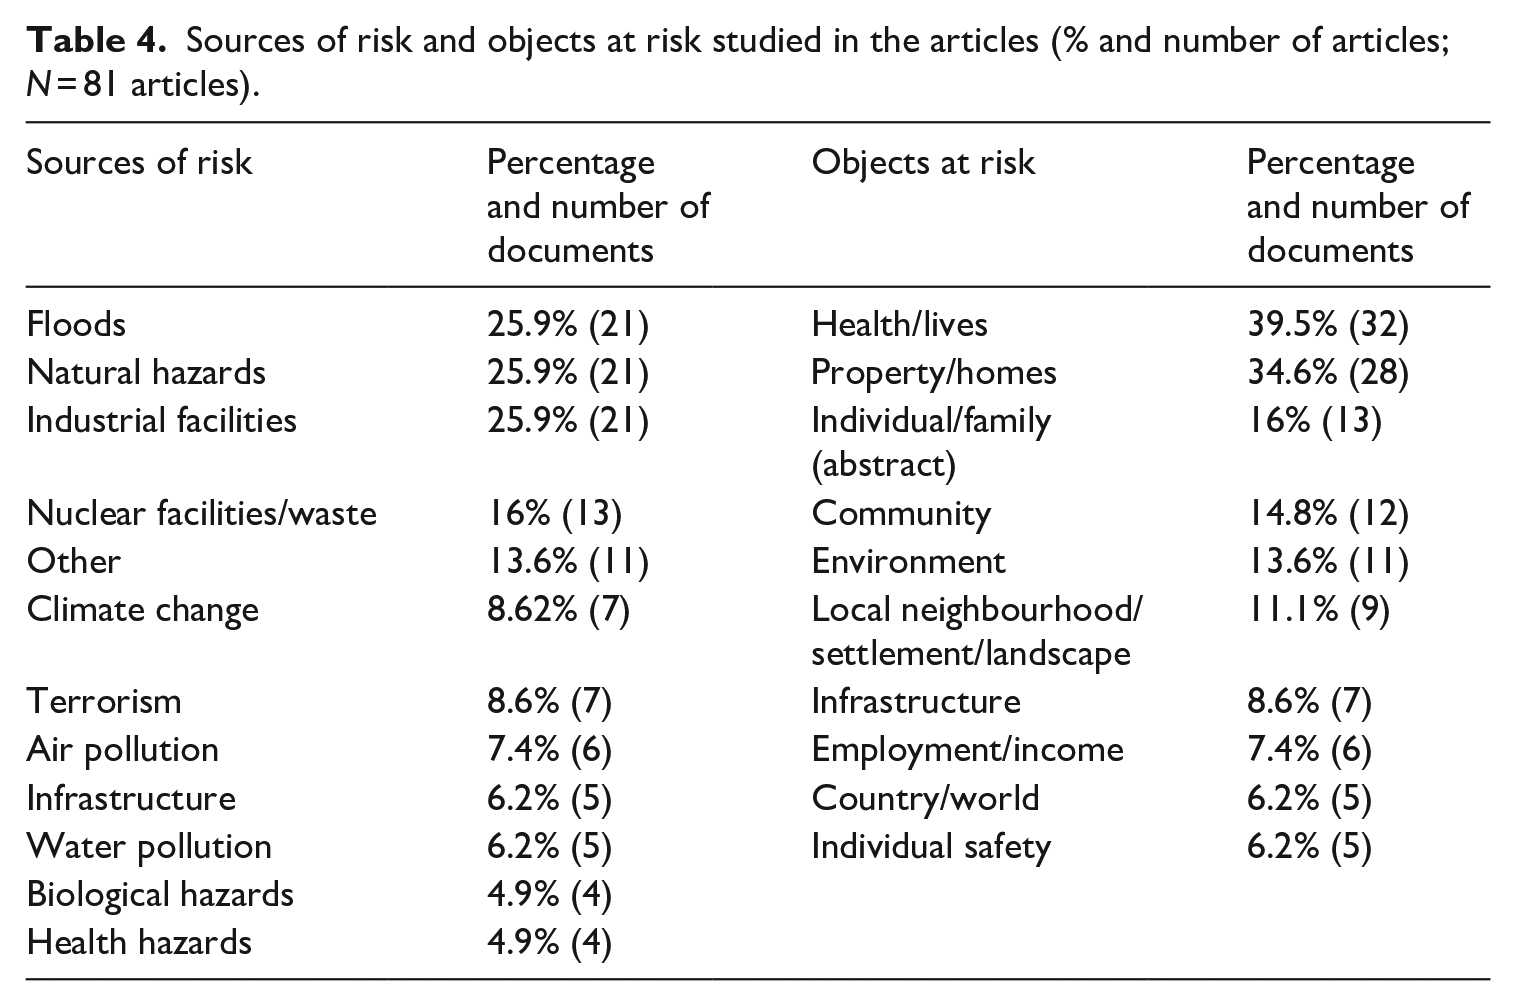
Table 4 also presents a list of the most studied objects at risk. Risks posed to health and life are most often studied, followed by risks to property or homes. While the diversity of risk profiles communicated in the studied articles allows for generalizations in systematic literature reviews, it hinders further meta-analyses, where the effects can be aggregated only when they are measured with reference to a single source of risk affecting one similar object at risk.
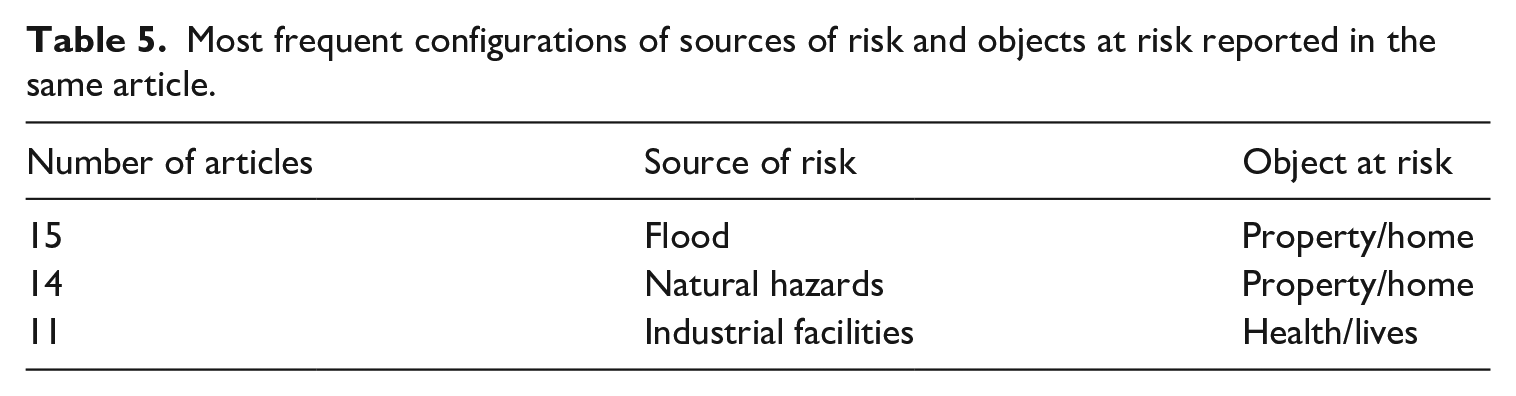
To study the most popular risk profiles – that is the most popular source-of-risk and object-at-risk configurations – we conducted a co-occurrence analysis with MAXQDA (see Table 5). With most of the configurations being very infrequent – for example terrorism co-occurs with risk to health/life in only four articles (Fischhoff et al., 2003; Nissen et al., 2015; Rosoff et al., 2012; Thoresen et al., 2012) and perceptions of risks posed to the environment by nuclear facilities are studied in two articles (Weiner et al., 2013; Williams et al., 1999), three bigger article clusters can be identified. The sources of risk analysed most often are natural hazards or flood risks, and these studies focus mainly on respondents’ perceptions of risk to the home or other properties. However, if the source of risk is an industrial facility, objects at risk in risk perception studies are related to people’s health and lives.
Most frequent configurations of sources of risk and objects at risk reported in the same article.
Conclusion
Müller-Mahn (2013: xvii) notes that ‘Space provides the arena for the overlapping of multiple risks in particular places or regions’. In this article, we aimed at summarizing the perception of multiple risks and how individuals’ proximity to risk objects can explain the variance in public risk perception. The systematic literature review revealed that studies analysing proximity and risk perception can be divided into two areas in a very broad sense, related to the twofold meaning of ‘proximity’. (1) The proximity of an individual to a specific hazard, object or event: This type of study usually focuses on one type of risk (such as an industrial facility, terrorist attack or flood) that can be located and measured in space and time. (2) The level of risk in the area where the individual lives: This type of research refers to types of risks that do not have a clear spatial dimension, such as crime, poverty or pollution. Usually, this type of study will look at the complexity of hazards in a specific area, identifying spatial vulnerabilities. A wide range of risk profiles were identified. A risk profile refers to a configuration of source of risk and object at risk studied together. Floods, various natural hazards, industrial facilities and nuclear facilities were most often identified as sources of risk, while people’s health and lives, as well as their property and homes, were most often identified as objects at risk.
Our study explored the methodological characteristics of empirical studies on the effects of proximity on risk perception. We revealed certain research gaps, inadequacies in the reporting of major methodological elements and problems in the semantics of questionnaires. Almost half of the studies have been conducted in the United States, and almost three-quarters if we include European countries and Canada. This focus on highly developed regions for risk perception studies may misrepresent the effect of proximity because these countries and regions do not fall into areas of high risk. For example, according to the Global Guardian’s (2020) global risk assessment map, the regions with the highest multiple risk indexes are Africa, the Middle East and South America. Considering the methods and samples in the analysed articles, a serious drawback of some studies is the poor specification and description of the methods used in their analysis. This gives rise to major difficulties when it comes to assuring reliability, the generalization of conclusions and the possibility of replicating the study.
The review of risk perception operationalization in survey questionnaires and other research instruments revealed that there is no semantic consistency in the wording of questions. Different wording of questions may elicit different public understanding of the risks under investigation. Another challenge is that there is no consistency of proximity measurement or risk perception measurement scales; therefore, it is not justifiable to draw general conclusions on effect sizes. Thus, we rather focused on the direction (positive or negative) of the proximity effect on risk perception. Even if subjective risk perception might not seem an easily quantifiable concept in survey research, the field of spatial risk research might benefit from a more coherent approach in operationalising ‘risk perception’ and ‘proximity’.
The main research question presented in this study was related to the relationship between proximity and public risk perception. Two-thirds of the analysed studies identified a significant relationship, and most often, the correlation was positive. However, some studies identified a negative relationship between proximity and risk perception. We found that this tendency is usually relevant to nuclear risks when people living closer to nuclear power plants have a lower risk perception. Scholars propose several ways to explain the negative correlation between proximity and risk perception. For example, Egondi et al. (2013) attributed their negative correlation results to the tendency to assign pollution to other areas away from people’s place of residency. This ‘hyperopia effect’ is also commented on elsewhere (Uzzell, 2000). Grasmück and Scholz (2005) noted that from a psychological perspective, individuals living near to hazardous places are more likely to develop dissonance-reducing mechanisms in order to ease their everyday life, avoiding the negative effects of stress and fear. The concept of familiarization of risks (Parkhill et al., 2010) can shed light to help understand the negative correlation of risk perception and proximity, not only when nuclear facilities are involved. When people live for long enough close to a hazard site, this risk area may become part of individuals’ everyday lives and thus the perception of risk could decrease.
The above-mentioned findings of ambiguity in the relation between proximity and public risk perception highlight the aspects of the social construction of risk. Beck (2009: 11) noted that ‘the distinction between risk and cultural perception of risk is becoming blurred’, and even rationalistic understanding of risk from authorities fails to respond to the global complexities of crises. As risks become less calculable, more emphasis is given to culturally and socially determined risk perceptions. The spatial proximity of people to risk objects, analysed in our article, reinforces the individual and collective construction of risk.
The systematic literature analysis provided valuable insights into the range of risks studied in relation to proximity effects. An important finding is that the perception of different types of risks most often, but not always, depends on the proximity of the individual to the risk object. The geographical imbalance of the studies conducted, semantic differences in the operationalization of variables and the methodological incompleteness of some research descriptions do not allow generalizability of the effect size or identification of cultural differences. This study contributes to the further development of spatial empirical research in the field of public risk perception and encourages more attentive reporting of methodological elements in empirical studies.
Footnotes
Acknowledgements
The authors thank the participants of the Annual Meeting of the Society for Risk Analysis (SRA) ‘Risk Science for Sustainability’ in 2020, where the previous version of this paper was presented.
Funding
The author(s) disclosed receipt of the following financial support for the research, authorship and/or publication of this article: This research was funded by a grant from the Research Council of Lithuania (No. S-MIP-19-28) ‘Mapping of Risk Perception in Lithuania: Spatial and Socio-psychological Dimensions (Risk-Space)’.