
Abstract
Given the demands for inclusive and more equitable education, this evaluation compared two versions of the Just Like You disability awareness program delivered in primary schools in New South Wales, Australia, by Cerebral Palsy Alliance. Participants included 297 students from three schools in the Hunter region in the established program and 327 students from four schools in the Sydney region in the newer version of the program. Compared with the established program, the new format comprised a single presenter with a disability, two shorter sessions (rather than one long session) delivered at least one week apart, revised content mapped to the Australian rather than the NSW curriculum and a non-compulsory ‘homework’ activity offered at the discretion of the presenter. Longitudinal data included three successive administrations (i.e. pre-test, post-test and delayed follow-up) of the Chedoke-McMaster Attitudes towards Children with Handicaps scale. Quasi-experimental comparisons produced intake-adjusted effect sizes favouring the newer program over the established program both in terms of post-test (d = 0.47) and delayed follow-up (d = 0.42) Chedoke-McMaster Attitudes towards Children with Handicaps scores. The program evaluation demonstrated the efficacy and sustainability of effects in this short-term focussed disability awareness intervention, with the newer version producing greater improvements in student attitudinal change towards people with a disability than the established version.
Keywords
Introduction
As we move more firmly into the twenty-first century, it is time now for ideas and policy about inclusion to move forward once more, to fold around a range of matters concerning learning, community, identity and belonging. Inclusion has to be conceived with many surfaces – disability, certainly, and social justice, no less – but now other facets of life at school: community, social capital, equality and respect. (Thomas, 2013, p. 474)
Research shows that negative attitudes towards children with a disability have an ongoing impact on the quality of life of children with a disability. Such attitudes affect their emotional, social, cognitive and physical wellbeing and have potential long-term implications, especially for their mental health (Lindsay, 2016; Lindsay & McPherson, 2012; Son, Parish, & Peterson, 2012). Disability awareness programs are often used to modify children’s attitudes to peers and others with a disability (see Tavares, 2011 for example).
Disability awareness programs focus on different participant ages and take many different forms and structures (Favazza & Odom, 1997; Rillotta & Nettelbeck, 2007). Common examples include programs for disability simulation, cognitive interventions, personal contacts with people with disabilities and information-based approaches. Some forms of intervention have been designed specifically for children, with the focus on the affective component of attitude, and less attention given to the cognitive aspects concerned with improving children’s knowledge of disability (Godeau et al., 2010).
Just Like You (JLY), a disability awareness program designed by Cerebral Palsy Alliance (CPA), aims to increase the awareness of the impact of disability on individuals and to demystify social stigmas associated with those who have a disability. The JLY program educates primary school students to develop understanding, acceptance and inclusive attitudes towards people with a disability, helping them recognise that people with a disability are ‘just like you’. The JLY program was delivered to over 25,000 primary school students in New South Wales (NSW) between 2006 and 2015. A group of consultants were recently engaged to refresh and extend the content of the JLY program across the primary years (for students aged 8–11, rather than those aged 10 and 11 only); two versions of the program (established and new) were subsequently delivered in different regions of NSW, Australia.
An earlier study undertaken when the JLY program was first developed (Ison et al., 2010), showed improvement in students’ knowledge and attitudes towards people with a disability, but concluded that further evaluation was required to determine whether these changes could be sustained over an extended period of time. Thus, the aims of the present study were to build on and extend beyond the earlier study by examining the longitudinal impact of the program, and to compare and contrast the two current delivery formats of the JLY program.
In general, there is a need to improve the attitudes of children towards persons with disabilities (Nowicki & Sandieson, 2002) and as Lindsay and McPherson (2012) identified, children with disabilities often feel excluded from activities at school and attribute much of this to a lack of understanding of their disability, thus signalling a need for effective disability awareness programs. Furthermore, it was identified at the time of the earlier study that there were no specific disability awareness programs within NSW which aligned with outcomes in the school curriculum, but that community-based providers may be able to fill this void (Ison et al., 2010). Hence, the earlier (pilot) study was undertaken to evaluate the JLY program designed, developed and delivered by CPA.
The primary aim of the JLY program (a short-term program) studied by Ison et al. was to improve the attitudes of children towards children with a disability, and results from the pilot study showed an improvement in the attitudes of the children who participated in the JLY program (Ison et al., 2010). The study however included three schools only, had no longitudinal components, and made no assessments about the potential role of gender. In another matched group study of 12- to 13-year-old French students, which evaluated the effectiveness of an intervention program aimed at improving students’ attitudes towards students with a disability, Godeau and colleagues (2010) found that over time, the intervention (a mandatory comprehensive educational project on disability) had no significant effect on Chedoke-McMaster Attitudes Towards Children with Handicaps (CATCH) scores. However, other researchers have reported that the duration of disability awareness programs does impact on program effectiveness (Brown, Ouellette-Kuntz, Lysaght, & Burge, 2011; Rillotta & Nettelbeck, 2007). Consequently, the aims of the current study were to establish the extent of the impact of the JLY program on attitudes of students towards students with a disability; determine the extent to which any changes were sustained over time; and, examine and compare the effectiveness of both delivery formats of the JLY program.
Methodology
This study set out to establish the type and degree of change associated with two versions of the short-term classroom-based JLY program (i.e. established and newer version), and to test the sustainability of any associated changes in the medium term (i.e. approximately three months post-intervention).
The classroom intervention programs
The two formats of the JLY program that were evaluated in this study are described in Table 1. The established program, an adaptation of that evaluated by Ison et al. (2010), which used a combined cognitive-behavioural approach (including contact with people with disabilities) and consisted of two sessions of 90 minutes each (p. 366). CPA changed to the new program in the Sydney region in 2015 as an improvement initiative. The JLY program was offered for the first time in Hunter region schools in 2015. However, the agreement with the sponsor (CPA) was to use the established program in the Hunter region schools and help fund the evaluation to establish the relative efficacy of the two delivery formats. Both programs in the current evaluation involved half the face-to-face contact time (one 90-minute or two 45-minute sessions) but used a cognitive-behavioural approach, similar to that of the original program previously evaluated by Ison et al. (2010). All programs had, for example students interacting with a person with a disability with time for questions and answers, discussion of different types of disabilities and discussions about appropriate communication/language towards people with a disability.
Comparison of the established and new delivery formats.
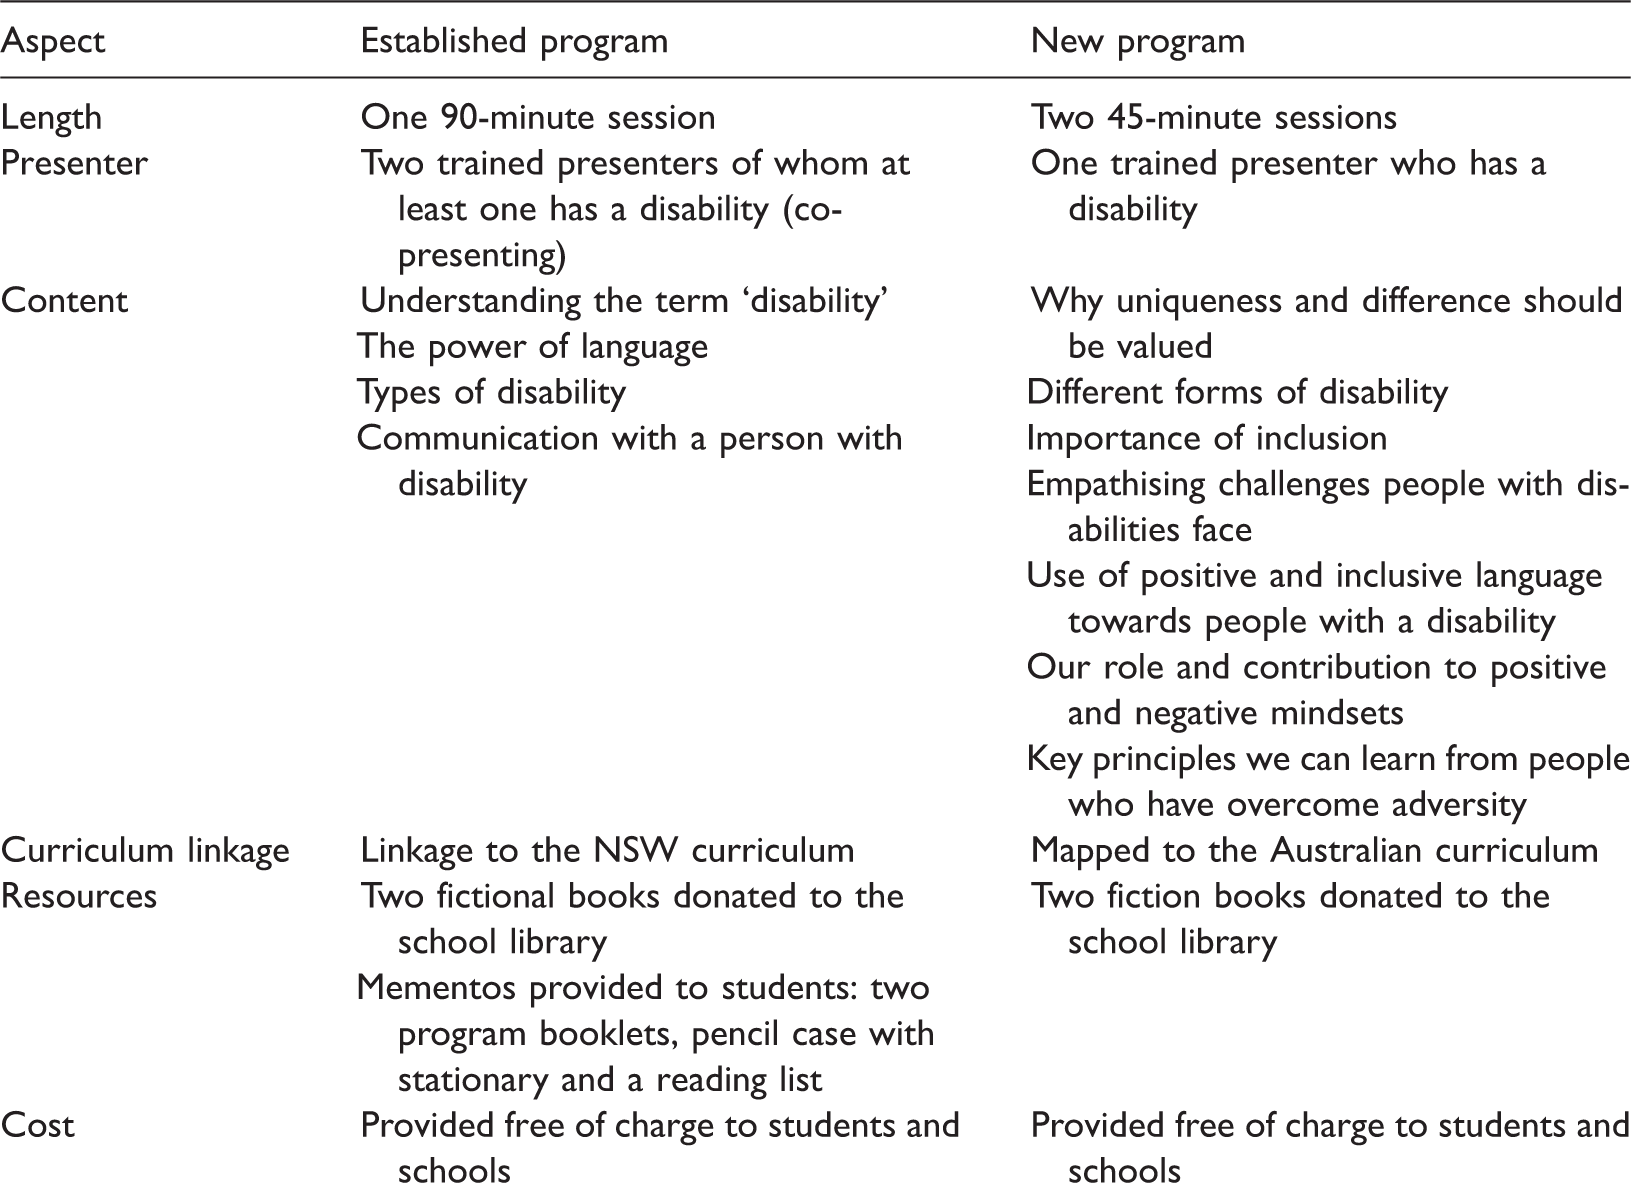
Source: Cerebral Palsy Alliance promotional materials.
In comparison with the established program, the new format comprised a single presenter with a disability, two shorter sessions (rather than one long session) delivered at least one week apart, revised session content mapped to the Australian (rather than the NSW curriculum) and a non-compulsory ‘homework’ activity offered at the discretion of the presenter. Booklets or mementoes were not provided. Presenters in both the Sydney and Hunter regions had received on the job training and were experienced in engaging and working with children. The same presenter delivered the program to all the Sydney schools. In contrast, in the Hunter region, pairs of trainers – one with a disability and one without a disability – delivered the program, whereby a different pair could deliver the program in different schools (see Table 1).
Recruitment and participants
Participants were recruited from seven government primary schools in the Sydney (four schools) and Hunter 1 (three schools) regions of NSW, Australia. These seven government schools were purposely selected from government schools that had already agreed to participate in the JLY program. Selection was based on class numbers, commencement date of the program and consent from the principal to participate in the study.
To maintain confidentiality throughout this article, the four Sydney region schools are referred to as S1, S2, S3 and S4, and the three Hunter region schools are referred to as H1, H2 and H3. Table 2 details the student population and Index of Community Socio-educational Advantage (ICSEA) 2 for each of the schools recruited.
Characteristics of schools in the study.
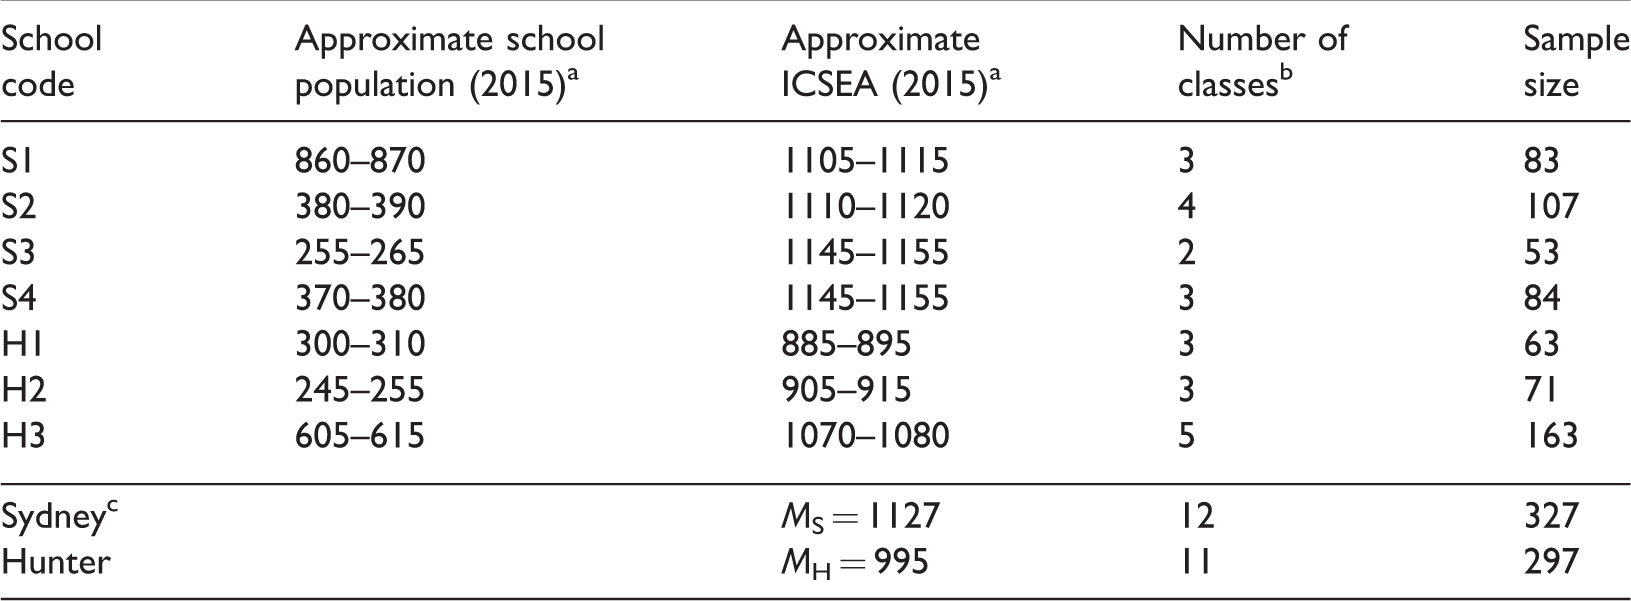
Notes: ICSEA: index of community socio-educational advantage; MS: mean of Sydney schools involved; MH: mean of Hunter schools involved.
aValues are reported in bands to maintain the confidentiality of schools.
bNumber of classes from each school invited and participating in the study.
cSydney and Hunter weighted average ICSEA for the schools in each program.
School S1 was the largest school from the Sydney region involved in the study and the largest overall. School H3 was the largest school in the Hunter region sample but considerably smaller than S1. The total sample size for each region, including all students that participated on at least one occasion, was similar between the two regions (Sydney schools, N = 327, 10% larger than Hunter schools N = 297). Twelve classes from the Sydney region were invited and participated in the study with similar average class sizes between regions (MS = 27.25, standard deviation (SDS) = 9.23), while 11 were from the Hunter region (MH = 27.00, SDH = 7.11). The average weighted ICSEA score for participating schools was 1127 for the Sydney sample (1.27 SDs above the national average ICSEA of 1000, SD = 100) and 995 for those from the Hunter region (0.05 SDs below the national average).
Participants were recruited from Stage 3 3 in the above-mentioned schools. All students in Years 5 and 6 (generally 10- to 11-year-olds) at these schools were invited to participate in the evaluation, excluding S1 where participants were only from Year 5 (Year 6 students at S1 were not receiving the program at the same time as Year 5 or within the study period). There were no exclusionary factors. This age group was chosen in collaboration with CPA as the established format (Hunter) had been delivered to Stage 3 only, and to allow a fair comparison with the new delivery format, only those students from Stage 3 were invited to be involved.
This study was approved by the University’s Human Research Ethics Committee (HREC H2015-0130) and the State Education Research Applications Process (SERAP 2015265). Institutional consent for this study was obtained from the school principal prior to commencement of the study. Opt-out consent forms were provided to parents, since the school’s participation in the JLY program formed part of the regular classroom program. Students were also provided with a mechanism to opt-out on their own volition at the time of completion of the survey. Consent was also sought from the JLY program presenter(s) in each school.
Research design
In order to minimise the burden on and disruption to the delivery of the JLY program, a quasi-experimental design was chosen for the overall evaluation. The schools were assigned to one of two intervention groups by region (intervention Group 1 – Hunter schools; intervention Group 2 – Sydney schools) based on the delivery formats (i.e. two 45-minute session in the Sydney schools and one 90-minute session in the schools in the Hunter region) set by CPA.
The inclusion criteria consisted of participation in the JLY program in Term 3 or 4, 2015; institutional consent from the school principal to participate in the study (evaluation of the JLY program); sufficient student numbers in Stage 3 (minimum 25); and, location in either the Sydney region (where the new program was being delivered) or the Hunter region (where the established program was being received). The original design (see Table 1) included four schools in each of three groups, with Group 1 receiving the established program, Group 2 receiving the new program and Group 3 comprising two schools from each region, designated as the wait-list control group. However, difficulties with recruitment outside the researchers’ control forced a modification to the intended design, reducing the number of schools in the Hunter region to three and precluding the use of the wait-list control group.
Participants
Background and demographics
Table 3 presents background and demographic characteristics of the participants at baseline (N = 497). Overall, 53% (n = 263) of the sample were in Sydney schools and 47% (n = 234) in Hunter schools at baseline. Fifty-six percent of the overall sample was female and 44% male, which was relatively consistent across the two regions. The balance between year levels favoured Year 5 students overall (59%) but was more marked in the Sydney sample (65%) compared with the Hunter sample (52%). A higher percentage of the Hunter sample reported having a family member with a disability (46%) and a friend with a disability (52%) compared with the Sydney sample (29 and 33%, respectively).
Baseline characteristics of participants by location.
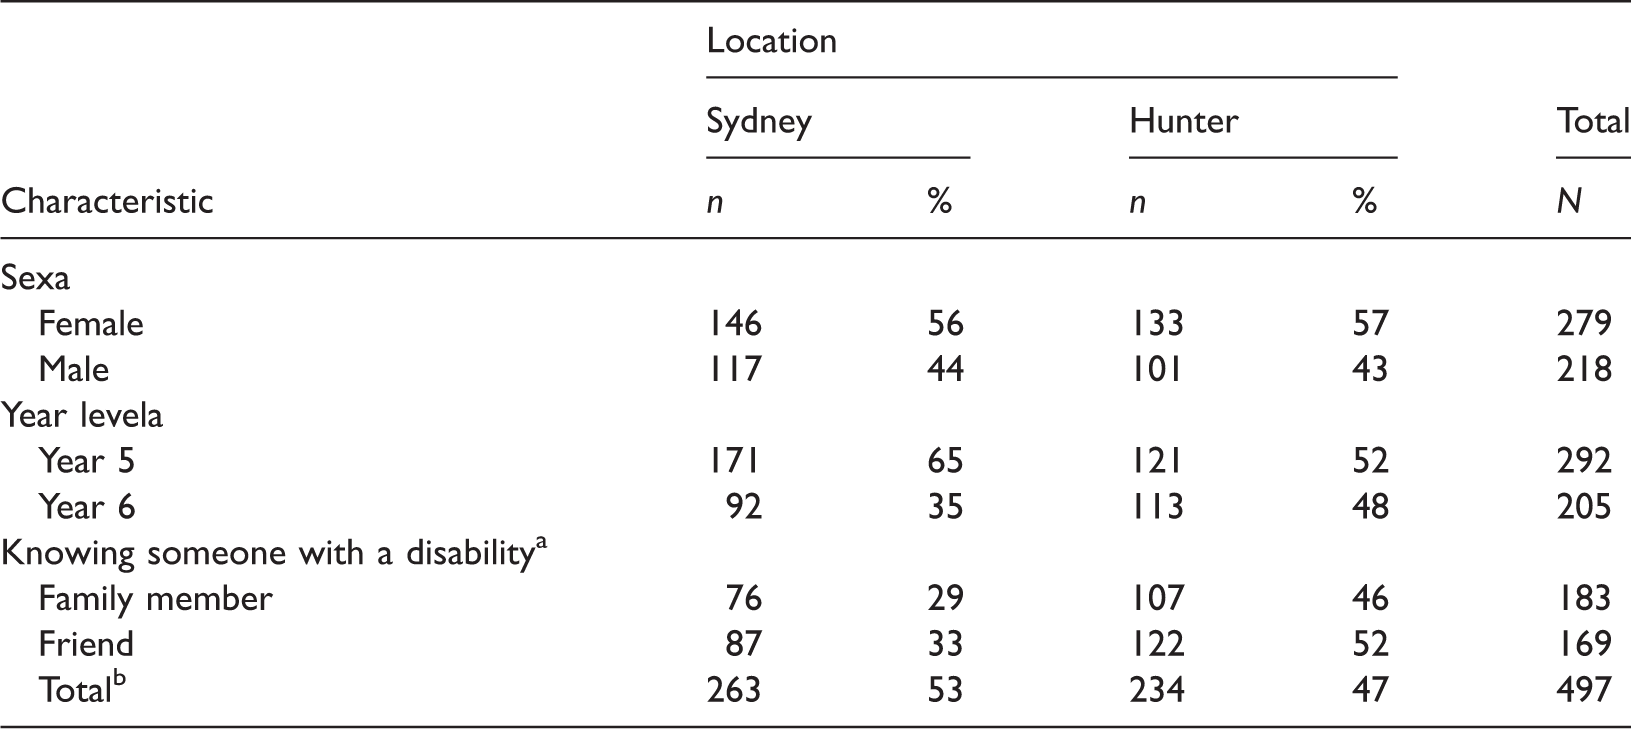
aPercentage of regional sample.
bPercentage of full sample analysed for primary outcome.
A total of 624 students responded to the survey on at least one or more occasions with a total of 497 usable surveys (a response rate of 79.6%). However, there was a relatively high incidence of missing data across occasions and the number of participants with valid data on the CATCH scales in both Sydney and the Hunter varied between occasions and across scales. The minimum number of respondents was 211 for overall CATCH on the follow-up administration in the Hunter and the maximum number of respondents was 262 for the affective and behavioural subscales on post-test administration in Sydney. These numbers were sufficient to establish statistical effects across the groups over time (Punch & Oancea, 2014).
Instruments and data collection
Assessments were conducted pre-intervention (baseline), post-intervention and at delayed follow-up. Baseline assessments occurred in the week prior to students receiving the JLY program, post-intervention assessments occurred within two weeks of receiving the program, and delayed follow-up approximately three months after the last JLY program session at each school. At all assessment sessions, an experienced research assistant read out the instructions and subsequently the questions to the students as they concurrently worked through the questions on a paper-based questionnaire.
The students completed a revised version of the internationally validated and reliable CATCH scales to measure their attitude towards children with a disability (Moore & Nettelbeck, 2013; Rosenbaum, Armstrong, & King, 1986; Vignes, Coley, Grandjean, Godeau, & Arnaud, 2008).
Permission was sought from and given by the author (Rosenbaum) to modify the wording of the original scales. The revisions included replacing some out-dated terminology (e.g. ‘retarded’ was replaced with ‘intellectual disability’, and ‘handicapped child’ with ‘child with a disability’).
To maintain consistency with the 1986 version of the CATCH scales (Rosenbaum et al., 1986), the final version consisted of 36 items with a 5-point Likert-type response format (strongly disagree, disagree, can’t decide, agree, and strongly agree) scored from 0 to 4. Negatively worded items were reverse-scored in the calculation of scale averages so that a higher total score indicated a more positive attitude towards people with a disability.
The overall CATCH score was calculated by summing the item scores, dividing by 36, and multiplying by 10, which obtained a score out of 40. This approach to scoring was used to ensure consistency with other studies that had used the CATCH questionnaire (Moore & Nettelbeck, 2013; Rosenbaum et al., 1986). These 36 questions consisted of 12 questions for each of the three CATCH sub-scales representing thethethe three components from Triandis’ attitudes model (1971), namely the affective component – related to feelings and emotional reactions (e.g. Item 15: I would be happy to have a child with a disability as a friend), the behavioural component – related to actual or intended behaviours (e.g. Item 7: I would stick up for a child with a disability who was being teased) and the cognitive component – related to knowledge, understandings and beliefs. (e.g. Item 19: Children with a disability know how to behave properly) (as cited in Vignes et al., 2008). In turn, each of the 12 questions in each sub-scale consisted of six positively and six negatively worded questions (Rosenbaum et al., 1986).
In this sample, the CATCH scales were found to have high internal consistency for the overall scale (at baseline, α = 0.90). Moore and Nettelbeck (2013) reported a similar internal consistency (α = 0.93) in their study. For each of the attitude components (affective, behavioural and cognitive) alpha reliability in the current study was 0.82, 0.83 and 0.66, respectively, at baseline. The convention for alpha reliability is that a scale has acceptable reliability if α > 0.7, although the acceptability of this figure remains contentious (Cortina, 1993; Shevlin, Miles, Davies, & Walker, 2000). Nevertheless, the lower reliability of the 12-item cognitive sub-scale flags the need for caution whenever its results are separately interpreted. De-emphasising the cognitive scale is consistent with findings of Bossaert and Petry (2013) who supported the use of a truncated version of the CATCH scales containing only affective and behavioural dimensions but with only seven items in total.
Background data of each student participant included school, class, year level and gender. Two additional questions asked the student participants if they had a family member with a disability (yes/no) and/or a friend with a disability (yes/no). In the post-intervention survey, students were also asked two open-ended questions related to the parts of the JLY program they liked most and liked least and these responses were coded thematically (Creswell, 2013).
As a measure of program fidelity or consistency, the presenters were asked to complete a very brief checklist either directly after each session, or shortly thereafter. The eight items on the checklist related to key concepts of the program (e.g. learning about inspiring Australians with disabilities and qualities of resilient people and challenging pre-conceived ideas about disabilities) with a tick box response option (not covered, incidental coverage, some direct coverage, detailed coverage, not applicable).
Analysis
Reliability analysis was undertaken using the baseline data. The Cronbach’s alpha (α) was used to assess internal consistency for the overall CATCH scale identified as the principal outcome of interest and the three CATCH sub-scales as component outcomes. The initial analysis considered differences in percentage agreement across the CATCH and CATCH sub-scales to help assess the general responsiveness of the student participants to the questions asked.
The main statistical tests were subsequently applied to identify differences between means for pre- and post-assessments for both intervention groups. The approach was to run a univariate analysis of covariance (ANCOVA) using SPSS software (IBM SPSS Statistics for Windows, 2015, version 23.0) to examine if there was a statistically significant difference between program type on post-test CATCH scores controlling for the respective pre-test CATCH scores, and delayed follow-up CATCH controlling for the respective pre-test CATCH scores (i.e. to statistically adjust for intake differences). Any effect associated with the intervention type that was dependent on prior attainment would thus have been ‘factored out’ during analysis. Student gender, having a friend with a disability and/or having a family member with a disability were included as additional fixed factors in the models.
Effect sizes in the current study were determined using Cohen’s d (d = (M2 – M1)/δp), where M2 – M1 is the mean difference between intake adjusted program scores and δp is the pooled SD of the intake adjusted scores). The meta-analysis of 213 school-based social and emotional learning interventions by Durlak, Weissberg, Dymnicki, Taylor, and Schellinger (2011) established average effect sizes of 0.23 for attitudes (including pro-social and attitudes about self) and 0.24 for positive social behaviours. Since the JLY program is a short classroom-based intervention (one 90-minute session in the Hunter program and two 45-minute sessions in the Sydney program) the expectation was that any significant differences would have an effect size in the range 0.16–0.20 (Cheung & Slavin, 2015; Slavin, 2013). Only students who completed the pre-intervention survey, participated in the program and completed the post-intervention or delayed follow-up survey were included in the analysis. In addition, any students that withdrew consent were excluded from the analysis. Statistical significance was set at p <.05 for all analyses.
Results
Percentage agreement (see Table 4) for the overall CATCH scales (representing the per cent scores in the ‘agree’ and ‘strongly agree’ range) was consistently higher for the Sydney program across the CATCH and CATCH sub-scale scores at pre-test, post-test and delayed follow-up compared with the Hunter program. Percentage agreement rates were in the range of 84–89% for the Sydney program and 70–74% for the Hunter program. The exception was for the cognitive sub-scale where percentage agreement rates were 46–66% for the Sydney program and 35–40% for the Hunter program.
CATCH percentage agreement across programs over time.
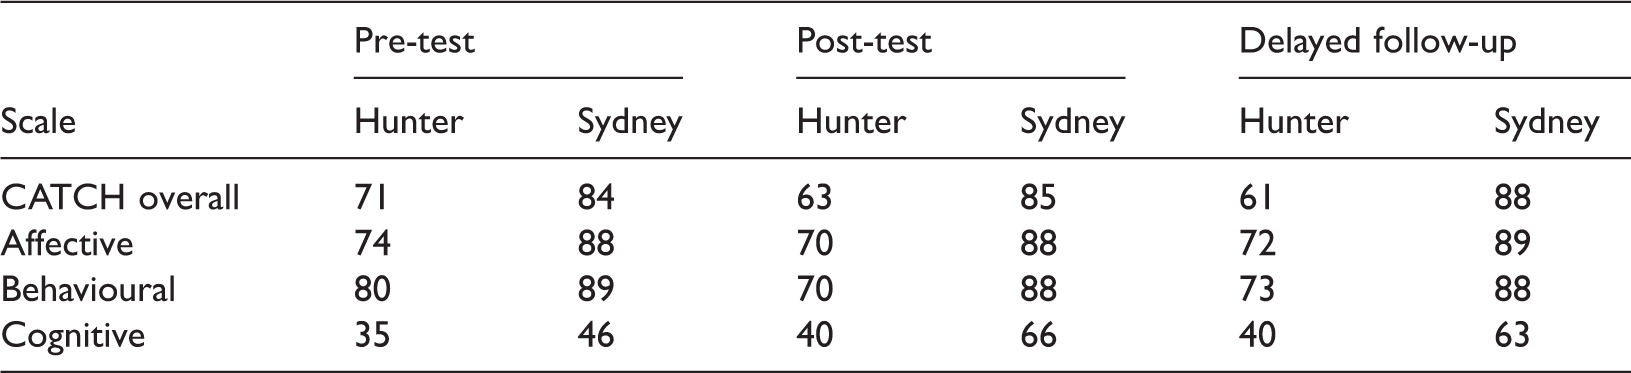
CATCH: Chedoke-McMaster Attitudes towards Children with Handicaps.
There were discernible differences in overall post-test CATCH scores across key segments of the data including having a family member with a disability, having a friend with a disability and being female. However, these differences proved not to be statistically significant after accounting for pre-test scores and therefore have not been reported in detail.
Comparison of program delivery format on the raw CATCH scores
Preliminary analysis also included inspection of the means and 95% confidence intervals of the raw CATCH scores at pre-test, post-test and delayed follow-up to assess the extent to which the raw CATCH results differed between the regions at different points in time (see Figure 1).
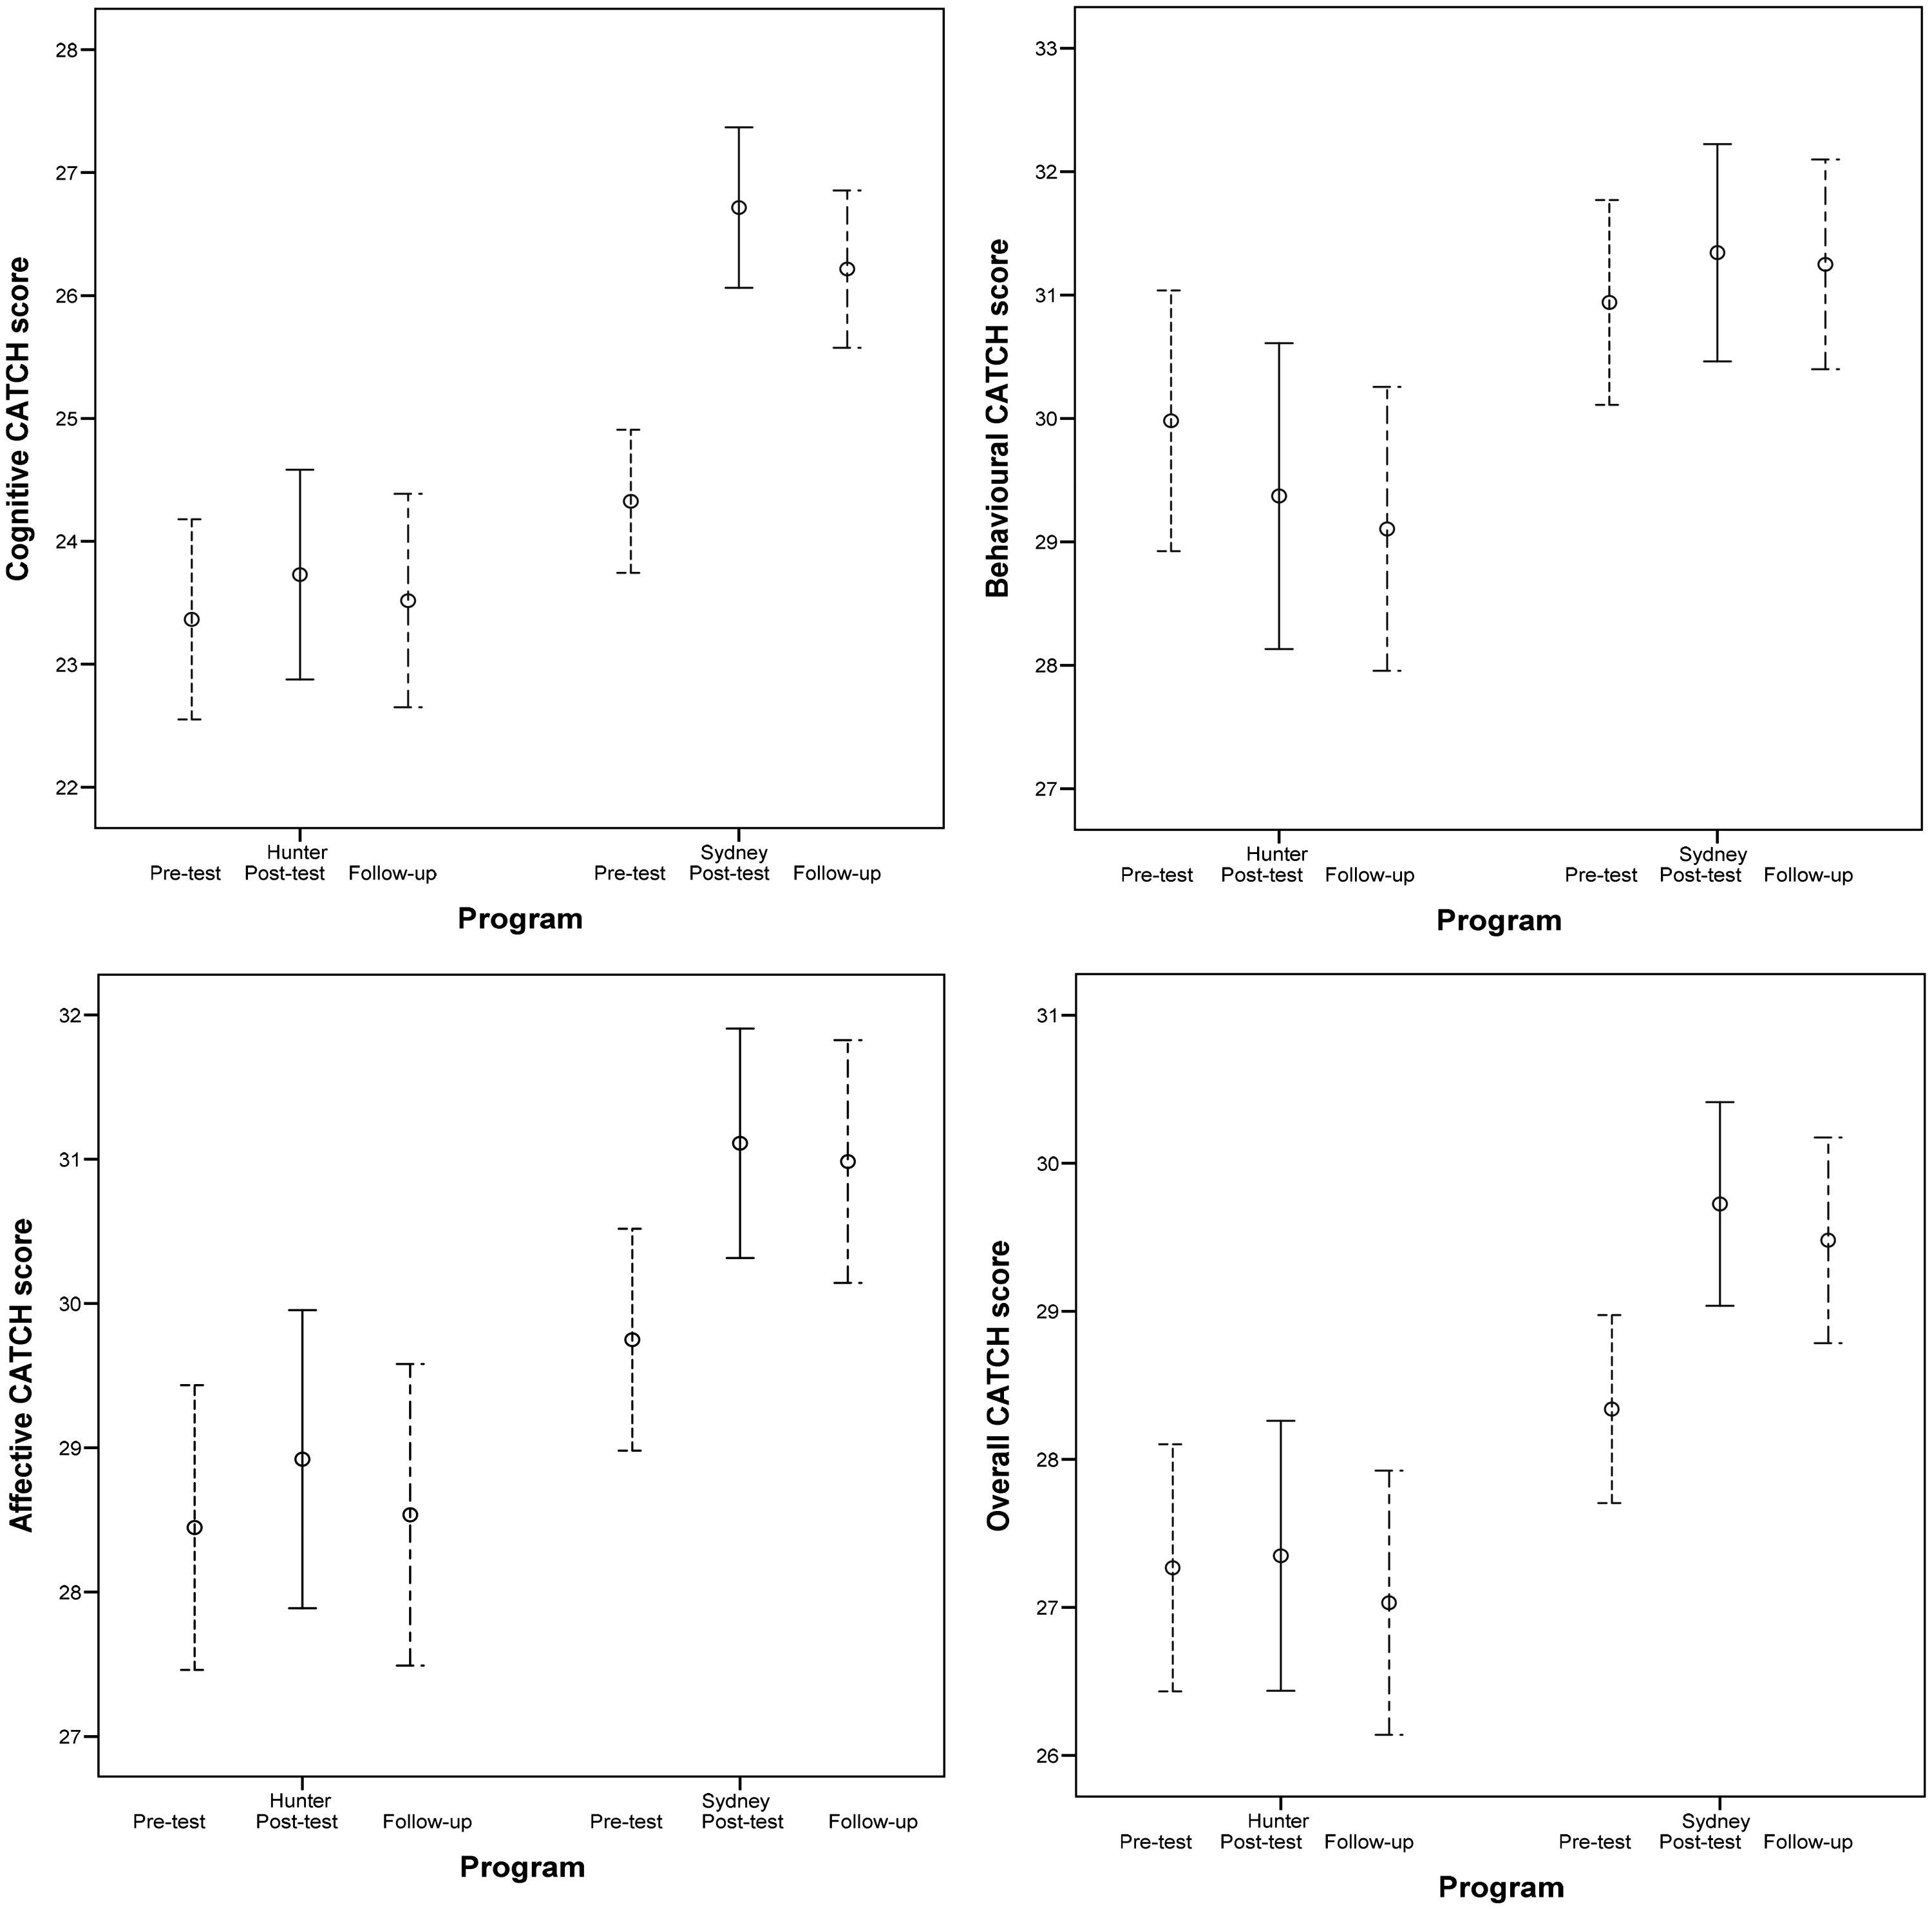
Overall CATCH and CATCH sub-scale scores by region over time. School identifiers were obscured as an additional safeguard against breach of confidentiality. CATCH: Chedoke-McMaster Attitudes towards Children with Handicaps.
The scores in the Sydney program are observably higher than those in the Hunter program across all scales and points of assessment. It is also possible to compare the relative stability of the Hunter program scores over time compared with the upward trends between pre-test and post-test and pre-test and delayed follow-up in the Sydney program scores. Many of the comparisons between the pairs of raw means are statistically significant. However, these comparisons ignore the importance of comparing post-test scores after adjusting for pre-test differences (i.e. to assess the gains made after consideration of where the different groups started). For this reason, they are presented as indicative only and the final comparisons are based on intake-adjusted CATCH scores.
School-level differences were inspected in terms of raw pre-test overall CATCH scores to understand the level of between-school variation and further justify the need to use intake-adjusted comparisons (see Figure 2). A difference could be observed between the three Hunter schools with one having a higher average score and less dispersal compared with the first two Hunter schools, and being more similar to the three highest Sydney schools (F(6, 490) = 119.29, p < .000). The main effect for region was not significant after accounting for between-school differences.
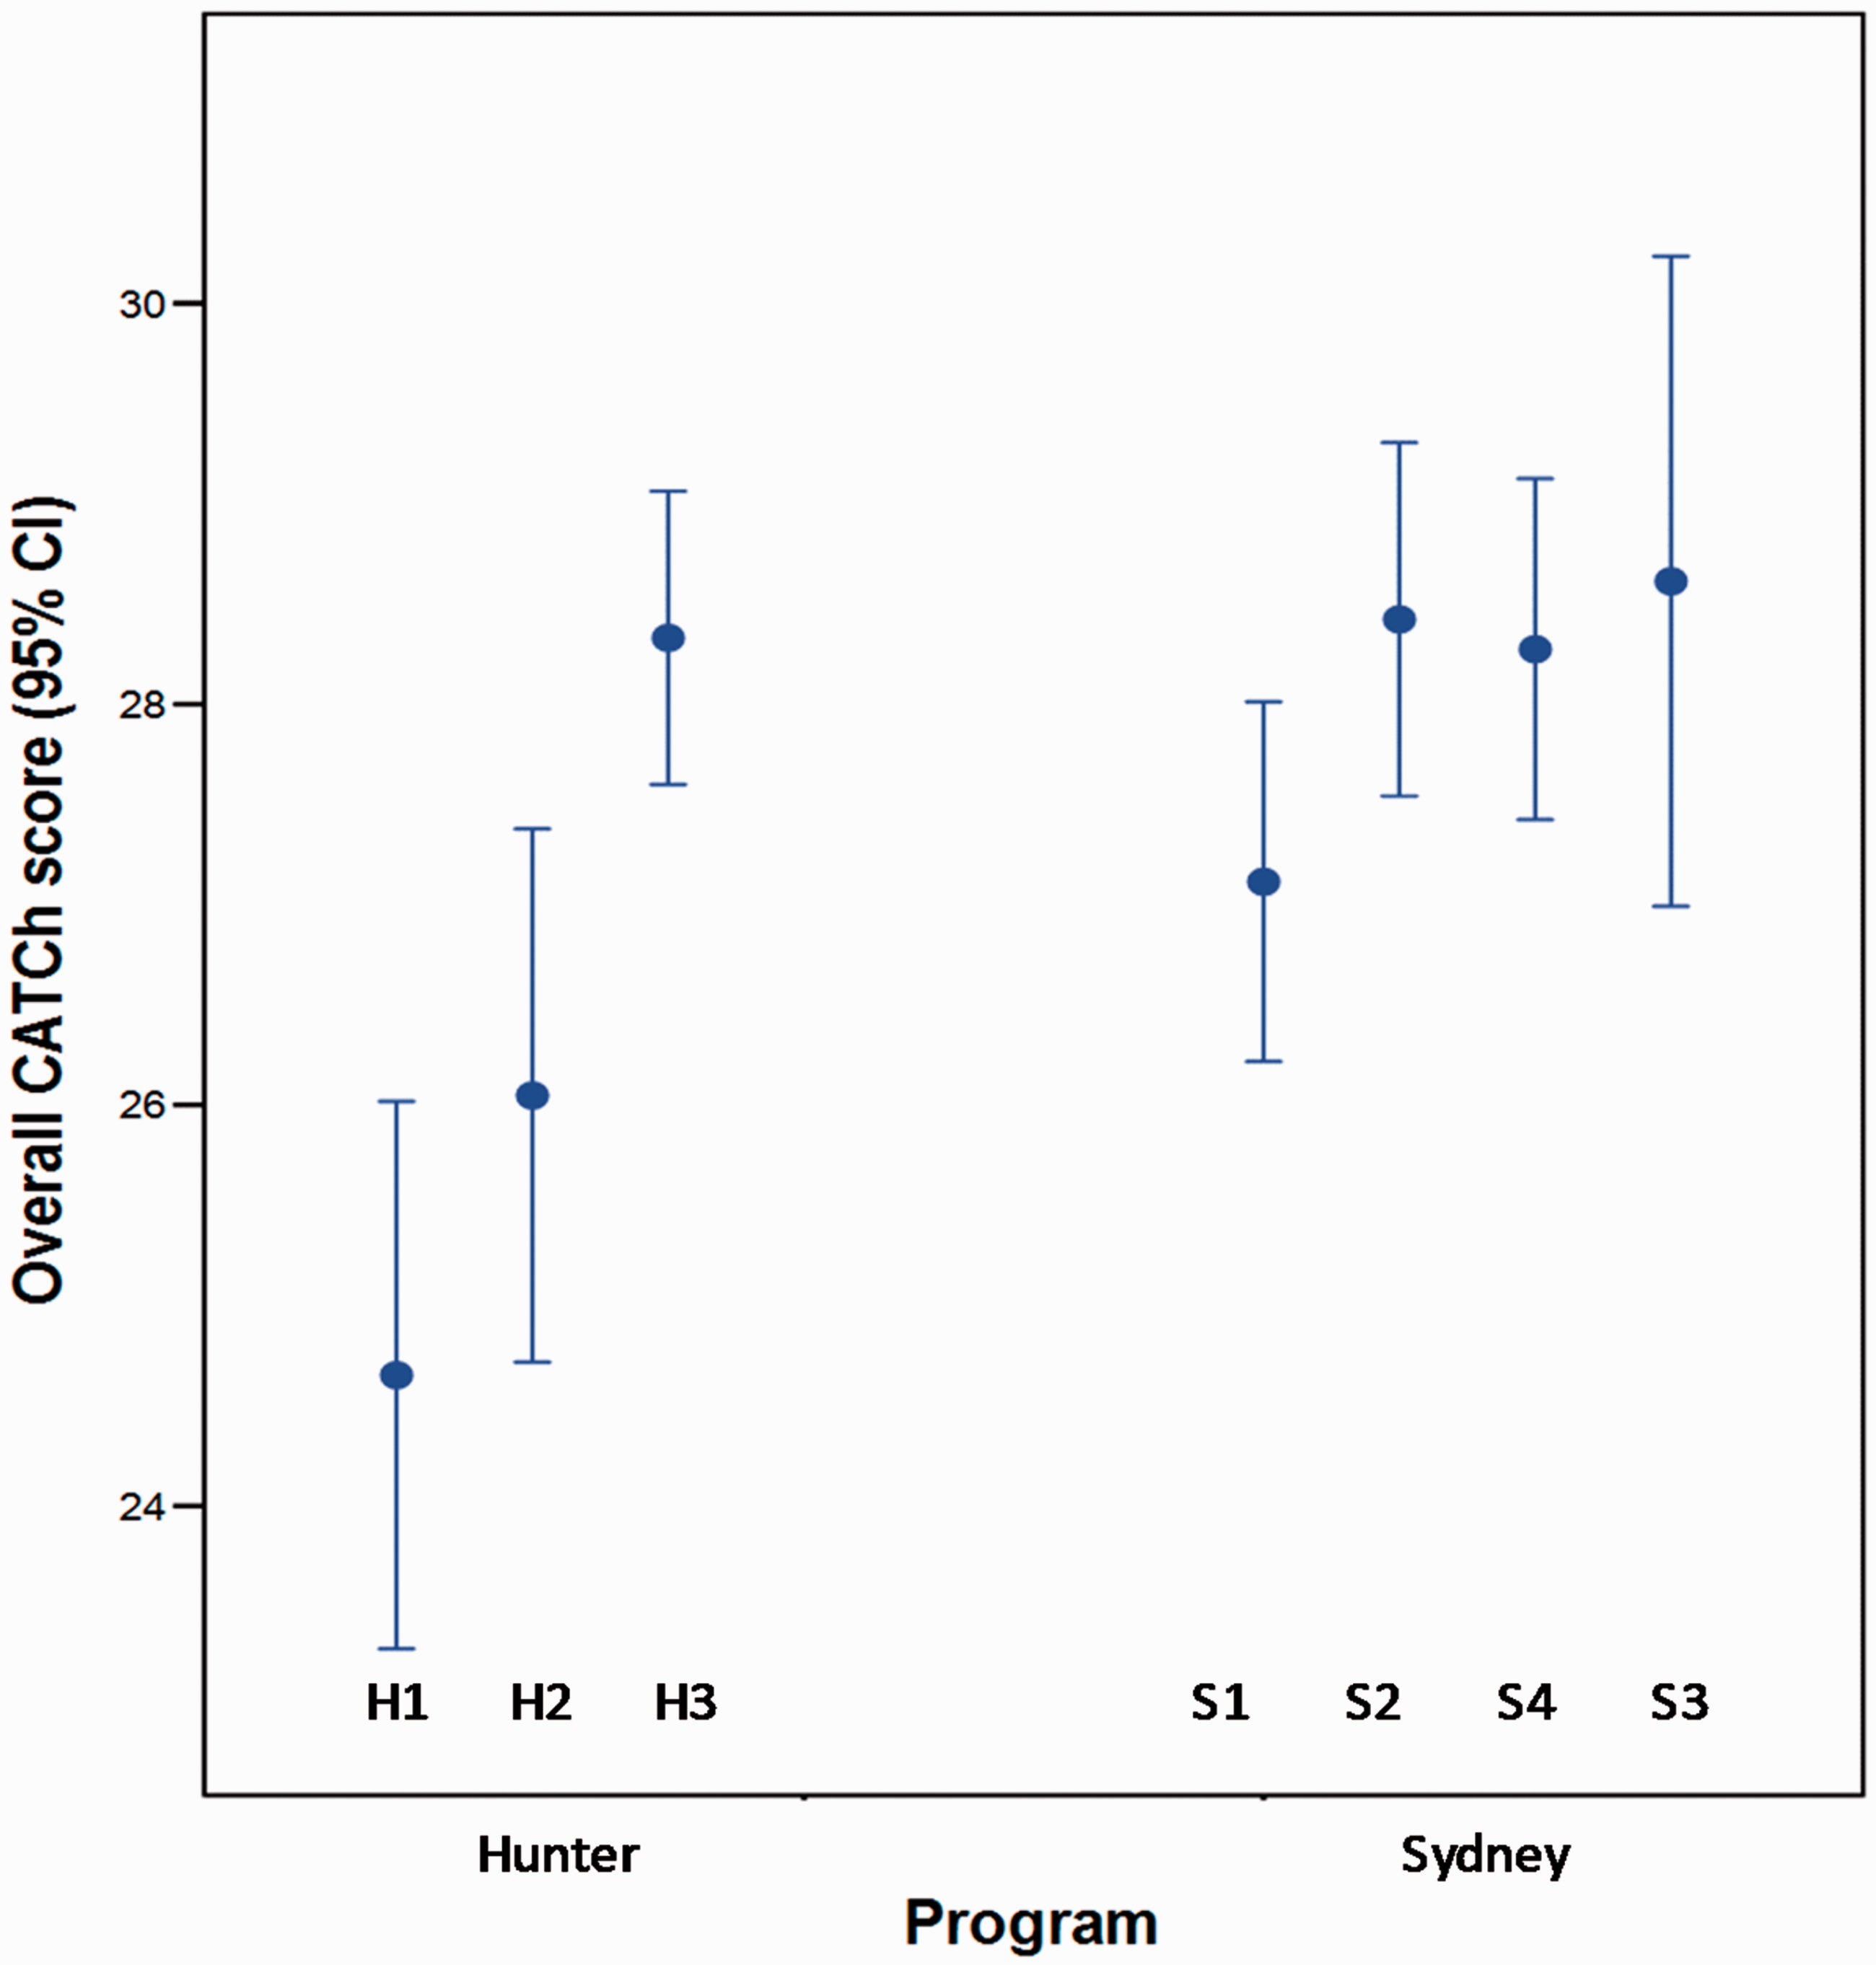
Pre-test overall CATCH scores by program area and school. CATCH: Chedoke-McMaster Attitudes towards Children with Handicaps.
Impact of program intervention type on the intake-adjusted CATCH scores
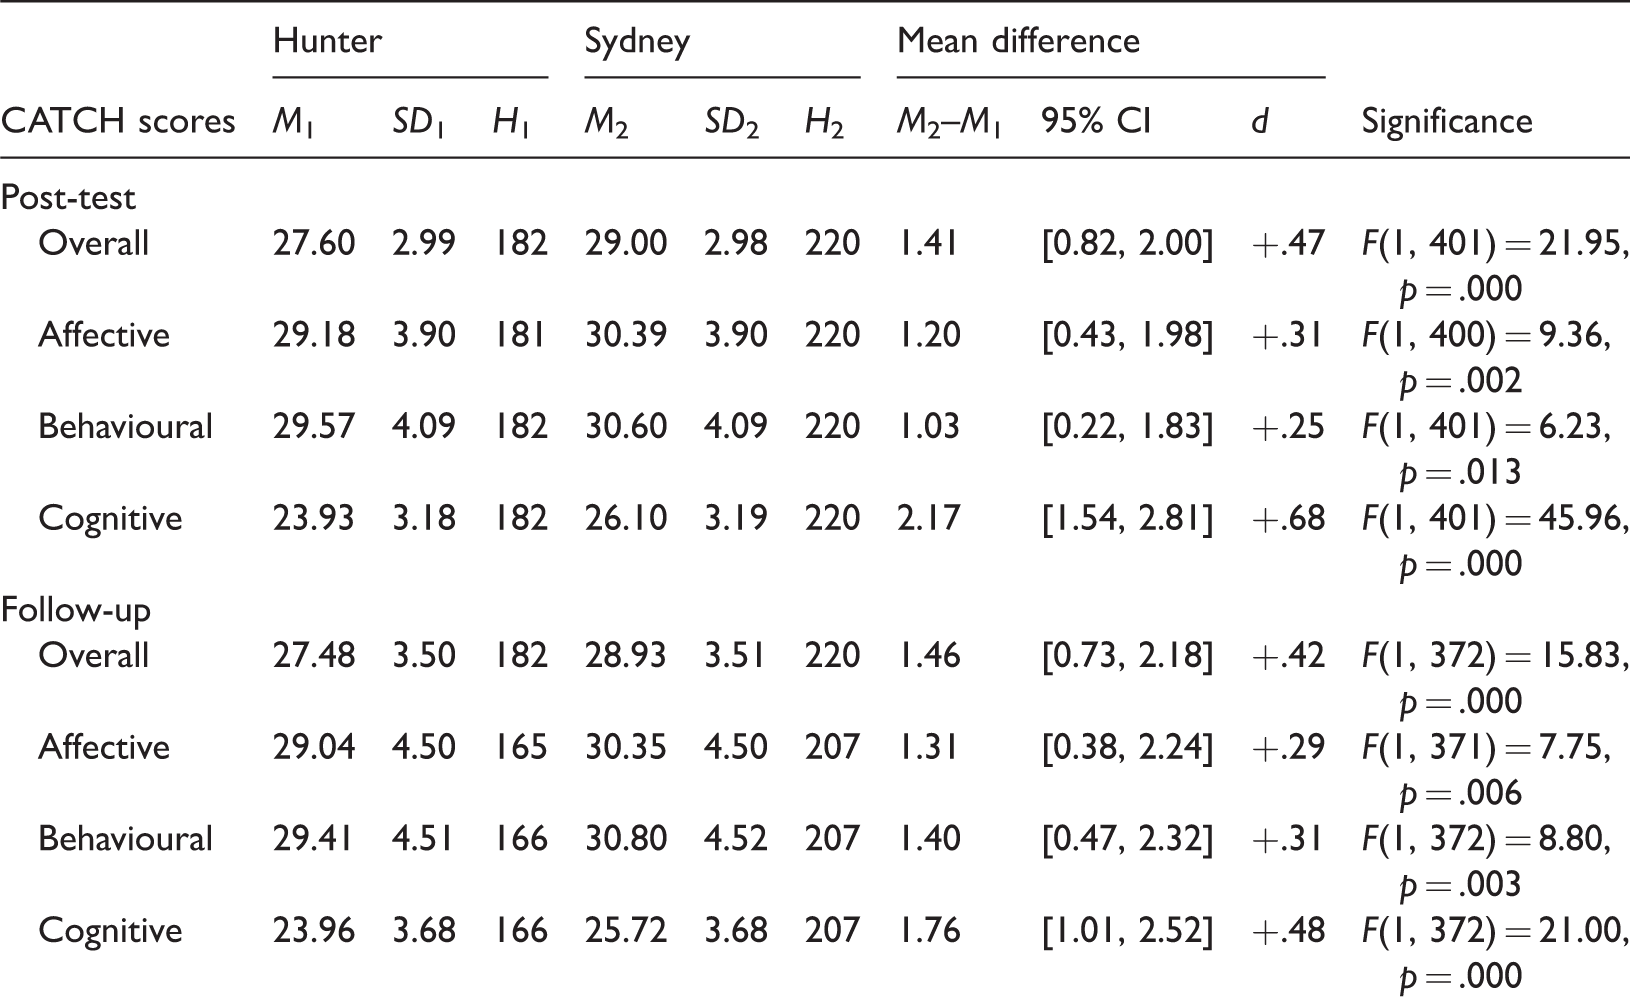
The post-test overall CATCH score was used as the principal outcome measure to assess the impact of program type, adjusted for pre-test scores to account for any achievement-level bias at baseline. This analysis was repeated with the CATCH sub-scales scores to provide supporting evidence. Univariate ANCOVA demonstrated statistically significant effects of program type on post-test overall CATCH and CATCH sub-scale scores after controlling for the respective CATCH pre-test score. The intake-adjusted mean scores for overall CATCH and the CATCH sub-scales (affective, behavioural and cognitive) were significantly higher for the Sydney program than those for the Hunter program (see Table 5). The adjusted differences favouring the Sydney program were small yet significant (1.41, 1.20, 1.03, 2.17 scores, respectively; p = .013) and associated values for Cohen’s d were small to moderate, indicating positive impacts favouring the newer Sydney delivery format (d values were 0.47, 0.31, 0.25 and 0.68, respectively).
Comparison of intake-adjusted CATCH and CATCH sub-scale scores.
CATCH: Chedoke-McMaster Attitudes towards Children with Handicaps; CI: confidence interval; SD: standard deviation.
Delayed follow-up CATCH scores were used to assess the longer term sustainability of impact of program type, which were also adjusted for pre-test scores to account for any achievement level bias at baseline. There was some variation in the timing of the delayed follow-up but in general this occurred 10–12 weeks after the classroom program delivery. The intake-adjusted Sydney program mean scores at delayed follow-up were significantly higher than the respective Hunter program mean scores for overall CATCH and the CATCH sub-scales (affective, behavioural and cognitive). The adjusted differences favouring the Sydney program at delayed follow-up were small yet significant (1.46, 1.31, 1.40, 1.76 scores, respectively; p = .006) and associated values for Cohen’s d were small to moderate, indicating positive impacts that also favoured the newer delivery format at delayed follow-up (d values were 0.42, 0.29, 0.31, and 0.48, respectively).
Three student background variables including gender, having a family member with a disability and having a friend with a disability were also fitted as additional fixed factors for analysis. However, none of these factors proved statistically significant in the ANCOVA models at post-test or delayed follow-up, after adjustment was made for pre-test scores. None of the interactions with program type were significant.
Process evaluation
Based on the post-intervention survey, 89% of students in Sydney indicated an aspect of the program they liked most compared to 85% in the Hunter. The three most popular aspects in Sydney were meeting and interacting with the presenter (20.8%), practicing sign language (16.5%) and the interactive or simulation activities (12.8%). The three most popular aspects in the Hunter region were meeting and interacting with the presenter (26.9%), interactive or simulation activities (21.4%) and the booklets (10.5%).
Students in the Hunter region, when asked what part of the program they liked least, 30% gave no response and 29.1% indicated that there was nothing they didn’t like. Of those students that did indicate parts of the program that they liked least, mostly related to the workbook activities/writing (8.8%) and length of time sitting (5.7%). In contrast students in Sydney, when asked what part of the program they liked least, 33.1% gave no response and 42.5% indicated that there was nothing they didn’t like. For those few in Sydney that did indicate parts that they liked least, the most common were learning sign language (9.5%) and seeing the challenges people with disabilities can face (4.3%).
Presenter checklists indicated that key concepts in Sydney schools had either some direct coverage (9.4%), detailed coverage (87.5%) or on one occasion ‘not applicable’ was ticked for a single item (investigating ways to seek help and support) when presenting at school S1. In the Hunter schools, overall it was reported key concepts received incidental coverage (25%), some direct coverage (41.7%) or detailed coverage (33.3%) during the program delivery. It was also noted that a short video clip which would normally be shown was not presented at one of the Hunter schools.
Discussion
The purpose of the research reported in this study was to examine the nature of student attitude change following the implementation of two versions of the JLY disability awareness program with children aged 10 or 11 years in the Sydney and Hunter regions of Australia. An additional aim was to assess whether any changes in attitude were maintained three months following the delivery of the program.
Notwithstanding some differences in the student and school characteristics of the Sydney and Hunter groups, the new version of the JLY program which involved two shorter sessions produced substantially greater improvements in CATCH scores overall and sub-scale attitude scores than the established version of the program. This difference was maintained at delayed follow-up. Intake-adjusted measures showed that the differences in attitude scores for the Hunter and Sydney versions of the program were modest but statistically significant.
There are a number of possible reasons for the differences described above. First, it may be that two 45-minute sessions delivered over a short period of time may be better suited to school students’ attention spans than a single, longer session. Additionally, two shorter sessions may have provided some opportunity for reinforcement of program content over time. Furthermore, students who participated in the version of the JLY program presented in Sydney were given ‘homework’; they were provided with a take-home sheet of the alphabet in AUSLAN and asked to learn how to sign their favourite food. This activity involved not only ‘homework’ but was an interactive, practical aspect identified in the post-intervention surveys as one of the things that students liked about the program.
A second possible reason for the attitudinal differences across programs may be that the Sydney-based program included more content material related to empathy, positive language and interaction with people with a disability than the Hunter-based program. The same presenter delivered the program to all the Sydney schools. In contrast, in the Hunter region, pairs of trainers – one with a disability and one without a disability – delivered the program, whereby a different pair could deliver the program in different schools (see Table 1).
Presenters were required to complete a checklist following each presentation, or shortly thereafter, as a measure of fidelity or consistency between program deliveries. Although a review of these did not suggest any major deviations from the program, there is still the possibility of a ‘teacher effect’. Plus, the presenter in Sydney may have been able to establish a greater rapport given there were two sessions compared to a one-off session. Although written responses in the post-intervention surveys showed that similar proportions of students in Sydney and the Hunter indicated that interacting with their presenter (a person with a disability) as one of the aspects they liked most. There are also other potential factors including exposure to and experience with people with a disability as noted below.
While this research points to the potentially beneficial aspects of the new program, the research has some limitations that need to be acknowledged. The quasi-experimental design of this study does not permit causal conclusions to be drawn. Resource and time constraints prevented the use of randomised matching of class groups across interventions and geographic location. For example it may be that the differences in the characteristics of the school students and the school communities across the Sydney and Hunter regions contributed to reported outcomes. Furthermore, the ICSEA index used to provide some comparative basis across schools does not report on a range of other potentially confounding aspects of school communities (e.g. school climate, number of students with a disability at the school, experience and disposition of school staff).
Review of the process evaluation data suggests there were differences in the content presented, or perhaps the way it was presented, in the Hunter region; for instance, some key aspects of the program were given incidental coverage yet direct coverage was given in other schools, while one school was not shown a video that was viewed by those at other schools. Nevertheless, the results of this research provide encouragement for further delivery and assessment of the shorter versions of the JLY program.
The literature suggests that an experiential component, such as ‘buddying’ activities, can have a powerful effect in improving school students’ attitudes to fellow students with a disability (Armstrong, Rosenbaum, & King, 1987; Rosenbaum, 2010). Such activities can be difficult to manufacture in the context of a short-term disability awareness program. However, providing meaningful opportunities for students with and without a disability to interact with each other should be part of the regular school curriculum and can be well integrated into targeted disability awareness programs. This issue is important because research on school students’ attitudes has shown that peer attitudes improve when students are given more opportunities to learn about disabilities (Boer, Pijl, Post, & Minnaert, 2013; Favazza & Odom, 1997; Godeau et al., 2010).
Conclusion
The findings of this evaluation demonstrate the efficacy and sustainability of effects from the participation of class groups in this short-term intervention. The new version of the JLY program was shown to enhance broader understanding of the value of uniqueness and difference, and position the personal and educational interests of students with disabilities in a more positive light, despite the limited period of participation in the program. Teachers and schools will find programs of this kind valuable as part of their broader policy response to the increasing demands for inclusive and more equitable educational provision.
Footnotes
Acknowledgements
We are grateful to the NSW Department of Education schools, students and parents/carers who participated in this project. We would also like to acknowledge the support of our students and research officers who supported our fieldwork, analysis and eporting: University of Newcastle Faculty of Education and Arts intern, Monica Waters-Neil, and School of Education intern, Joel Redman; and, research officers, Carly Berrigan, Alex Haschek, Hayley Maxfield, and Oriel Rose.
Declaration of conflicting interests
The author(s) declared no potential conflicts of interest with respect to the research, authorship, and/or publication of this article.
Funding
The author(s) disclosed receipt of the following financial support for the research, authorship, and/or publication of this article: This work was supported by Cerebral Palsy Alliance (CPA), NSW. The views and opinions expressed in this manuscript are those of the authors and do not necessarily reflect the views of CPA.