
Abstract
Students in East Asian locations often obtain high academic results in international high-stakes testing, but lower results on affective aspects of their schooling, such as sense of belonging. These findings indicate the need for more holistic research into children’s lifeworlds, including their experiences of school. In this article, we draw on a survey with 627 Year 4 students in three global cities in the Asia Pacific (Hong Kong, Singapore, and Melbourne), exploring dimensions of their perceptions of school. Responses from students were generally positive in terms of sense of school belonging and student identity. Students who responded positively in terms of belonging and student identity were more likely to want academic activities to occur more often. The article adds to the existing literature by offering an exploratory consideration of the relationships between sense of belonging, student identity, and school activity preferences of Year 4 students in Hong Kong, Singapore and Melbourne. It is argued that all of these are essential factors that need to be considered and incorporated in policy planning and curriculum development.
Introduction
There is increasing attention paid to international high-stakes testing in educational debates, with much discussion from policymakers around how to improve education systems in their countries, with a particular focus on rapidly improving their academic results in these tests (Klemenčič and Mirazchiyski, 2018; Volante, 2018). In the Trends in International Mathematics and Science Study (TIMSS), Progress in International Reading Literacy Study (PIRLS) and Programme for International Student Assessment (PISA), the reports also contain valuable data that pertain to students’ perceptions about their schooling experiences, such as sense of belonging, but these often receive far less attention in discussions amongst policymakers, media and academics alike (for an exception, see Smith et al., 2020). Students in East Asian locations, such as Singapore and Hong Kong, have consistently been a focus of critical commentary in high-stakes testing debates due to their often high academic achievement (e.g. Chen, 2014; Jerrim and Choi, 2014; Tan 2019). However, much less attention has been paid to the reported negative experiences relating to school amongst students in Singapore and Hong Kong, such as low sense of belonging, fear of failure, negative attitudes towards school subjects and pressures relating to high-stakes testing (e.g. Cho and Chan, 2020; Mullis et al., 2017; Mullis et al., 2020; Tan 2019). Considering students’ experiences of school allows for a more holistic consideration of children’s lifeworlds, including in relation to their wellbeing. Here, we advocate that knowledge about such experiences and students’ sense of belonging are important elements in policy making and curriculum development since they reflect students’ ability and desire towards learning and enable a more holistic view of how optimal learning ecologies can be designed for each student to reach their full potential.
In this article, we draw on our Global Childhoods: Lifeworlds and Educational Success in Australia and Asia project to examine Year 4 students’ (9–10 years old) perceptions of aspects of their everyday school experiences in three global cities in the Asia Pacific: Hong Kong, Singapore and Melbourne (Australia). We focus on survey data from students to examine their sense of belonging, student identity and preferences for school activities. Previous research has highlighted that each of these elements impacts on students’ capacity to learn (e.g. Souto-Manning and Rabadi-Raol, 2018) and thus are important aspects to be understood in policy and curriculum decisions. Policy and curriculum in each of our focus locations also highlights the growing importance of considering children’s schooling more holistically, including the recognition that belonging and wellbeing can impact on academic achievement. This focus is evident in Australia, such as in the Alice Springs (Mparntwe) Education Declaration which recognises the significance of children’s wellbeing within the context of their schooling (Education Council, 2019) and the Australian Student Wellbeing Framework which focuses on a holistic approach to schooling so that students are able to ‘reach their full potential’ (Education Services Australia, 2018: 2). This focus on holistic learning and wellbeing also appears in the Victorian Curriculum (Victorian Curriculum and Assessment Authority, n.d.), the state in which Melbourne is located. In Singapore, the Ministry of Education (MOE) has introduced several initiatives which focus on children’s wellbeing and more holistic approaches to schooling. For example, the Social Emotional Learning (SEL) Framework focuses on building strong social-emotional competencies (MOE, 2021) and the Holistic Health Framework focuses on developing students’ wellbeing (MOE, 2022). The overarching Framework for 21st Century Competencies and Student Outcomes also contributes towards Singapore’s goal of more holistic education (MOE, 2014). Finally, such approaches in Hong Kong, include considering students more holistically through Life-wide Learning (LWL), which can include social and emotional learning (Education Bureau, 2022).
In the context of these policy and curriculum initiatives, it is important to consider children’s experiences of their schooling. The survey responses discussed in this article were part of our larger Global Childhoods project exploring the lifeworlds of Year 4 children, which is the year that the first international high stakes tests (TIMMS and PIRLS) are administered. The main study drew upon the theoretical framing of lifeworlds to explore children’s lives inside and outside of school. In our exploration of lifeworlds, we adapted the concept of lifeworld, in the singular, from Husserl (1970) and Habermas (1987), who constituted the lifeworld as a framework to enable discussion of taken-for-granted beliefs, attitudes, competencies and practices, that occur in our everyday lives. We extended the lifeworld concept using de Certeau’s (1984, 1997) theories of everyday life (as further detailed in Yelland et al., 2021). We conceptualised the lifeworlds of children as incorporating all aspects of their everyday lives which includes school, home and community contexts (Yelland et al., 2008). Thus, in exploring students’ sense of belonging, identities and preferences for activities, we investigated aspects of their everyday schooling experiences which constitute one aspect of their lifeworlds.
The study builds on a previous study by two of the authors which surveyed 123 Year 5 students (aged 11 years) in Hong Kong (Yelland and Muspratt, 2018). This previous study found that 30.1% of Year 5 students reported they enjoyed school all the time, whereas only 4.9% reported not enjoying school at all. The previous study also found that 41.5% of students agreed that teachers at school showed they like them and 53.7% agreed that their friends at school showed they like them. In terms of what students wished happened more often at school, the top responses were ‘Using computers for learning’ (59.3%) and ‘Playing sports’ (52.8%).
Sense of belonging, student identity and subject and activity preferences
This article explores children’s experiences of school by bringing together the areas of students’ sense of belonging, student identity and subject and activity preferences. In this section, we provide a brief overview of each area, with attention to the contexts of Hong Kong, Singapore and/or Melbourne/Australia where available.
Sense of belonging
Much of the school belonging literature draws on definitions of belonging relating to psychology, and has a particular focus on students’ relations with others (teachers and classmates), and feelings towards school (Allen et al., 2021). Allen et al. (2021) suggest that the most commonly used definition in the school belonging literature continues to be from Goodenow and Grady (1993), which focuses on students’ sense of belonging in terms of relationships with others, where sense of belonging refers to ‘the extent to which they feel personally accepted, respected, included, and supported by others—especially teachers and other adults in the school social environment’ (Goodenow and Grady, 1993: 60–61). Allen et al.’s (2018) meta-analysis of studies from the US, Australia and New Zealand, found that teacher support and positive personal characteristics were the strongest predictors of a sense of school belonging for secondary school students. From their qualitative meta-synthesis of school belonging and adolescents, Craggs and Kelly (2018) created an overarching definition of school belonging: ‘feeling safe to be yourself in and through relationships with others in the school setting’. In contrast to Allen et al.’s review of the quantitative literature, Craggs and Kelly found that peers were more important than teachers for school belonging.
The key international tests with Year 4 students, PIRLS and TIMSS, both include a measure of students’ sense of school belonging. PIRLS 2016 and TIMSS 2019 both measure belonging by drawing on responses to five statements: (1) I like being in school, (2) I feel safe when I am at school, (3) I feel like I belong at this school, (4) Teachers at my school are fair to me and (5) I am proud to go to this school, with students responding ‘Agree a lot’, ‘Agree a little’, ‘Disagree a little’ and ‘Disagree a lot’. These responses are collated to give an overall ‘Sense of School Belonging’ ranked as ‘high’, ‘some’ and ‘little’. Although Hong Kong and Singapore rank highly in terms of academic results in the tests, they both notably rank lower than the international average for sense of school belonging. For PIRLS 2016, the international average for high sense of belonging was 59%. The Hong Kong average was 35% (the lowest of the 50 countries) and Singapore’s was 49% (41 of 50 countries) (Mullis et al., 2017). The TIMSS 2019 Year 4 data was similar, where the international average for high sense of belonging was 58%, yet the Hong Kong average was 34% (57 of 58 countries) and in Singapore it was 45% (49 of 58 countries) (Mullis et al., 2020). Australia was just below the international average with 57% of students reporting a high sense of belonging in PIRLS (26 of 50 countries) and 54% in TIMSS (38 of 58 countries) (Mullis et al., 2017, 2020). On closer scrutiny, the PIRLS and TIMSS data also show that on average those students who scored higher on academic achievement, also scored higher on sense of school belonging, including those students within locations such as Hong Kong, Singapore and Australia (Mullis et al., 2017, 2020). In other words, even in locations where the average percentage related to feeling a sense of school belonging was low compared to the international average, academic achievement was linked to a more positive sense of belonging.
As mentioned above in relation to the TIMSS and PIRLS sense of belonging measure, enjoyment of school can relate to belonging. Redmond et al.’s (2016) Australian Children’s Wellbeing Project with over 5400 students in Years 4, 6 and 8, found that Year 4 students generally enjoyed school, with most students agreeing or strongly agreeing that ‘My school is a place where…’ ‘I feel happy’ (88.6%), ‘I really like to go each day’ (81.9%), and ‘I get enjoyment from being there’ (88.5%). Although the findings for Years 4 and 6 (primary school) were similar, they were notably lower for students in Year 8 (secondary school). Large international studies, such as the Health Behaviour in School-aged Children (HBSC) study (Inchley et al., 2020) and the Children’s Worlds project (Rees and Main, 2015), also consider enjoyment of school, although do not include our focus locations of Hong Kong, Singapore and Melbourne (Australia). The HBSC study examines young people’s health and wellbeing, via a survey with a significant number of 11, 13 and 15 year olds in Europe and North America every four years (over 220,000 young people in 2017/18). For the 11-year olds, these findings show that in 2017/18, 39% of the total cohort reported that they ‘like school a lot’ (Inchley et al., 2020). Notably, there were large differences between countries, as well as between age groups which suggest that 11 year olds are more likely to like school ‘a lot’ than 13 and 15 year olds. Rees and Main’s (2015) Children’s Worlds survey with over 30,000 10 and 12 year olds in 15 countries also responded to the question ‘I like going to school’, on a five-point scale ranging from ‘Totally’ to ‘Not at all’. They found that two-thirds of students agreed with the statement (‘Totally’ 43% or ‘A lot’ 23%). Responses to this question varied significantly between countries, with 84% of students ‘Totally’ agreeing with the statement in Ethiopia, compared to only 21% in Germany.
Student identity
There is surprisingly little literature on children’s perceptions of their identities as students, such as their views on their grades. An exception is Rees and Main’s (2015) Children’s Worlds survey, which found that the mean satisfaction for school marks was 8.2 out of 10. However, this varied by country, with the highest mean satisfaction rate of 8.7 out of 10 in Nepal, Romania, Norway and Israel, and the lowest rate of 7.1 in South Korea. Rees (2017) suggests that the high levels of expectation in high achieving countries may mean students are less satisfied with their school marks than those in countries where there may be lower levels of expectation. A slightly different question was asked in the HBSC study, where young people were asked what their class teacher(s) thought about their school performance compared to their classmates. In 2013/14, 77% of 11 year olds reported ‘very good’ or ‘good’ to this question (this question was not included in the 2017/18 reports) (Inchley et al., 2016). Redmond et al.’s (2016) Australian Children’s Wellbeing Project replicated this question, where they found that Year 4 students generally reported their class teacher(s) think positively of their school performance (‘Very good’ 42.3% and ‘Good’ 44.7%), which was higher than the HBSC study survey average. For both the HBSC study (with 11, 13 and 15 year olds) and the Australian Children’s Wellbeing Project (with Year 4, 6 and 8 students), the younger students responded more positively about their school performance than the older students (i.e. they were more likely to respond with ‘very good’ or ‘good’).
Subject and activity preferences
In terms of preferences for particular subjects, Chambers et al.’s (2018) study of several countries, with a particular focus on the UK, suggests that students’ favourite school subject varies by location. For example, the most common favourite subject was named as Maths (33% of respondents) followed by Art and design (22%) in the UK, Art and design (32%) followed by Maths (23%) in Australia, and Art and design (37%) followed by English (15%) in China. However, it should be noted that this study drew on small sample sizes outside of the UK. Colley and Comber’s (2003) UK study of 362 Year 7 students (aged 11–12 years) and 569 Year 11 students (aged 15–16 years) students found that the Year 7 students preferred non-core subjects, whereas in Year 11 some students preferred core subjects. For the Year 7s, the top three subjects chosen by girls were Art, Drama and PE, compared to PE, ICT and Art by boys. Similarly, Murphy et al.’s (2010) survey of Year 6 students (aged 8–11 years) in the UK found that, of the 891 students who responded to the question, students most often named PE (26%) or Art (22%) as their favourite subjects, although this was followed by Maths (17%) and Science (10%). Hasni et al.’s (2017) study of 2571 students in Canada from Year 5 to Year 11 similarly found PE and the Arts were the most preferred. However, little is known about subject preferences amongst students in East Asian schools. In Hong Kong, one study found that primary school students indicated that ‘major subjects’ (Chinese, English, mathematics, and general studies), which are often the focus of testing, were allocated significantly more time than ‘nonmajor subjects’ (such as PE, visual arts, music and computer studies), which the children enjoyed and wanted more often (Cho and Chan, 2020). An exploration of school subject preferences is important to further understand students’ experiences of school, particularly as these attitudes may impact on school engagement and future interest in these subject areas (e.g. Chambers et al., 2018; Cho and Chan, 2020; Hasni et al., 2017).
Materials and methods
The project from which this article derives was a collaboration among researchers located in universities in Australia, Hong Kong and Singapore. Ethics approvals were gained from the relevant university Human Research Ethics Committees and education ethics bodies. 1 In this article, we report on results from the online survey component of the project which allowed for a broad perspective of children’s self-reported experiences in the three locations. The survey was conducted alongside other methods including classroom ethnographies.
Context and participants
Schools were selected in order to reflect the diverse student populations in each of the cities, drawing on the researchers’ existing relationships with schools and additional networking and professional contacts. Conducting research in schools has become increasingly complex and time consuming. In Singapore and Melbourne, access to schools is rigorously controlled by government departments, while in Hong Kong each Principal is the ultimate arbiter, and while several Principals were keen to participate their teachers were not. The final sample was made up of three schools in Hong Kong, two schools in Singapore and four schools in Melbourne. Principals approved the research being conducted in each of the schools.
Information sheets and consent forms were sent out to the parent/caregiver of each Year 4 student at participating schools (in English in Melbourne and Singapore, and in Chinese in Hong Kong). The majority of students invited to participate in Hong Kong completed the survey, largely due to two of the participating schools having existing agreements with parents and the Education Bureau to allow research in their schools. Two-thirds of the students invited to participate in Singapore completed the survey and just over half of the students in Melbourne. Reasons for not participating mainly related to not returning the consent form and absence from school on the day of the survey.
The research was explained in a consistent way to students in all of the locations by using a survey ‘script’. In each student group, members of the research team introduced the survey, explained the survey questions, answered any questions from students and helped students who were having any difficulties with the survey. Survey sessions with each group took approximately 30 min each, and included explaining and completing the survey. The presence of the researchers benefited the quality of data collected as they could explain questions as they arose, unlike conventional surveys which are completed remotely. For example, the students in the participating schools in Melbourne did not receive ‘grades’ per se so this was explained to them as ‘how they were going with their school work’, including in relation to written reports they received from their teachers. Thus, students benefitted by being able to ask questions, while still being able to complete the surveys online without having researchers or teachers view their individual responses.
A total of 627 students completed the survey. The sample was made up of 303 (48.3%) girls and 324 (51.7%) boys. In terms of location, 270 (43.1%) were from schools in Hong Kong, 165 (26.3%) were from schools in Singapore, and 192 (30.6%) were from schools in Melbourne. The mean age of the students was 9.9 years (SD = 0.54). The Singapore students were on average the oldest (mean age 10.3 years), the Hong Kong students were on average the youngest (mean age 9.5 years), while the mean age for the Melbourne students was part way between (mean age 10.1 years).
Survey
A quantitative online survey was developed by the researchers, based on a more detailed survey designed and trialled in a previous project (see, e.g. Yelland and Muspratt, 2018). The survey sought to better understand children’s lifeworlds, focusing on children’s experiences inside and outside of school, including in relation to their out-of-school activities, which we have published on elsewhere (see Yelland et al., 2021).
In this paper, we focus on two sets of questions about children’s experiences at school, relating to: (1) belonging and student identity, and (2) preferences for school subjects and activities. These questions build on the existing literature outlined above, bringing these aspects together so that the experiences can be considered more holistically in the context of children’s lifeworlds. In using a survey, we focussed on some key elements of each of these aspects for children to respond to.
The first set of questions relating to belonging and student identity were: (1) Do you enjoy going to school? (2) Do your classmates at school show that they like you? (3) Do your teachers at school show that they like you? (4) How would you describe yourself as a student? (5) How would you describe your grades at school (school work)? (6) How happy are you with your school grades (school work)?
For Questions 1, 2 and 3, students responded on a four-point scale: Never, Sometimes, Mostly and Always. For Questions 4, 5 and 6, students again responded on a four-point scale. The first word in the response categories were either: Never, Sometimes, Mostly or Always; but the endings changed according to the question: Question 4 – … hardworking and serious about my work; Question 5 – … good grades; Question 6 – … happy with my grades.
For the second set, students were asked an over-arching question: ‘Do you wish these subjects happened at school more often, the same, or less often?’. The set of subjects and activities were as follows: (1) Sport (2) Art and creative activities (3) Mathematics and science (4) Languages (5) Playing with friends (6) Using technology (7) Reading and writing (8) Taking tests (9) Having my own choice of activities
Students responded on a three-point scale: Less often, The same, More often.
Analyses
We present three groups of analyses: the first focussed on the first set of questions (belonging and student identity); the second focussed on the second set of questions (school subjects and activities); and the third focussed on relationships between the two sets of questions. The first two groups of analyses followed the same sequence of procedures: (1) Principal Components Analysis (PCA) to reduce the number of items to a smaller set of components (i.e. to group the items); (2) Cluster Analysis to group the students on the basis of their scores on the components; (3) Crosstabulations to explore associations between these groups of students and their location (i.e. City), and assess whether or not associations apply to both boys and girls.
For the third analysis, we used crosstabulations to explore associations between groupings based on the first set of questions and groupings based on the school activities.
Within-schools polychoric correlations were submitted to the PCAs: polychoric correlations were used because of the ordinal nature of the response scales; and within-schools correlations were used because the students were asked to respond to questions to do with their schools, and students in different schools could be responding at different levels of the response categories thus biasing the correlations. The number of observations used in the PCAs was the sample size minus the number of schools (i.e. 627–9 = 618). Rules-of-thumb were used to determine the number of components to extract: Kaiser–Guttman rule, scree test and parallel analysis. To facilitate interpretation, the extracted component loadings were subjected to an oblique rotation (Oblimin). Interpretability of the rotated loadings also played a role. Component scores were obtained using a method that preserved the correlations among the components (Grice, 2001, formula 8).
The component scores obtained in the previous step were standardised scores (i.e. mean = 0, and SD = 1). They were subjected to k-means cluster analysis to obtain reasonably homogeneous groups of students based on their component scores. A scree test was used to determine the optimal number of clusters (based on the increase in variance accounted for against the number of clusters). Cluster stability was assessed using a method developed by Hennig (2007). It entails treating the sample as a quasi-population, then selecting bootstrap samples (here, 1000 bootstrap samples) of the same size as the given sample from the quasi-population. The Jaccard coefficient of similarity assesses how well a cluster in the original data can be identified in the 1000 bootstrap samples.
Associations between different groupings of students were assessed using crosstabulations. The χ2 statistic assessed statistical significance at an omnibus level. If χ2 was statistically significant, then the standardised residuals were used to determine which cells were responsible for the omnibus effect (after applying Holms adjustment to the alpha level of significance to order to take account of the multiple testing).
All analyses were carried out in the R statistical environment (R Development Core Team, 2019). A number of packages associated with the R statistical environment were used: Principal Components Analysis was carried out using the psych package (Revelle, 2019); cluster stability was assessed using the fpc package (Hennig, 2020); and associations in the crosstabulations were assessed using the gmodels package (Warnes et al., 2018).
Results
First group of analyses: Perceptions of belonging and student identity
The first group of analyses were concerned with students’ perceptions in relation to belonging and student identity. Figure 1 shows the percent of students who responded in each response category for each question. On the whole, the students reported that they generally liked going to school, and overall they perceived that their teachers and classmates showed that they liked them. Similarly, students mostly described themselves as hard working, that their grades (or school work) were good, and that they were happy with their grades (or school work). That is, on the whole, students responded positively to questions about school belonging and their identities as students. Percent of students who responded in each category of the response scale for the set of questions dealing with students’ perceptions of their sense of ‘Belonging’ and ‘Student identity’.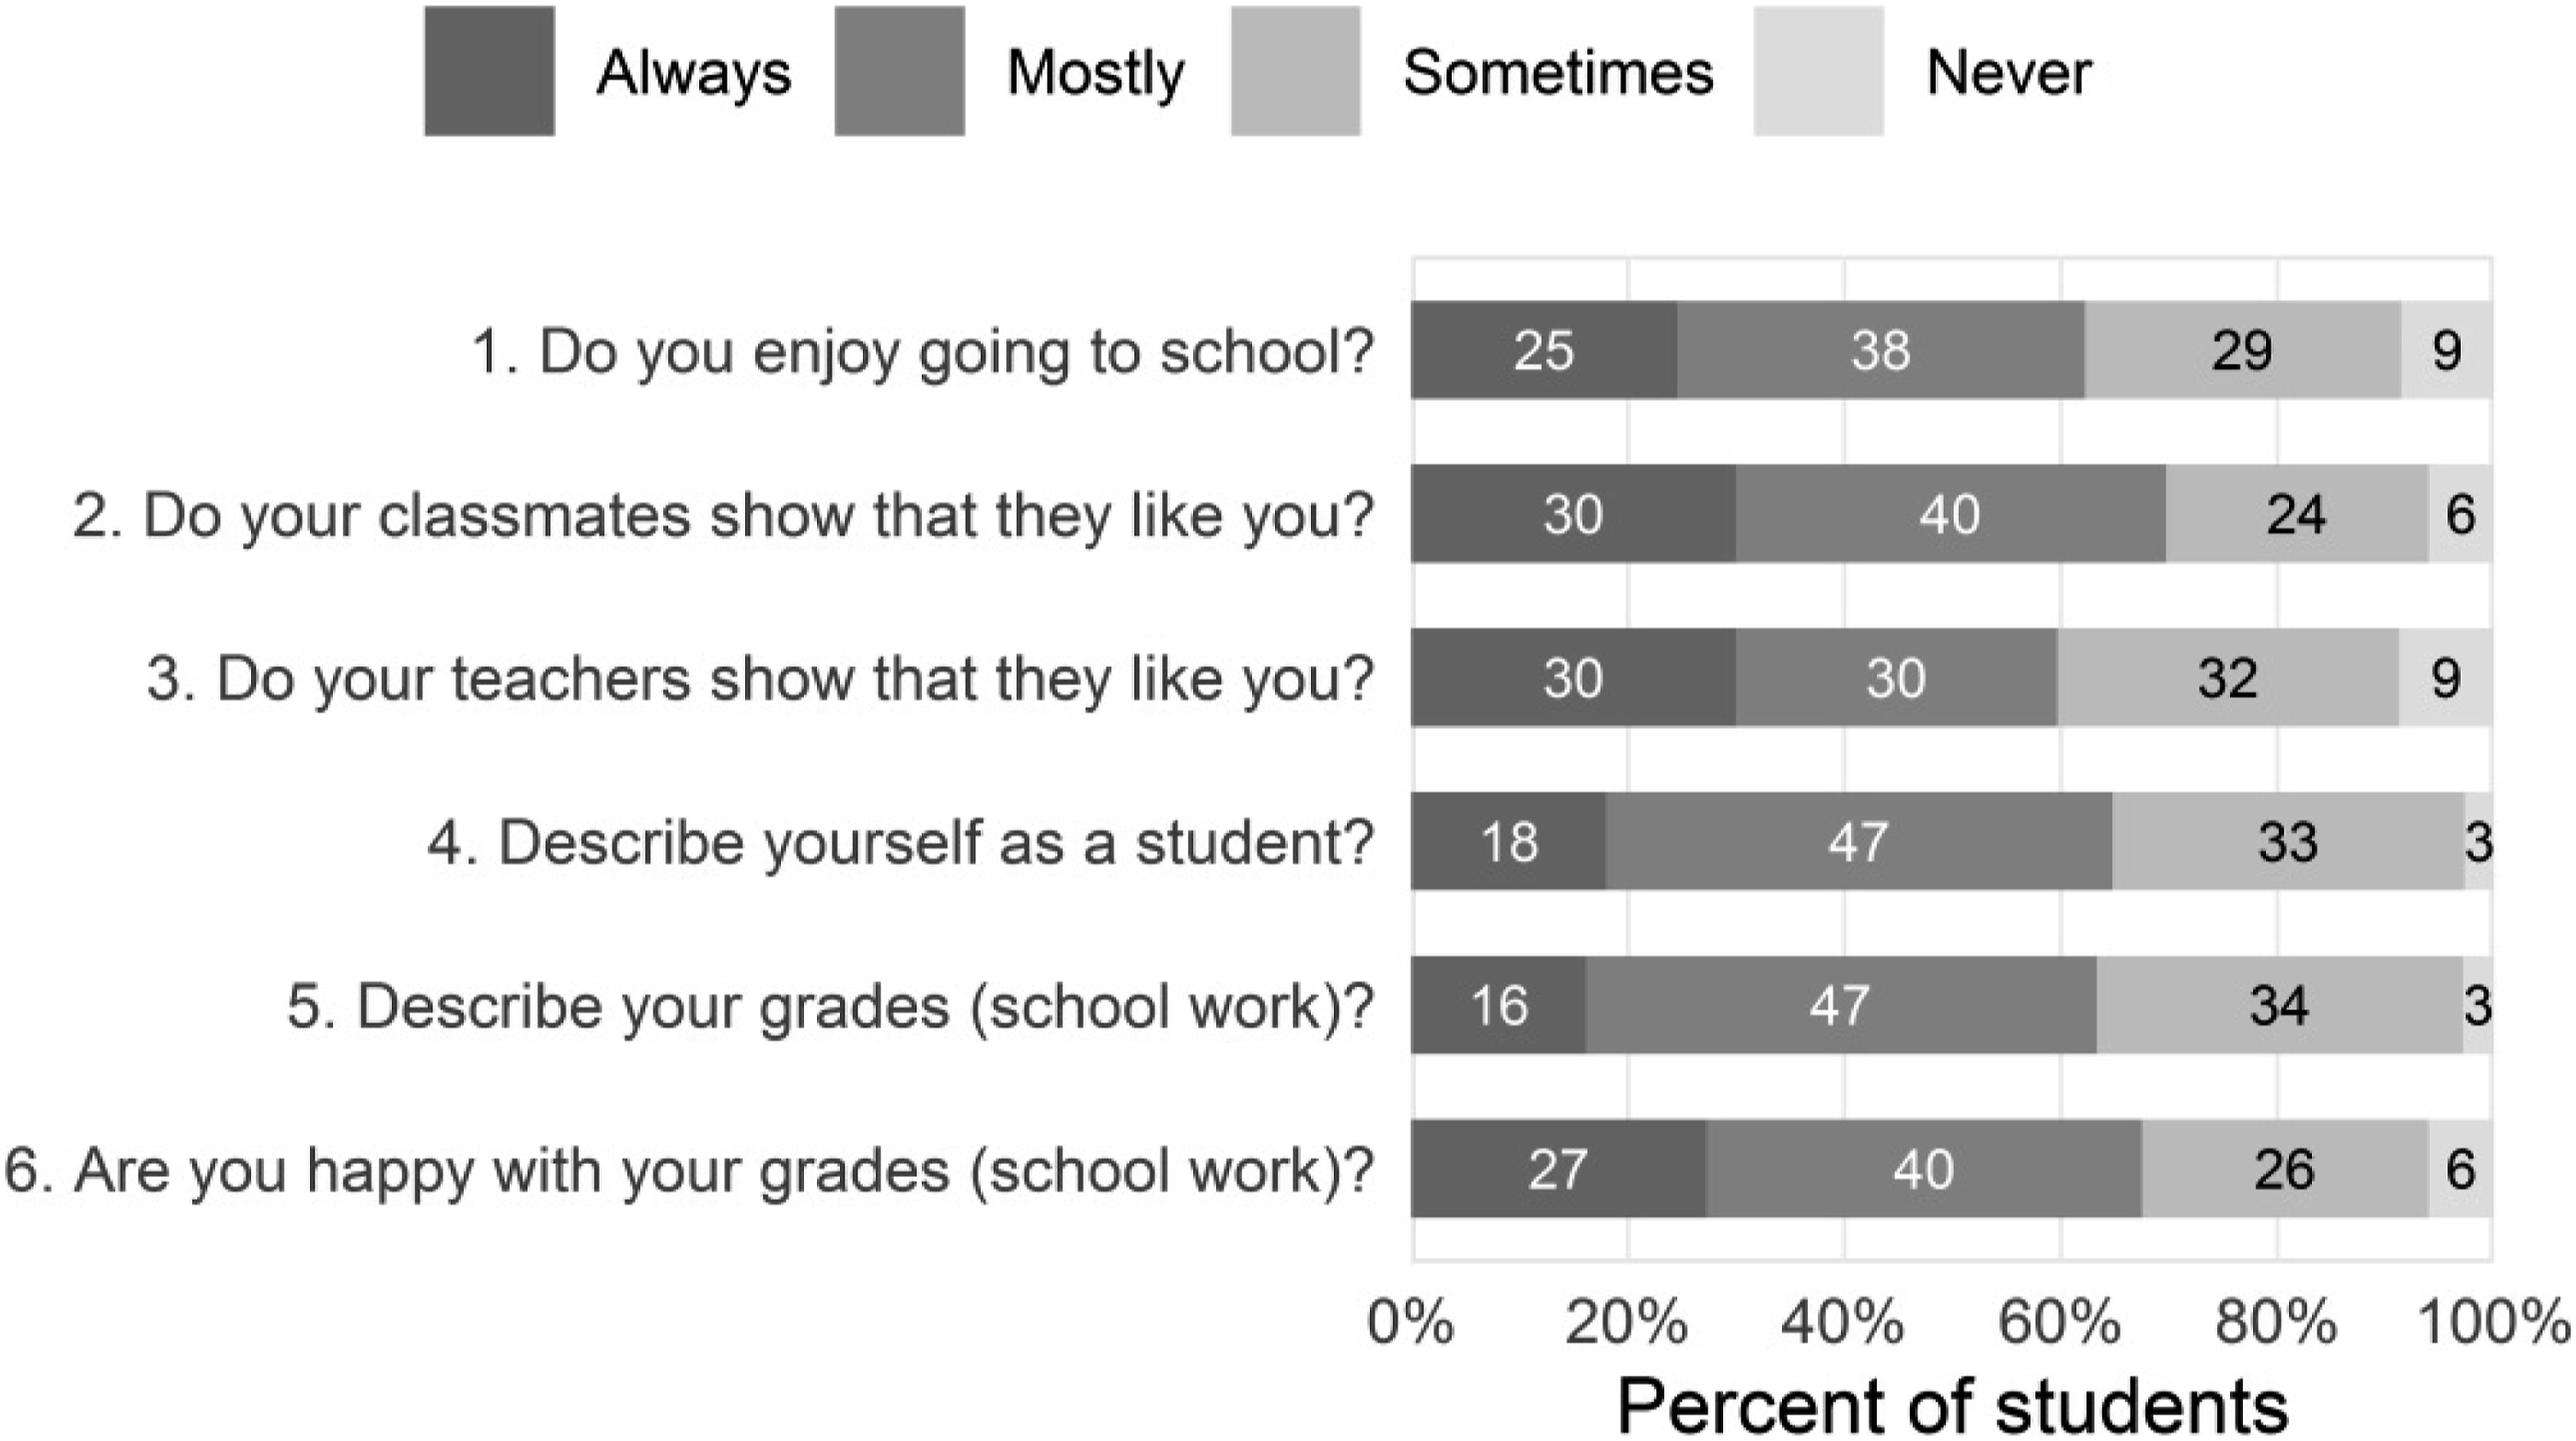
The rules-of-thumb for determining the number of components for the PCA to extract were not consistent. The Kaiser–Guttman rule and parallel analysis suggested one component, but only just; two components were not out of the question. The scree plot showed a kink at two components, but another at four components. The two- and three-component solutions were readily interpretable, but the three-component solution at the next step (the cluster analysis) led to unstable clusters. On this basis, the two-component solution was selected. (We discarded the one-component solution because it seemed unreasonable that all the questions should load on one component given that some of the correlations between pairs of questions were small – less than 0.25.)
Summary of results of the PCA on scores for six questions dealing with student perceptions of their sense of ‘Belonging’ and ‘Student identity’.
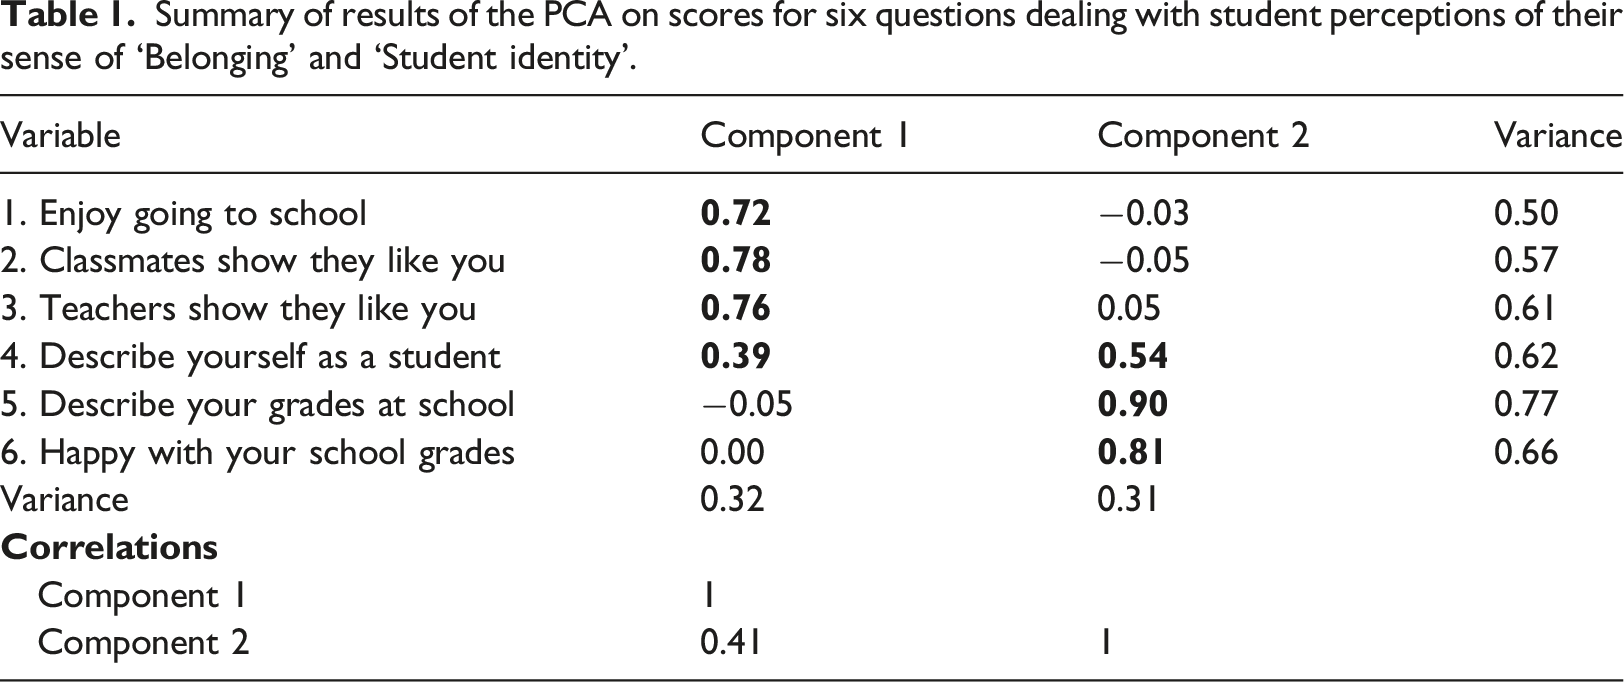
Component 1 was defined by a group of questions that asked about ‘Liking and being liked’, which we have labelled ‘Belonging’, and Component 2 was defined by a group of questions that asked about ‘School work’, which we have labelled ‘Student identity’.
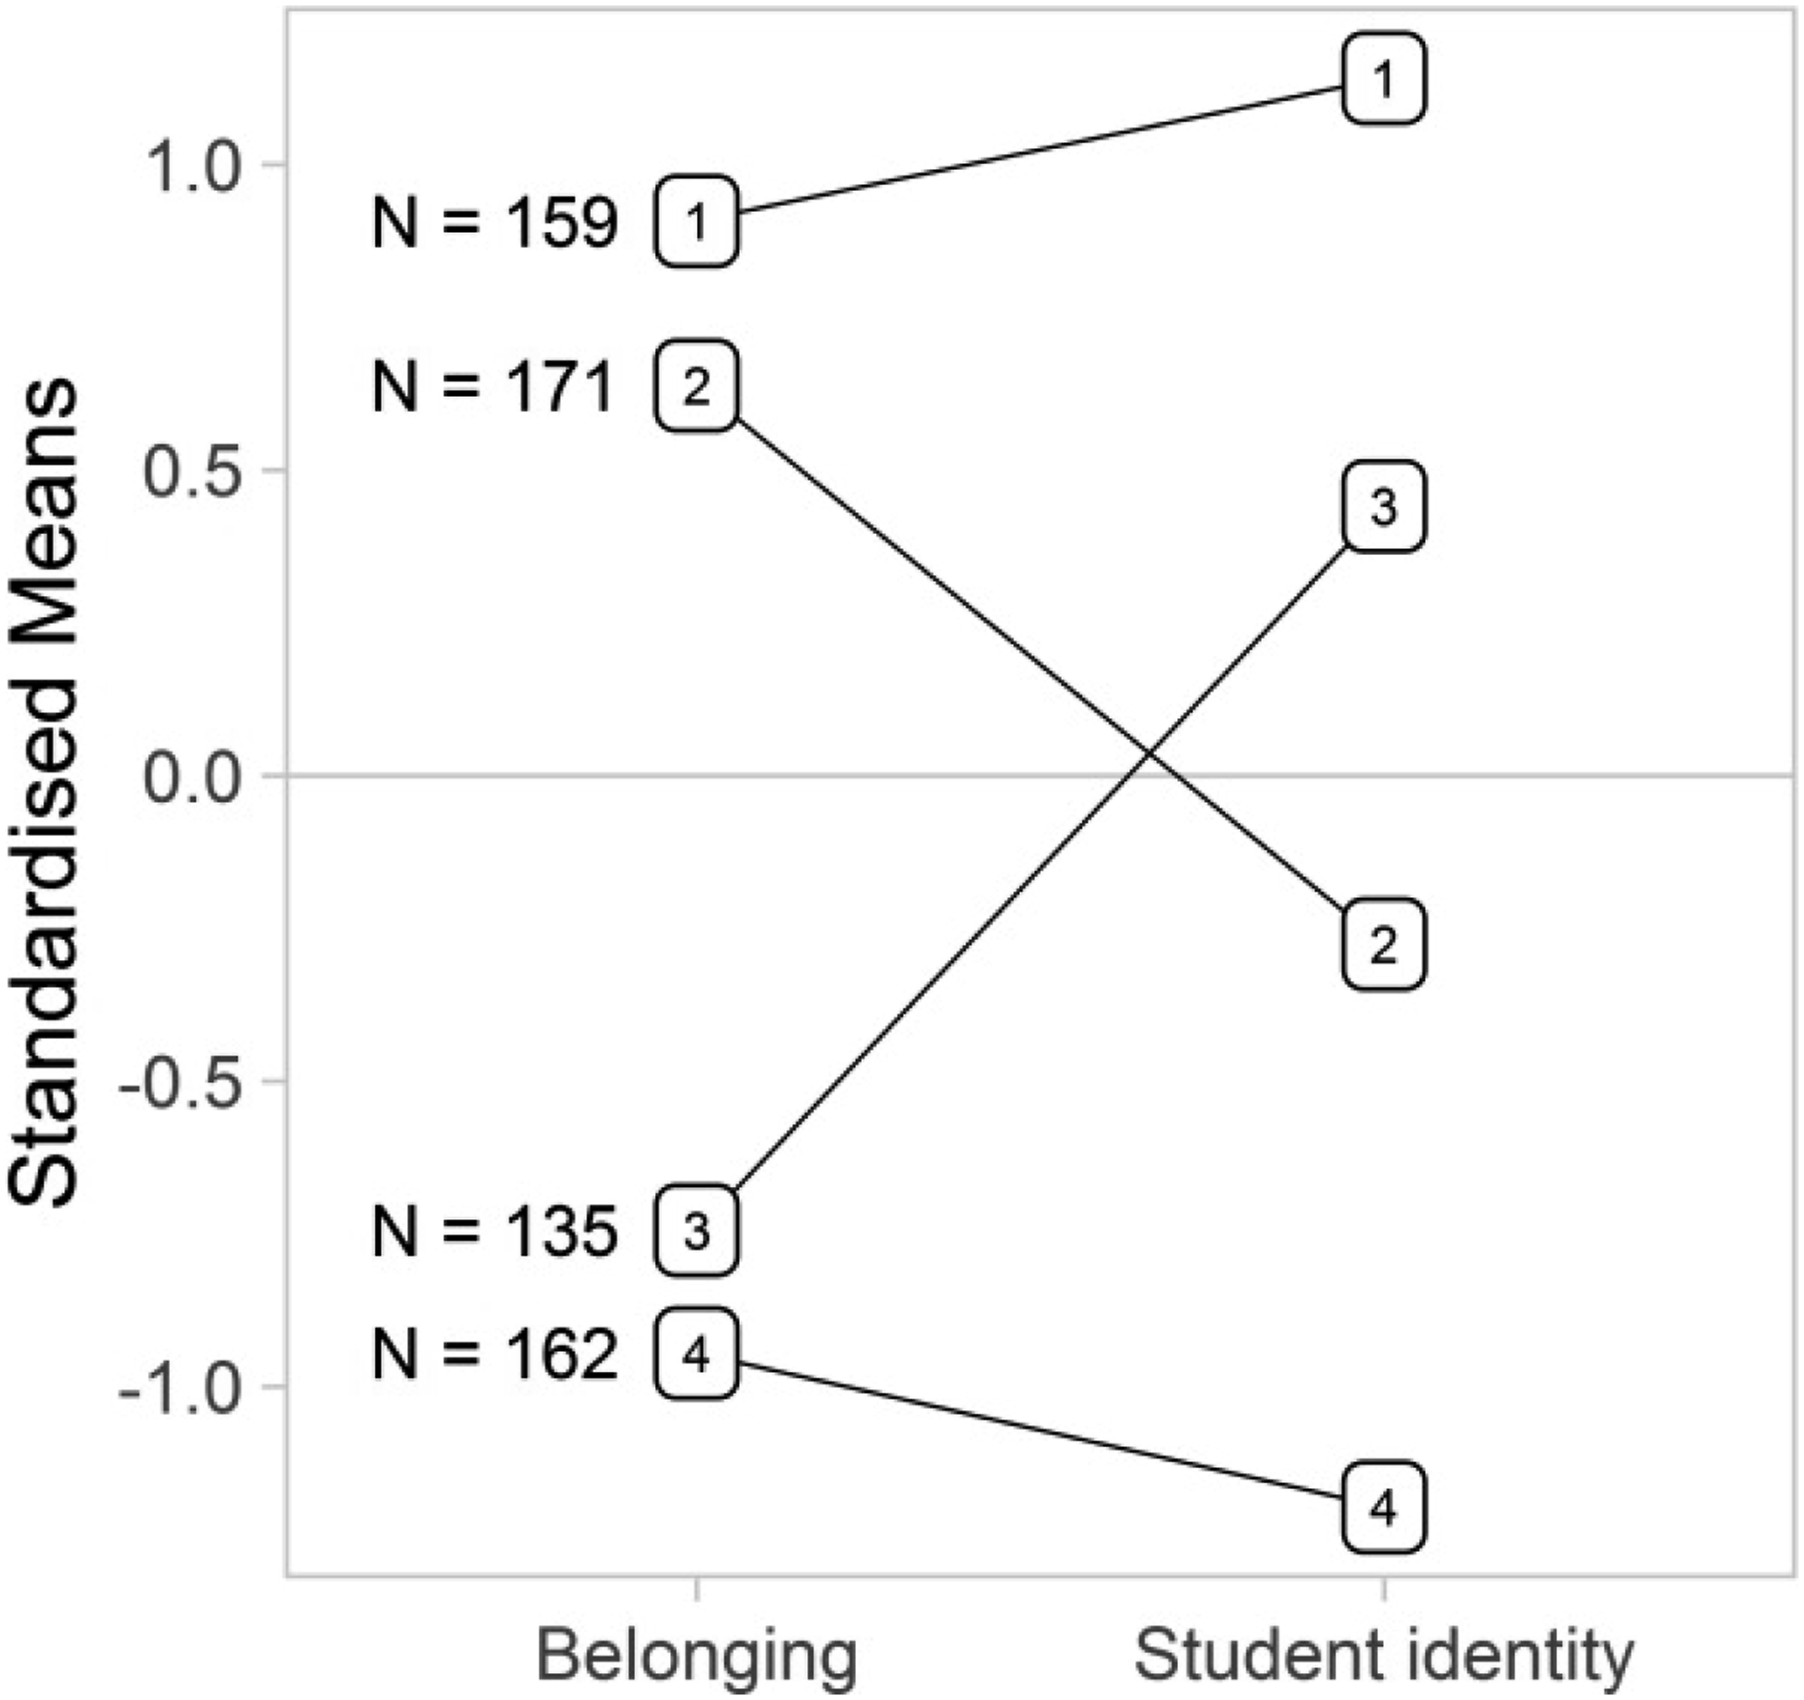
The standardised component scores were submitted to k-means cluster analysis. The scree test showed two kinks: one at three clusters, and another at five or six clusters. There was an additional 15% of variance accounted for on Component 2 (‘Student identity’) when moving from the three-cluster to the four-cluster solutions, and for this reason, the three-cluster solution was rejected. The six- and five-cluster solutions accounted for only an additional 3% and 5% of variance over the 5- and 4-cluster solutions, and therefore, they were rejected. The Jaccard coefficients of similarity for the four clusters were: 0.868, 0.900, 0.798 and 0.906. Using a cut-off of 0.75 (Hennig, 2007), the indication was that the four-cluster solution generated stable clusters.
Figure 2 shows the standardised means for each cluster (and the Ns give the number of students in each cluster). The four clusters were characterised as follows: • Cluster 1: High scores for both ‘Belonging’ and ‘Student identity’; they perceived that they were well-liked, liked going to school, they were always hard-working, always received good grades/schoolwork and always happy with their grades/school work. • Cluster 2: High scores for ‘Belonging’ but close to average scores for ‘Student identity’; they perceived that they were well-liked and liked going to school. • Cluster 3: Low scores for ‘Belonging’ but close to average scores for ‘Student identity’ (Opposite to Cluster 2 students); they did not always perceive that they were well-liked and they did not always like going to school. • Cluster 4: Low scores for both ‘Belonging’ and ‘Student identity’ (Opposite to Cluster 1 students); they did not always perceive that they were well-liked and they did not always like going to school, they were not always hard working, and they did not always receive good grades (school work). Standardised mean for four clusters of students derived from their perceptions of their sense of ‘Belonging’ and ‘Student identity’ (Ns give the number of students in each cluster).
There was a statistically significant association between cluster membership and City (χ2 = 101.90, df = 6, p < .0001), with a moderate effect size (Cramer’s V = 0.28, and the bias corrected and accelerated bootstrap (bca) 95% confidence interval (CI) was [0.21, 0.32]).
Crosstabulation of ‘Belonging’ and ‘Student identity’ clusters with City.
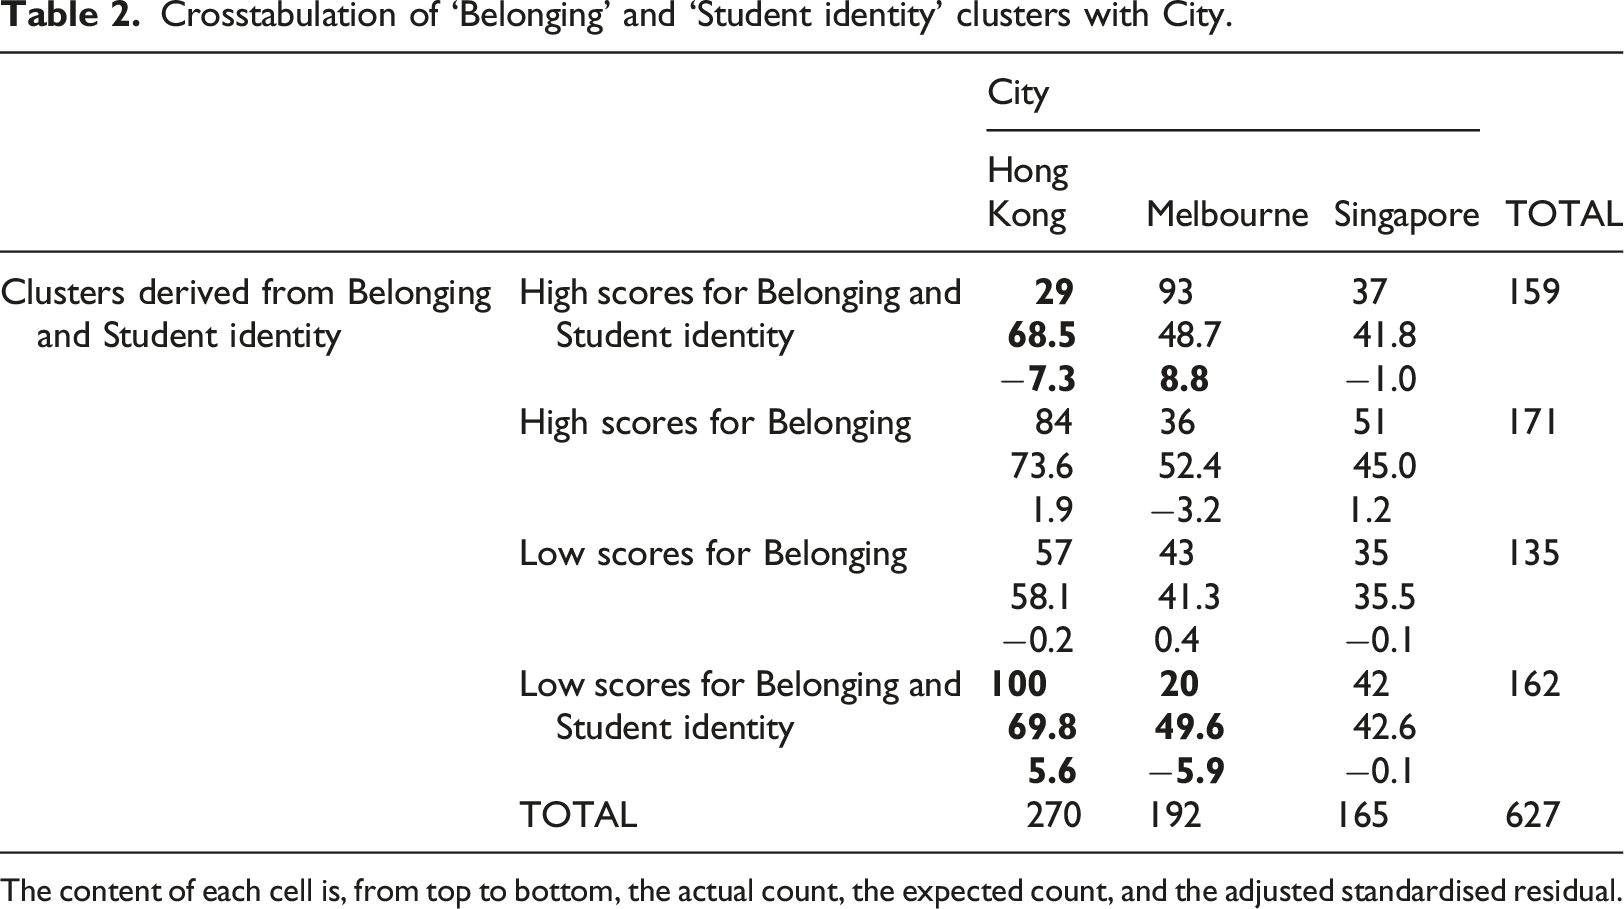
The content of each cell is, from top to bottom, the actual count, the expected count, and the adjusted standardised residual.
The association between cluster membership and City applied not only to the sample as a whole but also among Girls (χ2 = 65.77, df = 6, p < .0001, Cramer’s V = 0.32, 95% CI is [0.23, 0.37]) and Boys (χ2 = 35.53, df = 6, p < .0001, Cramer’s V = 0.21, 95% CI is [0.12, 0.27]), although, as indicated by Cramer’s V, the effect was somewhat stronger among Girls than among Boys.
In summary, and regardless of gender, Melbourne students tended to report higher senses of ‘Belonging’ and ‘Student identity’ than did Hong Kong students; Hong Kong students tended to report lower senses of ‘Belonging’ and ‘Student identity’ than did Melbourne students; Singapore students tended to be somewhere between the two. City was related to the clusters that have high scores (and low scores) on both components. No relationship could be detected with Clusters 2 and 3 (apart from the small association between Melbourne and Cluster 2). That is, for there to be an association, students needed high scores or low scores for both ‘Belonging’ and ‘Student identity’ (Clusters 1 and 4); high scores or low scores on ‘Belonging’ with average scores on ‘Student identity’ (Clusters 2 and 3) was not enough.
Second group of analyses: Preferences for school subjects and activities
The second group of analyses were concerned with students’ perceptions of how often subjects and activities at school should happen. Figure 3 shows the percent of students who responded in each response category for each activity. In terms of popularity (the percent of students who said ‘More often’), there seemed to be a small group of traditional academic activities that were less popular: Mathematics and science, Reading and writing, Languages and Taking tests; and a group of non-academic activities that were more popular. We chose the terms academic and non-academic since, unlike previous studies focusing on subject preferences (as discussed in the introduction), we asked about activities as well as subjects. Percent of students who responded in each category of the response scale for the question asking students if they want certain school activities to occur more or less often.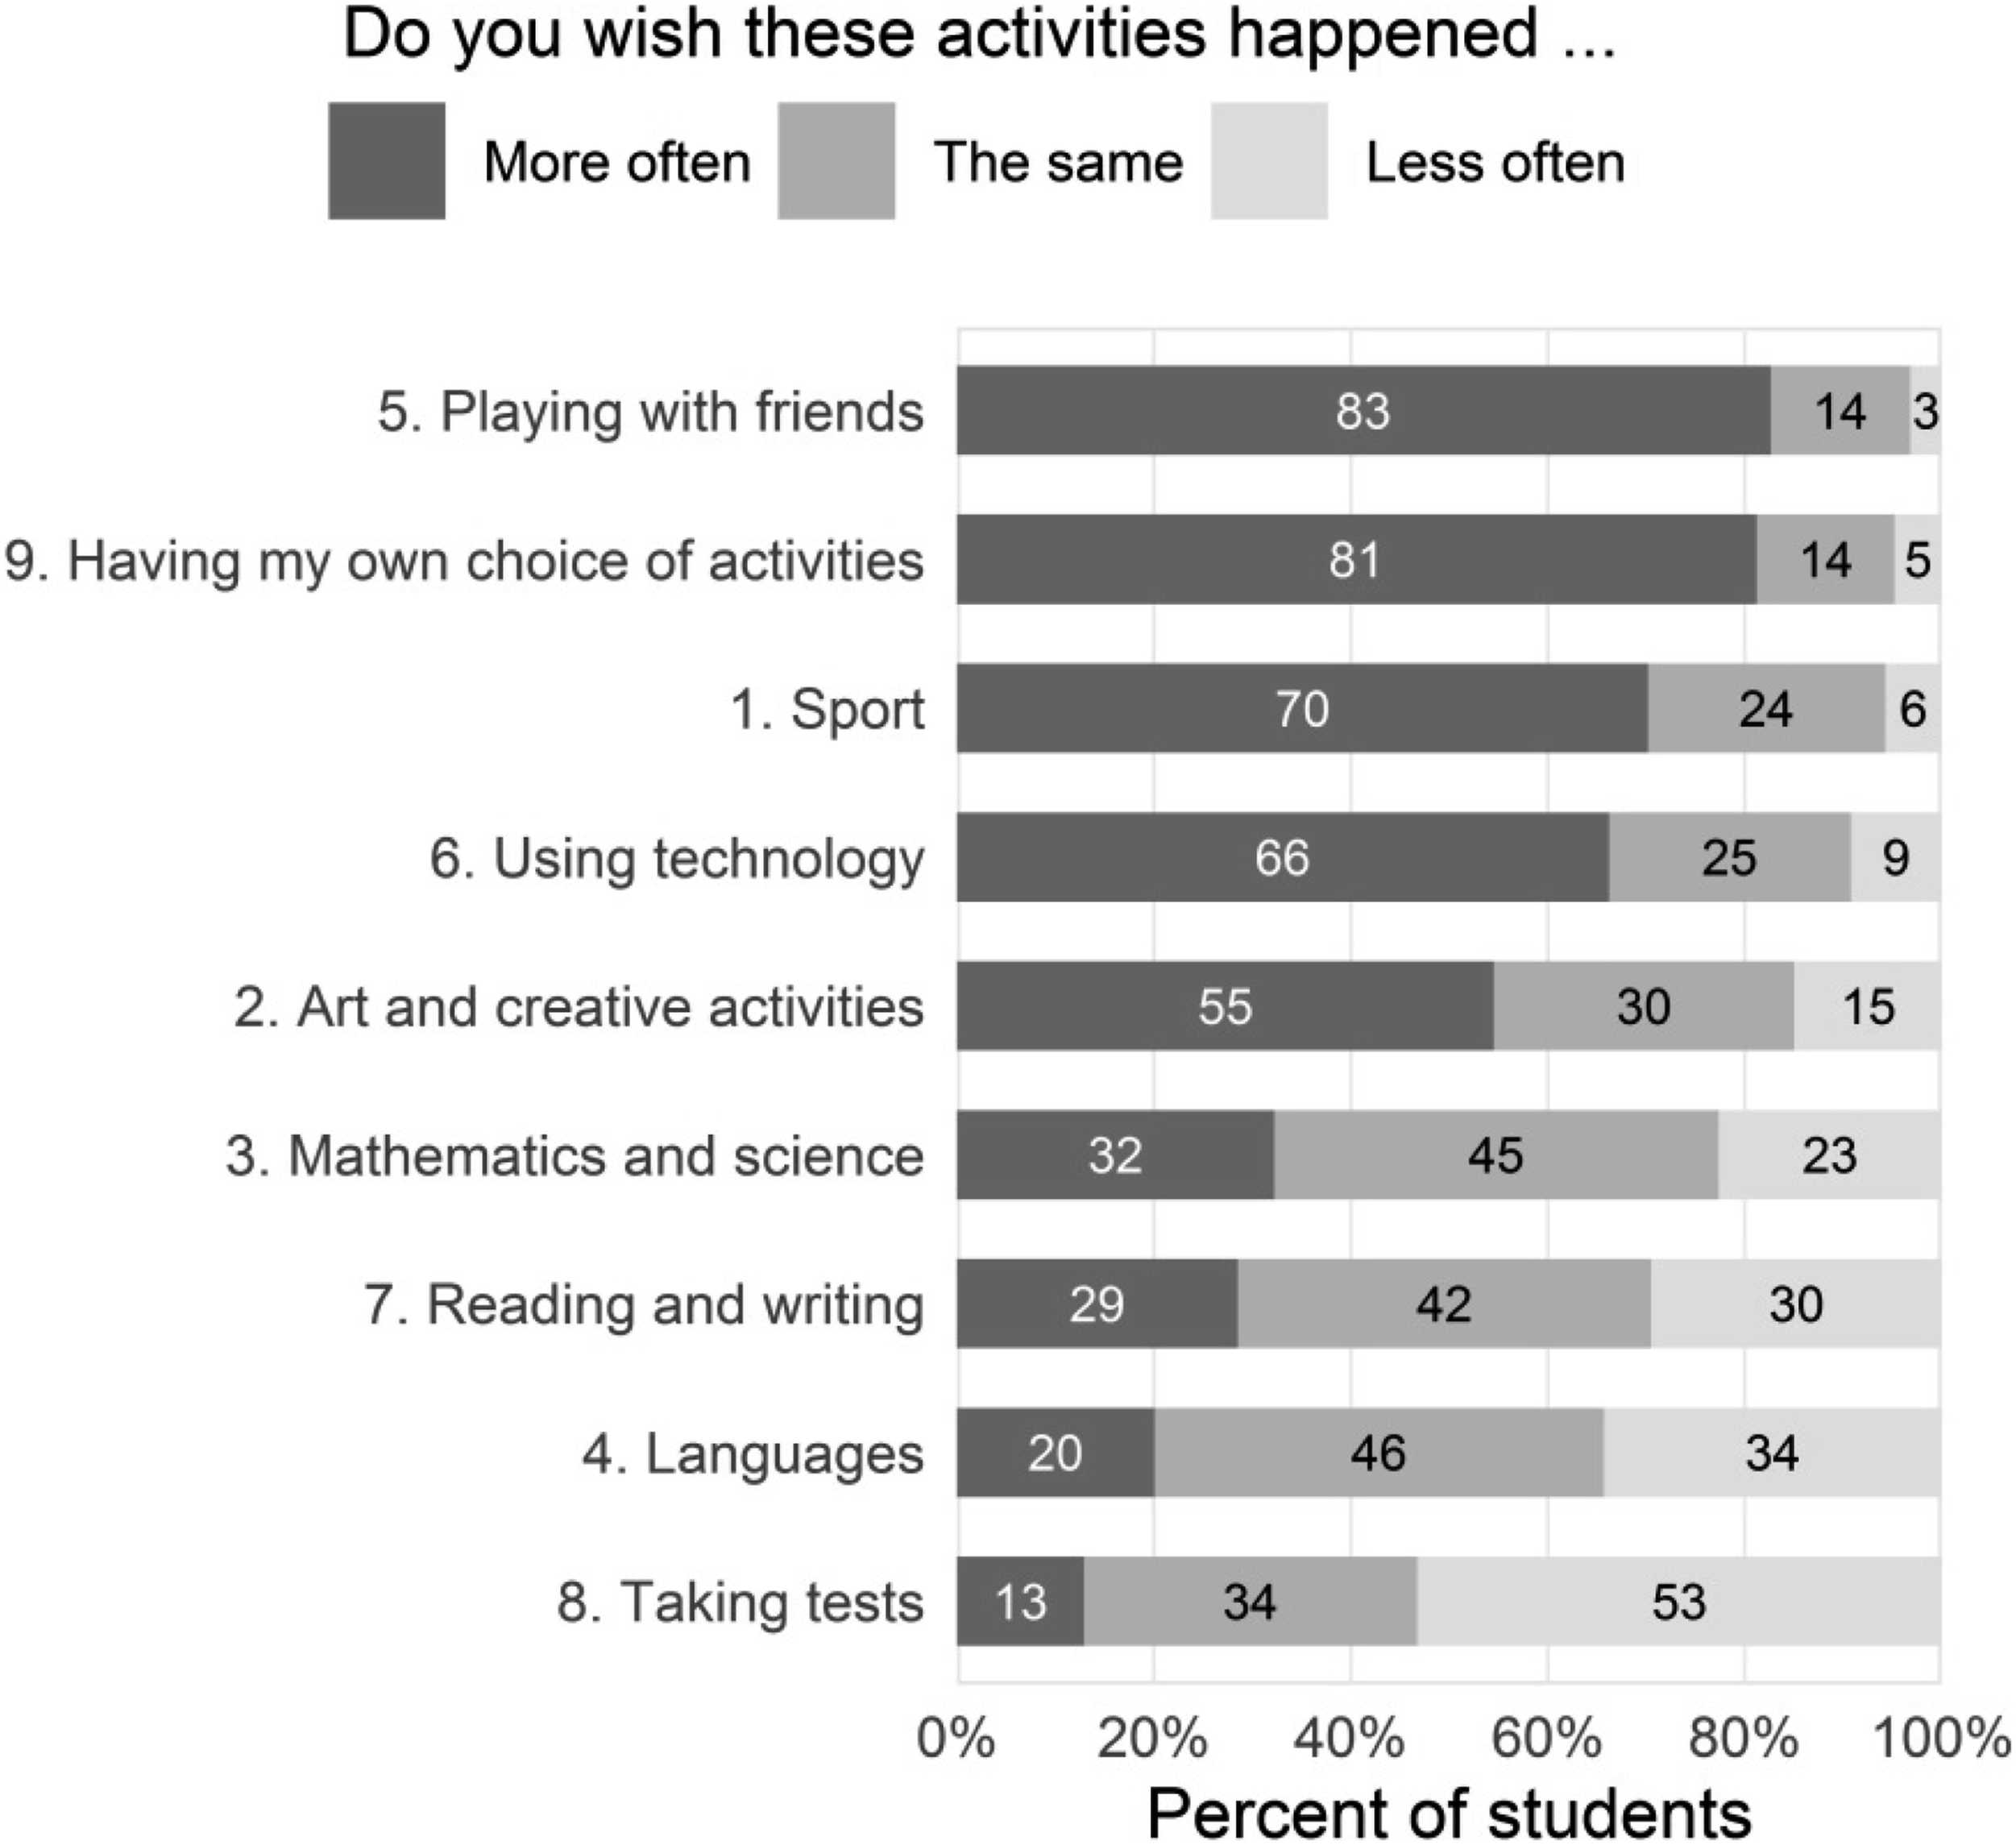
Again, the rules-of-thumb for determining the number of components for the PCA to extract were not consistent. The Kaiser–Guttman rule and parallel analysis suggested a two-component solution, the scree plot suggested a three-component solution. However, the eigenvalue for the third component was well below the mean eigenvalue for the third component for the random data. Also, the three-component solution at the next step (the cluster analysis) led to unstable clusters. The two-component solution was readily interpretable, and so the two-component solution was selected.
Summary of results of the PCA on scores for nine school subjects and activities.
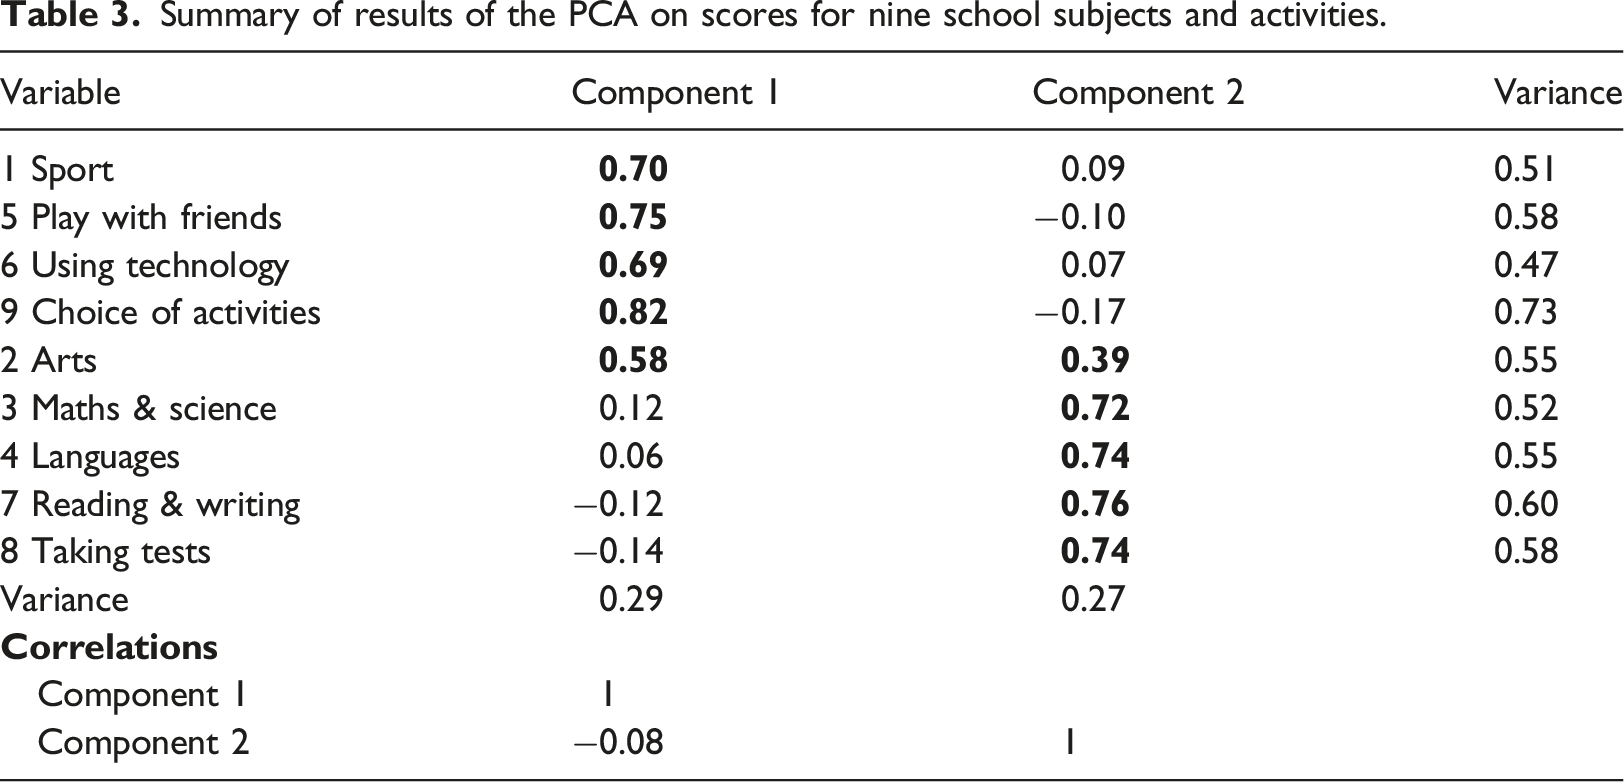
We characterised the first group of activities as ‘Non-academic’ school activities, and the second group as ‘Academic’ school activities.
As before, the standardised component scores were submitted to k-means cluster analysis. The scree test showed two kinks: one at four clusters, and another at seven clusters. However, there was little gain in variance accounted for when moving to the six- or seven-cluster solutions. There was not much separating the four- and five-cluster solutions, and both were readily interpretable. However, when assessed for stability, the five-cluster solution resulted in two unstable clusters. The Jaccard coefficients for the four-cluster solution were as follows: 0.812, 0.886, 0.764 and 0.889; indicating four stable clusters.
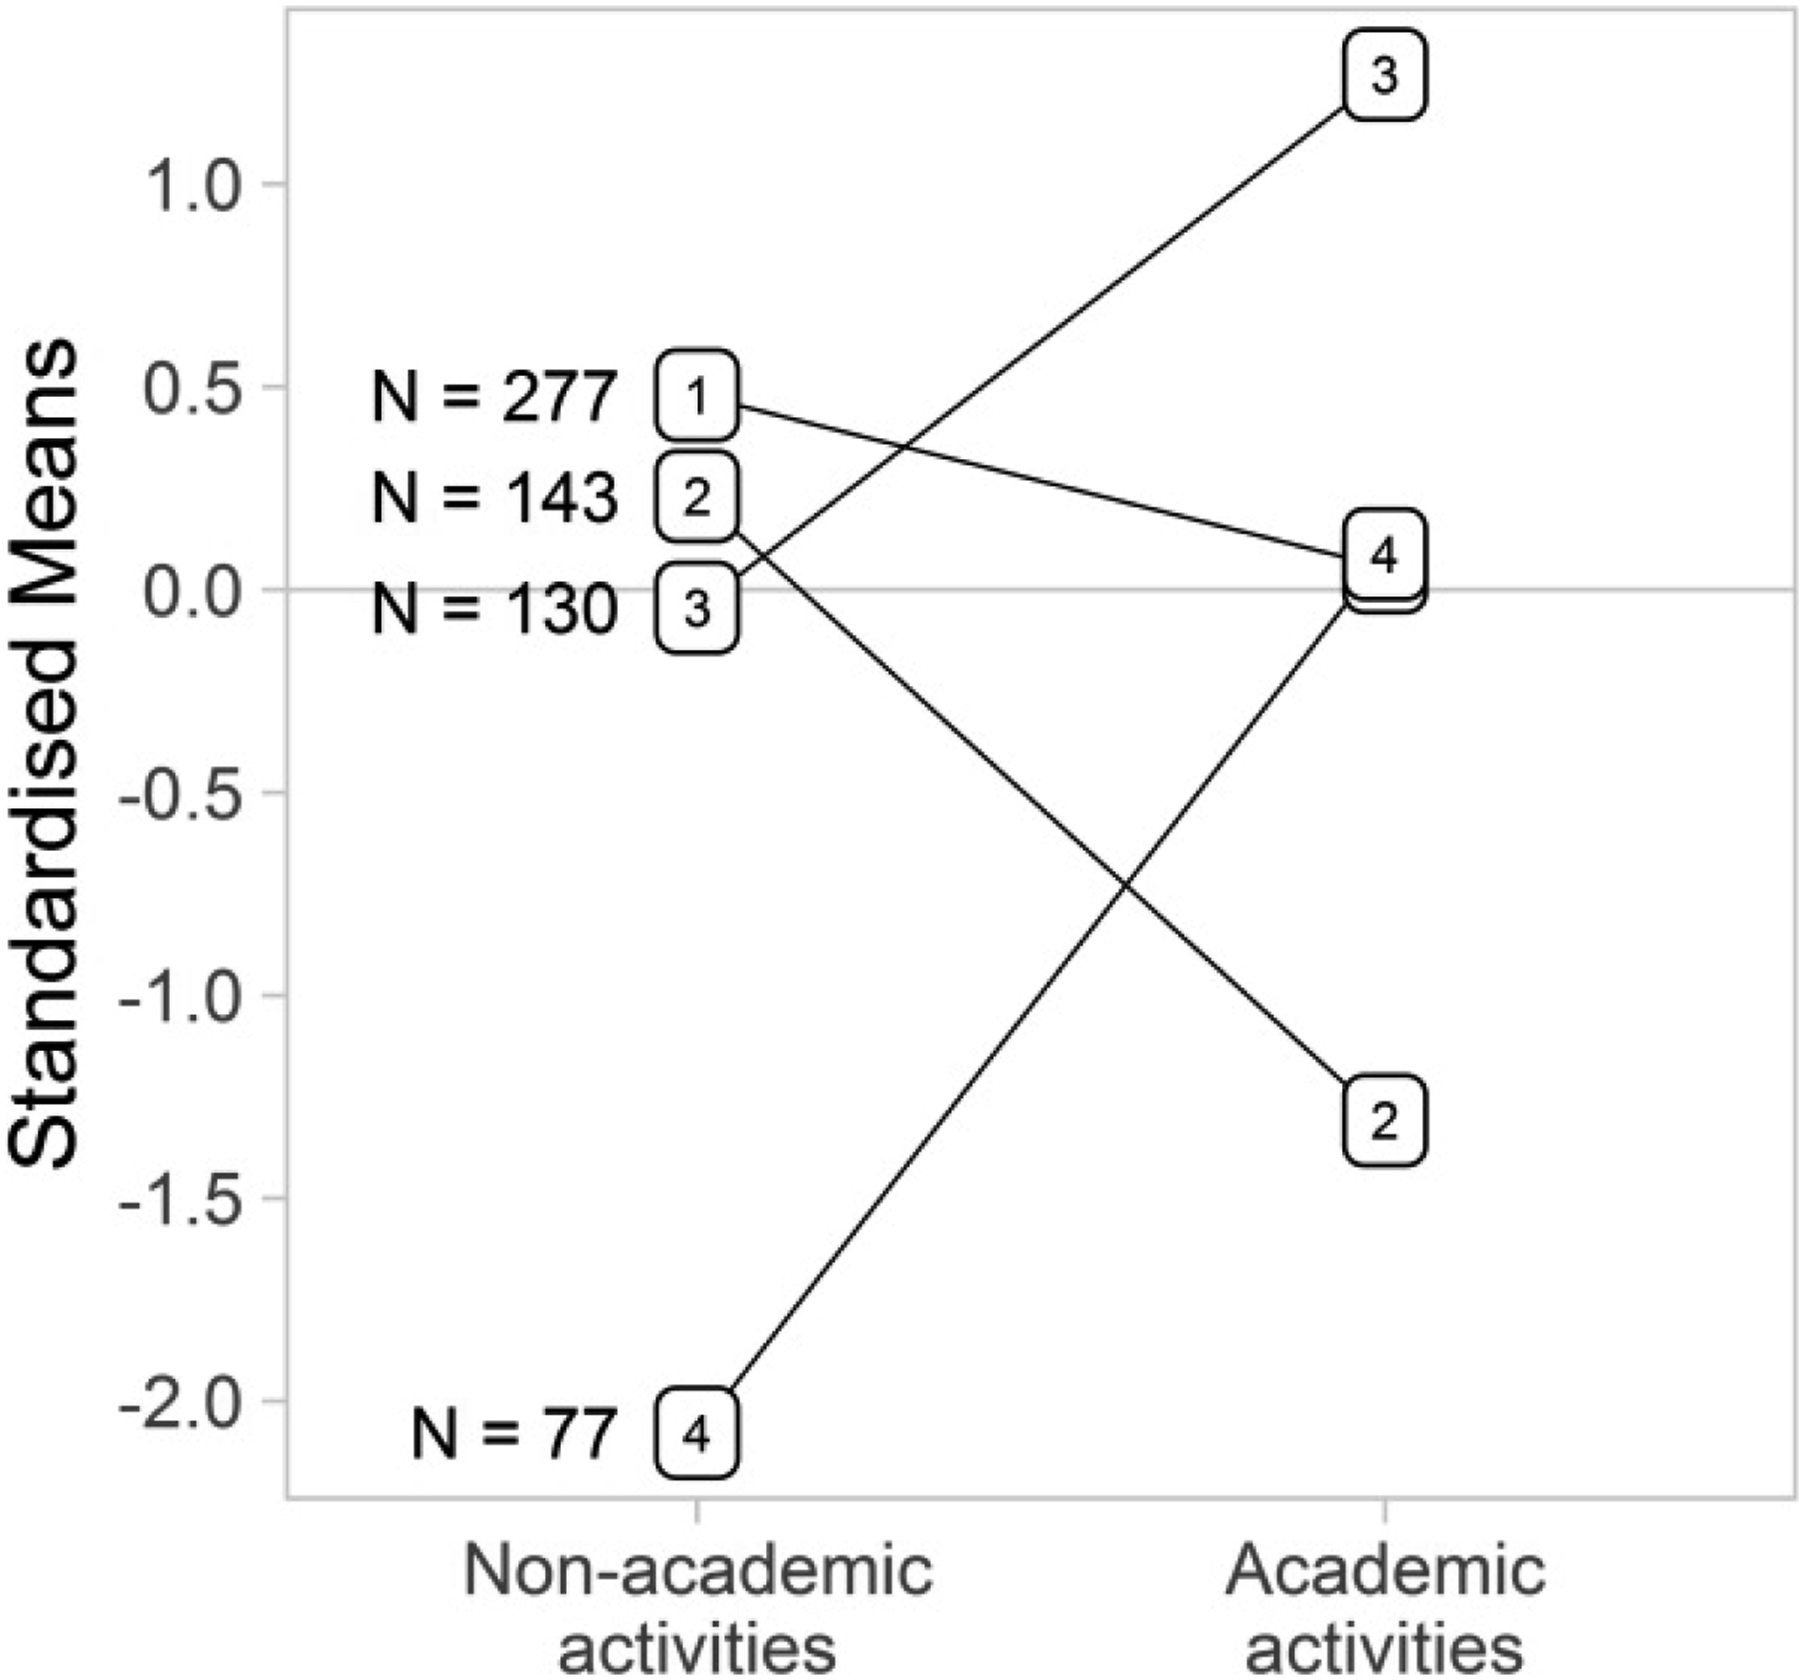
Figure 4 shows the standardised means for each cluster in the four-cluster solution (and the Ns give the size of each cluster). The four clusters were characterised as follows: • Cluster 1: High scores for Non-academic activities (closer to ‘More often’), and average scores for Academic activities; they wanted Non-academic activities more often. • Cluster 2: More-or-less average scores for Non-academic activities, but low scores (closer to ‘Less often’) for Academic activities; they wanted Academic activities less often. • Cluster 3: Average scores for Non-academic activities, but with very high scores (closer to ‘More often’) for Academic activities; they wanted Academic activities more often. • Cluster 4: Low scores (close to ‘Less often’) for Non-academic activities, and with average scores for Academic activities; they wanted Non-academic activities less often. Standardised means for four clusters of students derived from students’ preferences for wanting Non-academic and Academic activities to occur more or less often (Ns give the number of students in each cluster).
There was a statistically significant association between cluster membership and City (χ2 = 26.76, df = 6, p = .0002), but the effect size was small (Cramer’s V = 0.13, 95% CI was [0.05, 0.17]); indeed, the CI suggests that an insignificantly small effect cannot be ruled out.
Crosstabulation of ‘Academic’ and ‘Non-academic’ clusters with City.
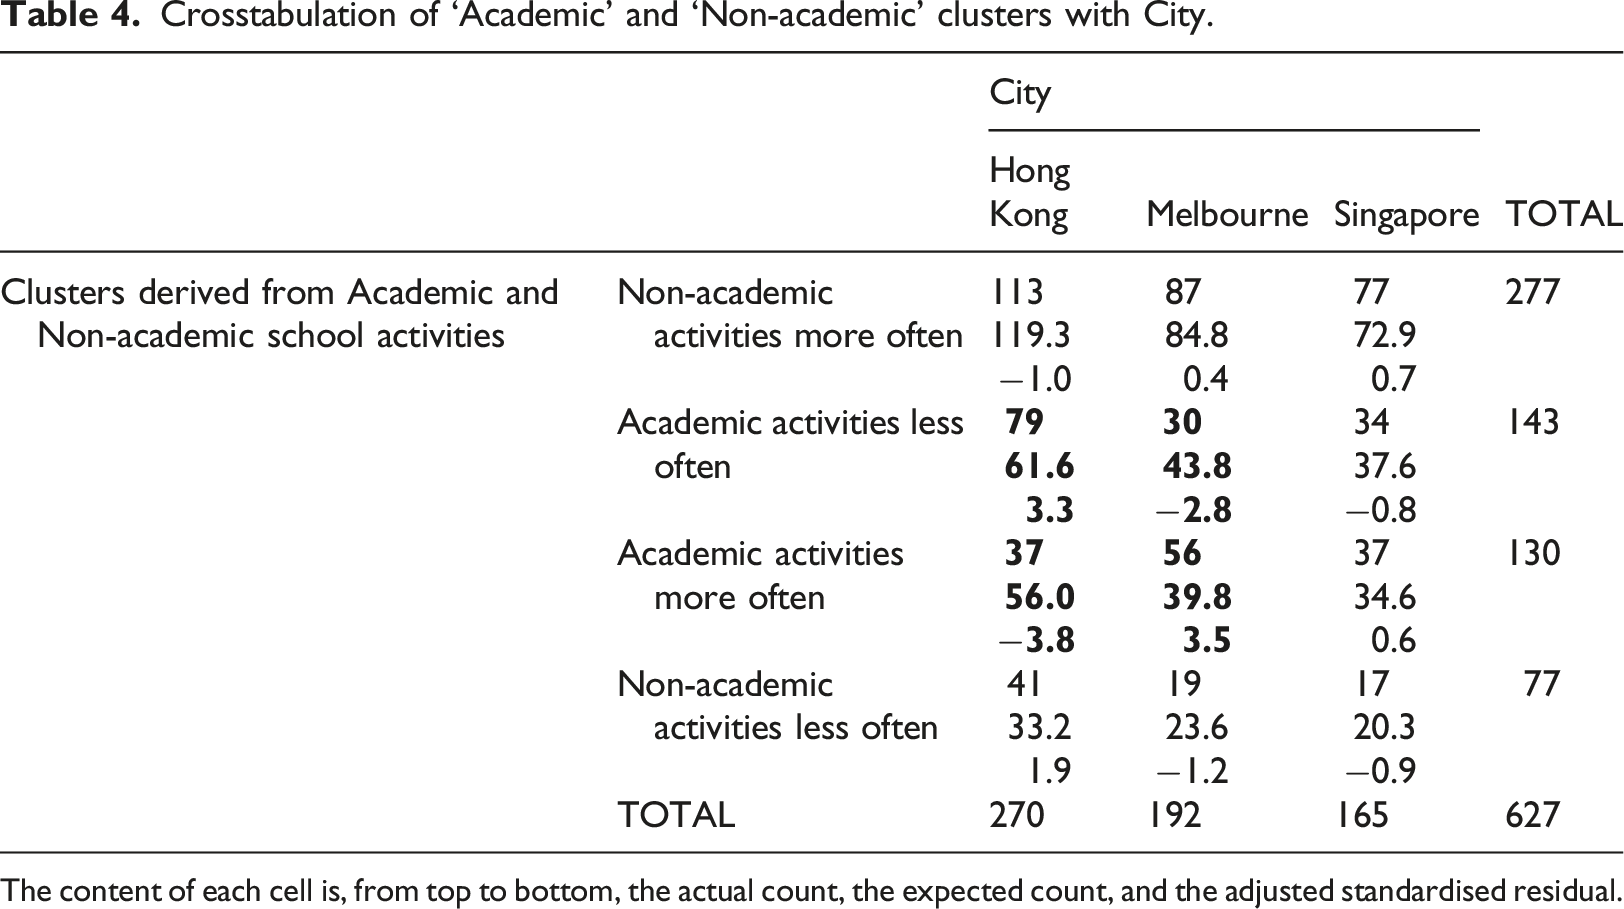
The content of each cell is, from top to bottom, the actual count, the expected count, and the adjusted standardised residual.
In summary, girls in Melbourne wanted Academic activities more often, more so than girls in Hong Kong. On the other hand, girls in Hong Kong wanted Academic activities less often, more so than girls in Melbourne. Singapore students tend to be somewhere between the two. These associations were not present for boys. Also, there were no associations with Clusters 1 and 4 (the clusters that wanted Non-academic activities more often and less often, respectively).
Third group of analyses: Perceptions of belonging, student identity and preferences for school subjects and activities
Crosstabulation of ‘Academic’ and ‘Non-academic’ clusters with ‘Belonging’ and ‘Student identity’ clusters.
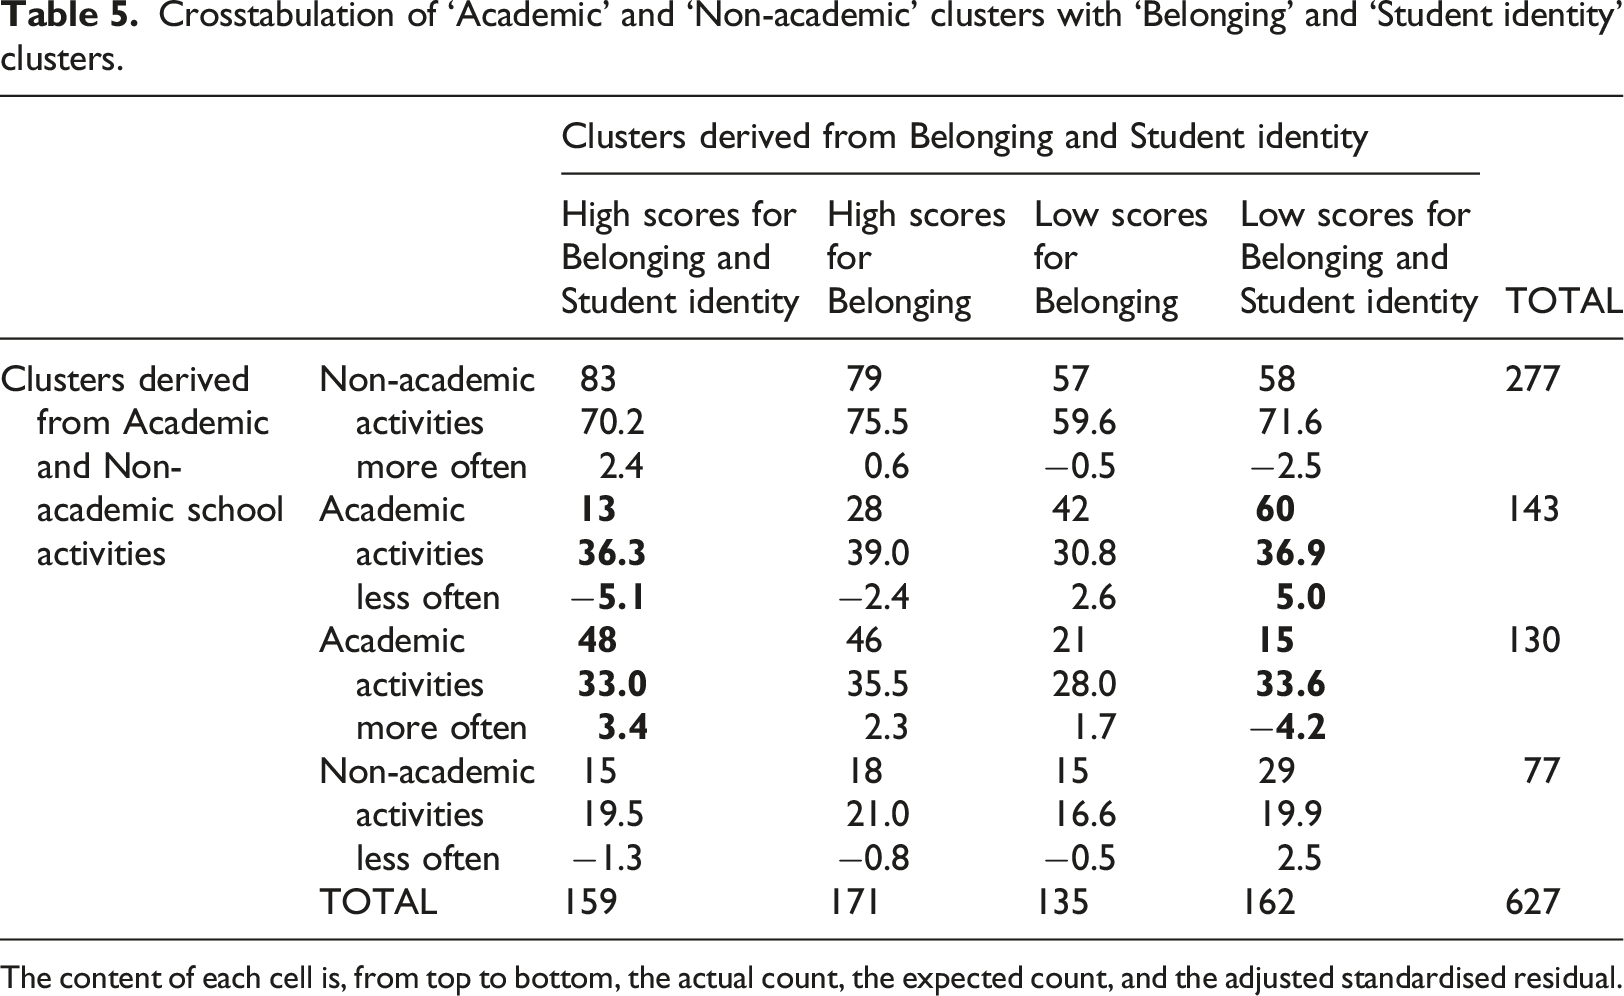
The content of each cell is, from top to bottom, the actual count, the expected count, and the adjusted standardised residual.
These associations applied not only to the sample as a whole but also among Girls (χ2 = 33.39, df = 9, p = .0001, Cramer’s V = 0.16, 95% CI is [0.06, 0.21]) and Boys (χ2 = 34.43, df = 9, p < .0001, Cramer’s V = 0.16, 95% CI is [0.09, 0.20]), though the effect size was small. There was the same pattern of residuals, but with one exception. For girls, there were more than expected in the cluster with high scores for both ‘Belonging’ and ‘Student identity’ who wanted Academic activities to happen more often, but the residual was not statistically significant.
In summary, and with the noted exception above, students who liked school, and who perceived themselves as being well-liked and hard-working showed a greater preference for Academic activities occurring more often. Students who did not always like school, and perceived themselves as being less well-liked and less hard-working wanted to avoid Academic activities.
Discussion
In this article, we have explored aspects of children’s experiences of school in three global cities in the Asia Pacific. This is particularly pertinent to consider in East Asian contexts where high academic results are often not matched with high levels of school belonging in the high-stakes test reports (Mullis et al., 2017, 2020), as discussed in the introduction to this article. The data presented and discussed here are an exploratory contribution to furthering understandings about students’ sense of belonging, student identity and preference for different school activities in Hong Kong, Singapore and Melbourne.
In terms of perceptions of school, the survey responses from students were generally positive across the three locations. Overall, students generally had a high sense of belonging (enjoyed going to school and perceived that their teachers and classmates showed that they liked them), and positive views of themselves as students (described themselves as hardworking, viewed their grades/school work positively and were happy with their grades/school work). The findings relating to belonging differ from the PIRLS 2016 and TIMSS 2019 findings outlined earlier (Mullis et al., 2017, 2020), where students in Hong Kong and Singapore in particular had low scores for sense of belonging, and Australia (where Melbourne is located) also appeared in the bottom half of countries. However, in the current study, students were most likely to report a higher sense of belonging in Melbourne, followed by Singapore, then Hong Kong, which did reflect where these locations ranked in relation to each other PIRLS 2016 and TIMSS 2019. In addition, while student identity was also positive overall, there were some differences between the locations, which may reflect Rees’s (2017) suggestion that students from high achieving countries are under more expectation to perform well, impacting on their satisfaction with their school marks. The different policy and curriculum contexts of each location also may be one explanation for these findings. Although we followed the most commonly used framing of school belonging in the literature (relationships with others, feelings about school), these reflections on ‘student identity’ (children’s perceptions of themselves as students) contribute to the literature by importantly considering areas such as children’s views on their grades which appear to have received little previous attention (with the exception of Rees and Main, 2015). Future research could include a broader exploration of these aspects, such as considering more elements relating to student identity.
In terms of school activities, Melbourne students tended to prefer more Academic activities (Mathematics and science, Reading and writing, Languages, and Taking tests) than Hong Kong students, and Singapore students’ responses tended to fall between the two. Other studies (in English language contexts) have found that students of a similar age have tended to prefer non-academic subjects (Colley and Comber, 2003; Hasni et al., 2017; Murphy et al., 2010), although in one international study, Maths was often named as the favourite subject, although this differed by location (Chambers et al., 2018). As the survey asked whether students would like school subjects to happen more often, the same, or less often, a further consideration of the Year 4 timetables, and how much time is already dedicated to these areas, may go some way to explaining students’ subject and activity preferences.
Combining the sets of questions, students who scored highly on belonging and student identity tended to want Academic activities to occur more often, whereas students who scored low on belonging and student identity wanted Academic activities to occur less often. It was notable that these associations were located in clusters that had high or low scores in relation to Academic activities, not Non-academic activities. These findings indicate a link between belonging, student identity, and school activities, but the ways in which these interact need to be explored further, and we have been careful not to make causal inferences which go beyond our data. Others have also found there are links between students’ enjoyment of a subject and their perceptions of their ability (e.g. Murphy et al., 2010), but have also not determined which of these may cause the other, or how they may impact on each other.
This article has provided a consideration of children’s experiences of school in three global cities in the Asia Pacific. However, it is important to acknowledge some limitations with the survey. First, we note that the survey draws on a specific sample of students from particular schools in Hong Kong, Singapore and Melbourne, and the sample size is relatively small compared to broader international studies. The schools are not intended to be a representative sample in each location. As mentioned above, school research is strictly monitored in the three locations and it is very difficult to gain access to schools to conduct research, particularly in Hong Kong and Singapore. In addition, as with previous research discussed in the article, we have grouped questions and responses into overarching categories or components (we have selected ‘Belonging’, ‘Student identity’ and ‘Academic activities’), although these could be measured in different ways. These questions were based on a previous survey by the authors, and aimed to examine students’ perceptions about their school experiences as one aspect of their lifeworlds. Some of the questions, such as perceptions of grades/school work, may have been enhanced by matching these to students’ grades or school reports, although we chose to conduct the survey anonymously in the hope that this would allow students to be more open with their responses. Finally, the possible cultural and gender differences in how students’ perceptions may be expressed also needs to be recognised as a potential limitation of the study. For example, as mentioned above, students in Hong Kong and Singapore may be more critical of their grades/school work than students in Melbourne, because of the pressure they may receive from their parents and teachers about receiving high grades and academic test results (Carless and Lam, 2014; Cho and Chan, 2020; Rees, 2017).
Although it is beyond the scope of the present article, diversity within these locations also needs to be further explored, such as culture and socio-economic status. For example, Cheung and Hui (2003) highlight differences in school belonging amongst Hong Kong local students and mainland immigrant students, which is not captured when treating students from one location as a single group. A closer analysis of each of these global cities and the diversity within them will take place in future publications focused on each of the locations individually.
Conclusions
The data presented here with its explicit focus on responses from students in Year 4 in three global cities in the Asia Pacific (Hong Kong, Singapore and Melbourne) has added to the existing literature by offering a consideration of student’s experiences in relation to their sense of belonging, student identity and preferences for particular school activities. We contend that understanding these aspects is directly relevant to the essence of effectively learning that need to form the basis of policy making and curriculum development.
Our focus in this article has enabled us to explore some of the affective dimensions of children’s lifeworlds in relation to school and allowed us to consider some of the personal dimensions of schooling, beyond performance as a simple score in a test of mathematics, science or reading. The results indicate interesting similarities and differences between the children in each location selected for the purposes of this study, but also that Singapore, as a high performing nation in the academic test results of TIMSS and PIRLS, seems to avoid the general trope of such performances being linked with low sense of belonging hitherto reported in the TIMSS and PIRLS data. Schooling is a social as well as an academic experience. Thus, studies which consider the less tangible aspects of schooling that are difficult to measure but significant to students’ experiences need to be interrogated in order to promote more holistic learning experiences in schools, and this needs to be reflected and implemented in policy and curriculum.
Footnotes
Declaration of conflicting interests
The author(s) declared no potential conflicts of interest with respect to the research, authorship, and/or publication of this article.
Funding
The author(s) disclosed receipt of the following financial support for the research, authorship, and/or publication of this article: This work was supported by the Australian Research Council under Grant number DP180100325 and by the National Institute of Education, Singapore under Grant number RS4/18_LKM.
ORCID iDs
Note
Nicola Yelland is the Professor of Early Childhood Studies in the Melbourne Graduate School of Education at the University of Melbourne, Australia. Her teaching and research interests have been related transformative pedagogies and the use of new technologies in school and community contexts.
Clare Bartholomaeus is a Research Fellow in the Melbourne Graduate School of Education at the University of Melbourne, Australia. She has published widely in the areas of education, gender studies, health and family studies.
Sandy Muspratt has worked on a range of commissioned research and evaluation projects, taught quantitative methods courses and conducted workshops on topics ranging from introductory workshops on quantitative methods to week-long workshops on advanced techniques for academics and research students. He is an honorary Research Fellow in the School of Education and Professional Studies at Griffith University, Australia.
Anita K.W. Chan is Associate Professor in the Department of Social Sciences at The Education University of Hong Kong. Her research interests cover gender, education, family and migration studies.
Vivienne Wai Man Leung is an Assistant Professor in the Department of Early Childhood Education, the Education University of Education, Hong Kong. Her research interests focus on the use of Information and Communication Technologies (ICT), STEM education, children’s learning portfolios and picture books with young children in home and preschool settings.
Li Mei Johannah Soo lectures in Consumer Food Sciences in the National Institute of Education at the Nanyang Technological University. Her research interests include understanding behaviours and attitudes of different segments of the population, especially in the understanding of societal resilience in the event of food shortage crisis among students; and in turn provides pertinent information for curriculum design and community interventions.
Kam Ming Lim is the Registrar and an Associate Professor at the National Institute of Education, Nanyang Technological University in Singapore. His research areas include teacher education, prosocial behaviour, and help-seeking behaviour.