
Abstract
Objective:
Eating disorders impact physical, psychological, and social well-being, and often need complex health care. Understanding changes in healthcare utilization is essential for policy and planning. This research evaluates healthcare utilization by people with eating disorders by linking person-level data across health settings to provide a system-wide description of eating disorder care.
Methods:
This retrospective cohort study evaluates health service use by people with eating disorders aged 6 years or older in the three most populous states in Australia; New South Wales, Queensland, and Victoria, for a 10-year period, 2010–2019, by linking data for hospital admissions (public and private), emergency department presentations and public outpatient mental health. Population rates and Average Annual Percent Change (AAPC) by age groups are reported.
Results:
Service use increased significantly over the decade in all states, in all healthcare settings, and was highest for young people. Public outpatient service contacts doubled in VIC, almost tripled in NSW, and increased 5-fold in QLD. Public hospital admissions doubled in NSW and VIC and tripled in QLD. Hospital admissions for males increased at a higher rate than for females in NSW and QLD, and public hospital admissions for males in QLD increased 6-fold over the study period. Presentations to emergency departments doubled in all states. Population rates and AAPC show increases were greatest in 16- and 17-year-olds.
Conclusions:
This study covering three-quarters of the Australian population demonstrates substantial increases in rates of health service use for people with eating disorders between 2010 and 2019.
Keywords
Eating disorders (EDs) are serious psychiatric conditions which affect 4–16% of Australians (Burt et al., 2020; Deloitte, 2024). They are complex disorders affecting physical, psychological, and social well-being, with high rates of co-occurring physical and psychiatric conditions (Levinson et al., 2022). Health service utilization for adults with EDs is high and may remain elevated for an extended period (Mitchell et al., 2009; Striegel-Moore et al., 2008), placing pressure on health resources. To better understand the movement of individuals with EDs through the Australian healthcare system and to identify gaps in service provision, we need longitudinal person-level data to examine changes in who is accessing health services and in which treatment setting, across different geographical locations and jurisdictions.
Despite prior reports of high healthcare utilization for adults with EDs, a lack of health utilization data for young people significantly impedes our understanding of health service usage across the lifespan. The peak age of onset for EDs is mid-adolescence, at around 16 years old (Favaro et al., 2019). However, recent data shows increasing incidence in under-15-year-olds (van Eeden et al., 2021). Adolescents with EDs present to emergency departments more frequently than their peers in the general population (Redekopp et al., 2022) and require more medical services than adolescents with diabetes (Couturier et al., 2022). More long-term health utilization data which includes the peak age of onset for EDs is needed.
There is often no linear pathway through the health system for treatment of EDs (Maguire and Maloney, 2021). Most ED treatments can take place through community-based services that provide outpatient or day treatment, also known as ambulatory care (Miskovic-Wheatley et al., 2023; Pehlivan et al., 2022). People with EDs may present to emergency departments if they experience significant medical complications, or they may be admitted to hospital if they need intensive medical or psychiatric care that cannot be provided in the community. Identifying patterns of healthcare utilization will provide important information for policy makers regarding future resourcing to ensure appropriate care for people with EDs.
Healthcare utilization can be evaluated from routinely collected healthcare data. However, rates may be underestimated in settings where diagnostic coding is limited (e.g. emergency department presentations). Identifying and linking person-level data across multiple datasets can improve case identification (Nielsen et al., 2024). Monitoring all healthcare encounters by diagnosis can further improve the estimation of service usage by capturing both directly related and ancillary health care contacts.
This study evaluates healthcare utilisation by people with EDs using data linkage across three administrative data sets: hospital inpatient admissions (public and private), emergency department presentations and community mental health visits.
Methods
Setting and health services
The Australian health system is a mix of public and private sectors with different funding and delivery mechanisms. The state-based public health system provides emergency department care, hospital admissions in both medical and mental health specific settings usually stratified by age group, and community care options via community treatment teams (ambulatory care). Private hospitals provide inpatient admissions and sometimes day hospital services for people with mental illnesses, including eating disorders.
Population and data sources
We included a cohort of people aged 6 years or older with an ED diagnosis recorded in either a hospital admission, an emergency department presentation, or a community mental health ambulatory visit in the Australian states of New South Wales (NSW), Queensland (QLD) and Victoria (VIC), between 2008 and 2019. Episodes were ascertained using respective state-wide administrative heath data representing 77% of the total Australian population. For NSW, this included the Admitted Patient Data Collection (APDC), Emergency Department Data Collection (EDDC) and Mental Health Ambulatory Data Collection (MHAMB). For QLD, the Queensland Health Admitted Patient Data Collection (QHAPDC), Emergency Department Information System (EDIS) and the Consumer Integrated Mental Health and Addiction (CIMHA) dataset. For VIC, the Victorian Admitted Episodes Dataset (VAED), The Victorian Emergency Minimum Dataset (VEMD) and the Mental Health Community Support Services (MHCSS) dataset. To ensure consistent counting of mental health ambulatory episodes between states, these were counted as days of care, as patients could have multiple visits to different health professionals in one day.
Ethics approval for the study was attained from the NSW Population and Health Service Research Ethics Committee: 2019/ETH13195 and approval for QLD and VIC components attained under the National Mutual Acceptance Initiative. Individual records from each data collection were linked by each state’s data linkage unit. Following linkage, each data linkage unit removed the identifiers and replaced these with a unique project person number, and together with clinical data sent to researchers for analysis.
Identifying people with eating disorders and associated contacts in the health system
EDs were identified where a relevant diagnosis was recorded during an episode of care in relevant data collections using the International Classification of Diseases 10th Version Australian modification (ICD10-AM) codes for eating disorders (ICD10-AM F50), specifically F50.0-F50.1 for anorexia nervosa, F50.2-F50.3 for bulimia nervosa, F50.8 for other eating disorders (avoidant restrictive food intake disorder, binge eating disorder, pica), and F50.9 for eating disorder, unspecified. For NSW emergency department diagnoses, ICD-9 clinical modification (CM) and Systematized Nomenclature of Medicine Clinical Terms (SNOMED CT) were used. A full list of codes is available in Supplementary Table 9.
Following the identification of people with an ED, all their respective episodes of care were obtained from each data collection (regardless of reason for care episode or diagnosis assigned in that episode) if these occurred between the date of the first episode with a recorded ED diagnosis (index episode) and up to 2 years after the last episodes with a recorded ED diagnosis in any health setting. To avoid under-ascertainment of episodes in 2010 and 2011, people with an index episode in 2008 and 2009 were included but all their healthcare utilization was reported from 2010 onwards.
Sociodemographic information for individuals identified with an ED and their episode of care was summarized, including age (categorized into <12, 12–15, 16–17, 18–25, 26–35, 36–49, 50–64 and ⩾65 years of age), birth sex, socioeconomic disadvantage quintile and remoteness of residence (major cities, inner regional, outer regional/remote). Age categories were selected to align with inclusion ages for health services reported, and to allow meaningful interpretation about service provision for eating disorders across all three jurisdictions. The majority of eating disorders onset in adolescence and young adulthood, and patients aged 12 years and over are included in similar health service utilization studies (Rappaport et al., 2024). Child and Adolescent Mental Health Services (CAMHS) and Child and Youth Mental Health Services (CYMHS) both commence at age 12, and paediatric services largely apply in all three jurisdictions for under-12-year-olds. While most community mental health services (CYMHS, CAMHS, headspace) service 12- to 25-year-olds, this large age range required further sub-grouping to reflect the health system. Hospital paediatric wards admit children up until the age of 16, and 16- to 17-year-olds may be admitted into adult wards. Socioeconomic disadvantage quintile and remoteness of residence category were ascertained according to the Australian Bureau of Statistics Index of Relative Socio-economic Disadvantage and the Accessibility and Remoteness Index of Australia (ABS, 2021a, ABS, 2021b). Hospital admissions were separated into public and private hospitals and categorized into those involving/not involving emergency department contact, reason for admission using primary diagnosis (mental health, endocrine; nutritional or metabolic diseases, gastrointestinal diseases, poisoning, or drug-related and other types) and whether the admission had a recorded ED diagnosis. Emergency department presentations were grouped according to triage categories: non-urgent, semi-urgent, urgent, emergency and resuscitation (Australasian College for Emergency Medicine (ACEM), 2023).
Statistical analysis
All data were analysed and presented by health service contacts in each respective data collection. We evaluated the source of identification of people with eating disorder using an UpSet diagram that visualizes dataset intersections in a matrix layout (Lex et al., 2014). The Upset diagram is a cross-sectional representation of the number and proportion of people with records in each of the included datasets, as well as the number and proportion of people with records in all the possible combinations, from people with records in only one dataset to those with records in all four datasets. We assessed each state, reporting the number of episodes by calendar year, stratified by demographic information, and calculated total percentage-wise increases in number of episodes in the study period, and average episodes per person per year, for each health setting. We calculated annual standardized state population rates per 1000 people by age-group using the respective state age-specific resident population as denominators (ABS, 2023), and evaluated their trends using Joinpoint regression models to determine Average Annual Percent Change (AAPC) in rates and 95% confidence intervals (CI) over time (Kim et al., 2000). Significance of trend was indicated when CIs did not include zero. All analyses were conducted using SAS software version 9.4 (SAS Institute Inc) and Joinpoint Regression Programme, Version 5.0.2 (Statistical Research and Applications Branch, National Cancer Institute).
Results
Total population
Across the three states in 2010–2019, there were 31,629 people with an ED presenting to and accessing various health services:13,804 in NSW, 8083 in QLD and 9742 in VIC. The most common of all contacts, for over half of each cohort, was for mental health ambulatory care services (NSW: 54%, QLD: 60%; VIC: 66% of people) (Figure 1A–C). A similar proportion of individuals in all states presented to public (~51%) and private hospitals (~22%), and a similar proportion (7–8%) used both public and private hospitals, but a higher rate of people with EDs presented to the emergency department in QLD (33%) and VIC (30%) compared to NSW (20%).
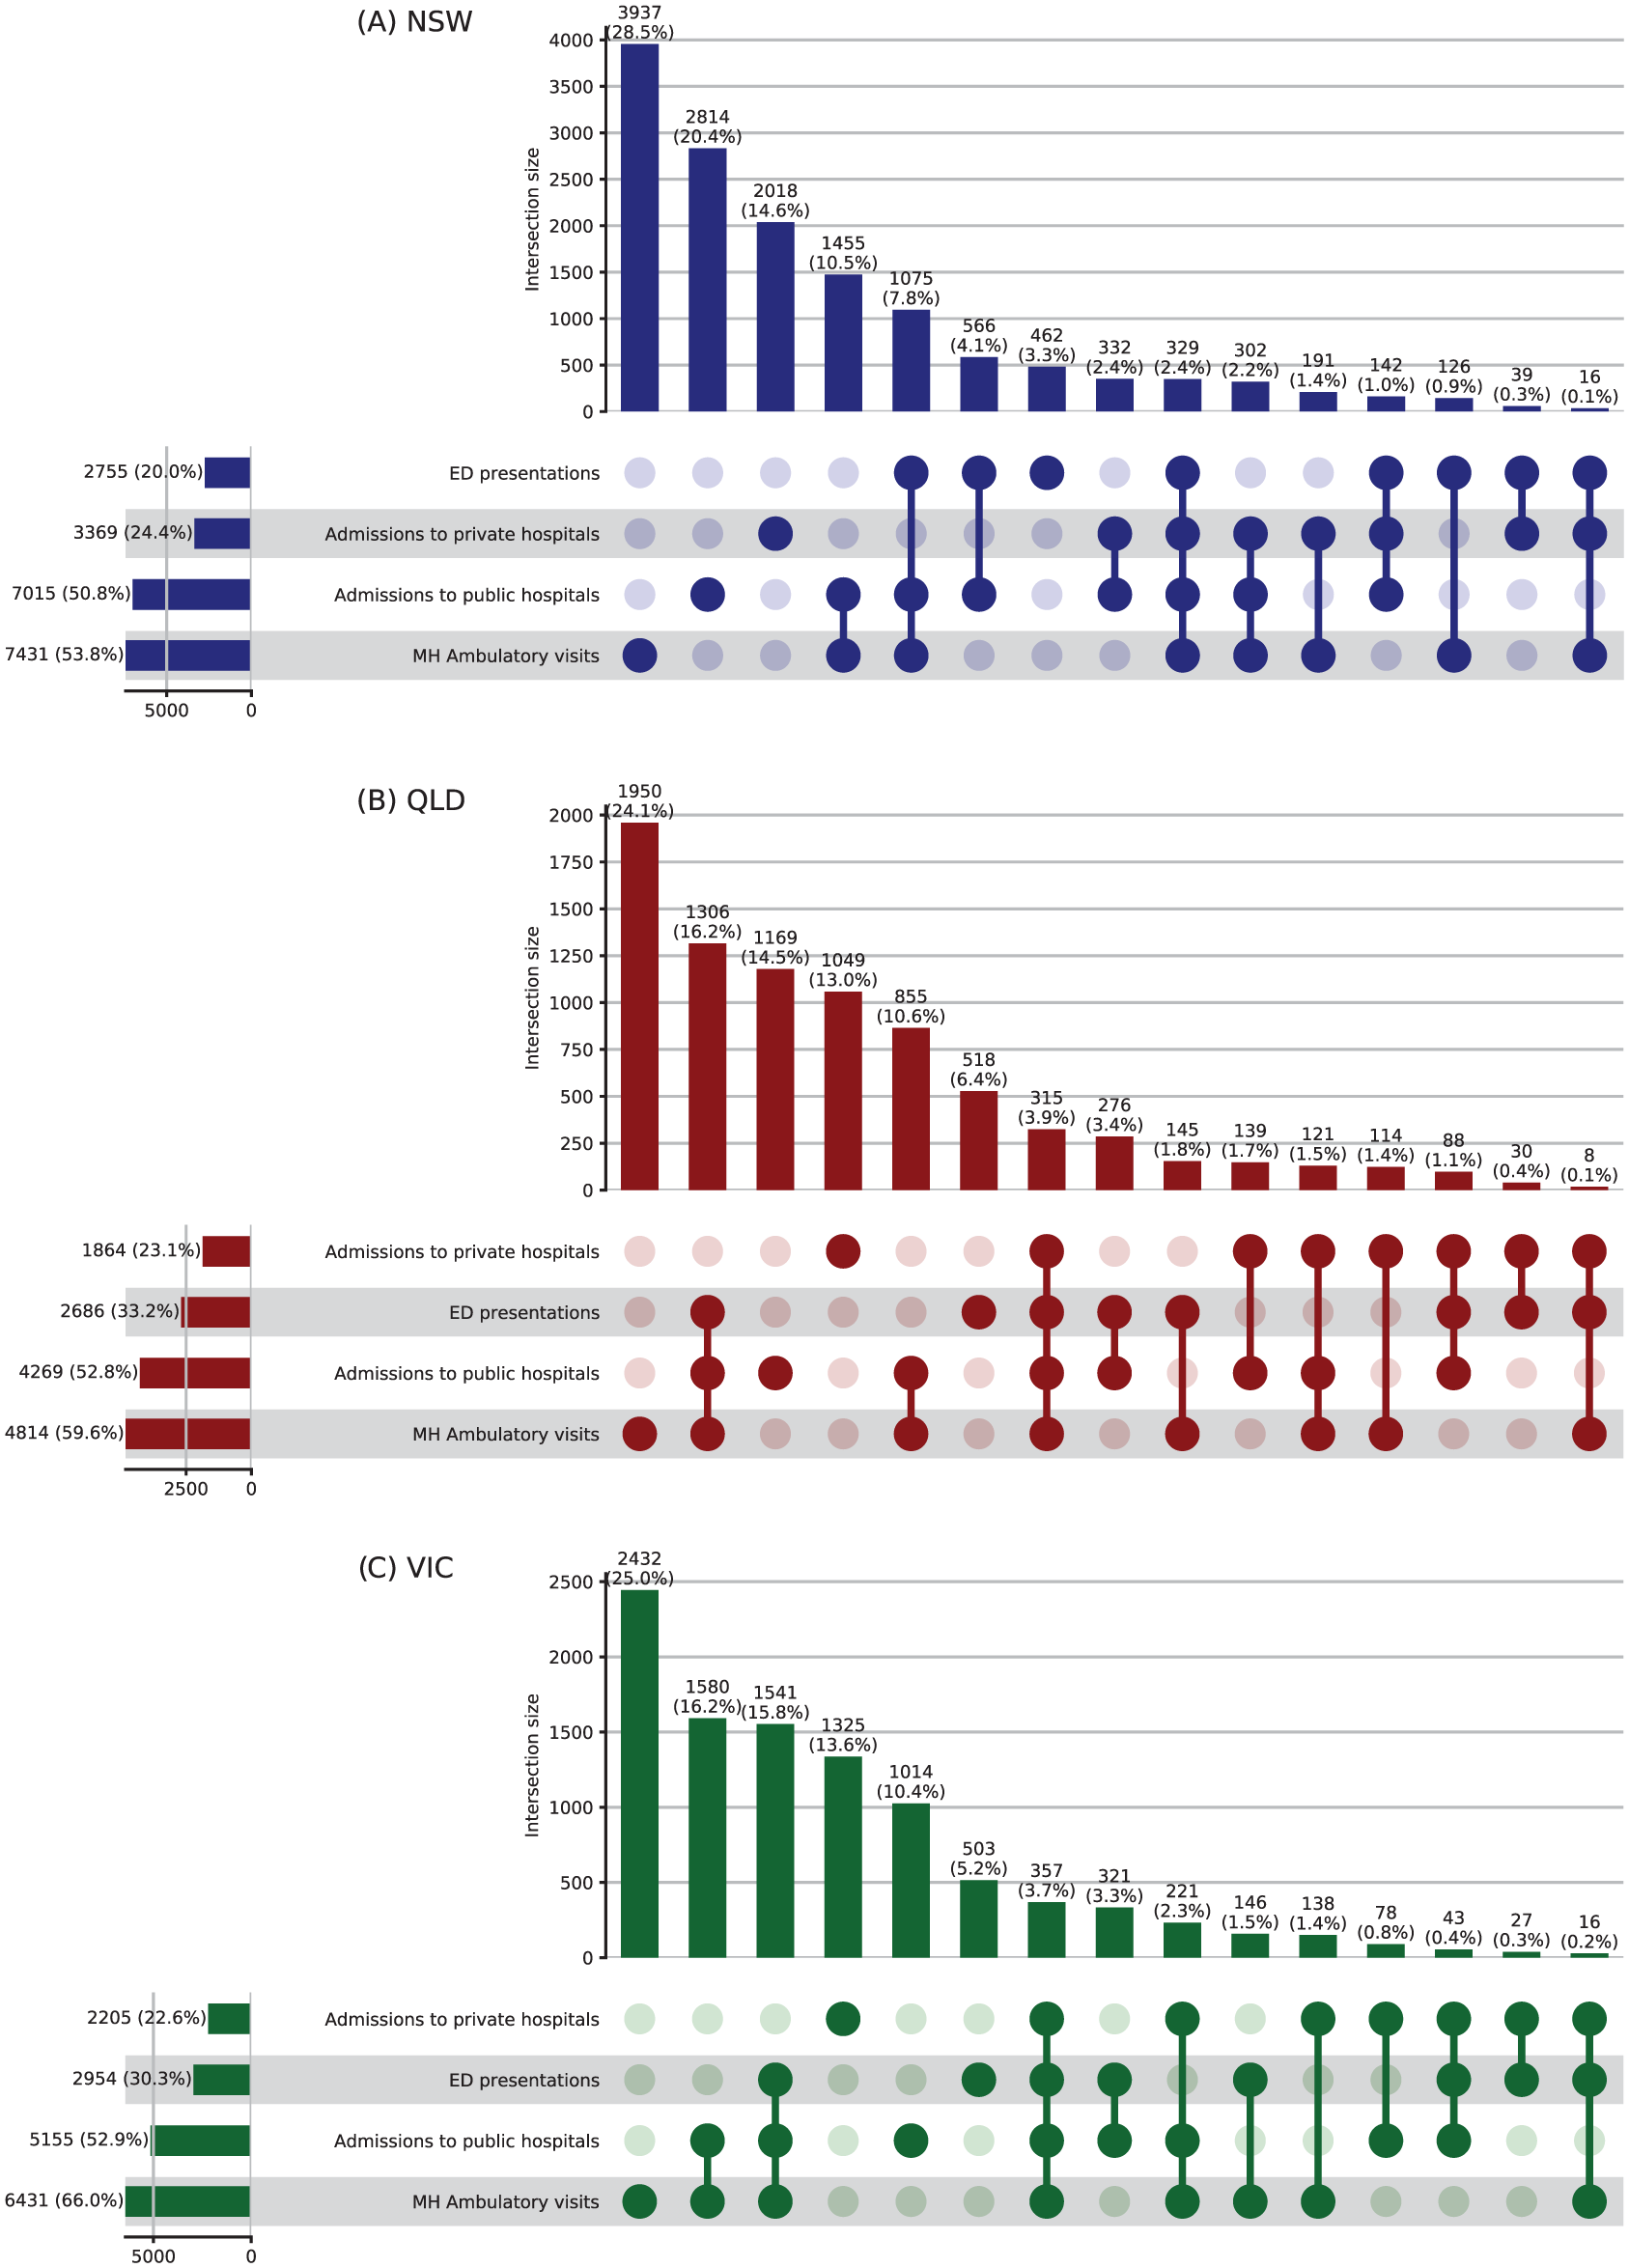
Upset plot representing number of people with eating disorders presenting to and accessing health services across various health data collections in New South Wales (NSW) (A), Queensland (QLD) (B) & Victoria (VIC) (C).
The majority of people identified were female (over 88% in all states) and living in metropolitan areas. People under 18 years old at the time of identification accounted for around 40% of the cohort across states (Table 1). The number of people with an ED diagnosis accessing health services increased in all states over the period, and increases were more pronounced in younger people. In NSW, total people accessing services rose 60% from 2228 in 2010 to 3566 in 2019, with an increase of 70% in 12- to 17-year-olds and more than doubled in those aged <12 years (Supplementary Table 3). In QLD, total people accessing services showed an almost 3-fold increase from 998 people in 2010 to 2840 in 2019, with the highest increases in people younger than 18 years and for those aged over 50 (Supplementary Table 3). In VIC, total people accessing services doubled from 1518 per year in 2010 to 3020 in 2019, with the greatest rises observed in <12-year-olds and 12- to 15-year-olds (Supplementary Table 3).
Characteristics of people identified with an eating disorder diagnosis in New South Wales (NSW), Queensland (QLD) and Victoria (VIC), Australia in 2010–2019 at their index episode (N = 31,629).
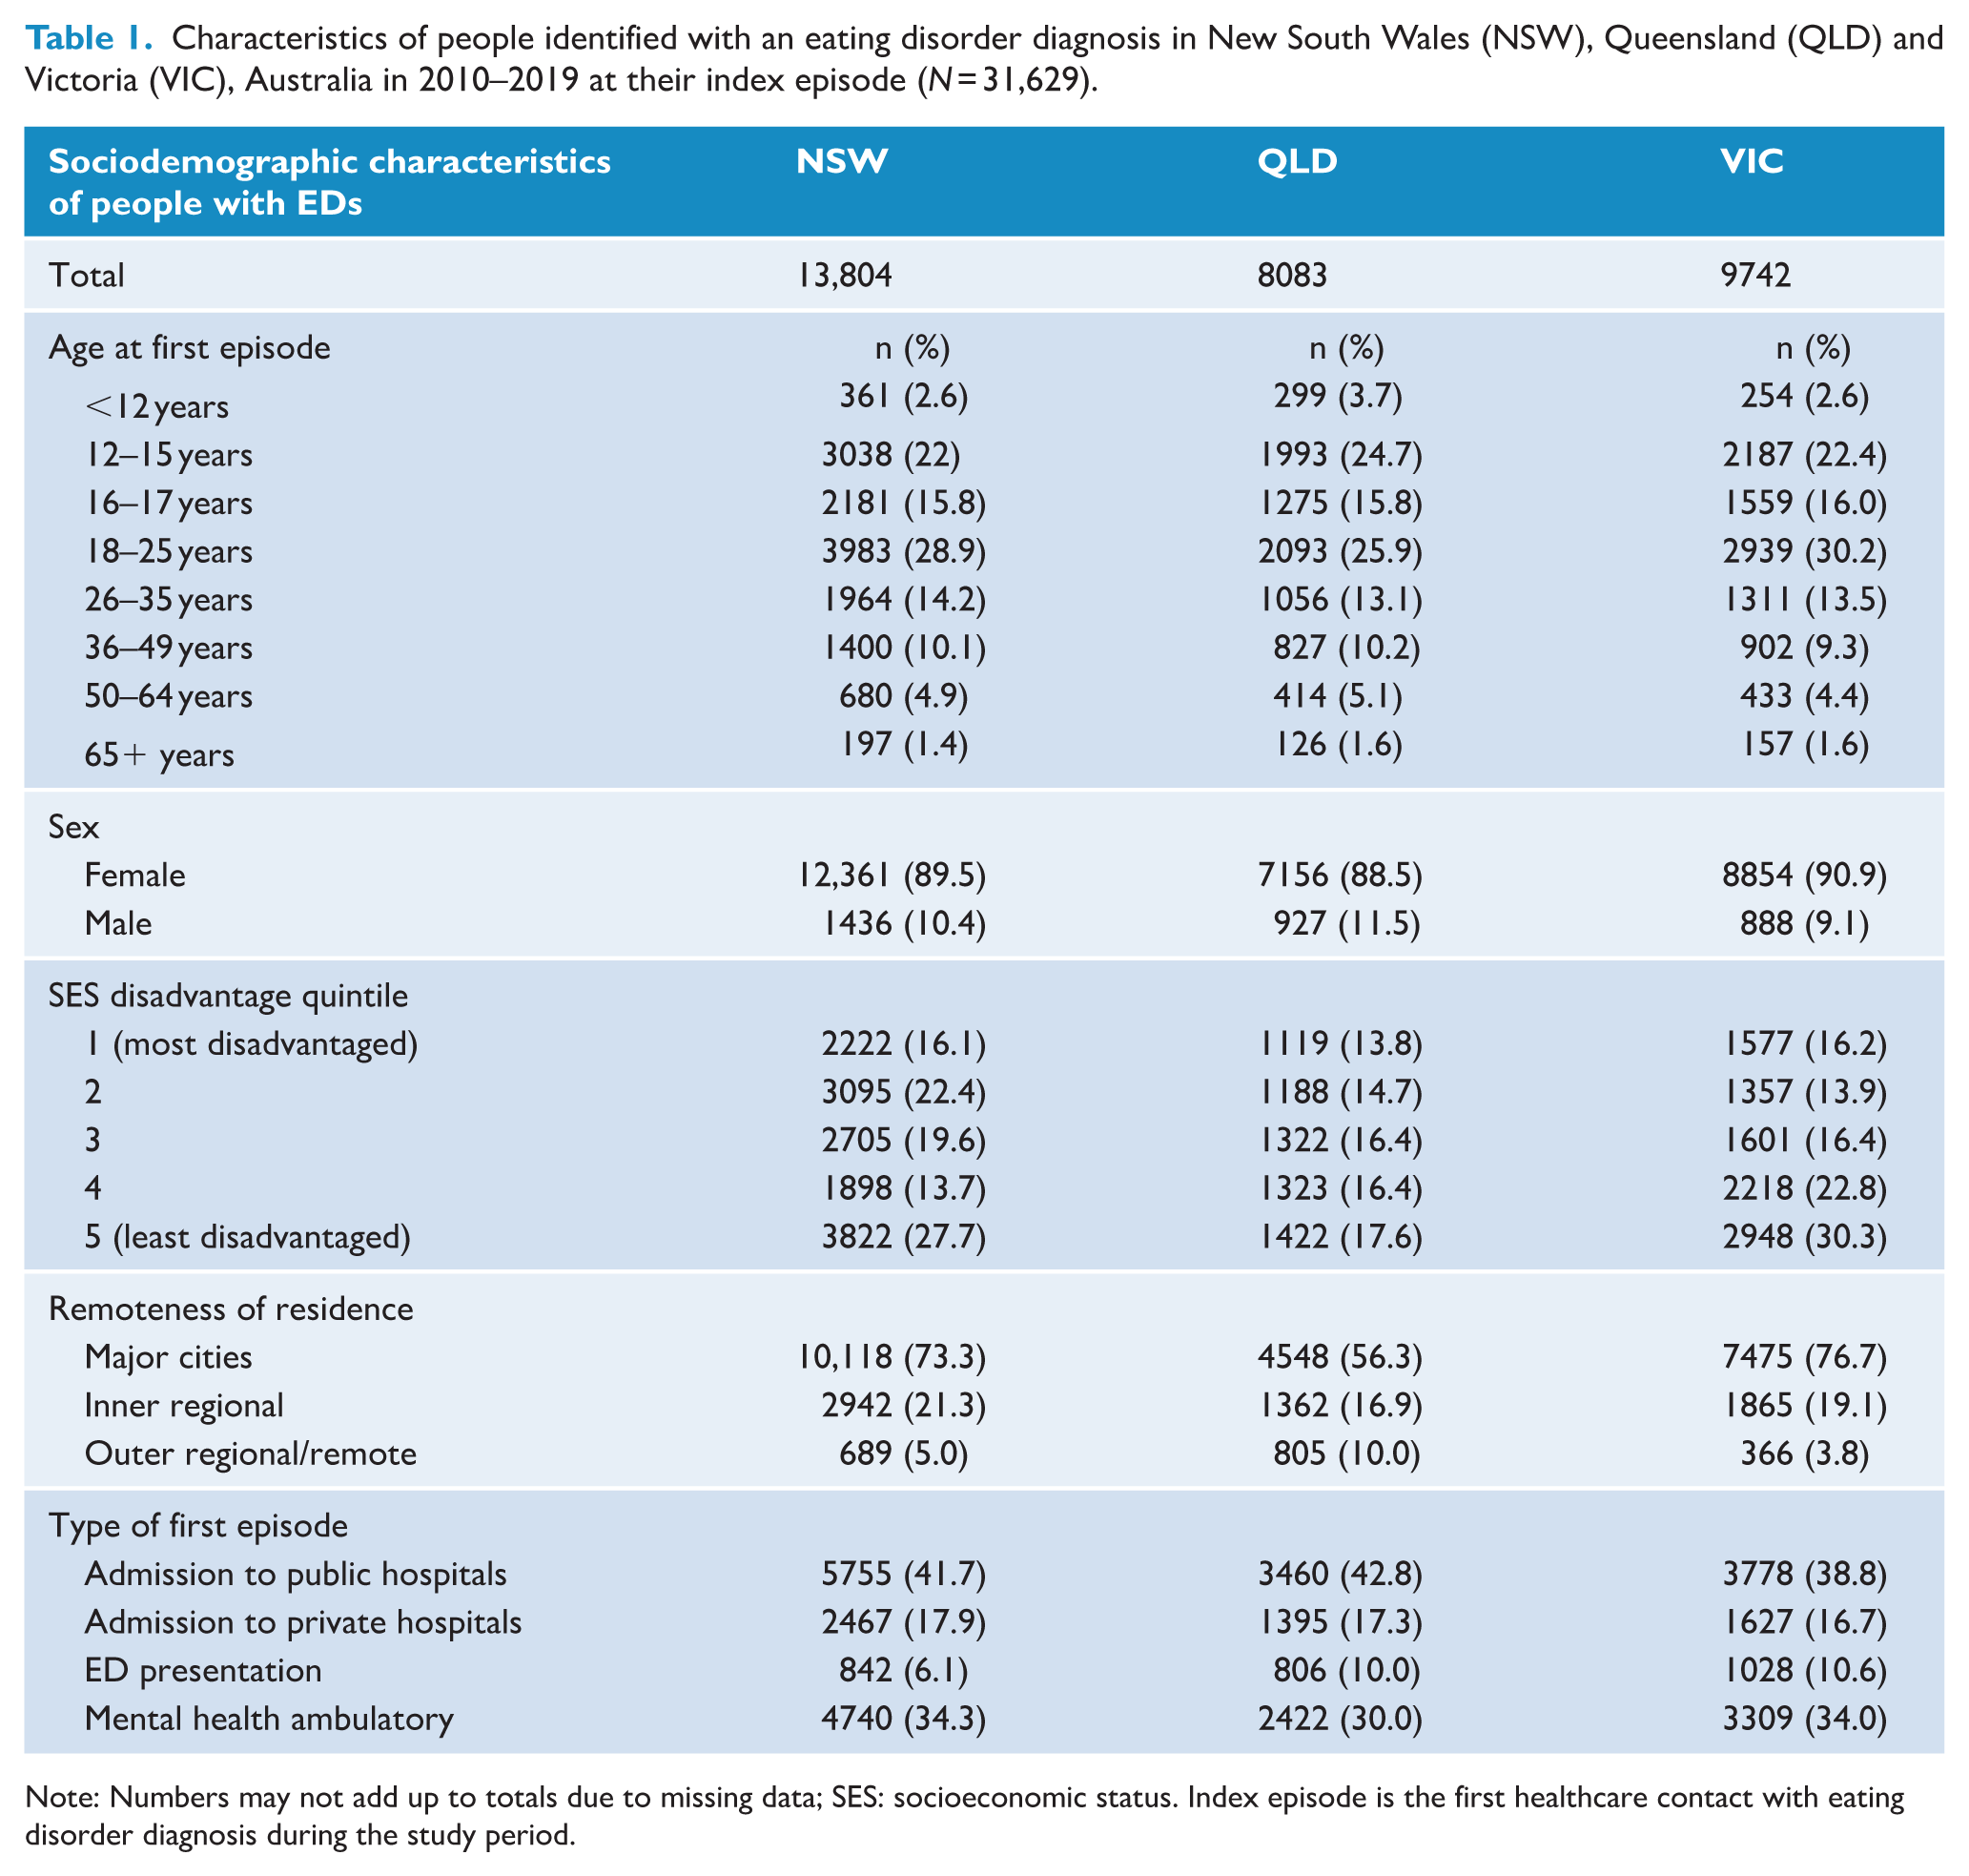
Note: Numbers may not add up to totals due to missing data; SES: socioeconomic status. Index episode is the first healthcare contact with eating disorder diagnosis during the study period.
Total episodes
Total episodes of care for people with EDs across all health settings was 603,680 in NSW, 430,658 in QLD and 430,668 in VIC. In all states, three-quarters of episodes were mental health ambulatory services (in days), and the most common age group was 18- to 25-year-olds with around one-third of the total (Figure 2, Supplementary Tables 4-A, B, C). Total episodes per calendar year increased 153% in NSW, 361% in QLD and 116% in VIC between 2010 and 2019. The rise in episodes of care was most steep for young people. In NSW, episodes of care increased 340% for <12-year-olds and 232% for 16- to 17-year-olds, and in QLD, 489% for <12-year-olds, and 448% for 12- to 15-year-olds (Figure 2, Supplementary Tables 4-A, B, C).
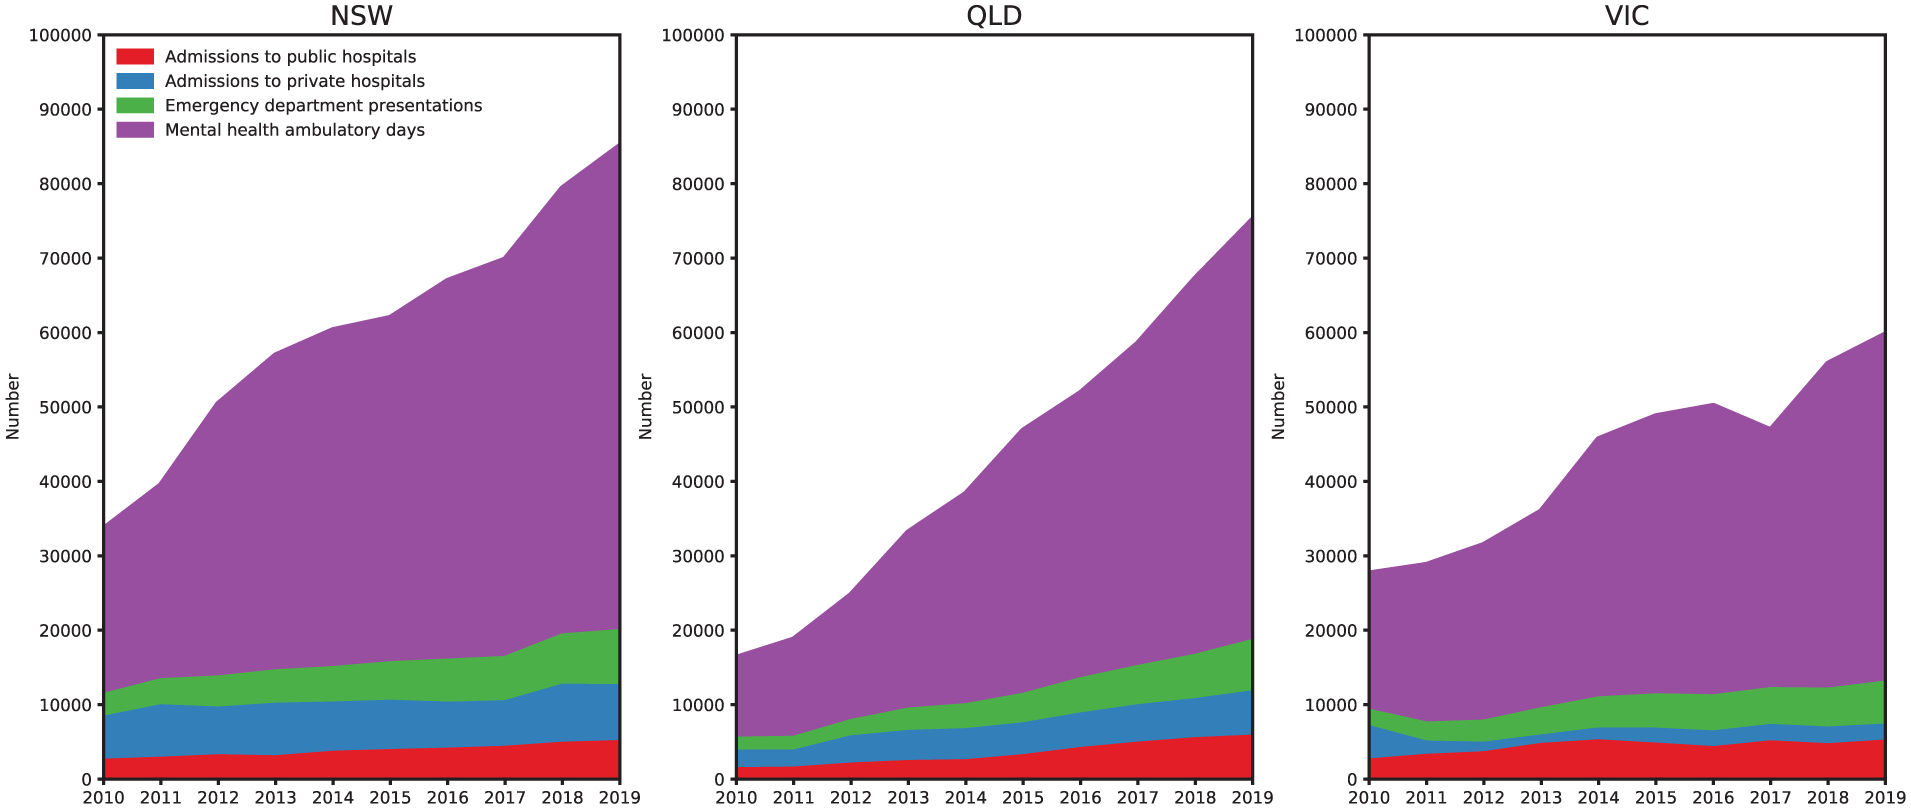
Total episodes of care by service setting in NSW, QLD and VIC 2010–2019.
There was an increase in population rates of most types of episodes of care and age groups for all three states between 2010 and 2019 (Figure 3, Supplementary Table 2). Rates were highest in the 16- to 17-year age group for all states, followed by 18–25 years and 12–15 years of age. Younger age groups <18 years had a higher AAPC compared to older groups and were highest in QLD, ranging between 20.5% and 21.3% across age bands compared with 11.1% to 14.2% in NSW and 7.4% to 9.4% in VIC (Supplementary Table 1). Rates and trends on all episodes were largely driven by mental health ambulatory days due to their relatively large numbers, compared to hospital-based episodes.
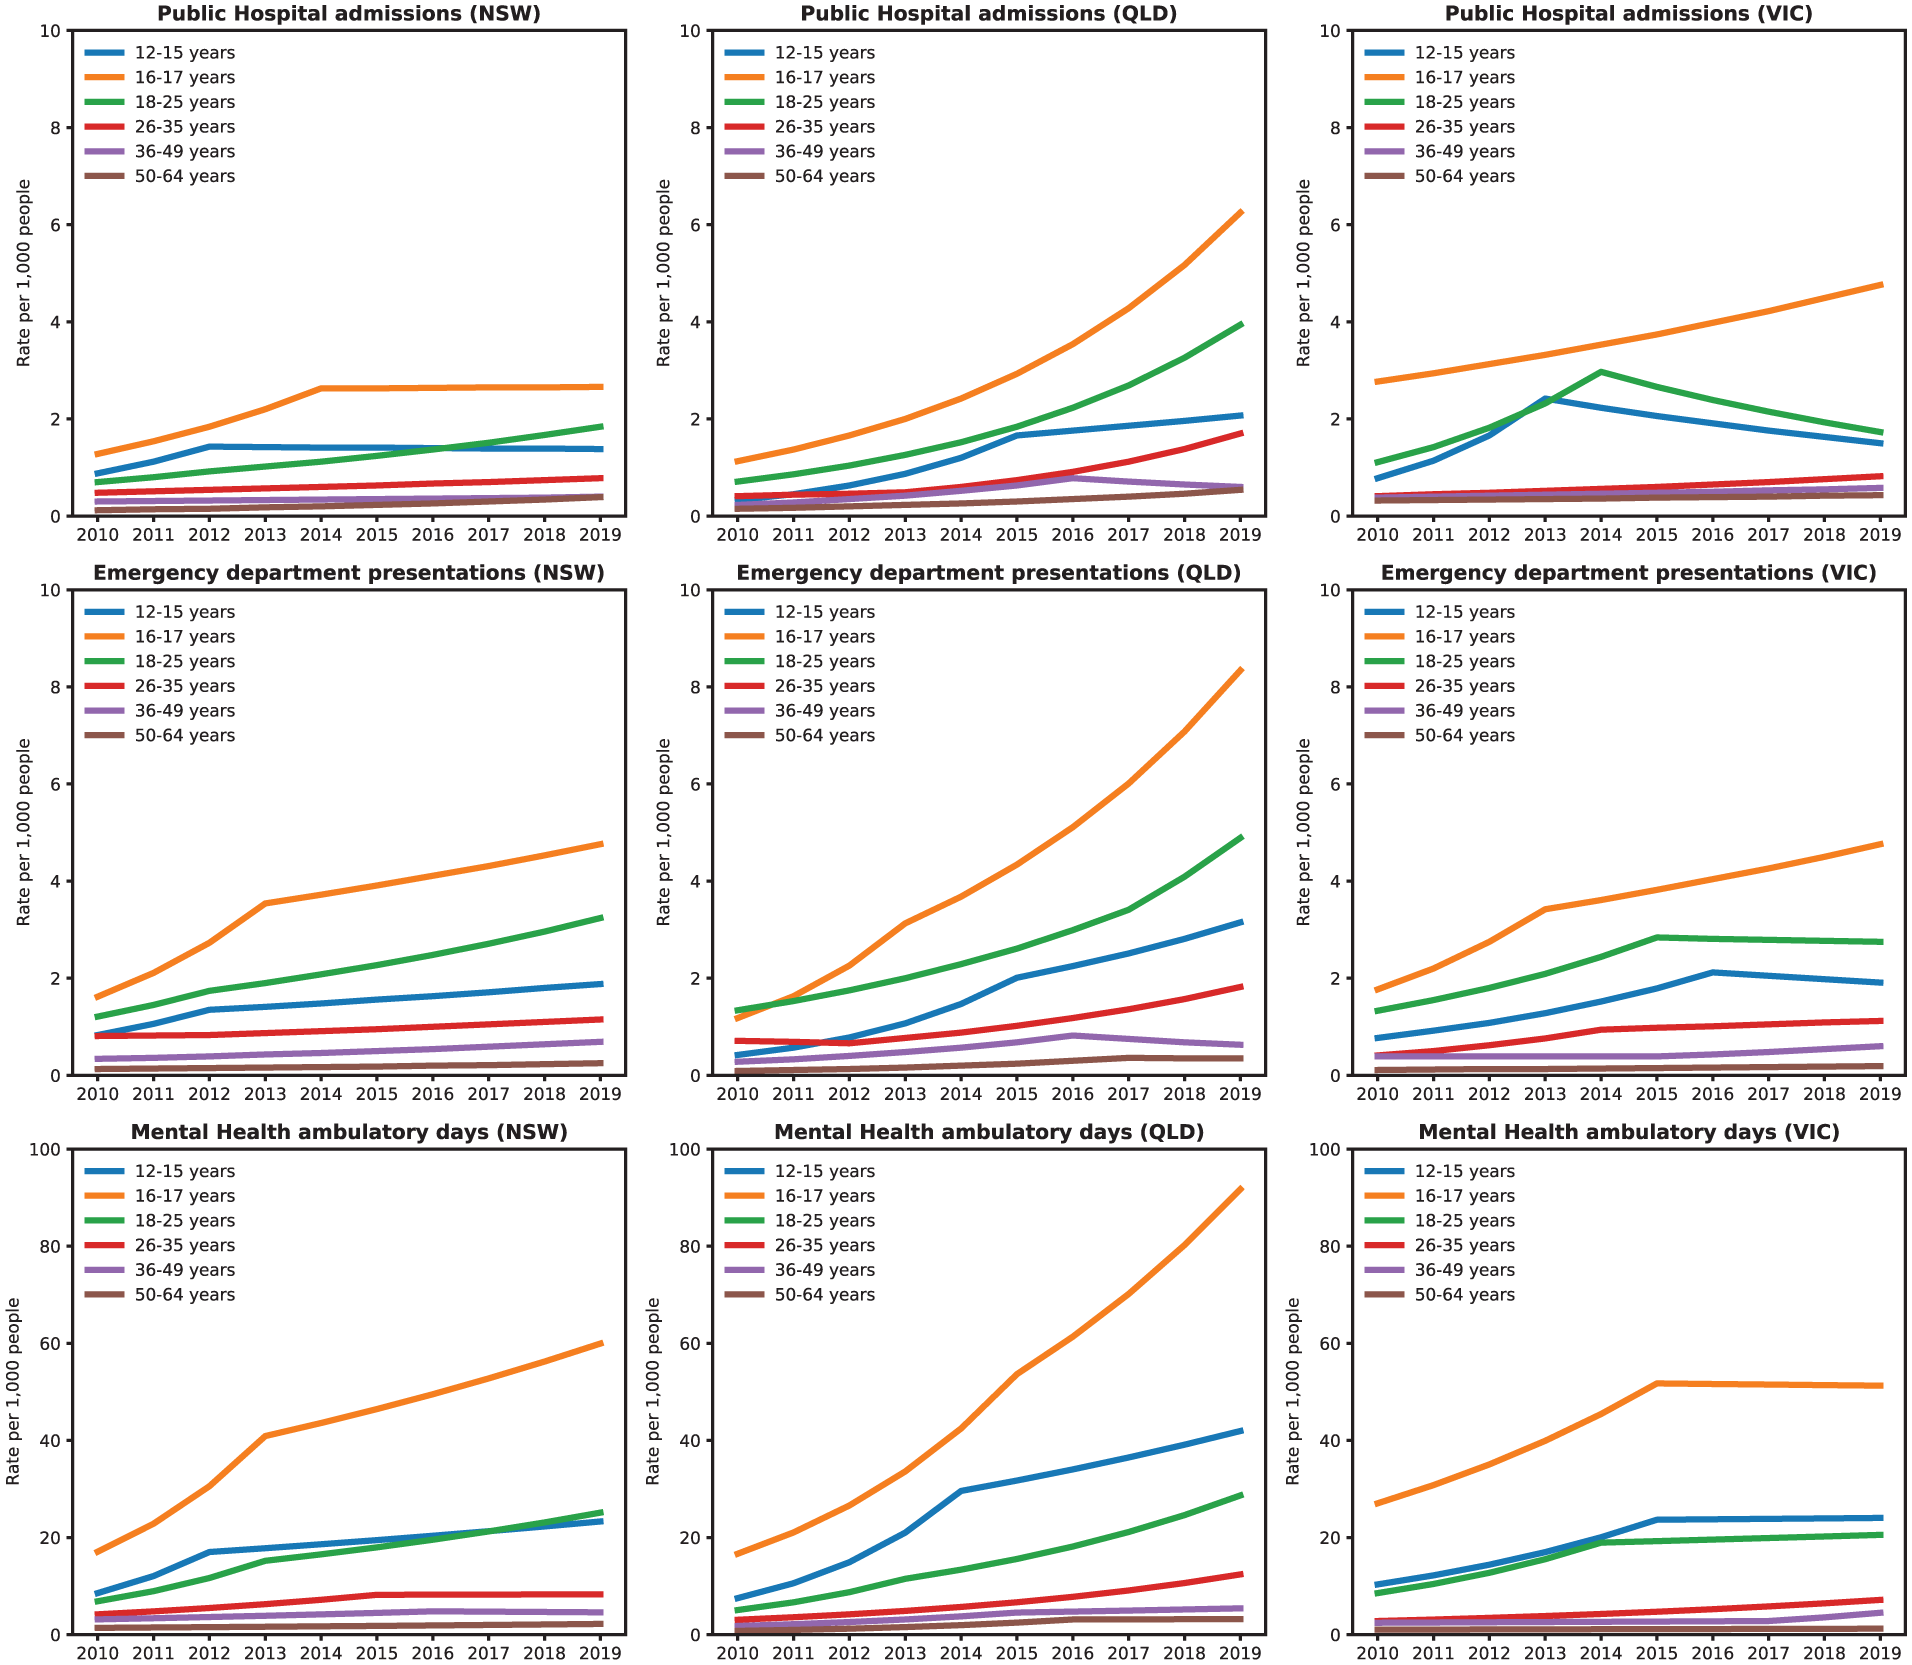
Episodes of care per 1000 population by age group, by service setting, 2010–2019.
Hospital admissions
Total hospital admissions by people with an ED diagnosis over the period in both public and private hospitals were 102,132 in NSW, 72,620 in QLD and 61,675 in VIC. In all states, most hospital admissions were for people living in major cities (85%, 81% and 83%, respectively), with an over-representation from the least socioeconomic disadvantaged quintile (40%, 33% and 37%). In all states, the majority of people were admitted with a mental health-related primary diagnosis (77%, 72% and 63%) (Supplementary Tables 5 & 6 A, B, C).
In NSW and QLD only, the proportion of admissions to private hospitals were higher than to public hospitals, with a ratio of 57–66% private to 34–43% public. For public hospital admissions, approximately half (50–55%) involved the emergency department, and across both public and private admissions an ED diagnosis was recorded in half of cases (46–55%). In NSW and QLD only, admission rates for both public and private hospitals showed more steep increases for males than females. The average number of admissions per person per year was consistently higher for private compared with public hospitals. Over the period 2010 to 2019, the average annual number of private hospital admissions per person decreased from 9.4 to 7.8 in NSW but increased from 6.9 to 8.3 in QLD. In comparison, the average annual number of public hospital admissions per person showed a slight increase from 2.5 to 2.9 in NSW and 2.3 to 3.6 in QLD (Supplementary Tables 5 & 6-A, B, C).
Population rates of public hospital admissions were highest over the study period for people aged 16–17 years and increased throughout the study period for QLD and to a lesser extent VIC, while plateauing in NSW from around 2014. In 2019, rates of admission were 6.3, 4.8 and 2.7 per 1000 population in QLD, VIC and NSW, respectively (Figure 3, Supplementary Table 2). The largest annual increase in rates of admissions to public hospitals were observed in QLD with increases between 21% and 23% across age groups for people aged ⩽ 25 years (Supplementary Table 1).
Emergency department presentations
Total presentations to a hospital emergency department by people with an ED diagnosis over the period were 51,068 in NSW, 38,922 in QLD, and 40,972 in VIC. In all states, the largest proportion of presentations was for females (92%), 18- to 25-year-olds (36%, 37% and 39%, respectively), people residing in major cities (70%, 68% and 77%), with presentations evenly distributed across socioeconomic quintiles (Supplementary Tables 7-A, B, C). In NSW and VIC, total number of emergency presentations more than doubled over the period and rose by 300% in QLD. Increases in presentations were observed across all age groups in all states but was most pronounced for 12- to 17-year-olds with presentations increasing by 583% in QLD (Supplementary Table 7-A, B, C). Over the period 2010 to 2019, the average annual number of emergency department presentations per person increased from 2.6 to 3.3 in NSW, from 3 to 3.6 in QLD and from 2.8 to 3.2 in VIC. Across all states, the largest proportion (43–53%) of emergency department presentations were classified as urgent, and these also had the greatest increases over time. The proportion of emergency department presentations where an ED diagnosis was recorded was low (NSW: 6.5%, QLD: 13.2% and VIC: 12%; Supplementary Tables 7-A, B, C). Population rates of emergency department presentations were the highest for young people in the 16–17 years and 18–25 years age groups with rates in 2019 ranging from 3.2 per 1000 people (NSW 18–25 years) to 8.3 per 1000 people (QLD 16–17 years; Figure 3, Supplementary Tables 1&2).
Mental health ambulatory services
There were a total of 1,097,671 days including a mental health ambulatory service contact for a person with an ED recorded across the three states between 2010 and 2019. Total days of contact by calendar year more than doubled in VIC (152%), almost tripled in NSW (191%) and increased by 415% in QLD over the period (Figure 2, Supplementary Tables 8-A, B, C). Across states, almost a third of days of contact (25–35%) were for people aged 18–25 years, for females (88–91%), the majority (65–76%) for people residing in major cities and more than a quarter for people residing in the least disadvantaged areas (Quintile 1: 26%). One-third of days of contact had an ED diagnosis recorded. Days of contact with ambulatory services in NSW and QLD increased from an average of 16–20 days per year respectively in 2010 to 26–33 days in 2019 but was steadier in VIC with an increase from 20 to 23 days. Days of mental health service contact for individuals in the ⩽25 years age groups showed the largest increases (Supplementary Table 8-A, B, C). Population rates of ambulatory mental health care were highest for 16- to 17-year-olds in all states: 51.3–91.7 per 1000 people in 2019 (Supplementary Table 2). Increases in rates were observed in all states across all age groups ⩽25-years (Figure 3, Supplementary Table 1).
Discussion
This retrospective cohort data linkage study provides information on healthcare utilization and trends in health service use for people with eating disorders (EDs) in NSW, QLD and VIC. Across states, there is a clear pattern of increased service use by people with EDs across all health services, consistent with healthcare utilization studies in the United Kingdom, Canada and United States (Demmler et al., 2020; de Oliveira et al., 2017; Striegel-Moore et al., 2008). In all states, the increases in health service use were highest for young people, and over 40% of the people identified with an ED were under 18 years old. The steepest increases in episodes of care across service settings occurred in the 16- and 17-year-old group. The peak age of onset for eating disorders is at around 16 years, but this 16- to 17-year-old group is also of critical importance in an Australian setting, where 16- to 17-year-olds may fall between paediatric and adult services in hospital settings, and can experience difficulties with access to, or transfer between, appropriate services. This study shows 16- to 17-year-olds have the highest population rates in episodes of care across all states−and the highest rates of emergency department presentations in QLD−highlighting that they urgently need our focused clinical attention and indicating they are a key target for policy and service delivery change.
Increases in episodes of care for people with EDs were driven by large increases in contacts with publicly funded community mental health services. These are outpatient services which deliver evidence-based psychological therapies in the community, provide essential step-down care after hospital treatment, and can facilitate step-up to higher levels of care if needed (Pehlivan et al., 2022). Community health contacts doubled in VIC, almost tripled in NSW, and increased 5-fold in QLD. Ambulatory mental health services were the most common setting for ED care in all states, displaying similar rates to health utilization data from Italy, where more than two-thirds of ED patients are seen in community mental health services (Piazza et al., 2016). Ambulatory service data also appear consistent with European multi-centre data which show pathways to specialist ED care most commonly start with community mental health professionals (Monteleone et al., 2023). Population rates for community mental health contacts were highest in 16- to 17-year-olds across all states. Rises in outpatient setting episodes of care may be partially accounted for by positive aspects of service change such as increased awareness of ED risk-factors leading to increases in diagnosis, reduction in stigma leading to higher help-seeking behaviour, and improvements in availability or uptake of services (Hay et al., 2023; Holland et al., 2016). Average days of mental health ambulatory contact per person per year rose significantly over the 10-year period in NSW and QLD, but not in VIC. Days of contact per year in NSW at the beginning of the period were fewer than the 20-sessions needed for empirically supported psychological treatment (similar to levels in US utilisation data; Striegel-Moore et al., 2000), but rose to be adequate. Days of contacts per person per year in QLD rose to be above that of the other states; to a level more consistent with clinical practice guidelines for ED treatment which indicate multidisciplinary care− medical, psychological, and dietetic−is needed (Hay et al., 2014), and indicating improvements in service capacity and access to care.
Public hospital admissions for people with EDs doubled in NSW and VIC and tripled in QLD over the period. The largest proportion of hospitalisations were for young adults 18–25 years, but population rate data show steep increases in rates of admissions for under-18-year-olds, most markedly in QLD. Hospital admissions for males increased at a higher rate than females in NSW and QLD, with public hospital admissions for males in QLD showing a 6-fold increase over the period. Inpatient treatments are likely to be reserved for individuals with severe malnutrition and predominantly serve a role in medical re-stabilization. Increases in hospitalization suggest increases in clinical severity in the community, but may also be partially attributable to the positive effects of service change, as all three states have undertaken programmes of work across the period aimed at increasing treatment options for people with eating disorders. Another potential explanation for some of the increase in admissions may be changes in hospital policies to promote shorter stays for medical stabilization which account for the possibility of planned re-admissions (Herpertz-Dahlmann, 2021; Madden et al., 2015).
Limitations in access to tertiary public hospitals for specialty ED care increases usage of private services, and in NSW and QLD the proportion of total admissions to private hospitals was higher than to public hospitals. The higher private admissions may in part be due to admission procedures tailored to meet private health rebate requirements, where payments decrease after several weeks in private care. This provides an incentive to providers to discharge and then readmit if needed, inflating overall number of admissions.
Presentations to emergency departments also doubled in all states over the period, with the greatest increases observed for presentations in the most urgent triage categories. These data provide further evidence of increasing clinical severity of EDs in the community. Of particular concern, emergency department presentations in QLD rose almost 6-fold for both 12- to 15- and 16- to 17-year-old age-groups. Of note, the steepest increases were for 12- to 15-year-olds, consistent with data for young people in Canada (Couturier et al., 2023). EDs can cause a range of serious medical complications that require emergency care, however, service-related issues such as waitlists for community services may also lead to increased emergency department presentations. Conversely, service improvements such as increased access to care or improved identification of EDs may lead to increased demand in other parts of the health system. But if timely access to appropriate step-up services (e.g. from GP to specialist outpatient services) or step-down options (e.g. from inpatient admission to local community services) are not available, the emergency department may become the only option. Understanding how we can best strengthen our community services to provide access to care that is effective and sufficient to prevent downstream service impacts is of critical importance to reduce emergency department contacts.
All Australian states are looking for ways to reduce pressure on their emergency departments (ACEM, 2022). But understanding whether some emergency presentations by people with EDs are possibly preventable is difficult due to the limited amount of diagnostic information recorded in this setting (Sara and Wu, 2023). Across all states, only 1 in 10 emergency department presentations in our cohort had an ED diagnosis recorded. This is due to information for emergency department patients being coded by their acute presenting problem, which in most cases is secondary to their ED. Medical coding is critical to public health surveillance efforts to better understand both person and system factors associated with emergency department use by people with EDs (Redekopp et al., 2022).
Despite the lack of detail on EDs, the current data shows an increase in overall emergency department presentations, severity of triage category and contact with other health services for ED. This finding suggests that primary and community care may not have been adequate for the individual and that there may be a lack of evidence-based treatments and consistent standards of care for individuals with EDs in the community (Kaye and Bulik, 2021). Further research to understand drivers for the observed increase in demand for ED services in younger cohorts in Australia – including individual, economic, social and technological factors – is needed. More consistent recording or additional fields to capture EDs in our emergency departments could also provide evidence for increased resources and development of evidence-based guidelines for their care, and the funding to implement and sustain these changes (de Oliveira et al., 2023).
Strengths and limitations
The primary strengths of this study are the multi-cohort approach which achieved coverage of three-quarters of the Australian population, analysis of linked administrative health data sets across multiple states and health service settings including private hospitals, the relatively long analysis period of 10 years, and assessment of rates over time not widely utilized in previous studies of EDs (Reas and Rø, 2018; Steinhausen and Jensen, 2015). Private hospitalizations are included to provide the most complete picture of inpatient treatment as possible, but private sector reporting is institution-dependent and reporting may differ compared to public services. Consistent with ED prevalence rates by sex, females comprised the majority of cases identified, with males representing few cases. However, most of the previous data for EDs among males in Australia has been derived from self-report surveys, with this study providing one of the first population-level data of the rate of EDs among males over an extended period.
One of the main limitations of the study is the lack of data from other healthcare settings, including contacts with primary care and private mental health care services, which result in the underestimation of rates of people with EDs accessing healthcare services. While data in these settings are few, an Australian study reported eating disorders were managed in less than 1% of general practice encounters between 2000 and 2016 (Ivancic et al., 2021), and similarly low rates have been reported in the United Kingdom (Demmler et al., 2020). Our estimates of EDs based on administrative health data are also consistently lower than self-report data from community surveys as the latter are based on people living with EDs, while our data are based on those receiving treatment (Reas and Rø, 2018; Striegel-Moore et al., 2008). Incident cases were also not identified as we could not be certain that people presented for the first time during the study period. Identification of co-occurring conditions was also outside the scope of this study and limited the interpretation of the data regarding drivers for care. Further, not all states and territories data were included in the study. Nevertheless, the current data included the three most populous states in Australia representing over three-quarters of the Australian population and included populations from non-metropolitan settings. Finally, the data does not include health care usage in the COVID-19 pandemic period, where short term analyses of service usage among individuals with EDs indicated an ongoing increase in rates (Madigan et al., 2024; Toulany et al., 2022). Thus, this study clearly demonstrates that sharp increases in service usage across public health settings by people with EDs were well-underway prior to the pandemic.
Conclusion
This study demonstrates substantial increases in the rates of health service use for people with eating disorders (EDs) in Australia between 2010 and 2019. Overall, the increases in service contacts across healthcare settings were driven by large increases in episodes of public outpatient community care over the period. However, sharp increases in rates of hospital admissions and emergency department presentations triaged at the most urgent levels were observed, broadly indicating increasing severity of ED cases in our communities. Across all states, these increases in health service use were highest for young people. Population rate data demonstrate the steepest increases in the age groups investigated were for 16- to 17-year-olds. These significant increases in healthcare utilization for EDs in Australia further highlight the importance of strengthening the health system to ensure timely access to evidence-based care to improve outcomes for individuals with EDs, and their carers and supports.
Supplemental Material
sj-docx-1-anp-10.1177_00048674251379236 – Supplemental material for Healthcare utilization for eating disorders in Australia: 10 years of health data linkage
Supplemental material, sj-docx-1-anp-10.1177_00048674251379236 for Healthcare utilization for eating disorders in Australia: 10 years of health data linkage by Kelly M Dann, Francisco J Schneuer, Jane Miskovic-Wheatley, Michelle Cunich, Moin Ahmed, Morgan Sidari, Grant Sara, Kristi R Griffiths, Janice Russell, Stephen Touyz, Sloane Madden, Claire Diffey, Tania Withington, Michelle Roberton, Warren Ward, Amy Hannigan, Natasha Nassar and Sarah Maguire in Australian & New Zealand Journal of Psychiatry
Footnotes
Acknowledgements
The authors gratefully acknowledge the traditional owners of the lands on which we live, learn, teach, research, and write from across the nation. We pay our respects to elders past and present and future and recognize that Aboriginal and Torres Strait Islander Peoples are Australia’s first storytellers, artists, communities and creators of culture. We recognize their continuing connection to the land and waters and acknowledge that they never ceded sovereignty. We acknowledge the individual and collective expertise of those with a living or lived experience of eating disorders, disordered eating and mental health challenges, and their families, carers and supports. We recognize their vital contribution at all levels and value the courage of those who share their unique perspective for research, learning and growing together to achieve better outcomes for all. Data were provided by the NSW Ministry of Health, Queensland Health and Victorian Department of Health. Record linkage was conducted by the NSW Centre for Health Record Linkage, Queensland Statistical Services Branch, and Victorian Centre for data Linkage. De-identified linked data was stored by each state data linkage unit and secure access was provided to researchers through the Sax Institute's Secure Unified Research Environment (SURE). Open access publishing facilitated by The University of Sydney via the Council of Australian University Librarians
Author contributions
K.D.: Writing – original draft, Writing – review & editing; F.S.: Data curation, Formal Analysis, Investigation, Methodology, Visualization, Writing – original draft; J.M.W.: Funding acquisition, Project administration, Writing – review & editing; M.C.: Funding acquisition, Writing – review & editing; M.A.: Writing – review & editing; M.S.: Writing – review & editing; G.S.: Writing – review & editing; K.G.: Writing – review & editing; J.R.: Funding acquisition, Writing – review & editing; S.T.: Funding acquisition, Writing – review & editing; S.M.: Funding acquisition, Writing – review & editing; C.D.: Funding acquisition, Writing – review & editing; M.R.: Writing – review & editing; W.W.: Funding acquisition, Writing – review & editing; A.H.: Writing – review & editing; N.N.: Conceptualization, Funding acquisition, Methodology, Project administration, Supervision, Writing – review & editing; S.M.: Conceptualization, Funding acquisition, Project administration, Supervision, Writing – review & editing.
Declaration of conflicting interests
The authors declared no potential conflicts of interest with respect to the research, authorship and/or publication of this article.
Ethical approval and informed consent statement
This study was approved by the NSW Population and Health Service Research Ethics Committee (2019/ETH13195) and approval for QLD and VIC components was attained under the National Mutual Acceptance Initiative. Ethical approval included a waiver of informed consent and thus individual consent was not necessary to obtain.
Funding
The authors disclosed receipt of the following financial support for the research, authorship and/or publication of this article: This research conducted within Mainstream: The Australian Centre for Health System Research and Translation in Eating Disorders [mainstreamresearch.org.au] was funded by a National Health and Medical Research Council Medical Research (NHMRC) Future Fund Million Minds Mission Grant (APP1178922). NN was funded by an NHMRC Investigator Grant (APP1197940) and the Financial Markets Foundation for Children.
ORCID iDs
Data availability statement
Direct access to the data and analytical files to other individuals or authorities is not permitted without the express permission of the approving human research ethics committees and data custodians.
Supplemental material
Supplemental material for this article is available online.
References
Supplementary Material
Please find the following supplemental material available below.
For Open Access articles published under a Creative Commons License, all supplemental material carries the same license as the article it is associated with.
For non-Open Access articles published, all supplemental material carries a non-exclusive license, and permission requests for re-use of supplemental material or any part of supplemental material shall be sent directly to the copyright owner as specified in the copyright notice associated with the article.