
Abstract
Objective:
There is a dearth of longitudinal data on outcomes in prevalent cases of psychotic illness across a range of ages and levels of chronicity. Our aim was to describe changes over time in mental and physical health outcomes, as well as patterns of service utilisation that may have influenced outcomes, in a representative prevalence sample of 641 Western Australians with a psychotic illness who, at Wave 1, were part of the National Survey of High Impact Psychosis.
Methods:
In Wave 1 (2010, 2012), a two-phase design was employed to ensure representativeness: Phase 1 psychosis screening took place in public mental health and non-government organisation services, while, in Phase 2, a randomised sample was interviewed. In Wave 2, 380/641 (59%) of participants were re-interviewed, with interviews staggered between 2013 and 2016 (follow-up time: 2.3–5.6 years). Data collection covered mental and physical health, functioning, cognition, social circumstances and service utilisation. Mental health outcomes were categorised as symptomatic, functional and personal recovery. Physical health outcomes covered metabolic syndrome and its component criteria.
Results:
In mental health, there were encouraging improvements in symptom profiles, variable change in functional recovery and some positive findings for personal recovery, but not quality of life. Participants ranked physical health second among challenges. Metabolic syndrome had increased significantly. While treatment for underlying cardiovascular risk conditions had improved, rates of intervention were still very low. More people were accessing general practices and more frequently, but there were sharp and significant declines in access to community rehabilitation, psychosocial interventions and case management.
Conclusion:
Although we observed some positive outcomes over time, the sharp decline in access to evidence-based interventions such as community rehabilitation, psychosocial interventions and case management is of great concern and augurs poorly for recovery-oriented practice. Changes in service utilisation appear to have influenced the patterns found.
Introduction
Key epidemiological indicators of disease dynamics include incidence, prevalence, remission/recovery and mortality: of these, remission/recovery is the most poorly understood (Jääskeläinen et al., 2013). In psychotic illness too, much remains to be learnt about recovery, a concept that has evolved to embrace different facets of longer term outcome. Most familiar are objective forms of recovery: symptomatic recovery, remission from symptoms and signs that are the key clinical features of the illness, and functional recovery, the ability to manage the activities of daily living such as self-care, work, chores, education (Leonhardt et al., 2020). However, in the past decade, there has been a growing focus, advocated by those with lived experience themselves, on personal recovery. Personal recovery has been variously conceptualised (Leucht and Lasser, 2006; Silverstein and Bellack, 2008) but is well captured by the following statement: ‘It is a way of living a satisfying, hopeful, and contributing life even with limitations caused by illness’ (Anthony, 1993). As such, it captures subjective aspects of recovery (Leonhardt et al., 2020).
There have been a number of excellent incident studies of schizophrenia and other psychotic disorders across different world regions (e.g. Harrison et al., 2001; Kotov et al., 2017; Morgan et al., 2014a) that have provided important insights into illness progression from the first episode. Nevertheless, the follow-up period for most of these studies has been relatively short. The study by Kotov and colleagues had a longer follow-up period than most (20 years). However, that length of time for an incident study is not long enough to reliably inform about outcomes in middle and older age: as people grow older, changes in mental and physical health and other circumstances will affect their recovery profiles. Follow-up studies of prevalent cases of psychotic illness have also been subject to limitations including non-representative sampling, selective recruitment (e.g. inpatients only; schizophrenia only; limited age ranges) and inadequate sample sizes (Jääskeläinen et al., 2013).
Our study builds on a rare opportunity to follow up a representative, unbiased sample of 641 prevalent cases of non-affective and affective psychotic illness. Wave 1 interviews took place in 2010–2013 when participants were aged 18–64 years and in contact with public treatment services. Wave 2 interviews took place in 2013–2016.
Our aim is to present the study methodology, describe overall changes over time in mental and physical health outcomes, challenges to recovery described from the participants’ perspective and patterns of service utilisation that may have influenced outcomes.
The naturalistic nature of the study design offers distinct advantages over a clinical trial by capturing the full range of people with psychotic illness and assessing behaviour in real-world individual and service contexts. As such, this study can inform our understanding of changes in mental and physical health and other life circumstances across a spectrum of chronicity and ages, and has a very high utility for mental health service planning.
Methods
This longitudinal study builds on Wave 1 data collected in Western Australia as part of the larger second Australian National Psychosis Survey – Survey of High Impact Psychosis (SHIP) (Morgan et al., 2012, 2014b). People with psychotic illness were comprehensively assessed in south metropolitan Perth as part of the 2010 SHIP survey (South Metro SHIP) and, in 2012–2013, in north metropolitan Perth as an additional SHIP catchment (North Metro SHIP) (Morgan et al., 2013). Both SHIP Wave 1 surveys employed the same protocols, instruments and assessments (Morgan et al., 2012, 2014b). Wave 1 covered all people resident in predefined catchments and in contact with designated public mental health services (inpatient, outpatient, ambulatory/community mental health), as well as non-government organisations (NGOs) within the catchments supporting people with mental illness, the latter providing rehabilitation programmes, individual support, information or advice and, for some clients, case management. A two-phase design was employed (Pickles et al., 1995). In Phase 1, a psychosis screener was used in the census month to identify individuals likely to meet diagnostic criteria for psychotic illness, while administrative records were examined in order to identify individuals with psychosis who were in contact with public mental health services in the 11 months prior to census but not in the census month. In Phase 2, people who were screen-positive in Phase 1 were randomly sampled for interview, stratified by site and age group (18–34 years; 35–64 years).
In Wave 2, using a State-based mental health database, we endeavoured to trace and contact all Wave 1 participants who had given permission for re-contact (98%). In the first instance, we approached case managers of participants who were active clients to assess study eligibility prior to contact. Those who were no longer active clients were sent a letter and information brochure to their last known address and, if possible, this was followed up with a telephone call. Throughout the study period, multiple attempts were made to find and contact participants, as well as to reassess the mental state of those who had been assessed initially as acutely unwell and unable to provide informed consent. People who were in prison, under a guardianship order or too unwell mentally or physically to provide informed consent were not eligible to participate. All participants gave written, informed consent. Wave 2 interviews were staggered over 2013–2016, with a follow-up time of 2.3–5.6 years.
Wave 2 interviews and assessments included many self-reported and interviewer-rated items from Wave 1: psychopathology; functioning and disability; substance use; education, employment and income; accommodation; medication use; health and other service utilisation; physical health (including fasting blood tests); and current cognitive function (Morgan et al., 2012, 2014b). Additional items incorporated or covered in greater depth at Wave 2 included loneliness, health literacy and other aspects of physical health (e.g. sleep, nutrition).
Key measures
The measures used in the interviews have been described in detail elsewhere (Morgan et al., 2012, 2014b).
The diagnostic module of the Diagnostic Interview for Psychosis (DIP-DM) (Castle et al., 2006) was used to determine diagnosis according to the International Classification of Disease, 10th Revision (ICD-10; World Health Organization, 1992). DIP-DM is a semi-structured clinical interview that elicits responses using questions and probes from the World Health Organization Schedules for Clinical Assessment in Neuropsychiatry (Wing et al., 1990) and maps these onto the 90 item Operational Criteria Checklist for Psychotic and Affective Illness (OPCRIT) (McGuffin et al., 1991). As diagnosis may change when new symptoms emerge, we used the Wave 2 lifetime diagnosis to classify participants.
To assess change in mental health outcomes, measures of symptomatic, functional and personal recovery were used. For symptomatic recovery, clinical variables were selected from DIP-DM items including interviewer-rated lifetime course of disorder, capturing the number of episodes of illness and the degree of symptomatic recovery after each episode, positive symptoms (hallucinations, delusions and subjective thought disorder) and negative symptoms experienced in the past year. Negative symptoms comprised the six items of the Carpenter deficit syndrome (Kirkpatrick et al., 1989; World Health Organization, 1999), but without attribution (details in Supplementary Materials). Current cognitive ability was assessed using a speed of processing task, the Digit Symbol Coding Test (DSCT) from the Repeatable Battery for the Assessment of Neuropsychological Status (Randolph et al., 1998).
Functional recovery was assessed over the past 4 weeks using the overall independent global performance score of the Multidimensional Scale of Independent Functioning (MSIF; Jaeger et al., 2003) and, over the past year, using the broader Personal and Social Performance Scale (PSP) (Morosini et al., 2000) which also includes social and behavioural items. Normal level of self-care and normal/almost normal social drive were single items rated by interviewers and coded yes/no.
To get some measure of personal recovery, we used the Assessment of Quality of Life-4D (AQoL-4D) (Hawthorne et al., 1999) as well as several single-item measures. AQoL-4D captures those elements of subjective wellbeing pertaining to an individual’s health state (Hawthorne et al., 1999) and, in other work, we have shown that AQoL-4D utilities are related to social experiences (Nevarez-Flores et al., 2020). Perceived loneliness was coded as binary, scored positive if participants reported that they had some friends but had been lonely for company or felt socially isolated and lonely, and scored negative if they had plenty of friends and had not been lonely or, although they had friends, they had been lonely occasionally. The following additional items were rated over the past year and coded as yes/no: normal/almost normal range and intensity of interest in the world; never, rarely or sometimes felt a lack of control over life events; very or somewhat satisfied with own independence; and delighted, very pleased or mostly satisfied with life as a whole.
Metabolic syndrome was defined using the harmonised criteria (Alberti et al., 2009) requiring three of five risk factors to be present at at-risk levels: abdominal obesity, diastolic and/or systolic blood pressure, blood glucose, triglycerides and fasting high-density lipoprotein cholesterol (HDL-C). People on medication for hypertension, hyperlipidaemia or hyperglycaemia were treated as meeting the at-risk criterion (full details in Supplementary Material).
Items related to healthy behaviours included physical activity in the past 7 days, rated using the International Physical Activity Questionnaire (Craig et al., 2003): the short form was used at Wave 1 and the long form at Wave 2. Smoking dependence in the past year was assessed using the Fagerstrom Nicotine Dependence Scale (Heatherton et al., 1991) while risky drinking in the past year was assessed with the Alcohol Use Disorders Identification Test-C (Bush et al., 1998). Health literacy was measured at Wave 2 only using a brief screener (Chew et al., 2008) and coded as adequate or low using the coding algorithm published by Peterson et al. (2011).
Service utilisation covered inpatient services, outpatient/community clinics, emergency departments, drug and alcohol services, NGOs supporting people with mental health issues, community rehabilitation programmes and general medical practices. Public and private services were included, and contacts for mental health were distinguished from contacts for physical health where possible.
Finally, we ranked the top challenges that participants told us that they faced in the coming 12 months.
Both waves of interviews were coordinated by the same researcher and conducted by trained mental health professional staff experienced in working with people with psychotic disorders. Interviewers received specialised training in administering questions and assessments embedded in the interview, including taking standardised physical health measures. There was consistency of interviewers across waves, with the three Wave 2 interviewers also participating in Wave 1.
Statistical analyses
Data were analysed in SPSS version 25 and Stata version 15.1. Counts and percentages were used to describe the cohort demographics and survey responses. Unadjusted statistical significance was assessed using: the paired t test for continuous variables, McNemar’s test for equal marginal proportions for dichotomous variables and subgroups, and the McNemar–Bowker test for symmetry for multinomial variables. Invalid responses were treated as a separate category in variables with more than five missing values, in order to assess patterns of movement into and out of valid response groups. All analyses were unadjusted for follow-up time.
Results
In Wave 2, 380 Western Australian adults with psychotic illness first interviewed in 2010–2013 were re-interviewed in 2013–2016. The median length of time between interviews was 3.4 years, ranging from 2.3 to 5.6 years, with a mean of 3.3 years (standard deviation [SD] = 0.6). Of the 484 Wave 1 participants who could be contacted for interview, the response rate was 78.5%. A further 157 people were not invited to participate because (1) they had requested not to be re-contacted (N = 13); (2) they could not be traced or contacted (N = 82) or had died (N = 23); or (3) they were ineligible or unable to give informed consent (N = 39) (see Figure 1). Wave 1 profiles of responders and non-responders at Wave 2 were similar, including clinical and functional profiles. Key significant points of difference were that, in the year prior to interview, non-responders were more likely to have been homeless, to be a victim of actual violence (females only), to be using cannabis (males only), to have had an involuntary admission and to have attended an emergency department (see Supplementary Tables A–F).
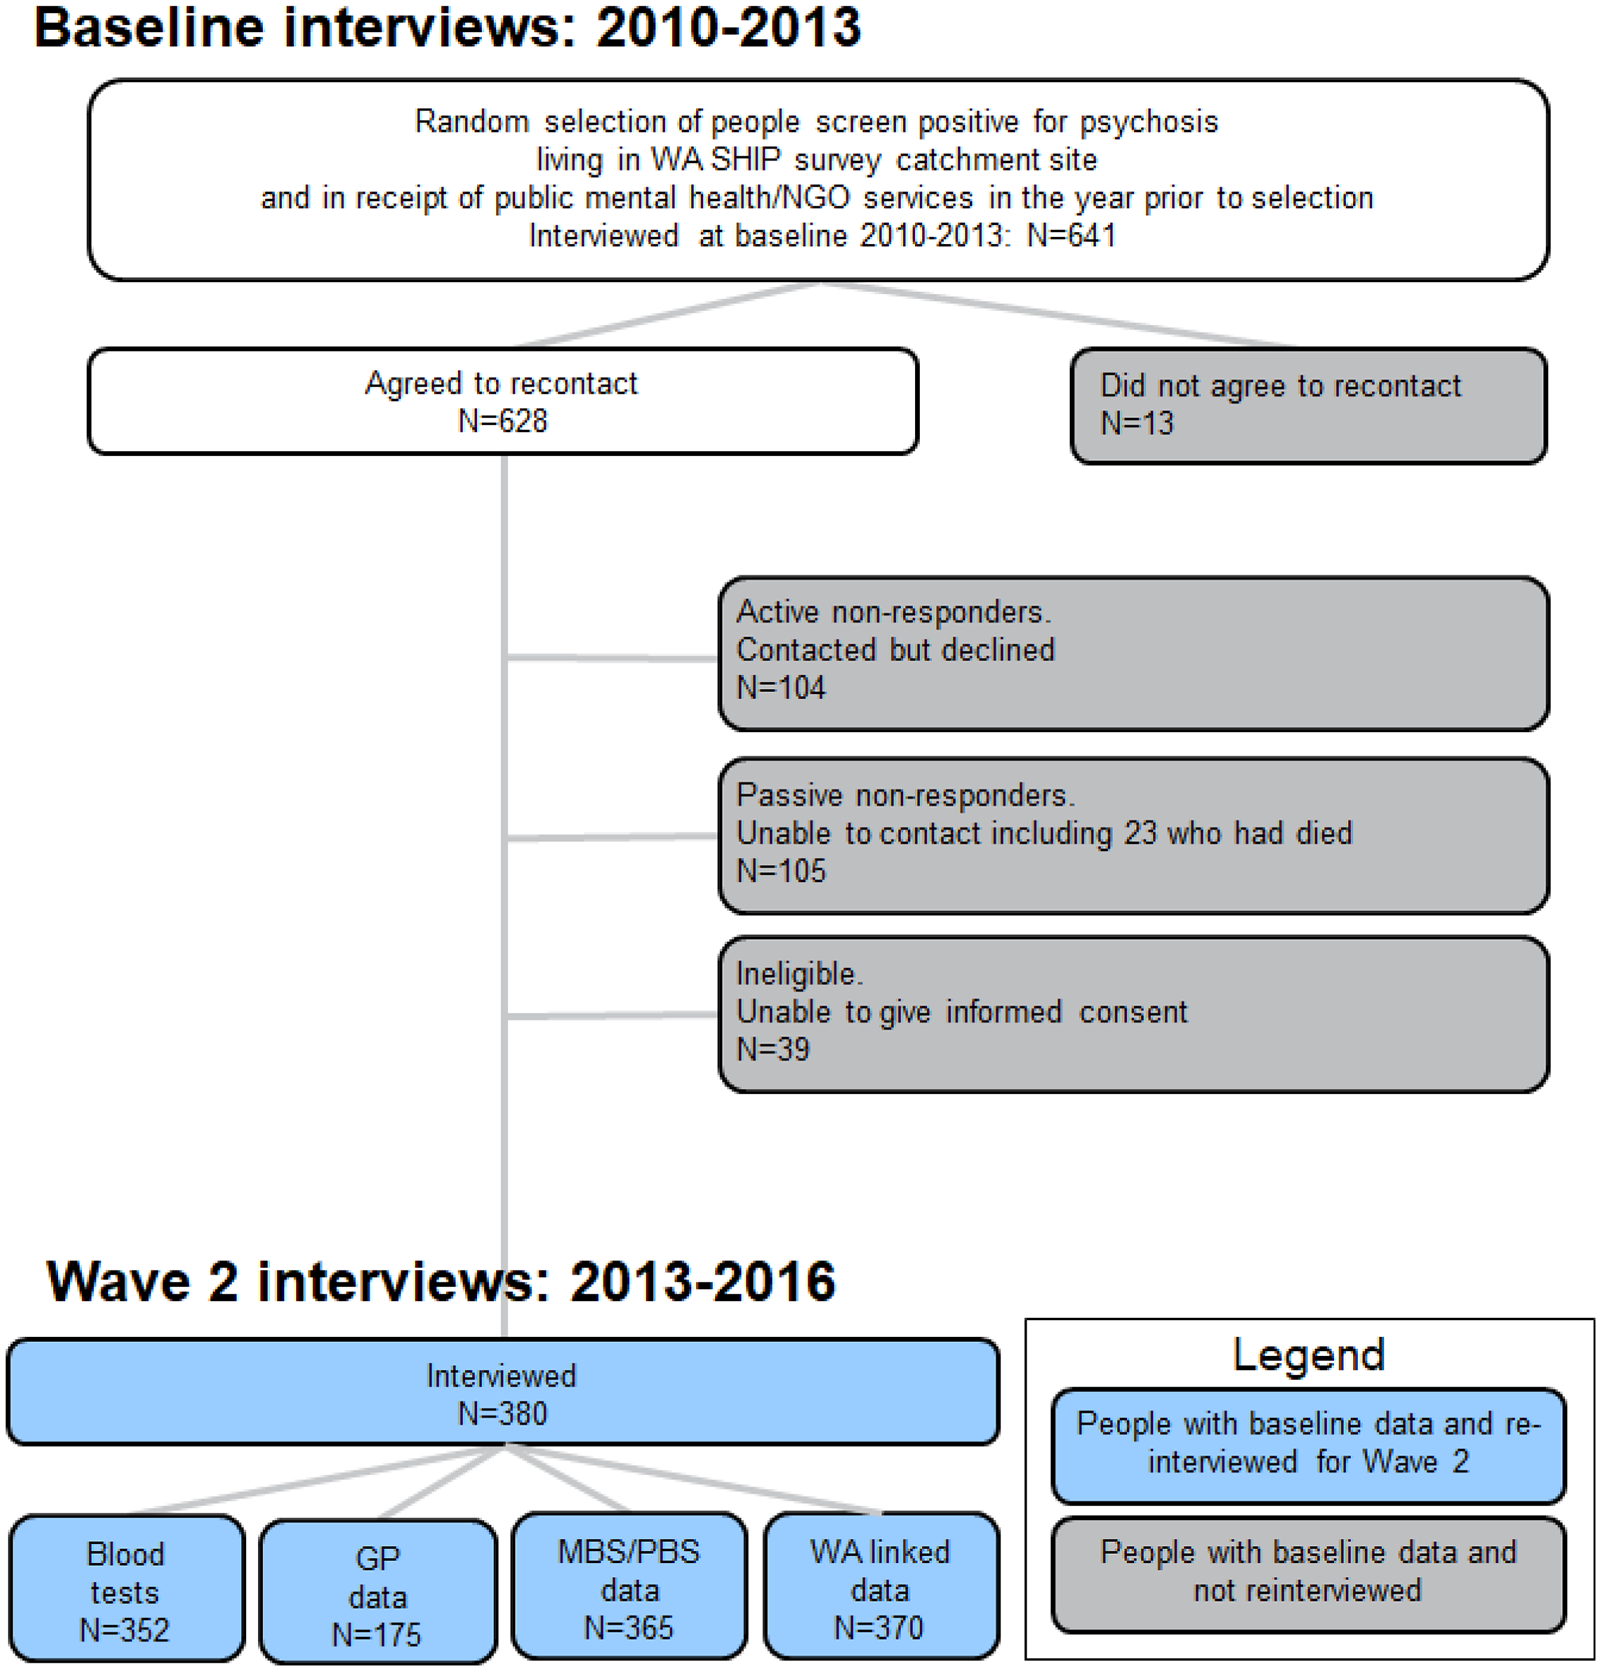
Flowchart of study participation.
Sociodemographic profile
At Wave 1, the median age of participants was 37 years, ranging between 18 and 64 years, and 61.8% were male. Three-quarters (74.7%) had been born in Australia and 3.4% identified themselves as Aboriginal or Torres Strait Islanders. Marital and parental status changed little over waves: at Wave 2, 1 in 4 women (24.8%) and 1 in 12 men (8.1%) were in a married or de facto relationship, while 60.7% of women and 22.1% of men were parents. Over the waves, participation in any paid employment in the year prior to interview had dropped significantly from 36.8% to 29.7%. Of those working, the proportion in competitive employment fell significantly from 77.9% to 65.5%, while the median number of hours of work per week (20 hours) was unchanged. The main source of income for the majority (85.0% at Wave 2) was a government pension, virtually unchanged from 82.9% at Wave 1. There was a significant change in housing type with fewer participants living in a family home (25.5% at Wave 1, 19.5% at Wave 2), alongside a rise in the proportion in rental accommodation (45.8% at Wave 1, 51.3% at Wave 2). The proportion in supported group accommodation remained low (6.3% at Wave 2) (Table 1).
Sociodemographic profile.
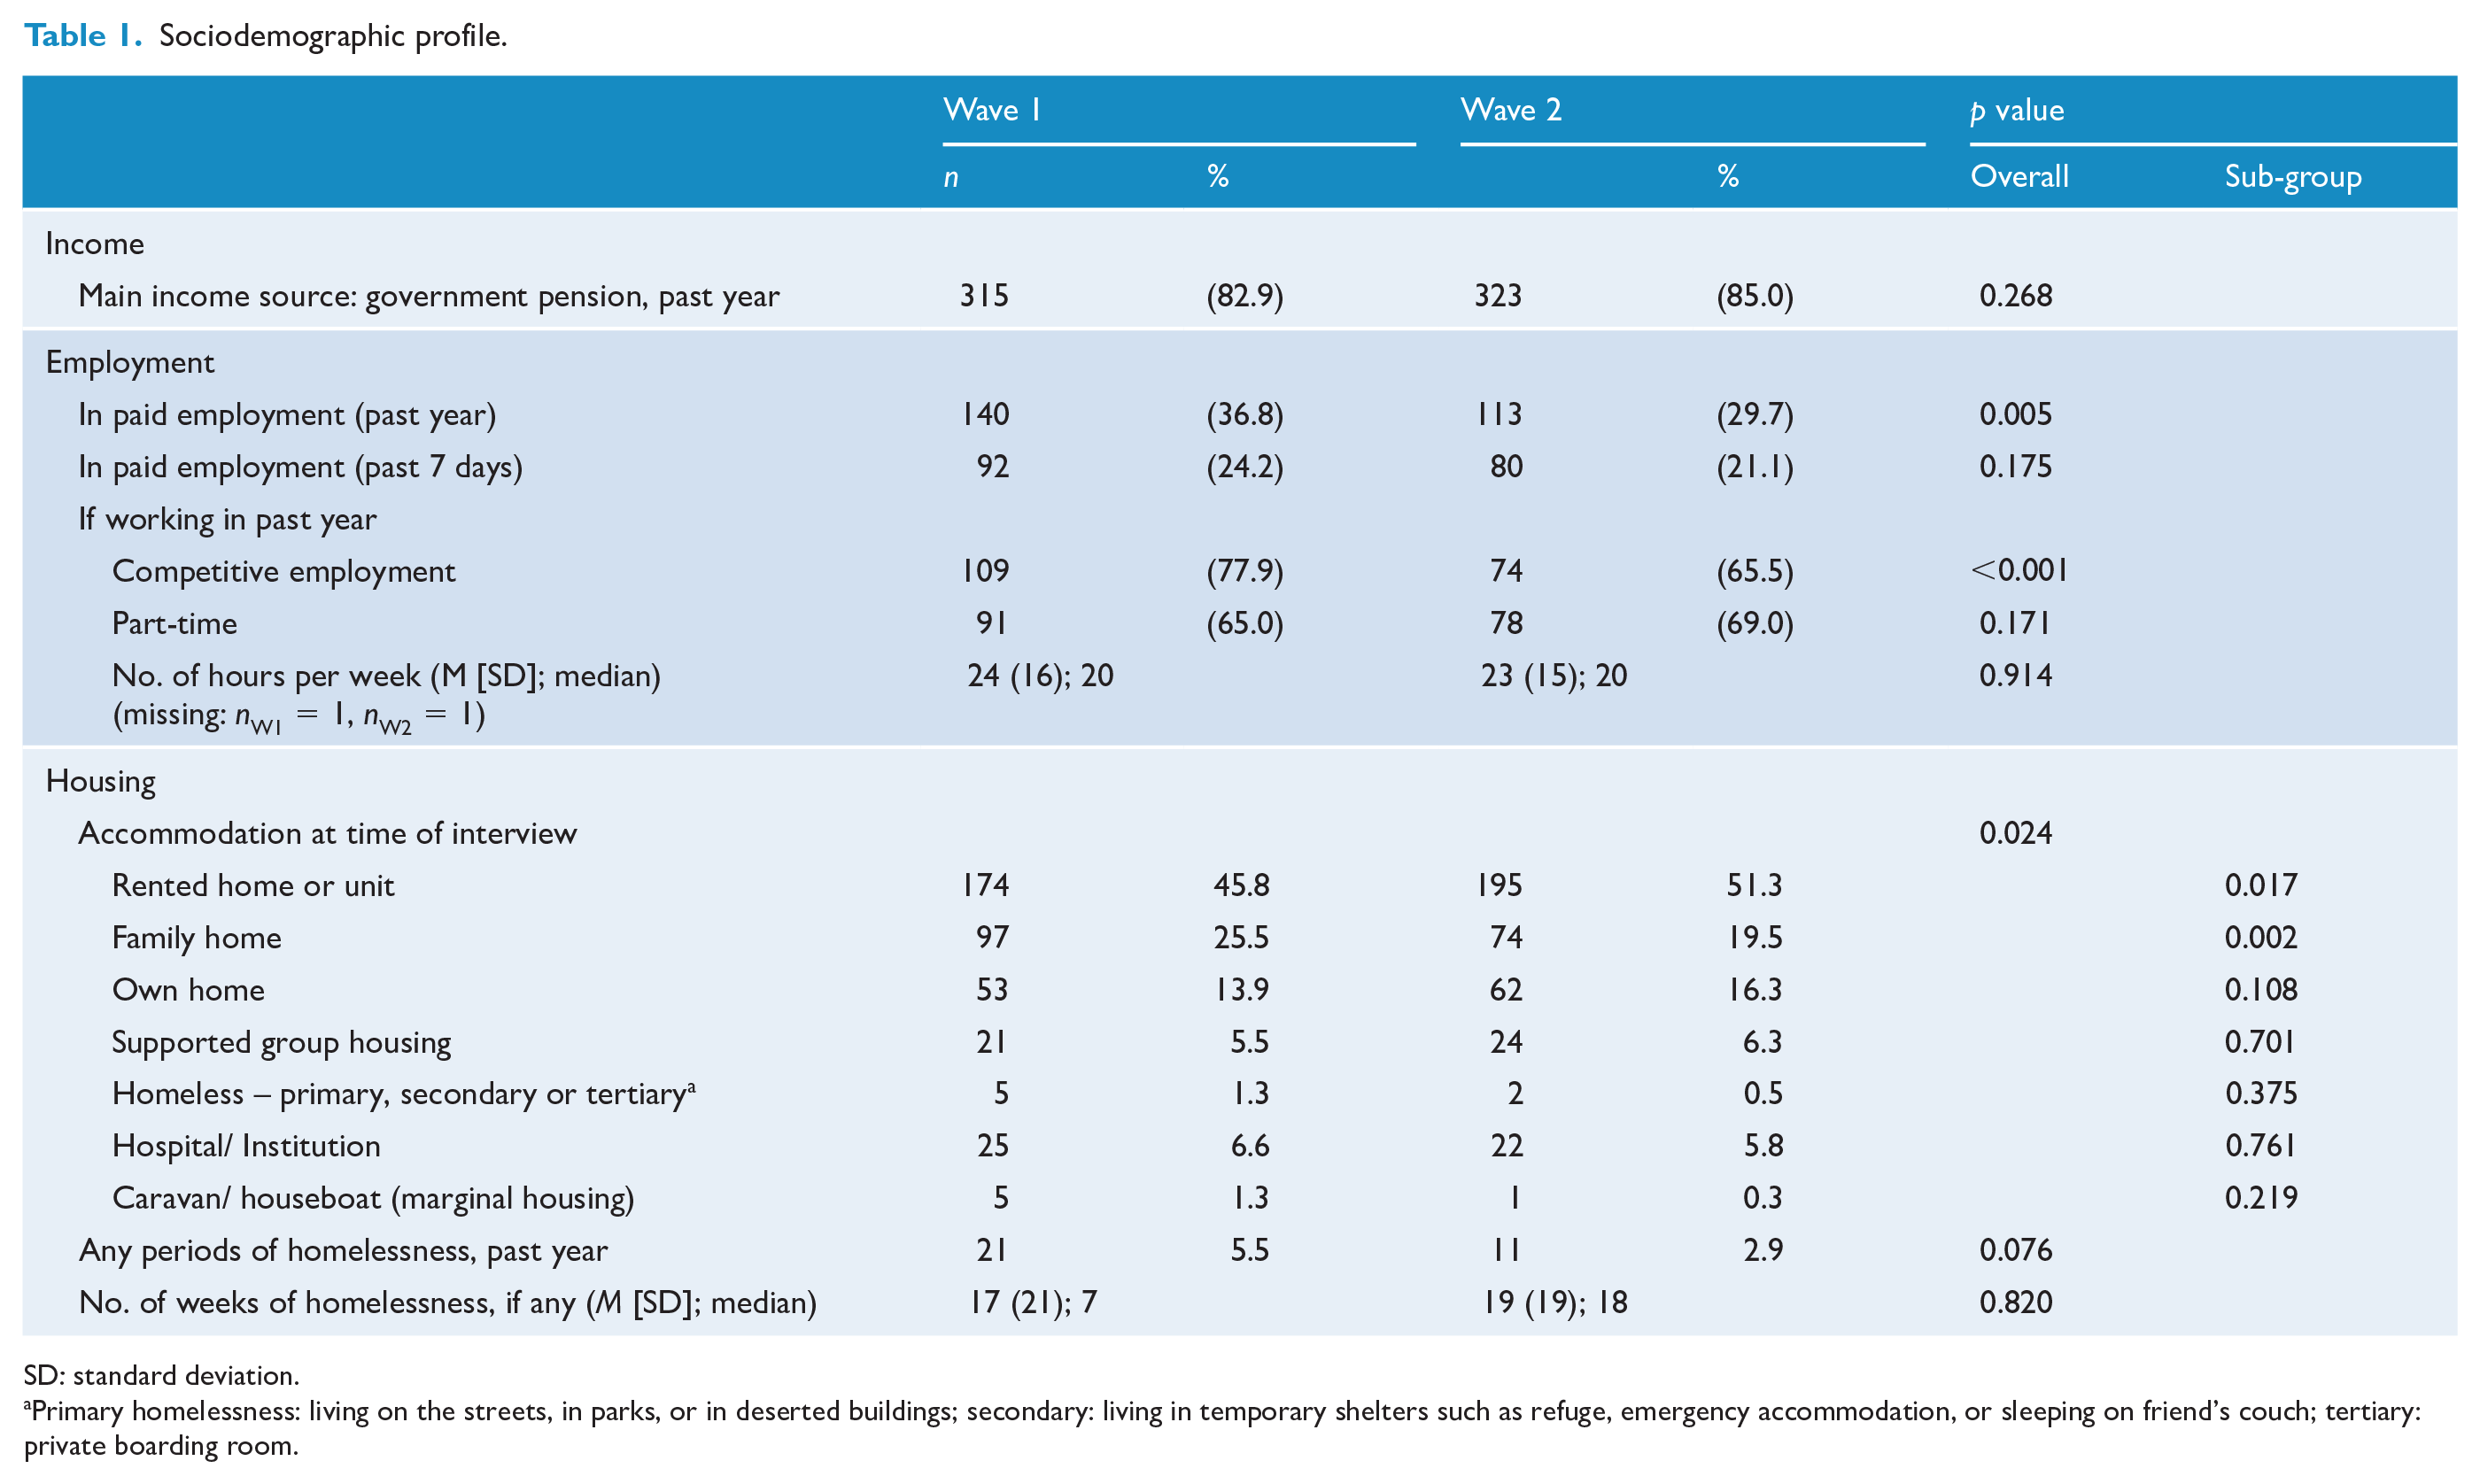
SD: standard deviation.
Primary homelessness: living on the streets, in parks, or in deserted buildings; secondary: living in temporary shelters such as refuge, emergency accommodation, or sleeping on friend’s couch; tertiary: private boarding room.
Mental health outcomes
At Wave 2, the majority of participants had a lifetime diagnosis of schizophrenia (62.1%) (see Table 2). Over waves, the proportion with schizophrenia increased and the proportions with delusional and other non-organic psychoses and those not meeting full ICD-10 criteria for a psychotic disorder decreased. At Wave 2, the mean number of years since illness onset was 18 years (SD = 10 years).
Clinical and cognitive profile.
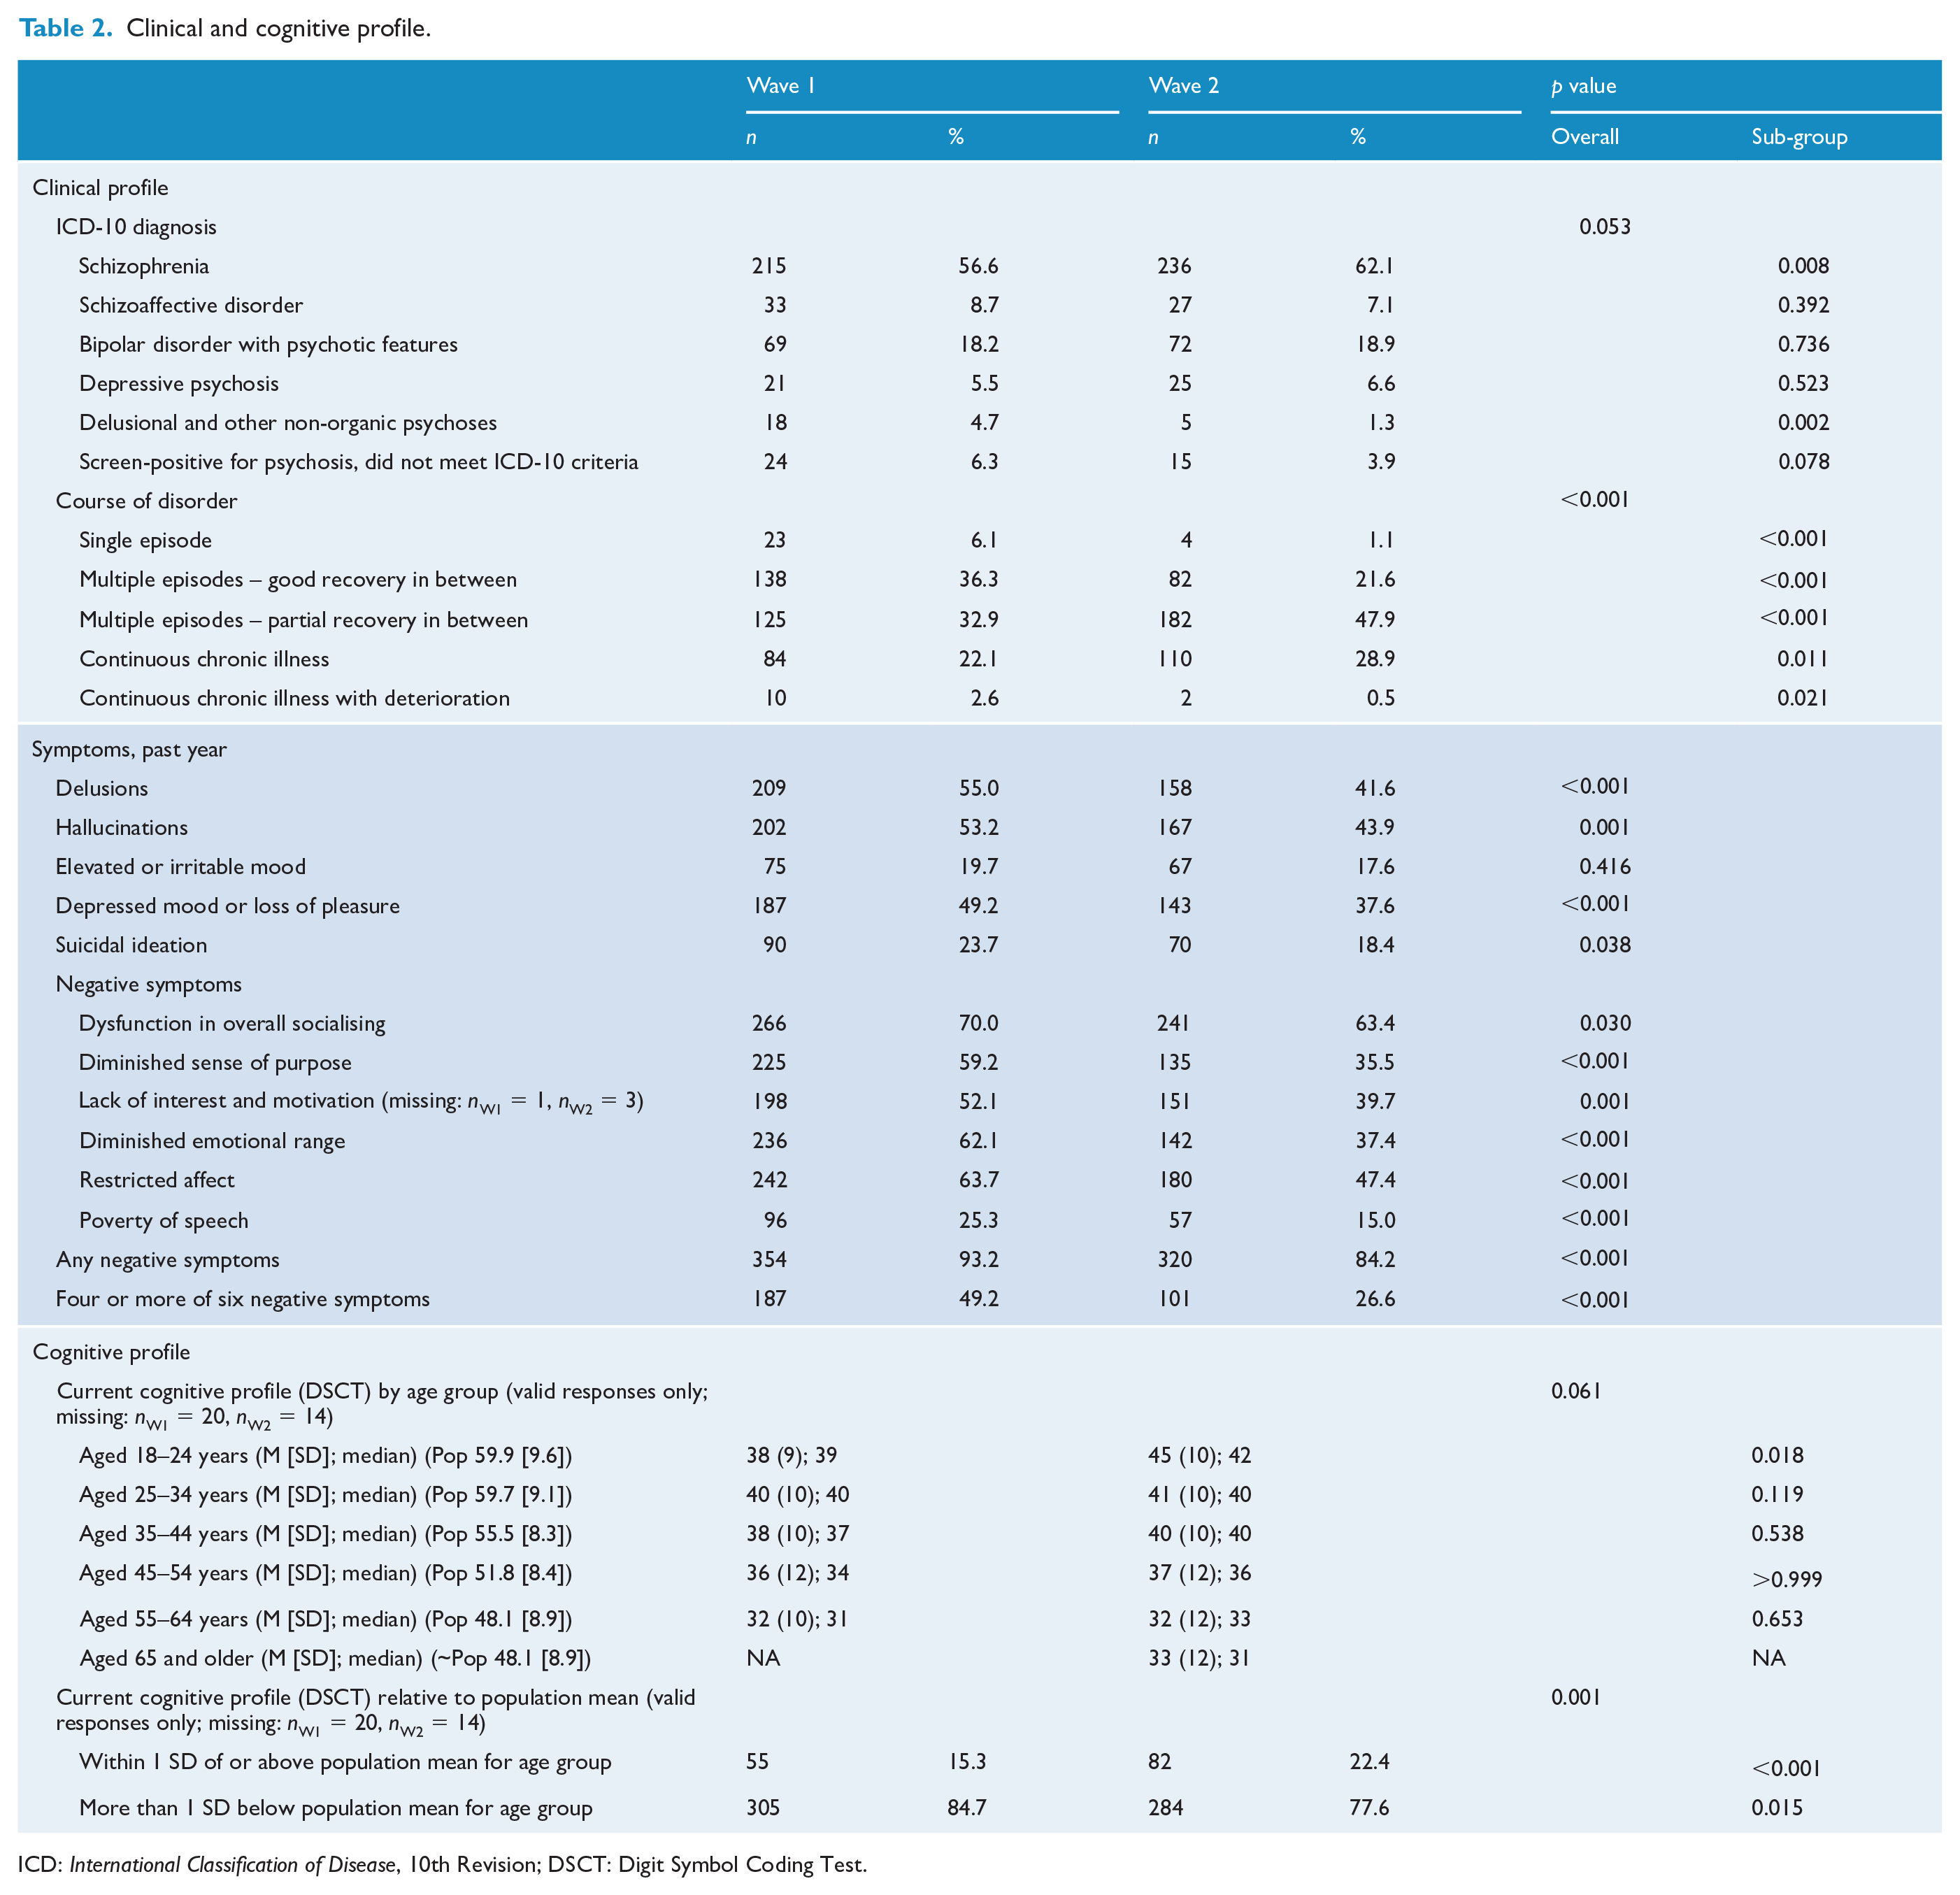
ICD: International Classification of Disease, 10th Revision; DSCT: Digit Symbol Coding Test.
Symptomatic recovery
Course of disorder changed over time, with a smaller proportion of participants with good recovery between episodes and a larger proportion with partial recovery. Significantly, fewer participants experienced hallucinations, delusions, depressed mood/loss of pleasure or suicidal ideation in the year prior to interview (Table 2). Similarly, the proportion with any negative symptoms dropped significantly, and the percentage with four or more negative symptoms halved to 26.6%. There was no evidence of a decline in current cognitive ability within age groups, assessed by the Digit Symbol Coding Test, based on total coding scores over waves (Table 2). However, the proportion scoring more than 1 SD below the age-stratified population mean dropped significantly from 84.7% to 77.6%.
Functional recovery
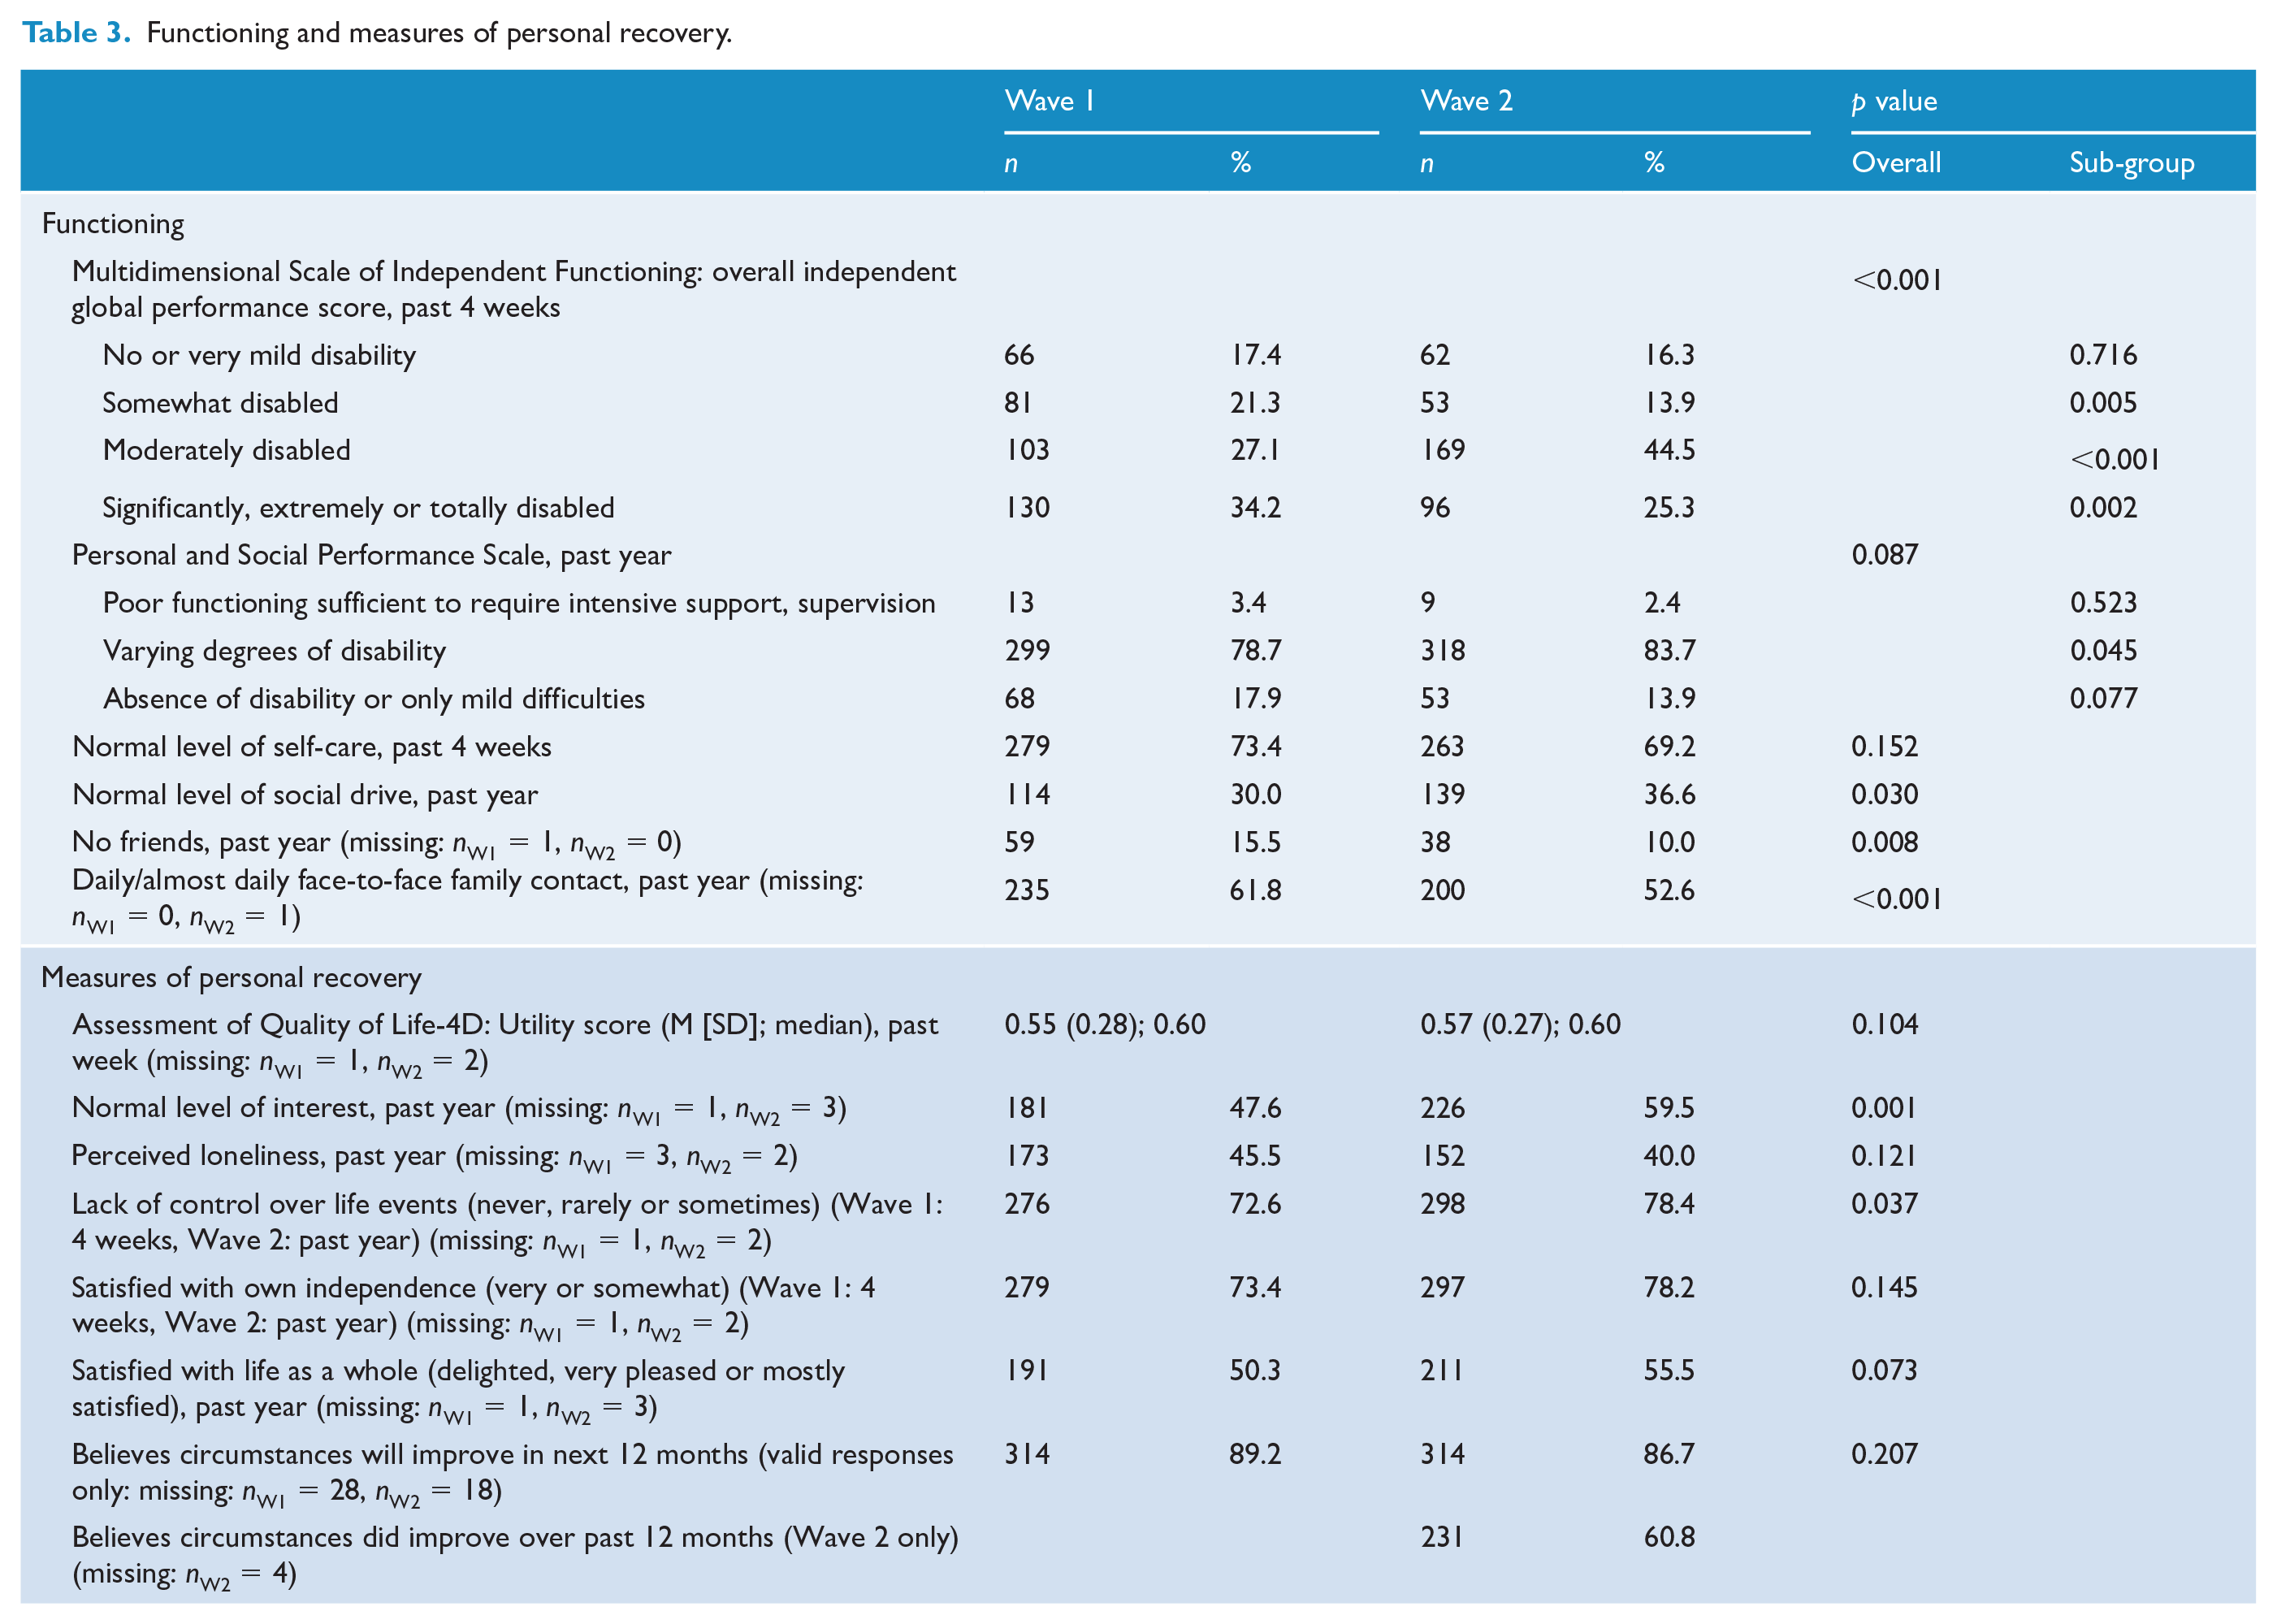
There were significant shifts in overall independent global functioning over the past 4 weeks as assessed by the MSIF, with some movement of both those in the somewhat disabled group and those in the significantly, extremely or totally disabled group into the moderately disabled group (Table 3). A similar, but non-significant, pattern was observed for the PSP which covers a longer period of 12 months and also includes social and behavioural items. Quality of self-care over the past 4 weeks did not change significantly. However, more participants were rated by interviewers as having normal social drive over the past year, rising significantly from 30.0% at Wave 1 to 36.6% at Wave 2 and the proportion reporting no friends at all dropped significantly from 15.5% to 10.0% (Table 3).
Functioning and measures of personal recovery.
Personal recovery
The proportion of participants experiencing normal enjoyment of and interest in life rose significantly from 47.6% at Wave 1 to 59.5% at Wave 2, and a greater proportion felt in control of life events with the percentage reporting never, rarely or only sometimes feeling a lack of control rising significantly from 72.6% to 78.4%. The AQoL utility score remained practically unchanged. There was no significant change in the percentage reporting perceived loneliness, satisfaction with one’s own independence or satisfaction with life as a whole. The proportion who believed their circumstances would improve in the next 12 months dropped from 89.2% to 86.7% (not significant) and, in a new item in Wave 2 only, 60.8% believed their circumstances had improved over the past 12 months (see Table 3).
Physical health outcomes
Cardiometabolic profile
The proportion of participants meeting criteria for metabolic syndrome rose significantly from 57.2% to 62.8% over waves (Table 4). With respect to the syndrome’s component criteria, the proportions with beyond-threshold blood glucose and HDL-C decreased significantly, dropping six and eight percentage points, respectively. The results for HDL-C were complemented by an increase in mean HDL-C levels between Wave 1 and Wave 2, from 1.11 mmol/L (SD = 0.32) to 1.14 mmol/L (SD = 0.30), respectively (p < 0.05 – results not shown). Body mass index was unchanged; however, there were significant changes in physical activity, with fewer having a low activity level and more having a high activity level. The increase in mean waist circumference from 107 cm (SD = 18) in Wave 1 to 109 cm (SD = 17) in Wave 2 was significant (p < 0.001 – results not shown).
Physical health profile.
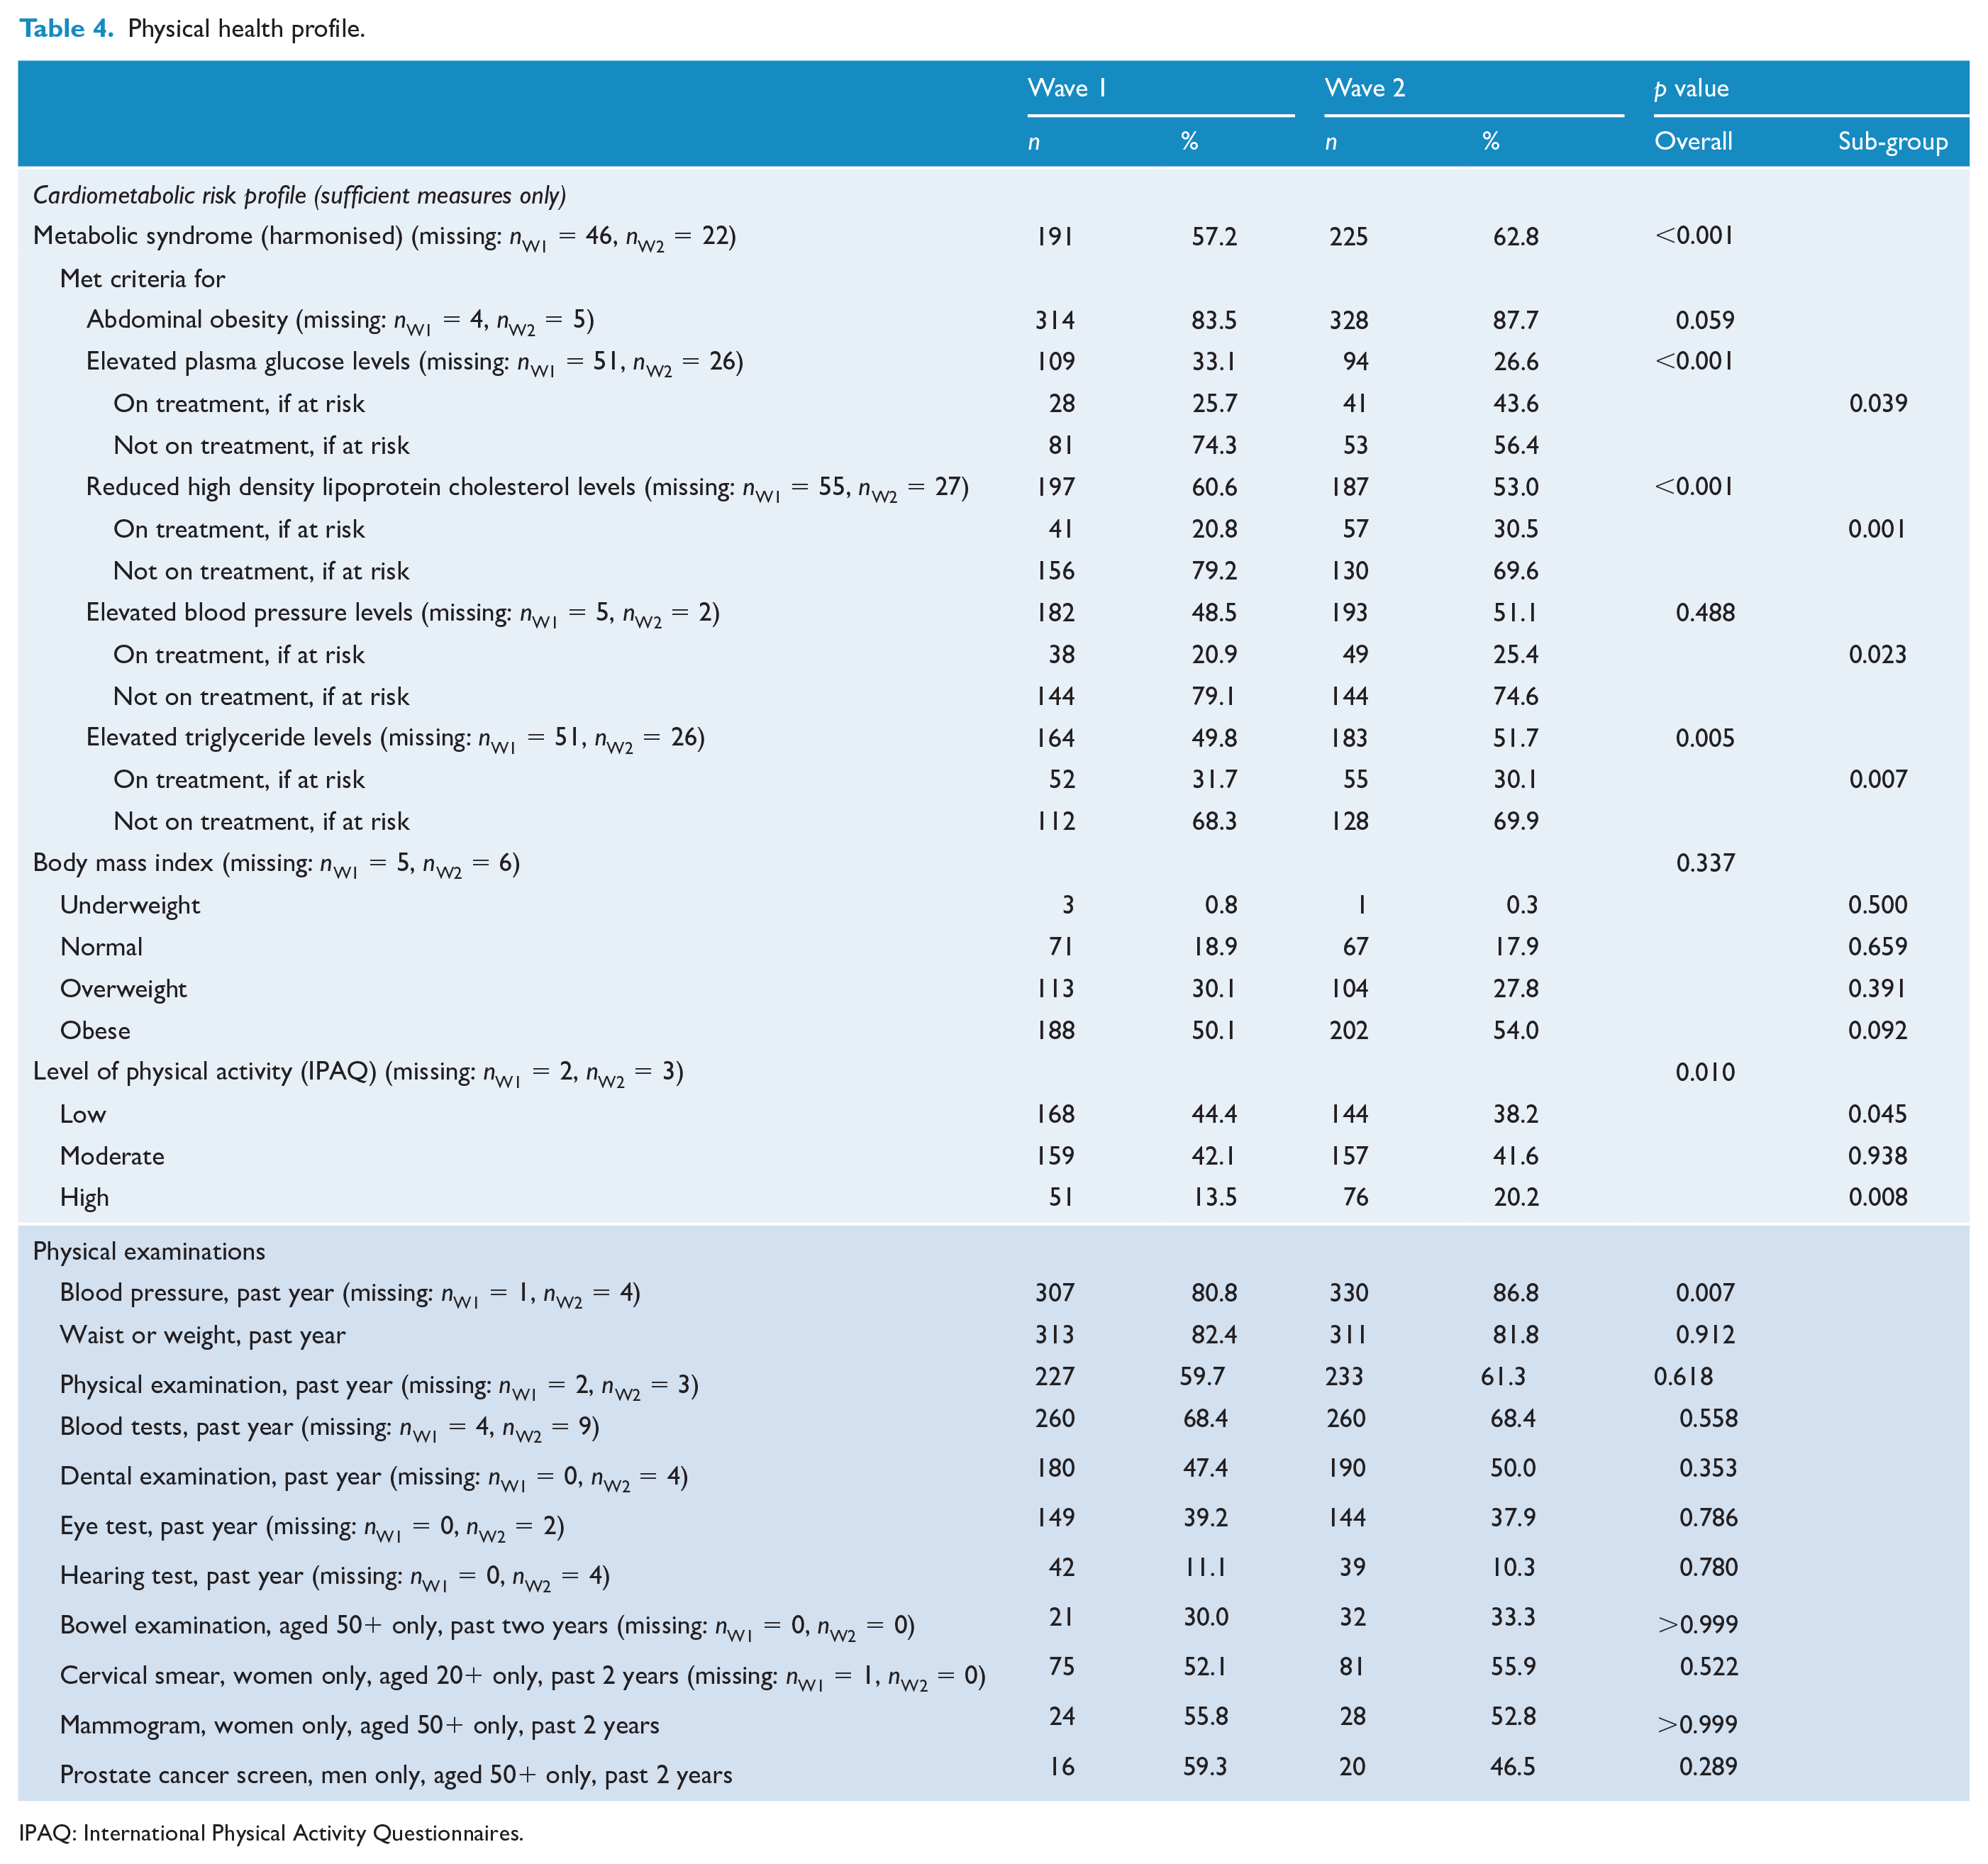
IPAQ: International Physical Activity Questionnaires.
Screening and treatment
Overall, physical health screening in the previous 12 months remained largely unchanged over waves, except for blood pressure testing which went up significantly from 80.8% to 86.8% (Table 4). Over waves, treatment of participants with cardiometabolic risk factors improved. The proportion meeting the risk threshold for these factors who were not on treatment (as a percentage of all who met the risk threshold) fell from 74.3% to 56.4% for elevated plasma glucose, from 79.2% to 69.6% for low HDL-C and from 79.1% to 74.6% for elevated blood pressure (Figure 2). Participant health literacy, measured for the first time in Wave 2, was assessed as poor in only 4.5% of participants and as adequate for the remainder.
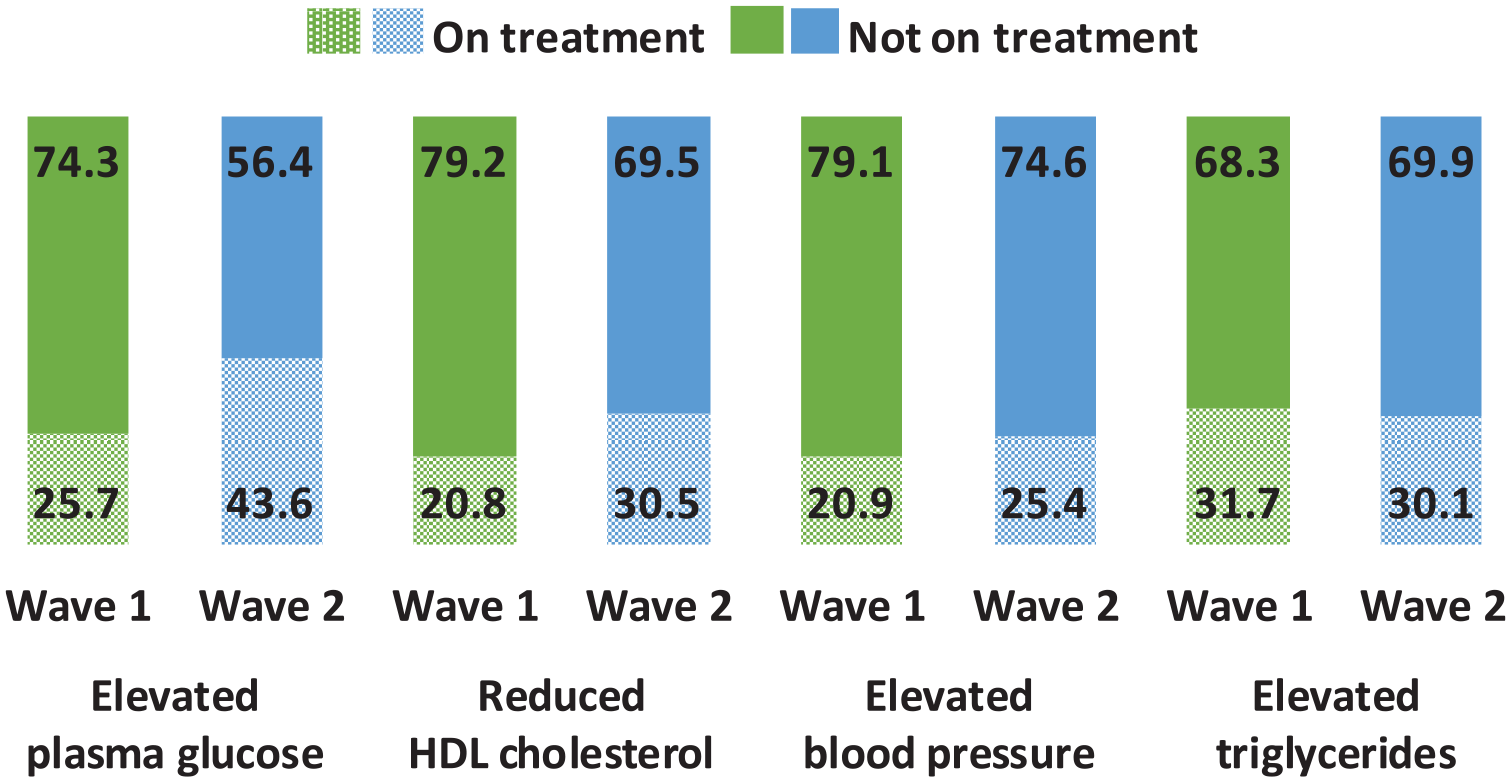
Proportions on and not on treatment for cardiometabolic risk conditions, of those who have the condition, Waves 1 and 2 (%).
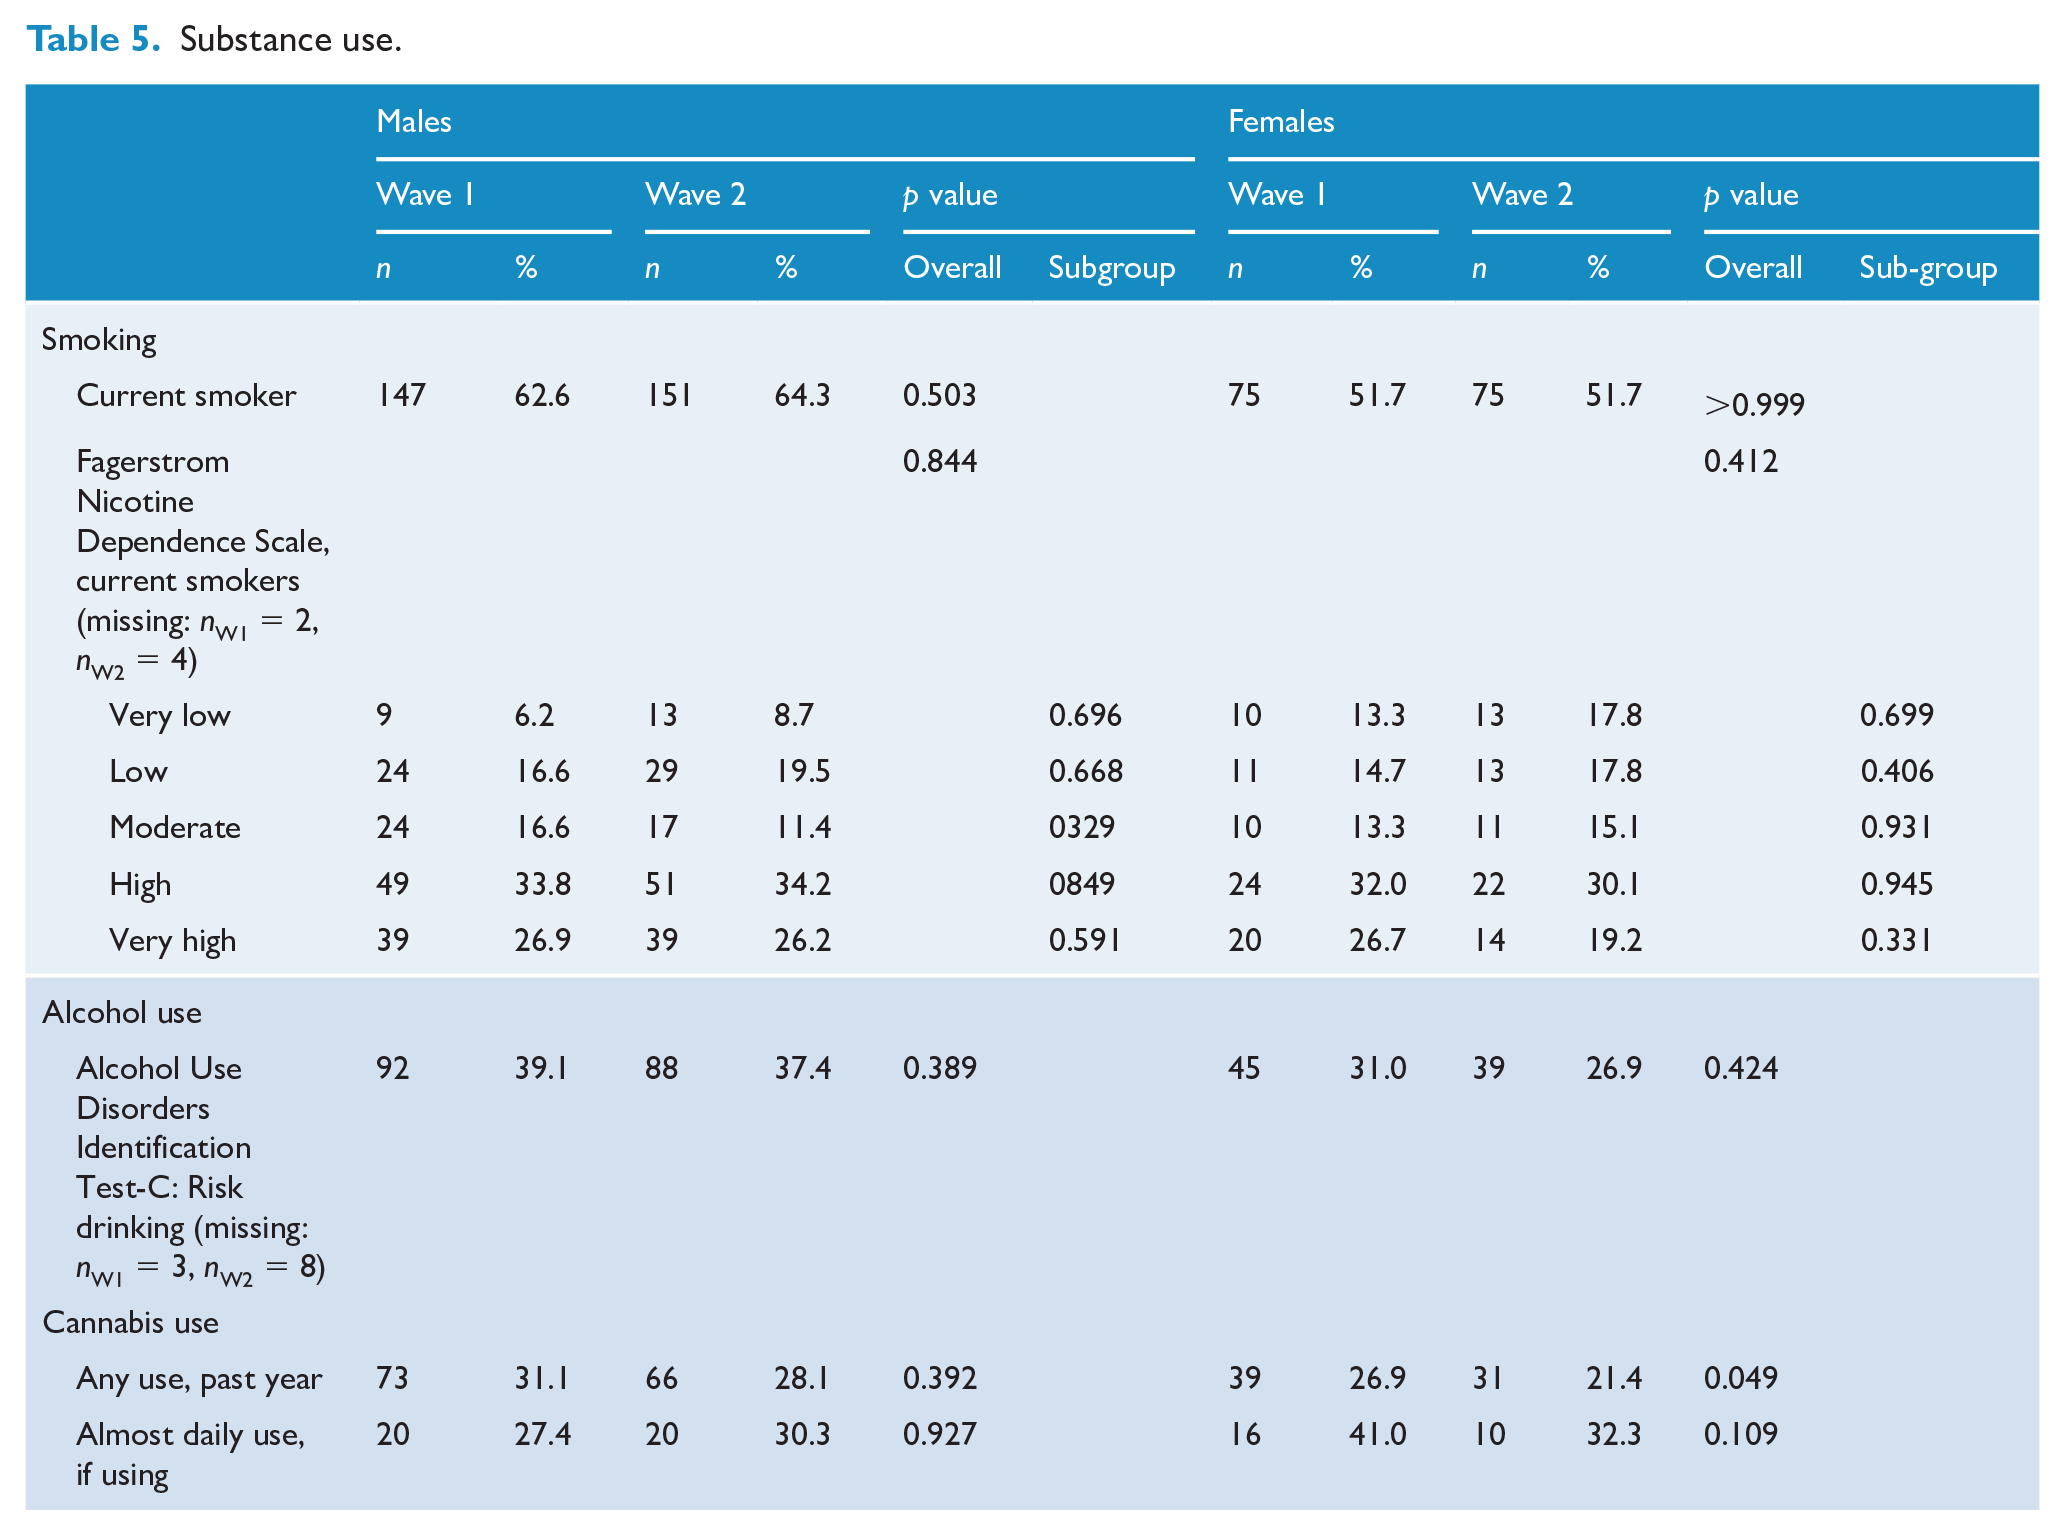
Substance use
The proportion of participants who smoked remained stable over time (at Wave 2: 59.5% in total, 64.3% for males and 51.7% for females). For both males and females, there was no significant change in smoking dependence, risky drinking and cannabis use (see Table 5).
Substance use.
Challenges for the coming year
At both waves, the same challenges were ranked among the top 6 (see Figure 3); however, the ranking order changed, with poor physical health, previously ranked fifth, rising to second.
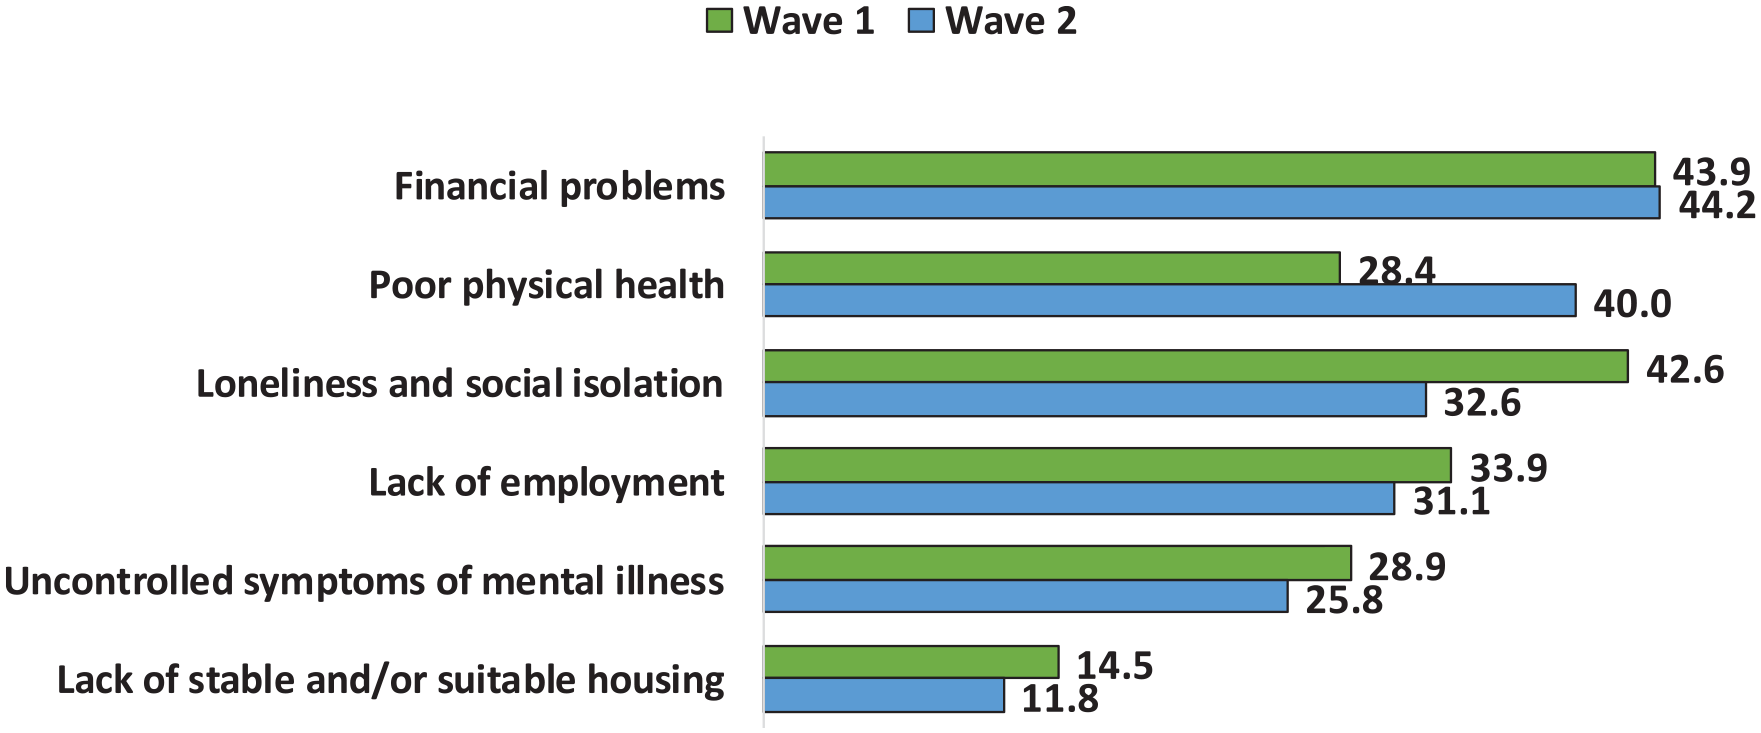
Top challenges for the next 12 months, Waves 1 and 2 (%).
Service utilisation
The proportion of participants with at least one inpatient admission in the year prior to interview did not change over waves (36.8% at both time points). For those with a psychiatric admission (29.7% at Wave 1 and 26.8% at Wave 2), there was a significant increase in the proportion with more than one admission, rising from 32.7% to 50.0%. Attendance at any outpatient/community clinic dropped significantly from 93.2% to 88.7%: mental health–related attendances dropped from 91.1% to 85.0%, while physical health–related attendances doubled from 16.3% to 32.9% (both significant). The proportion using NGOs for mental health support rose from 29.2% to 38.4%, and the proportion accessing drug and alcohol services doubled from 6.1% to 11.8% (both significant). However, there were large significant falls in the proportions with case managers (from 76.1% to 57.6%) and attending community rehabilitation programmes (from 41.1% to 27.4%). In the primary care sector, service utilisation increased significantly over waves, both for mental health–related and physical health–related visits: 80.0% reported visiting a GP in Wave 1 (27.1% for mental health, 75.8% for physical health) compared to 89.2% in Wave 2 (37.1% for mental health, 82.1% for physical health), with the mean number of visits rising from 6 (SD = 7) to 8 (SD = 10). Of note, the proportion with private health insurance dropped significantly. There was little change in medication use other than the proportion using depot antipsychotics which rose from 18.9% to 23.7%. On the other hand, the proportion receiving psychosocial interventions in the past year dropped significantly from 48.7% to 32.9% (see Table 6).
Service utilisation and medication use.
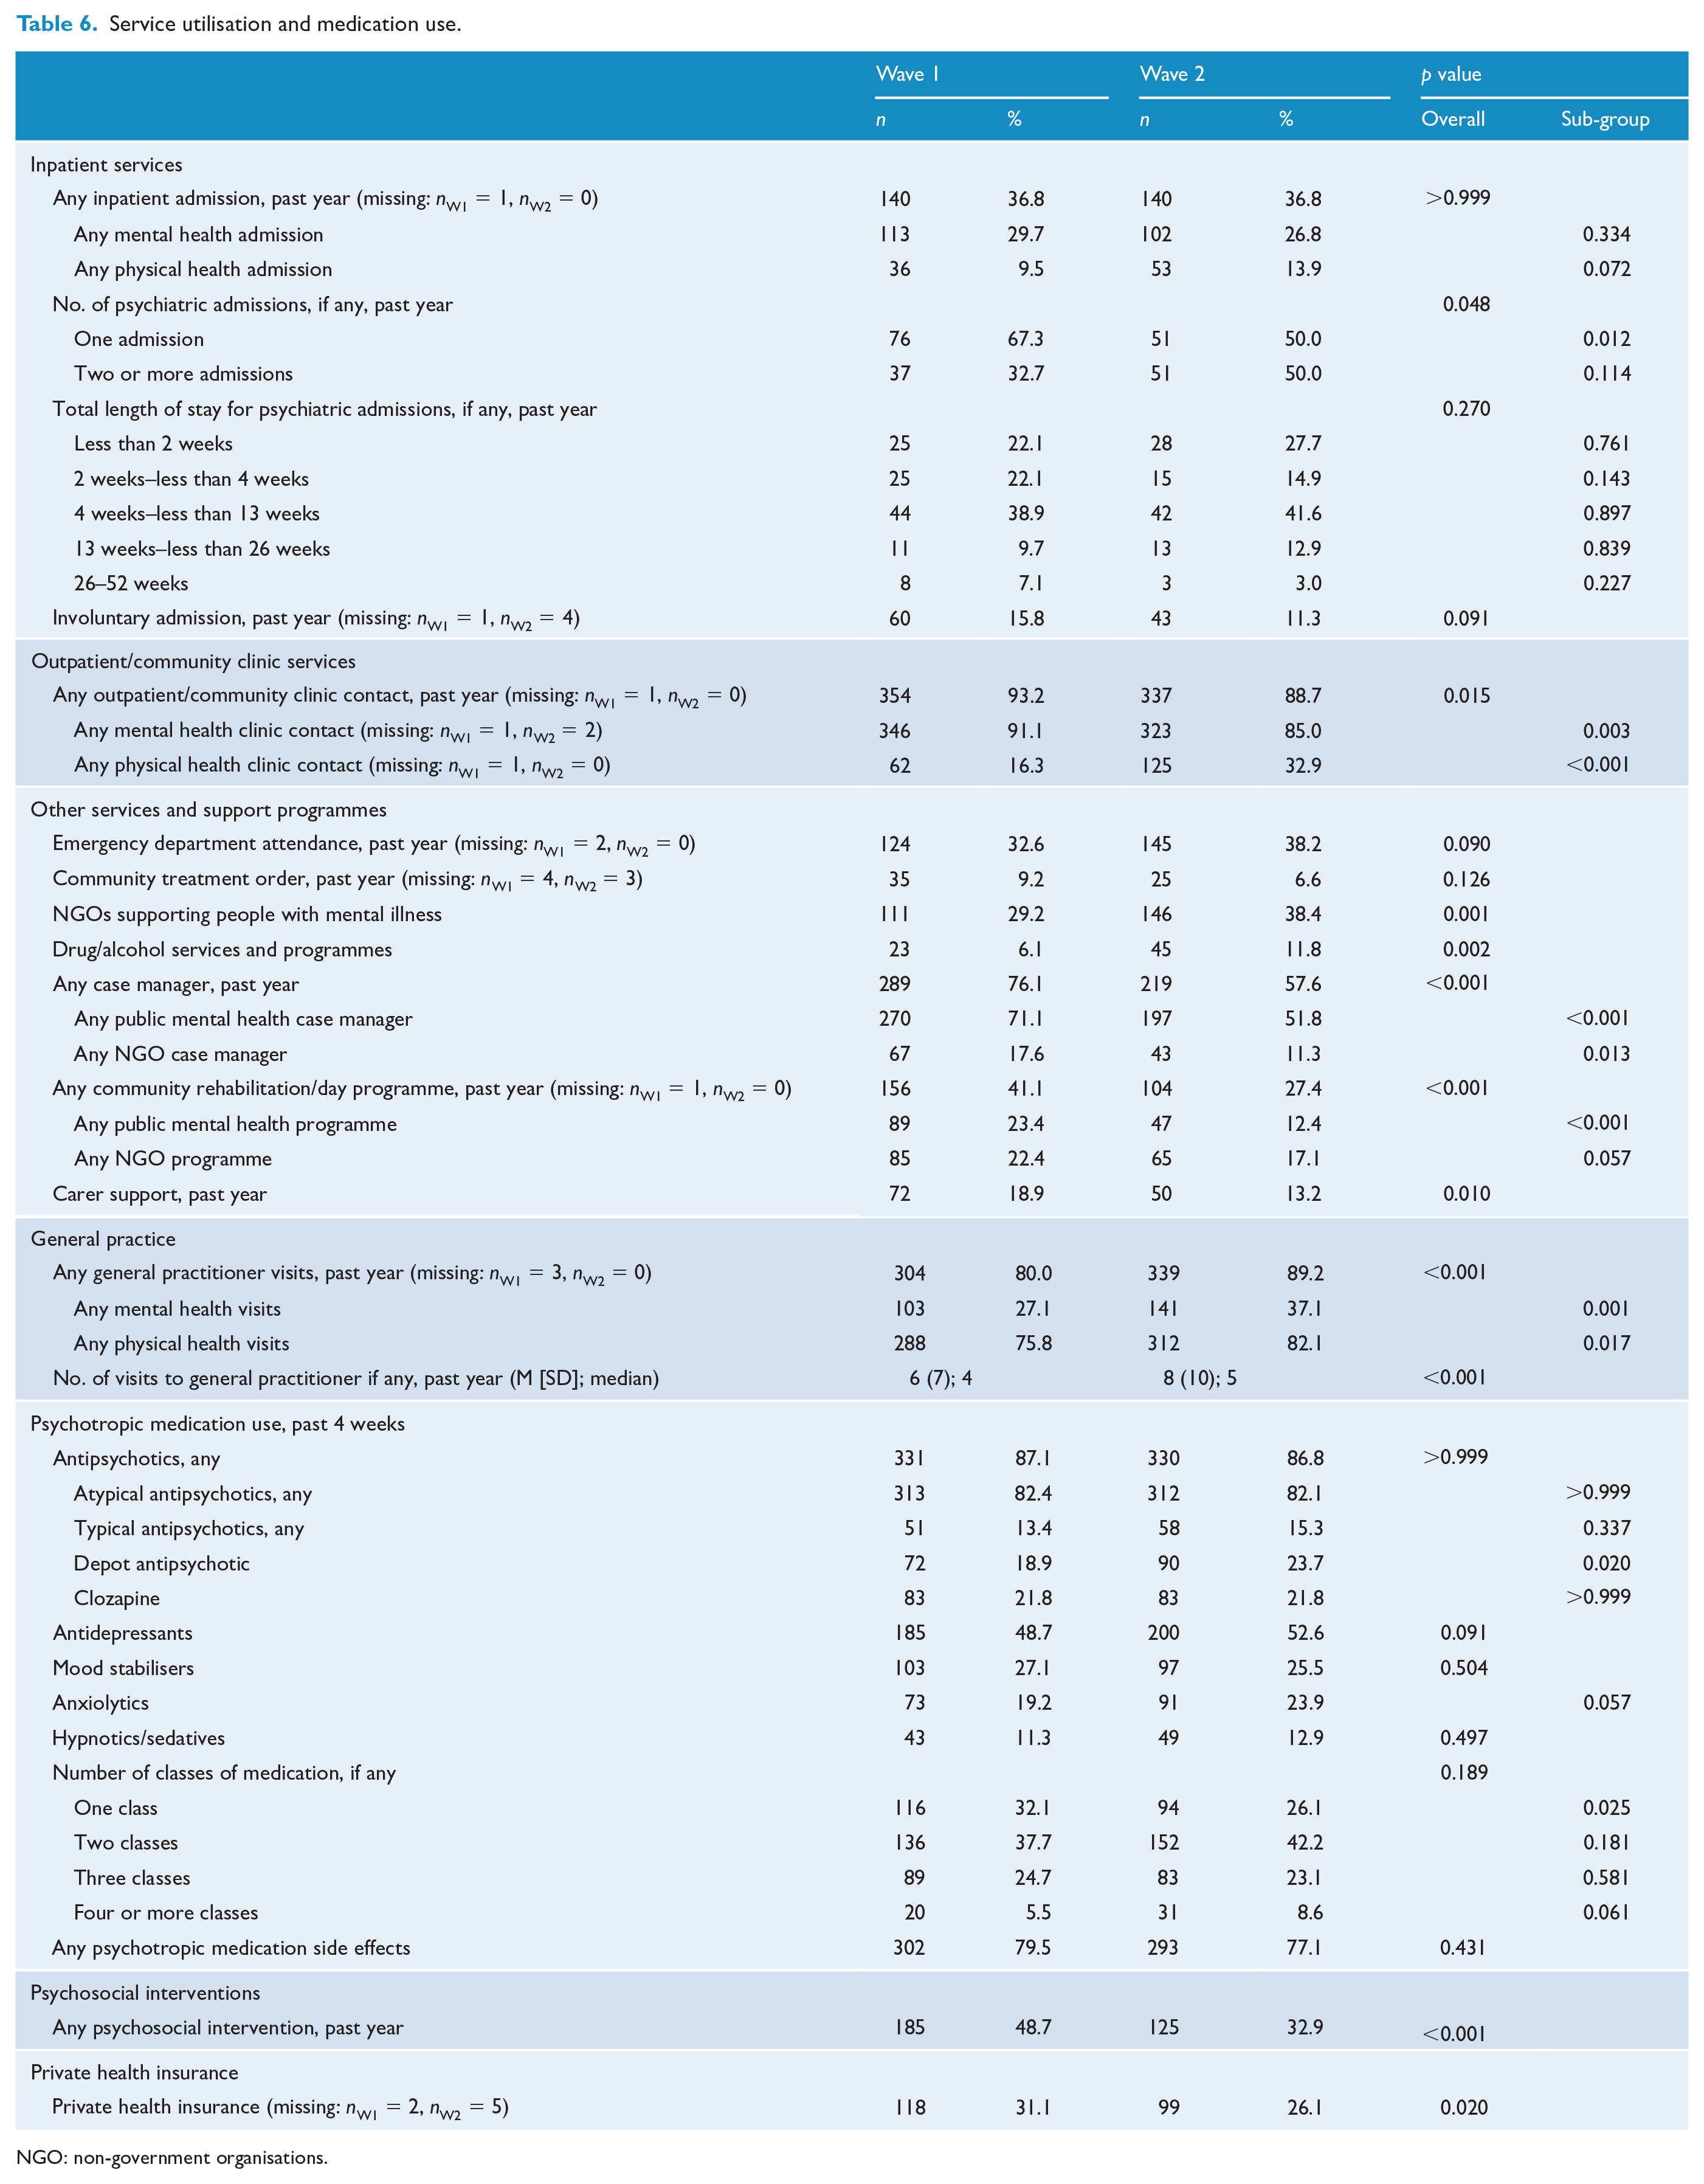
NGO: non-government organisations.
Discussion
This study offers a number of important advantages over many other studies on outcomes for people with psychotic illness. The baseline data come from a population-based, representative sample of people with psychotic illness in contact with public treatment services and are generalisable to adults in developed countries in similar public treatment service settings. It covers a range of levels of chronicity and ages and includes both non-affective and affective psychoses. Nevertheless, the findings should be evaluated against both strengths and limitations. This descriptive paper presents a portfolio of longitudinal data for clinical and research benchmarking, and it was beyond its scope to fit multivariable models to each variable adjusting for follow-up time, follow-up bias, important socio-demographic variables and relevant risk factors. The sample size at Wave 2 is relatively small and the median interval between waves is quite short; notwithstanding this, a number of significant and clinically relevant findings have emerged. In addition, measuring personal recovery is complex and, in the absence of a validated recovery scale, we had to rely on the imperfect proxy measures available to us to make an assessment of subjective personal recovery. Finally, although non-responders were similar to Wave 2 participants on many Wave 1 measures, including clinical and functional profiles, some of the differences observed suggest a more complex socio-behavioural profile for non-responders.
Mental health outcomes
We found evidence of symptomatic recovery, with falls in the proportions experiencing key positive and negative symptoms of psychotic illness, depressed mood/loss of pleasure and suicidal ideation. Comparison data from shorter term prevalence (not first episode) studies are hard to come by; however, a 5-year follow-up study of an older Dutch sample (mean age 66.0 years) also reported reductions in positive and negative symptoms (Lange et al., 2019). Given the improved symptom profile, it was surprising that more participants were rated as having a poorer course of disorder at Wave 2. This may be because symptoms were assessed over the year prior to interview while course of disorder was rated on the lifetime pattern of episodes of illness. Cognitive ability, which affects symptomatic and functional recovery, did not deteriorate over time in contrast to findings reported elsewhere (Fett et al., 2019; Hedman et al., 2013). Although the interval between tests was relatively short, the absence of decline in a sample that is also ageing is a positive outcome. However, a recent study found that decline in cognitive function varies across domains and may not hold for speed of processing which was the domain assessed in our study (Zanelli et al., 2019).
Overall functional recovery, as assessed by MSIF and PSP, was variable. The proportion with normal quality of self-care did not decline, while the proportion with a normal level of social drive rose. Fewer were without any friends, but fewer also had regular contact with their families. The latter may again reflect some ageing of the sample as well as changes in housing arrangements, with participants moving out of the family home and into rental accommodation. Of interest, in the general population, the size of social networks decreases with age, reflecting a reduction in peripheral ties in favour of closer, high-quality ties (English and Carstensen, 2014): more research is needed to see whether similar patterns are found for people with psychotic illness. Among other objective measures of functional recovery, workforce participation rates dropped significantly. The significant drop in employment is of concern. Not only was this in contrast to a rise in WA population employment rates, but the proportion in employment dropped in all age groups: 18–34, 35–44 and over 44 years of age. Intervention studies show that employment has a positive effect on many outcomes, including mental health, quality of life and community integration (Drake et al., 2013) and that Individual Placement and Support schemes are effective in improving employment outcomes in people with severe mental illness (Modini et al., 2016). Conversely, unemployment exacerbates related negative social determinants of outcome including financial hardship, reduced social participation, loneliness and loss of esteem, which were among the top challenges for our participants at both waves (Morgan et al., 2017).
Some indicators of personal recovery showed improvement. Significantly more participants experienced normal enjoyment of and interest in life, and felt in control over life events. There was no significant decline in the Assessment of Quality of Life (AQOL) utility score or our other proxy measures of personal recovery. Moreover, at Wave 2, three out of five participants (60.8%) believed their circumstances had improved over the past 12 months while four out of five (82.6%) believed they would improve further in the next 12 months. Critically, the top challenges that people with psychotic illness said they faced were not their uncontrolled symptoms of mental illness (ranked fifth) but, in rank order, financial problems, poor physical health, loneliness and social isolation, and lack of employment. Most of these are social determinants of outcome and addressing them is of paramount concern to improving rates of personal recovery.
Physical health outcomes
Physical health was the second top-ranked challenge for participants, endorsed by 40.0% at Wave 2 compared to 28.4% at Wave 1. While this may be due partly to a decline in metabolic health, arguably, it may also reflect growing awareness of the importance of and entitlement to good physical health. Recent studies, reports and guidelines (see, for example, Galletly et al., 2012b, 2016; Harris et al., 2018; Lambert et al., 2017; Morgan et al., 2017; National Mental Health Commission, 2016) have enumerated the level of poor physical health in people with a psychotic illness and have advocated that good physical health – and the right to physical health care – is as relevant to quality of life and treatment needs as mental health, raising awareness among those with lived experience and providing an imperative for changes in policy and service provision.
There were signs of improvement on a number of other physical health parameters. While the proportion with metabolic syndrome rose, the proportion crossing criterion thresholds for plasma glucose and HDL-C fell. Most likely, the increase in abdominal obesity contributed to the rise in metabolic syndrome. Encouragingly, treatment of cardiometabolic risk factors had increased for those with elevated plasma glucose, low HDL-C and high blood pressure. One contributing factor may be the rise in the proportions attending outpatient/community clinics and general medical practices for physical health–related reasons and receiving treatment. Moreover, almost half of all participants (48.9% – data not reported) indicated that a doctor or health professional had discussed physical activity with them in the past year. This may go some way to explain the significant increase in levels of physical activity. In turn, general population intervention studies have shown that increasing physical activity has a positive impact on metabolic parameters (Pattyn et al., 2013). However, the proportions who were at risk and untreated still remain unacceptably high at 56.4% (elevated plasma glucose), 69.6% (low HDL-C), 69.9% (elevated triglycerides) and 74.6% (elevated blood pressure). Reassuringly for future gains, very few participants had poor health literacy, in keeping with independent findings (Galletly et al., 2012a). Disappointingly, there were no significant changes in substance use over waves, with rates highly elevated compared to general population rates. The concern remains that these are important behavioural risk factors for both poor physical and mental health.
Service utilisation
Some important changes emerged in service utilisation. While there was no significant difference in the proportion with at least one psychiatric admission (a little over one in four), for those who had been admitted, there was a sharp increase in the proportion with more than one admission, rising from 32.7% to 50.0% over waves. Overall, the proportion accessing mental health outpatient/community clinics, although high, dropped significantly while the percentage with physical health checks at outpatient services had doubled. The proportion accessing NGO services rose but was still low at 38.4%. General practice attendance, both for mental health and physical health visits, increased significantly over waves to an overall of 89.2%. This is not unexpected, given policy changes advocating primary sector involvement in the care of people with severe mental illness. The drop in the proportion receiving case management in the previous 12 months is of some concern. It is likely to reflect the shift in mental health care delivery to the primary care sector and may explain the increase in emergency department attendances and inpatient admissions. In addition, significantly fewer had participated in community rehabilitation programmes, had received psychosocial interventions or had carer support over the past year. These changes are likely to impact adversely on functional and personal recovery in particular, and further investigation is warranted to understand why access to and/or uptake of these resources has fallen rather than increased in face of guidelines advocating their effectiveness in the coordination of care for and treatment of people with psychotic disorders (Galletly et al., 2016; Harvey et al., 2019; National Institute for Health and Care Excellence (NICE), 2014).
It is possible that increased use of primary health care providers has opened a gap in care management affecting, among others, the provision of services beyond symptom control, with GPs ill-placed both role-wise and time-wise to undertake these extra demands. Of relevance, three-quarters of participants’ GPs who were surveyed in SHIP Wave 1 said they were prepared to take the key role in managing the psychiatric care of their patients with a psychotic disorder, if psychiatric support was readily available. However, a similar proportion reported recurring difficulties interfacing with mental health services (Waterreus and Morgan, 2018). The extent to which this has changed remains unclear.
Conclusion
Outcomes for Western Australian SHIP participants 2–6 years after their first interview were variable. There was some improvement in mental health across a number of recovery measures and little indication of marked decline. While rates of metabolic syndrome increased, fewer were at-risk of elevated blood glucose and low HDL-C. In particular, there were marked decreases in the proportion at risk and not on treatment for these same criteria, as well as high blood pressure. Despite this, the proportion not receiving treatment and at risk remains unacceptably high, especially for a sample in frequent contact with treatment services. While a shift to an increased use of GPs services was expected, the sharp decline in access to community rehabilitation, psychosocial interventions and case management is of great concern and augurs poorly for recovery-oriented practice. Undermining both mental and physical health recovery were social determinants of outcome including financial problems, which was the top-ranked challenge for participants at both waves.
Supplemental Material
SHIPWAve2_Paper1Descriptive_ANZJP_SupplementaryMaterial – Supplemental material for Mental health recovery and physical health outcomes in psychotic illness: Longitudinal data from the Western Australian survey of high impact psychosis catchments
Supplemental material, SHIPWAve2_Paper1Descriptive_ANZJP_SupplementaryMaterial for Mental health recovery and physical health outcomes in psychotic illness: Longitudinal data from the Western Australian survey of high impact psychosis catchments by Vera A Morgan, Anna Waterreus, Taryn Ambrosi, Johanna C Badcock, Kay Cox, Gerald F Watts, Gordon Shymko, Ajay Velayudhan, Milan Dragovic and Assen Jablensky in Australian & New Zealand Journal of Psychiatry
Footnotes
Acknowledgements
We acknowledge the contribution of Wave 2 interviewers Jenny Griffith and Kim Pedler, data entry staff Hannah Castle, Joshua Castle and Samantha Poulsen, and IT developer Matt Walsh. We thank the leadership and staff of Mental Health Services in South and North Metropolitan Health Services who supported this study, and all our participants who gave their time and shared their experiences.
Declaration of Conflicting Interests
The author(s) declared no potential conflicts of interest with respect to the research, authorship and/or publication of this article.
Ethical Approval
The study was approved by the following institutional human research ethics committees: University of Western Australia (RA/4/1/6272), North Metropolitan Health Services Mental Health (08_2013), South Metropolitan Health Services (N/13/61) and Department of Health and Ageing (18/2013). All participants provided written, informed consent prior to participation in this study.
Funding
The author(s) disclosed receipt of the following financial support for the research, authorship, and/or publication of this article: Wave 2 of this study was funded by the National Health and Medical Research Council (APP1046729). Wave 1 was funded by the Australian Government Department of Health and Ageing, North Metropolitan Health Services Mental Health (Western Australia) and the Western Australian Mental Health Commission.
Supplemental Material
Supplemental material for this article is available online.
References
Supplementary Material
Please find the following supplemental material available below.
For Open Access articles published under a Creative Commons License, all supplemental material carries the same license as the article it is associated with.
For non-Open Access articles published, all supplemental material carries a non-exclusive license, and permission requests for re-use of supplemental material or any part of supplemental material shall be sent directly to the copyright owner as specified in the copyright notice associated with the article.