
Abstract
Objective:
Since only 30% or fewer of individuals at clinical high risk convert to psychosis within 2 years, efforts are underway to refine risk identification strategies to increase their predictive power. The clinical high risk is a heterogeneous syndrome presenting with highly variable clinical symptoms and cognitive dysfunctions. This study investigated whether subtypes defined by baseline clinical and cognitive features improve the prediction of psychosis.
Method:
Four hundred clinical high-risk subjects from the ongoing ShangHai At Risk for Psychosis program were enrolled in a prospective cohort study. Canonical correlation analysis was applied to 289 clinical high-risk subjects with completed Structured Interview for Prodromal Syndromes and cognitive battery tests at baseline, and at least 1-year follow-up. Canonical variates were generated by canonical correlation analysis and then used for hierarchical cluster analysis to produce subtypes. Kaplan–Meier survival curves were constructed from the three subtypes to test their utility further in predicting psychosis.
Results:
Canonical correlation analysis determined two linear combinations: (1) negative symptom and functional deterioration-related cognitive features, and (2) Positive symptoms and emotional disorganization-related cognitive features. Cluster analysis revealed three subtypes defined by distinct and relatively homogeneous patterns along two dimensions, comprising 14.2% (subtype 1, n = 41), 37.4% (subtype 2, n = 108) and 48.4% (subtype 3, n = 140) of the sample, and each with distinctive features of clinical and cognitive performance. Those with subtype 1, which is characterized by extensive negative symptoms and cognitive deficits, appear to have the highest risk for psychosis. The conversion risk for subtypes 1–3 are 39.0%, 11.1% and 18.6%, respectively.
Conclusion:
Our results define important subtypes within clinical high-risk syndromes that highlight clinical symptoms and cognitive features that transcend current diagnostic boundaries. The three different subtypes reflect significant differences in clinical and cognitive characteristics as well as in the risk of conversion to psychosis.
Introduction
Clinical high risk (CHR) for psychosis is most typically defined as a prodromal syndrome characterized by attenuated or transient positive symptoms (e.g. hallucinations, delusions and disorganized thinking) in which some reality testing is preserved (Miller et al., 2002; Yung et al., 1998). However, the CHR concept has been criticized because these syndromes are highly heterogeneous with respect to symptoms that are common to many mental disorders (i.e. anxiety/depression) rather than to just psychosis (Van Os and Guloksuz, 2017). Moreover, critics have suggested that the outcome of CHRs is also highly variable, the conversion rate reported in the literature has declined in more recent years (Hartmann et al., 2016; Nelson et al., 2016; Yung et al., 2007), and there is frequent co-occurrence with other psychiatric disorders (Schultze-Lutter et al., 2018a, 2018b). Such heterogeneity suggests that there are likely multiple subtypes of CHR that remain poorly understood.
Symptoms (Fusar-Poli et al., 2016; Ryan et al., 2017; Valmaggia et al., 2013) and cognitive features (Healey et al., 2018) have been used to define clinical subtypes that could address the heterogeneity among CHR subjects and help to differentiate between outcomes. To group homogeneous CHR subjects in such heterogeneous samples, latent class cluster analysis (LCCA) has been applied to CHR samples in three recent studies (Healey et al., 2018; Ryan et al., 2017; Valmaggia et al., 2013). The first study by Valmaggia et al. applied a LCCA to symptom scores from the Comprehensive Assessment of At-Risk Mental States in 318 subjects (Yung et al., 2005). Four subtypes were identified, including subtype 1 (mild), subtype 2 (moderate), subtype 3 (moderate-severe) and subtype 4 (severe). Subjects classified in subtype 4 had the highest transition risk for psychosis (41.2%) and were characterized by the most severe negative symptoms and the poorest general functioning. Healey et al. (2018) recently extended this model by adding cognitive variables and replicated the previous finding by identifying a subtype with the highest negative symptoms and cognitive impairment. Ryan et al. (2017) applied a LCCA to symptom ratings from the North American Prodrome Longitudinal Study (NAPLS) 1 and 2 (NAPLS-1 [n = 356] and NAPLS-2 [n = 737]). They also reported that the most informative symptoms regarding these subtypes were negative and cognitive symptoms.
Thus far, most efforts to characterize CHR clinical subtypes have used the LCCA method, which treats clinical symptoms and cognitive functions as independent variables. However, the current literature shows that psychotic symptoms and cognitive deficits co-occur in group data (Seidman et al., 2010, 2016; Wood et al., 2007; Zhang et al., 2018a). An alternative to grouping subjects on the basis of co-occurring clinical symptoms is to identify cognitive subtypes by clustering subjects according to shared signatures of cognitive dysfunction. This type of approach has already been applied in depression samples, where novel subtypes of depression were identified by both a canonical correlation analysis (CCA) and a hierarchical clustering method, using clinical symptoms and resting-state connectivity from functional magnetic resonance imaging (Drysdale et al., 2017). Similar subtypes have been identified in psychotic disorders as well, using K-means clustering (Clementz et al., 2016). In contrast to the methods of previous LCCA studies, the underlying goal of using CCA is to identify the linear combinations of these two sets of variables to be maximally correlated with each other. Since clinical and cognitive features are two sets of co-related variables, CCA-based subtype clustering has a significant advantage over previous studies using LCCA.
To this end, this study applied, for the first time, a CCA method for defining CHR subtypes by clustering CHR subjects according to the patterns of relationship (canonical variates) between clinical symptoms and cognitive dysfunctions in a large group of prospectively identified CHR individuals. We further tested whether or not the CCA-derived subtypes differed with regards to demographics, clinical symptoms, cognitive performance and outcome regarding conversion to psychosis.
Methods
Sample and projects
The sample used for this study was composed of a series of studies supported by both the US and China. Taken together, these studies aimed to identify risk for early psychosis and comprised the ShangHai At Risk for Psychosis (SHARP) program. The research ethics committees at the Shanghai Mental Health Center (SMHC) and the Beth Israel Deaconess Medical Center (Boston, Massachusetts) approved these studies. Subjects 14–35 years old were recruited for inclusion. Participants younger than 18 years of age had their consent forms signed by their parents and gave assent themselves. A total of 400 CHR subjects, with a mean age of 19 years were identified by a face-to-face interview using the Structured Interview for Prodromal Syndromes/Scale of Prodromal Symptoms (SIPS/SOPS) (Miller et al., 2002, 2003). A flow chart of the recruitment and selection process is presented in Supplementary-1 sFigure 1. Among these, 289 (72.3%) completed neurocognitive assessments using the Chinese version of the Measurement and Treatment Research to Improve Cognition in Schizophrenia (MATRICS) Consensus Cognitive Battery (MCCB) (Kern et al., 2008, 2011; Shi et al., 2013) at baseline and at follow-up at least 1 year later. All 289 CHR subjects were used to develop the clinical subtypes. Details of subjects’ baseline characteristics can be found in Supplementary-1 sTable 1. Comparisons between subjects were used for inclusion and exclusion during subtype analysis.
A SHARP team led originally by Dr Larry Seidman before his untimely passing in 2017, and who was also the Principal Investigator (PI) of the Harvard site of the NAPLS-2 project, implemented methods similar to those used in NAPLS-2 for the identification of CHR individuals in Mainland China since 2010 (Li et al., 2018; Zhang et al., 2018b, 2014). Studies were launched at only one site, the SMHC, the largest outpatient mental health clinic in China (Ren et al., 2017; Zhang et al., 2014). A key element of the SHARP sample is that all participants are psychotropically naïve when they enter the study and are assessed clinically. They have had no treatment of any kind for a psychiatric disorder. As importantly, there is also no history of substance abuse or dependence in this sample, because substance abuse is one of the exclusion criteria for CHR recruitment. See Zhang et al. (2012, 2014, 2015; Ren et al., 2017) for further details regarding SHARP methodology.
Measurements, variables, and criteria
CHR individuals were identified based on the SIPS/SOPS (McGlashan et al., 2010; Miller et al., 2002, 2003). The Chinese version (Zheng et al., 2012) of the SIPS/SOPS was translated, tested by our team members, and also demonstrated both good interrater reliability (r = 0.96, p < 0.01 on the SOPS score) and validity (26.4%, converted to psychosis in the ensuing 2 years) with a Chinese clinical population. The SIPS/SOPS consists of 19 items that assess four symptom domains: positive symptoms (scales P1–P5: P1-unusual thought content, P2-suspiciousness, P3-grandiosity, P4-perceptual abnormalities and P5-disorganized communication); negative symptoms (scales N1–N6: N1-social anhedonia, N2-avolition, N3-expression of emotion, N4-experience of emotions and self, N5-ideational richness and N6-occupational functioning); disorganized symptoms (scales D1–D4: D1-odd behavior of appearance, D2-bizarre thinking, D3-trouble with focus and attention and D4-impairment in personal hygiene); and general symptoms (scales G1–G4: G1-sleep disturbance, G2-dysphoric mood, G3-motor disturbances and G4-impaired tolerance to normal stress). Conversion to psychosis was defined using the criteria of Presence of Psychotic Symptoms (POPS) in the SIPS, where participants had to develop at least one psychotic level symptom (rated ‘6’ on the SIPS positive symptoms scale) with either sufficient frequency or duration.
The cognitive performance of CHR subjects was tested using the MCCB. The original version of the MCCB includes 10 sub tests. Previous research has demonstrated that the MCCB tests are able to identify cognitive deficits in different populations. The Chinese version of the MCCB covers 9 sub tests, excluding the Letter-Number Sequencing Test that was not adapted for use in this study, as many Chinese individuals are unfamiliar with the alphabet used in this test. The Mayer–Salovey–Caruso Emotional Intelligence Test (MSCEIT)–Managing Emotions Test included in the MCCB was excluded in current analysis due to the age limitation (the majority of CHR individuals in this study are younger than 18; Mayer et al., 2003). Therefore, the MCCB used in this study covers 8 out of the 10 subtests: Trail Making Test (TMT): Part A (TMT) (C1); Brief Assessment of Cognition in Schizophrenia (BACS) Symbol Coding Test (BACS) (C2); Hopkins Verbal Learning Test–Revised (HVLT-R) (C3); Spatial Span of the Wechsler Memory Scale-III (Spatial Span) (C4); Neuropsychological Assessment Battery: Mazes (NAB: Mazes) (C5); Brief Visuospatial Memory Test–Revised (BVMT-R) (C6); Category Fluency Test (Category Fluency) (C7); and the Continuous Performance Test-Identical Pairs Test (CPT-IP) (C8). Test–retest reliability of subtests for the Chinese version ranged from 0.73 to 0.94 (Shi et al., 2013).
Procedures
CHR individuals were referred by our clinicians and research staff. They were informed that this part of the study involved a group of clinical and cognitive assessments at baseline with a naturalistic follow-up every 6 months. This research did not impact the routine clinical treatment procedures at the SMHC. All participants from the first visit were followed up for at least 2 years after consent was obtained. Both CHR individuals and their caregivers had been informed that they could contact the interviewer and study clinicians any time for questions and progress reports regarding the patients’ medical conditions. Except for those who did not desire any further contact, the CHR individuals were re-assessed by telephone at the 6th and 18th month or by face-to-face interview at the 12th and 24th month with the SIPS. The clinical outcome determination was based mainly on face-to-face interviews (of the 289 CHRs, 168 had at least one face-to-face interview), partly from telephone interviews with CHRs or their caregivers, and based on clinical information obtained from clinician reports.
Data analysis
Correlation
Relationships between clinical symptoms and cognition at CHR baseline assessments were investigated using nonparametric correlations and CCA. Spearman-rank correlations were used to test for associations between clinical (19 items) and cognitive variables (8 items), comprising 152 combinations, in this case resulting in 41 significant correlations (Figure 1, Supplementary-1 sTable 2). We used Spearman-rank correlations because clinical variables did not fit a normal, continuous distribution. For the purpose of selecting a subset of relevant, non-redundant clinical and cognitive features, CCA was applied to identify a representation of cognitive domains that were associated with weighted combinations of clinical symptoms. CCA determines pairs of linear combinations, termed canonical variables, from two sets of variables (clinical symptoms and cognition), such that the correlation between canonical variables is maximized, and subsequent pairs are uncorrelated with previously derived linear combinations. After performing the CCA, we determined two linear combinations of cognitive features (canonical variates) that were correlated with distinct clinical-symptom combinations, which we term ‘negative symptom and functional deterioration-related cognitive features’ (Figure 2) and ‘positive symptom and emotional disorganization-related cognitive features’ (Figure 3). Bartlett’s chi-square test which was selected for the evaluation of canonical correlations, which is computed by default within CCA, was applied. The test of significance for the CCA correlation coefficient was presented as pChisq (right-tail significance level for Chisq, Chisq: Bartlett’s approximate chi-square statistic) (Mardia et al., 1979).
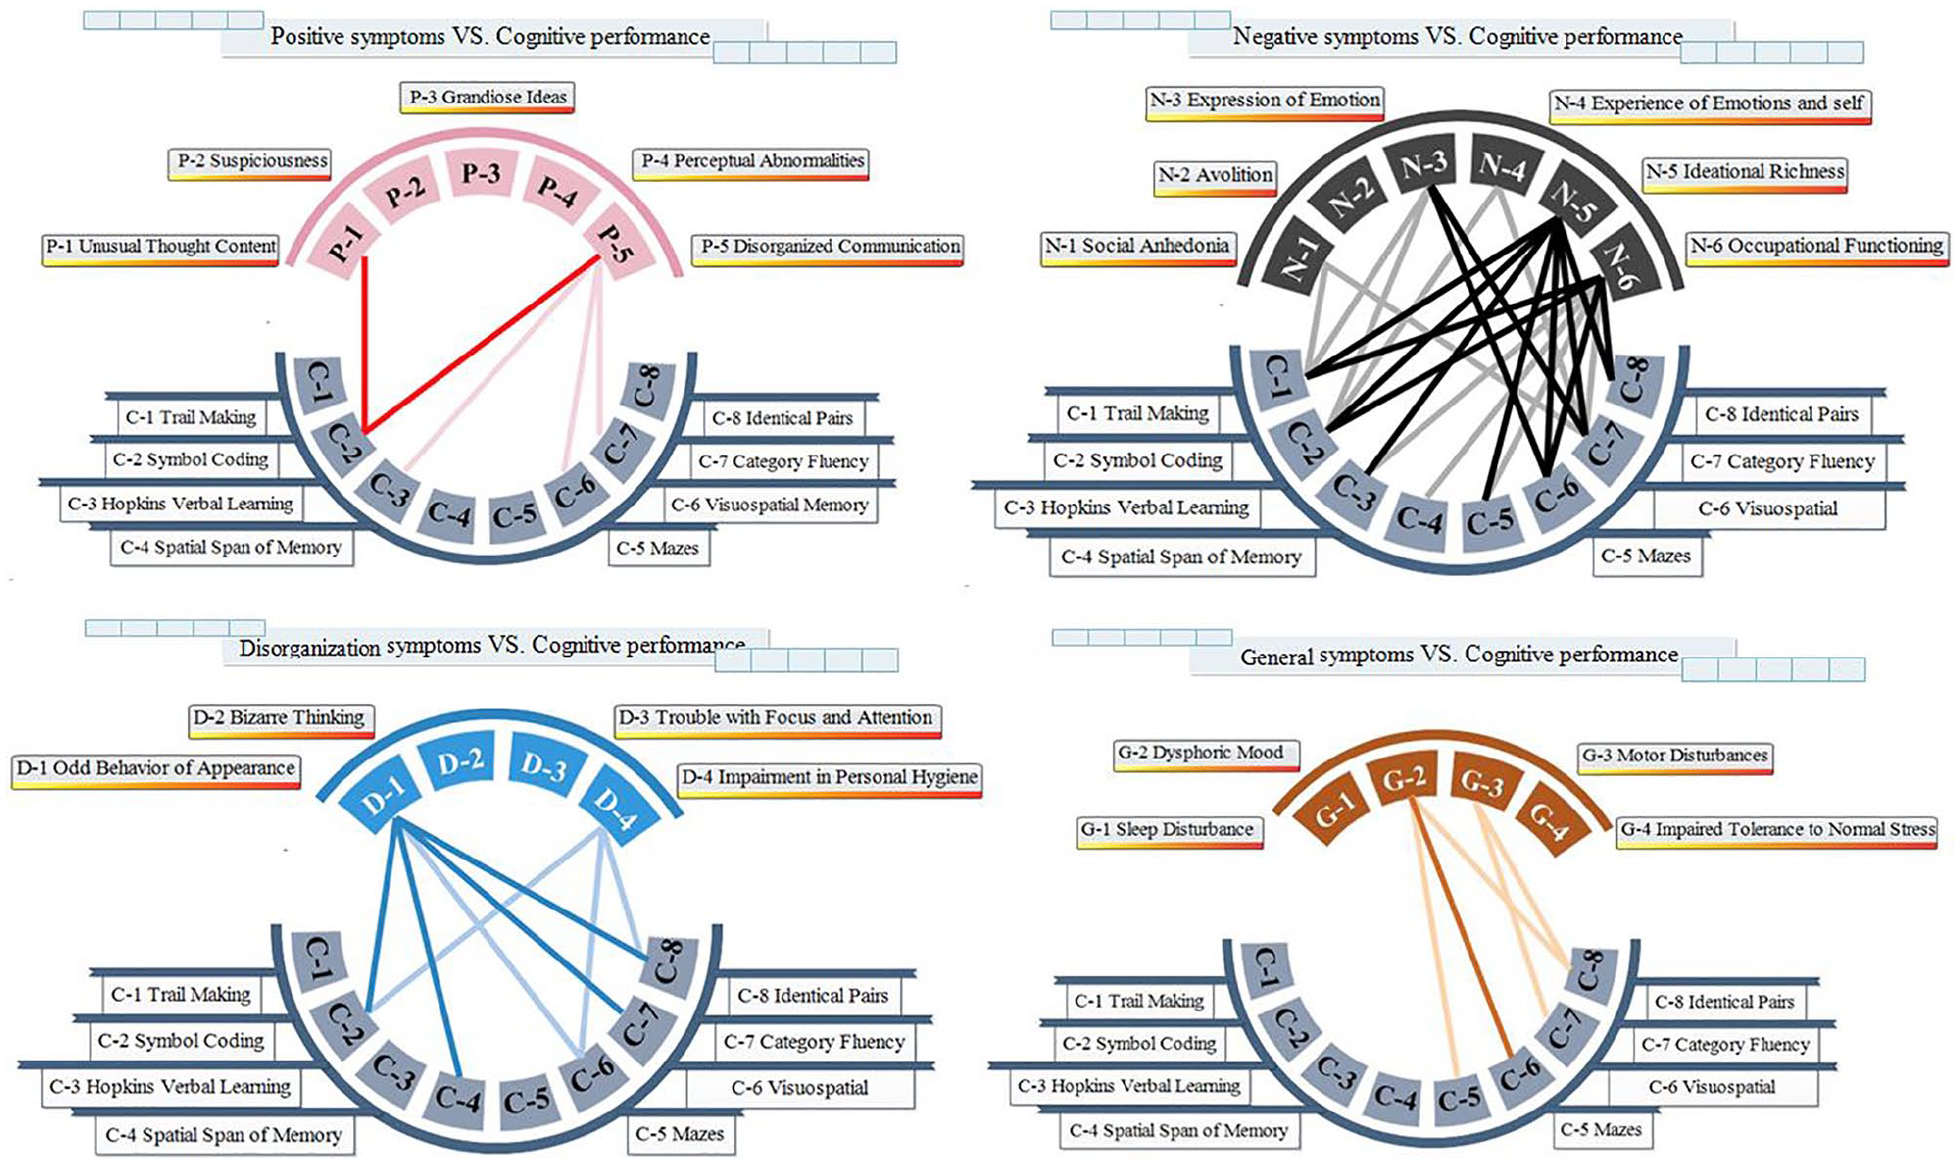
Spearman correlation between clinical symptoms and cognitive performance. The connections between clinical symptoms and cognitive performance are sized based on the p values. Bold connections indicate significant associations at p < 0.01; thin connections indicate significant associations at p < 0.05; and red, black, blue and yellow connections indicate associations between cognition and positive, negative, disorganization and general symptoms. Details of correlation coefficients can be found in Supplementary-1 sTable 2.
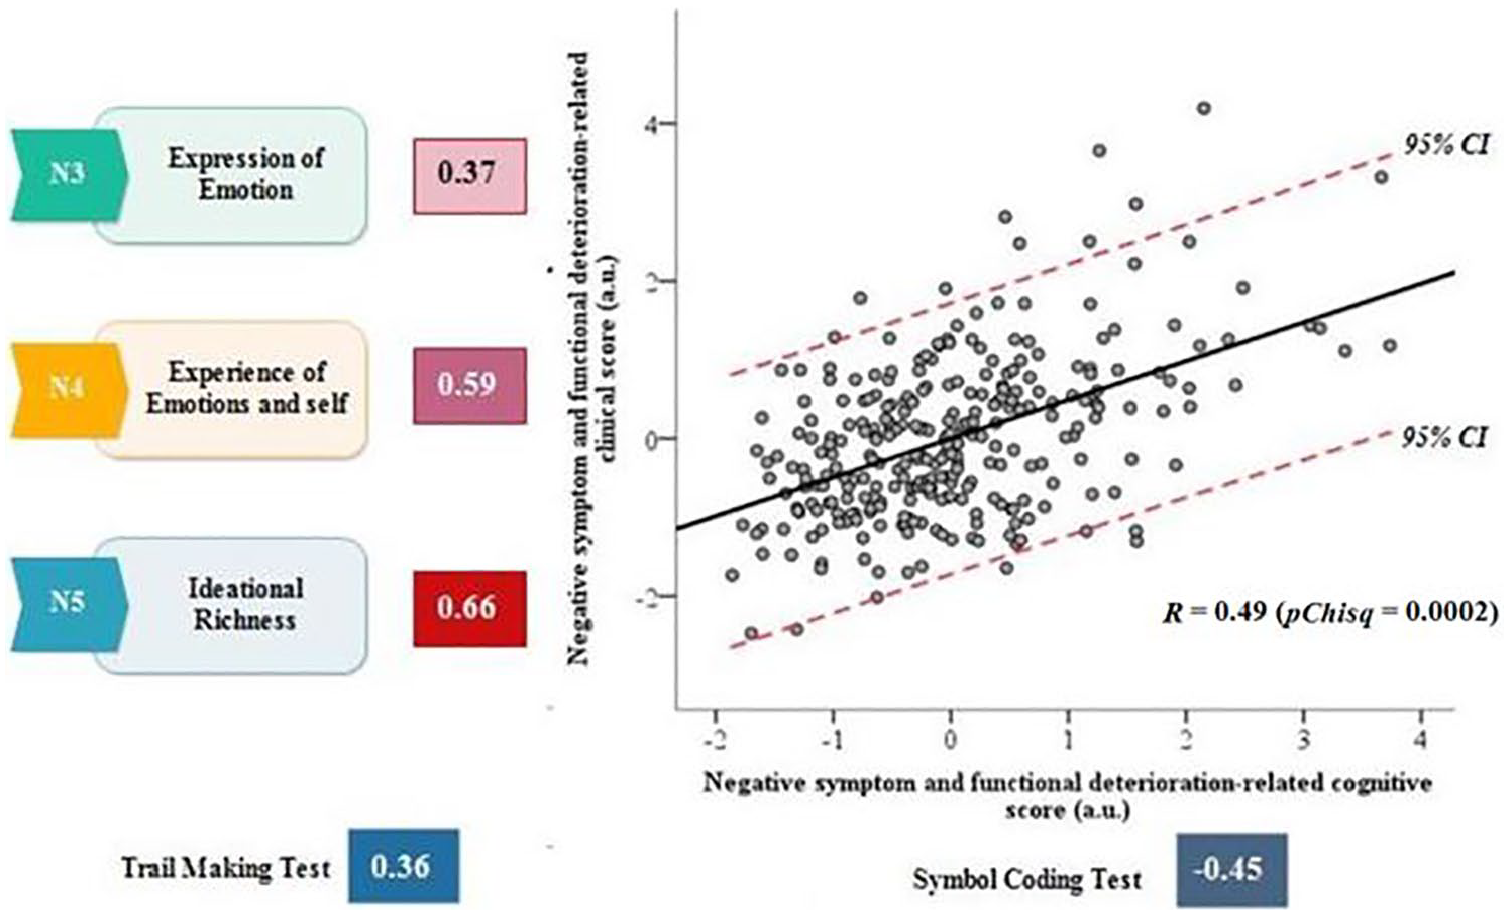
The first pair of canonical correlation between cognition features and clinical profiles (negative symptom and functional deterioration-related cognitive features). Bartlett’s chi-square test which was selected for the evaluation of canonical correlations, which is computed by default within CCA, was applied. pChisq: Right-tail significance level for Chisq, Chisq: Bartlett’s approximate chi-square statistic.
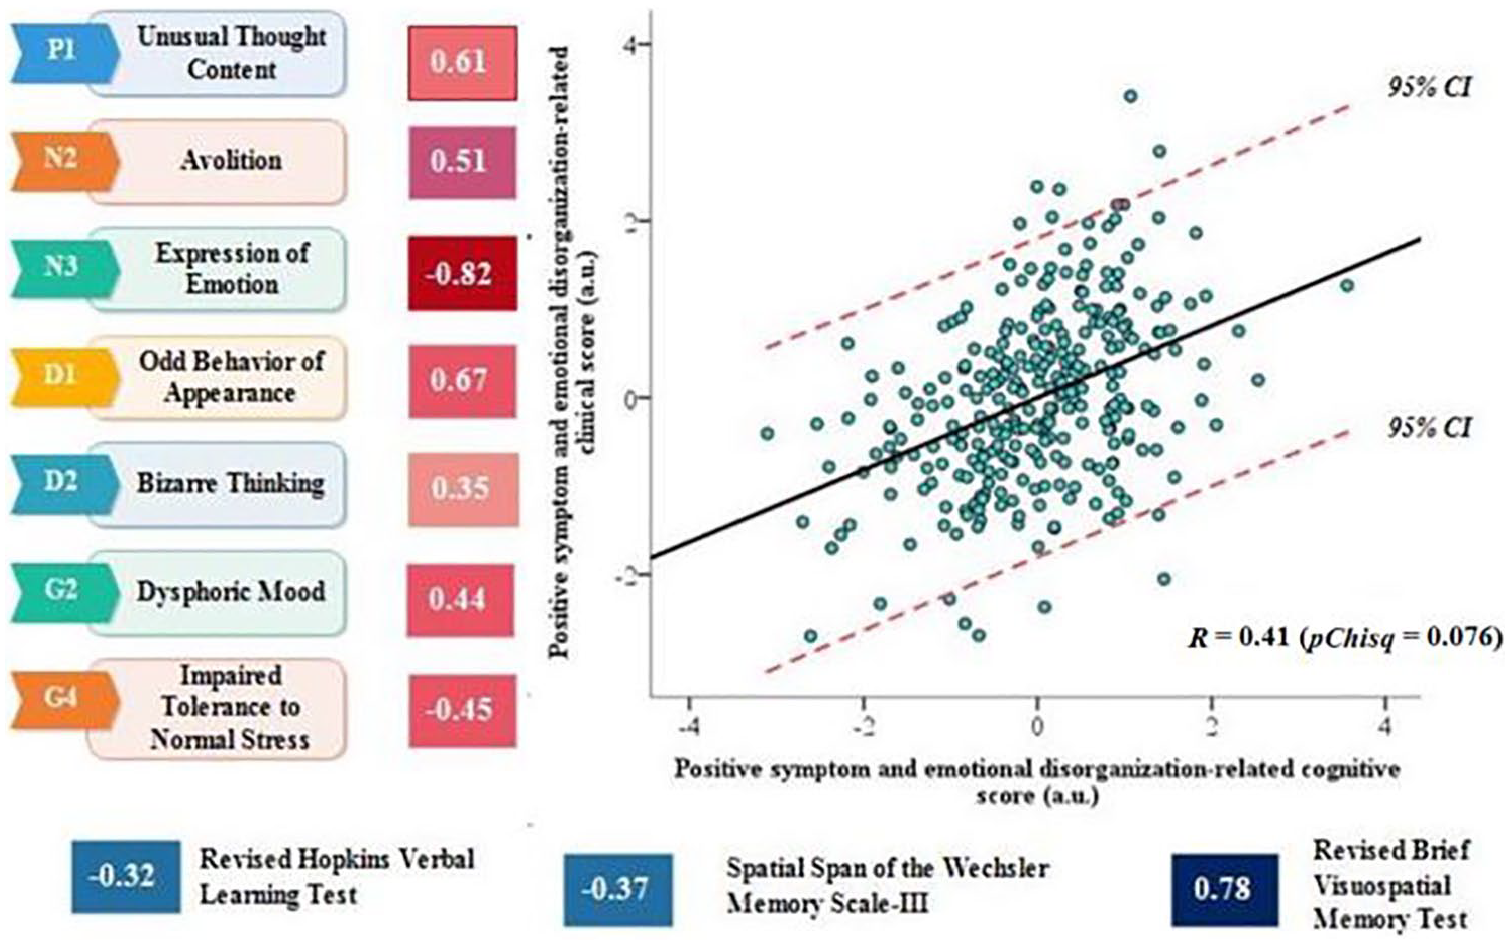
The second pair of canonical correlation between cognition features and clinical profiles (positive symptom and emotional disorganization-related cognitive features). Bartlett’s chi-square test which was selected for the evaluation of canonical correlations, which is computed by default within CCA, was applied. pChisq: Right-tail significance level for Chisq, Chisq: Bartlett’s approximate chi-square statistic.
Classification
To find clusters in this two-dimensional space of data points (each point represents an individual case), hierarchical cluster analysis was applied using MATLAB’s pdist, linkage, cluster and cluster data functions. For the current analysis, an average-linkage algorithm was used to cluster CHR individuals. Euclidean distance was used as a metric to evaluate sample similarity. This method was used in order to find clusters among the data points according to the inter-point and inter-cluster distances (Euclidean distance; Figure 4(B)). The Euclidean distance between every pair of subjects in this two-dimensional feature space was calculated, and then Ward’s minimum variance method was used to select a specific clustering from the dendrogram, iteratively linking pairs of subjects in closest proximity, forming progressively larger clusters in a hierarchical tree (Figure 4(A)). The number of clusters generated is, to a certain degree, arbitrary. However, the dendrogram (Figure 4(A)) appeared to support three major clusters in this study. Additional potential clustering solutions, indicating four or five clusters, were also evident, nested within these subgroups (see Supplementary-2 sFigure 3). Nonetheless, this three-cluster solution was optimal for summarizing relatively homogeneous subgroups that were maximally dissimilar from each other. Detailed baseline demographic, clinical and cognitive variables for the three clusters can be found in the Tables 1 and 2.
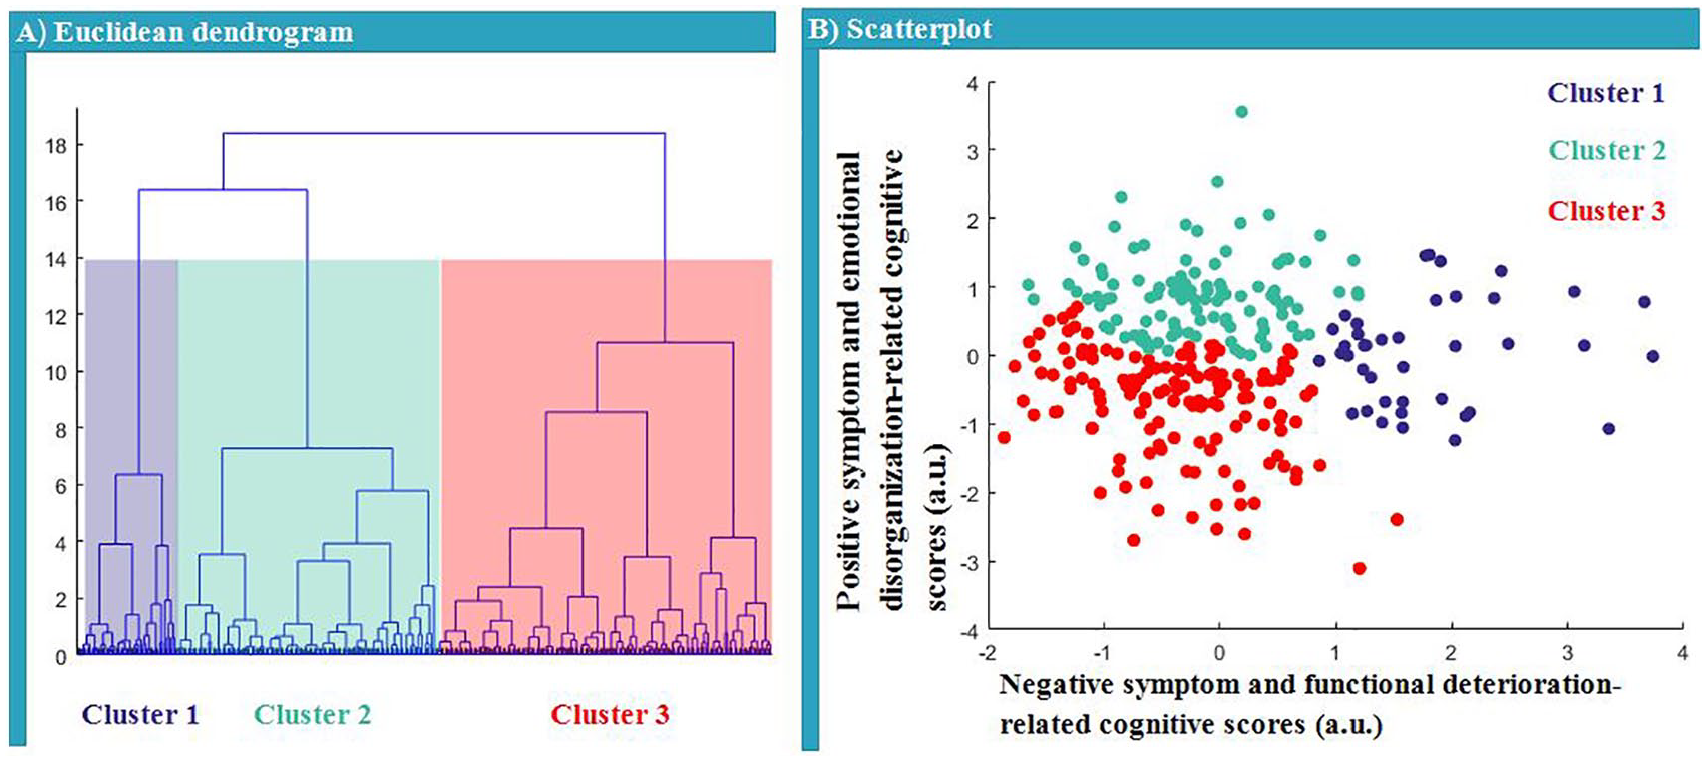
Euclidean dendrogram (A) of two canonical variates and a scatterplot (B) for the three clusters. (A) The height of each link in the resulting dendrogram represents the distance between the clusters being linked. Accordingly, a three-cluster solution is depicted by the red dashed line. (B) Three clusters of CHR individuals along the dimensions: ‘negative symptom and functional deterioration-related cognitive features’ and ‘positive symptom and emotional disorganization-related cognitive features’.
Baseline demographic, clinical and cognitive features in clinical subtypes and comparison among three clusters.
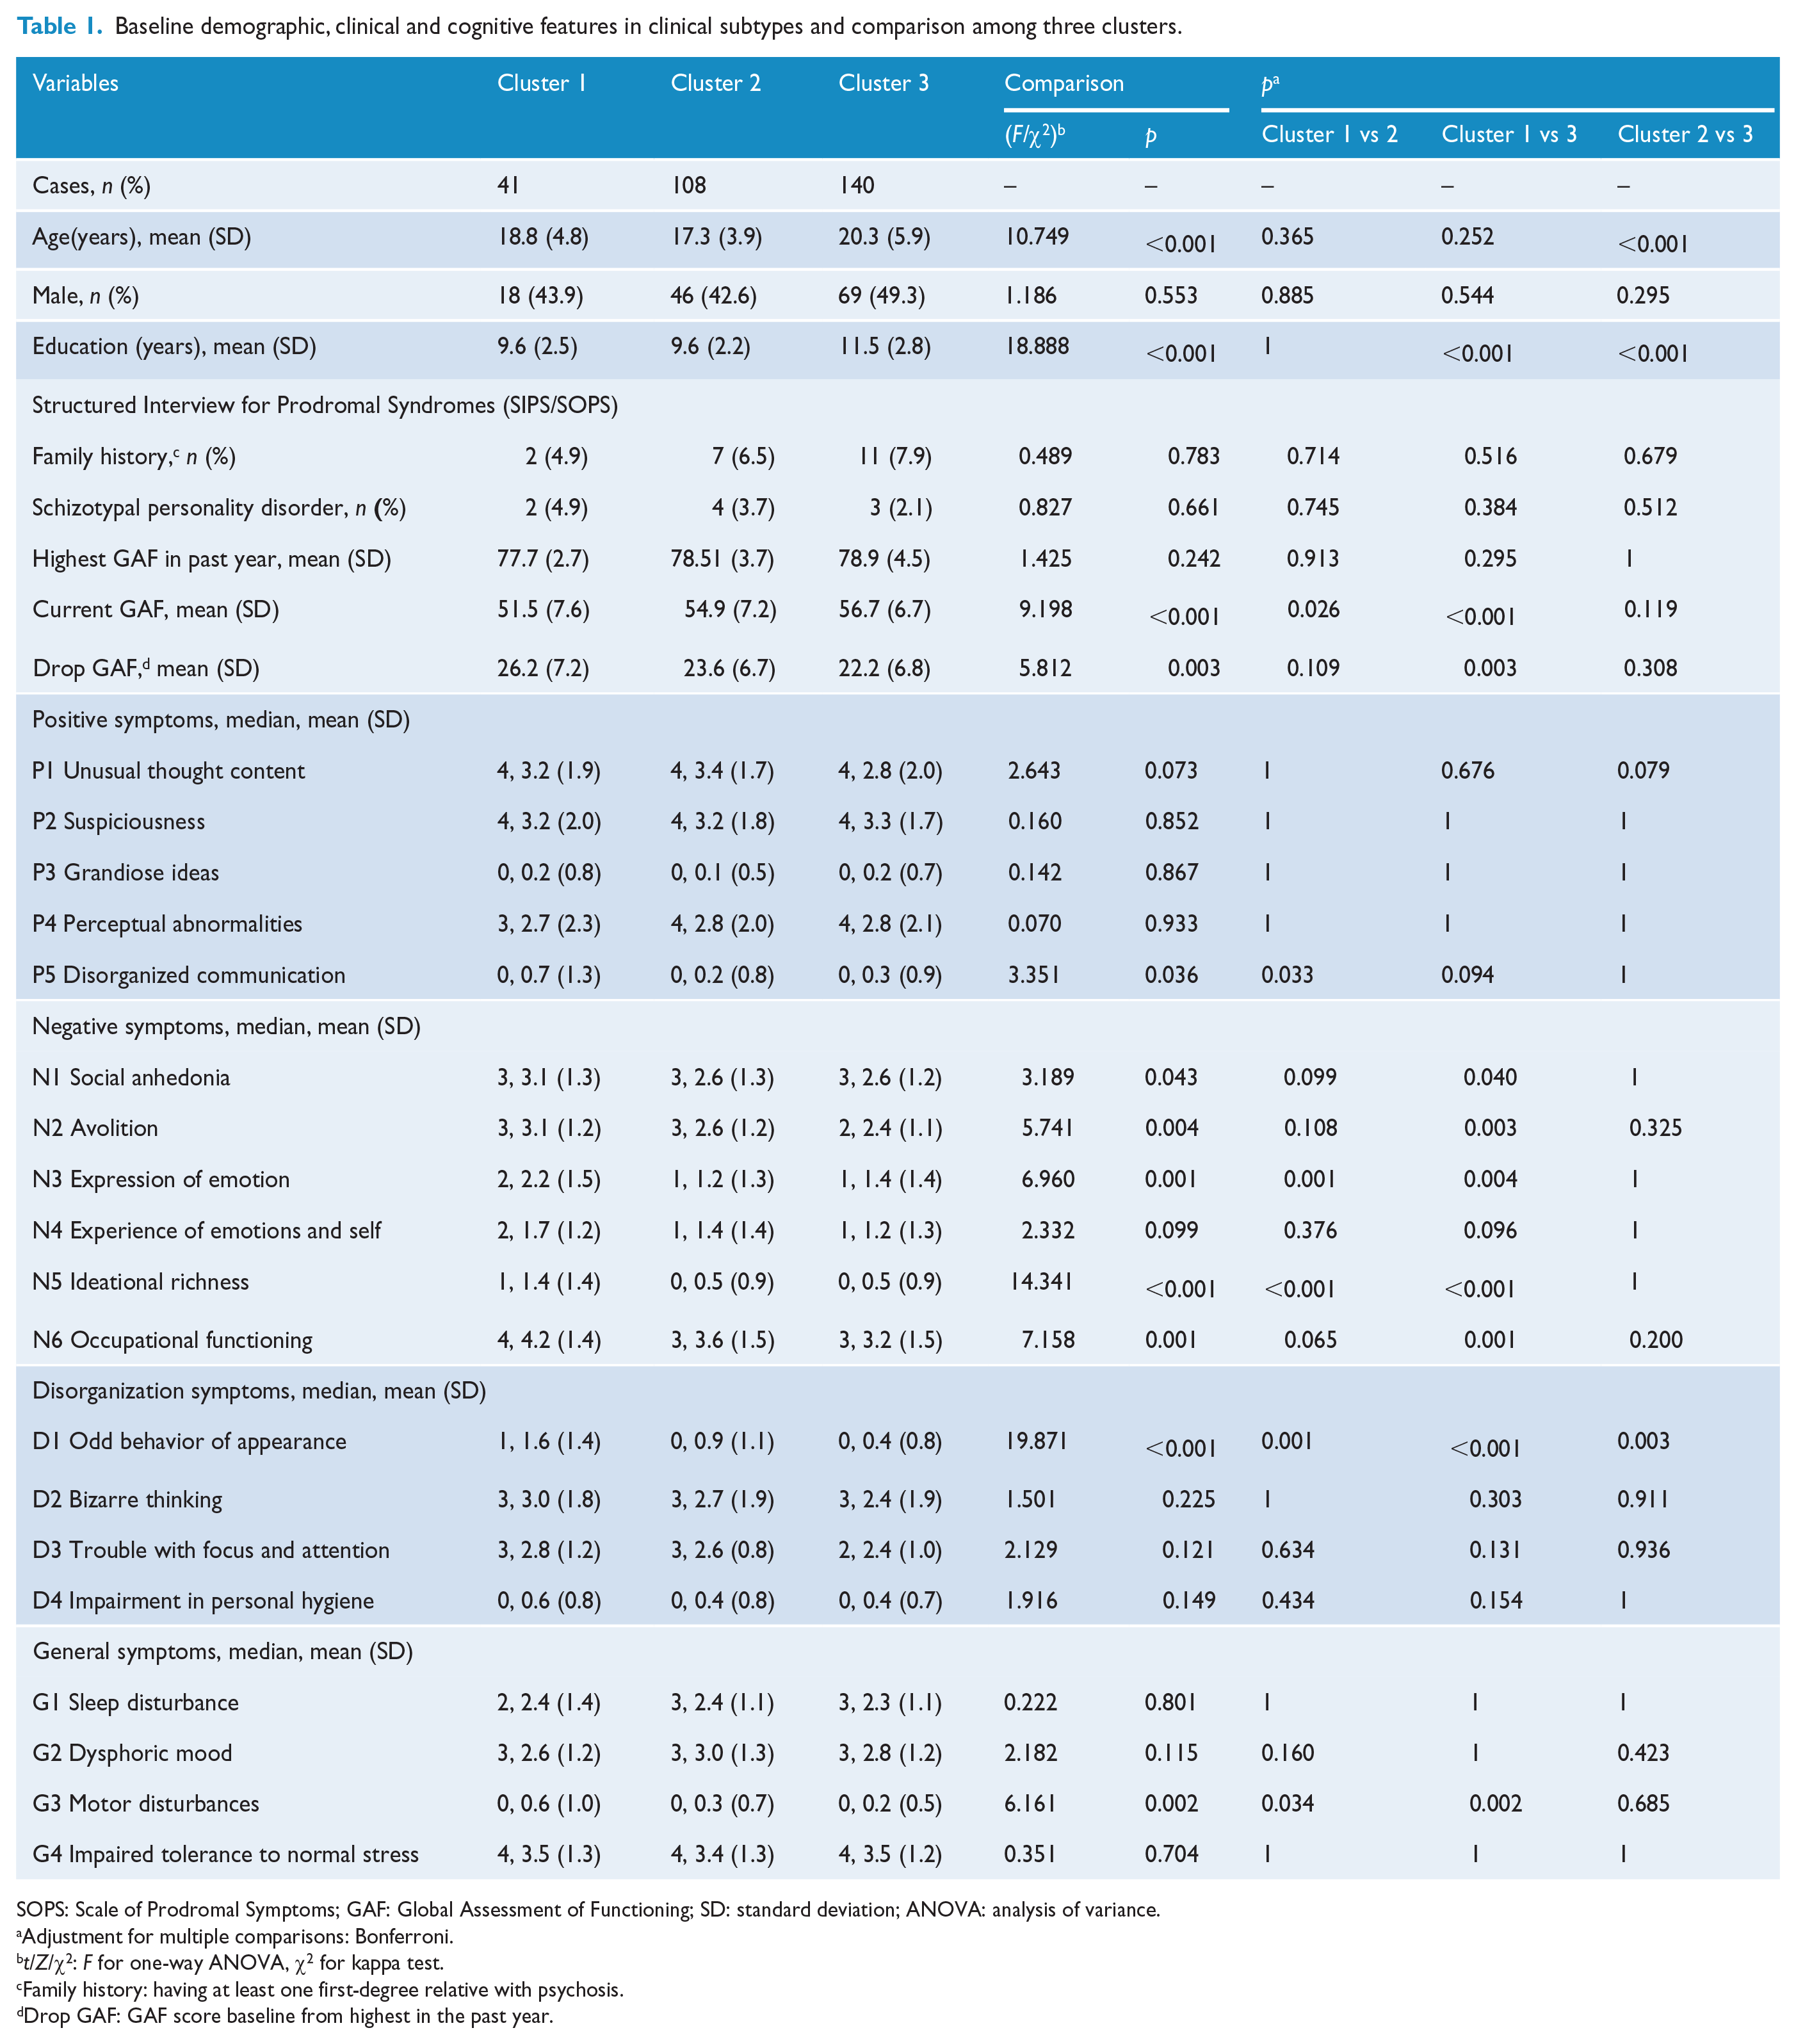
SOPS: Scale of Prodromal Symptoms; GAF: Global Assessment of Functioning; SD: standard deviation; ANOVA: analysis of variance.
Adjustment for multiple comparisons: Bonferroni.
t/Z/χ2: F for one-way ANOVA, χ2 for kappa test.
Family history: having at least one first-degree relative with psychosis.
Drop GAF: GAF score baseline from highest in the past year.
Baseline demographic, clinical and cognitive features in clinical subtypes and comparison among three clusters.
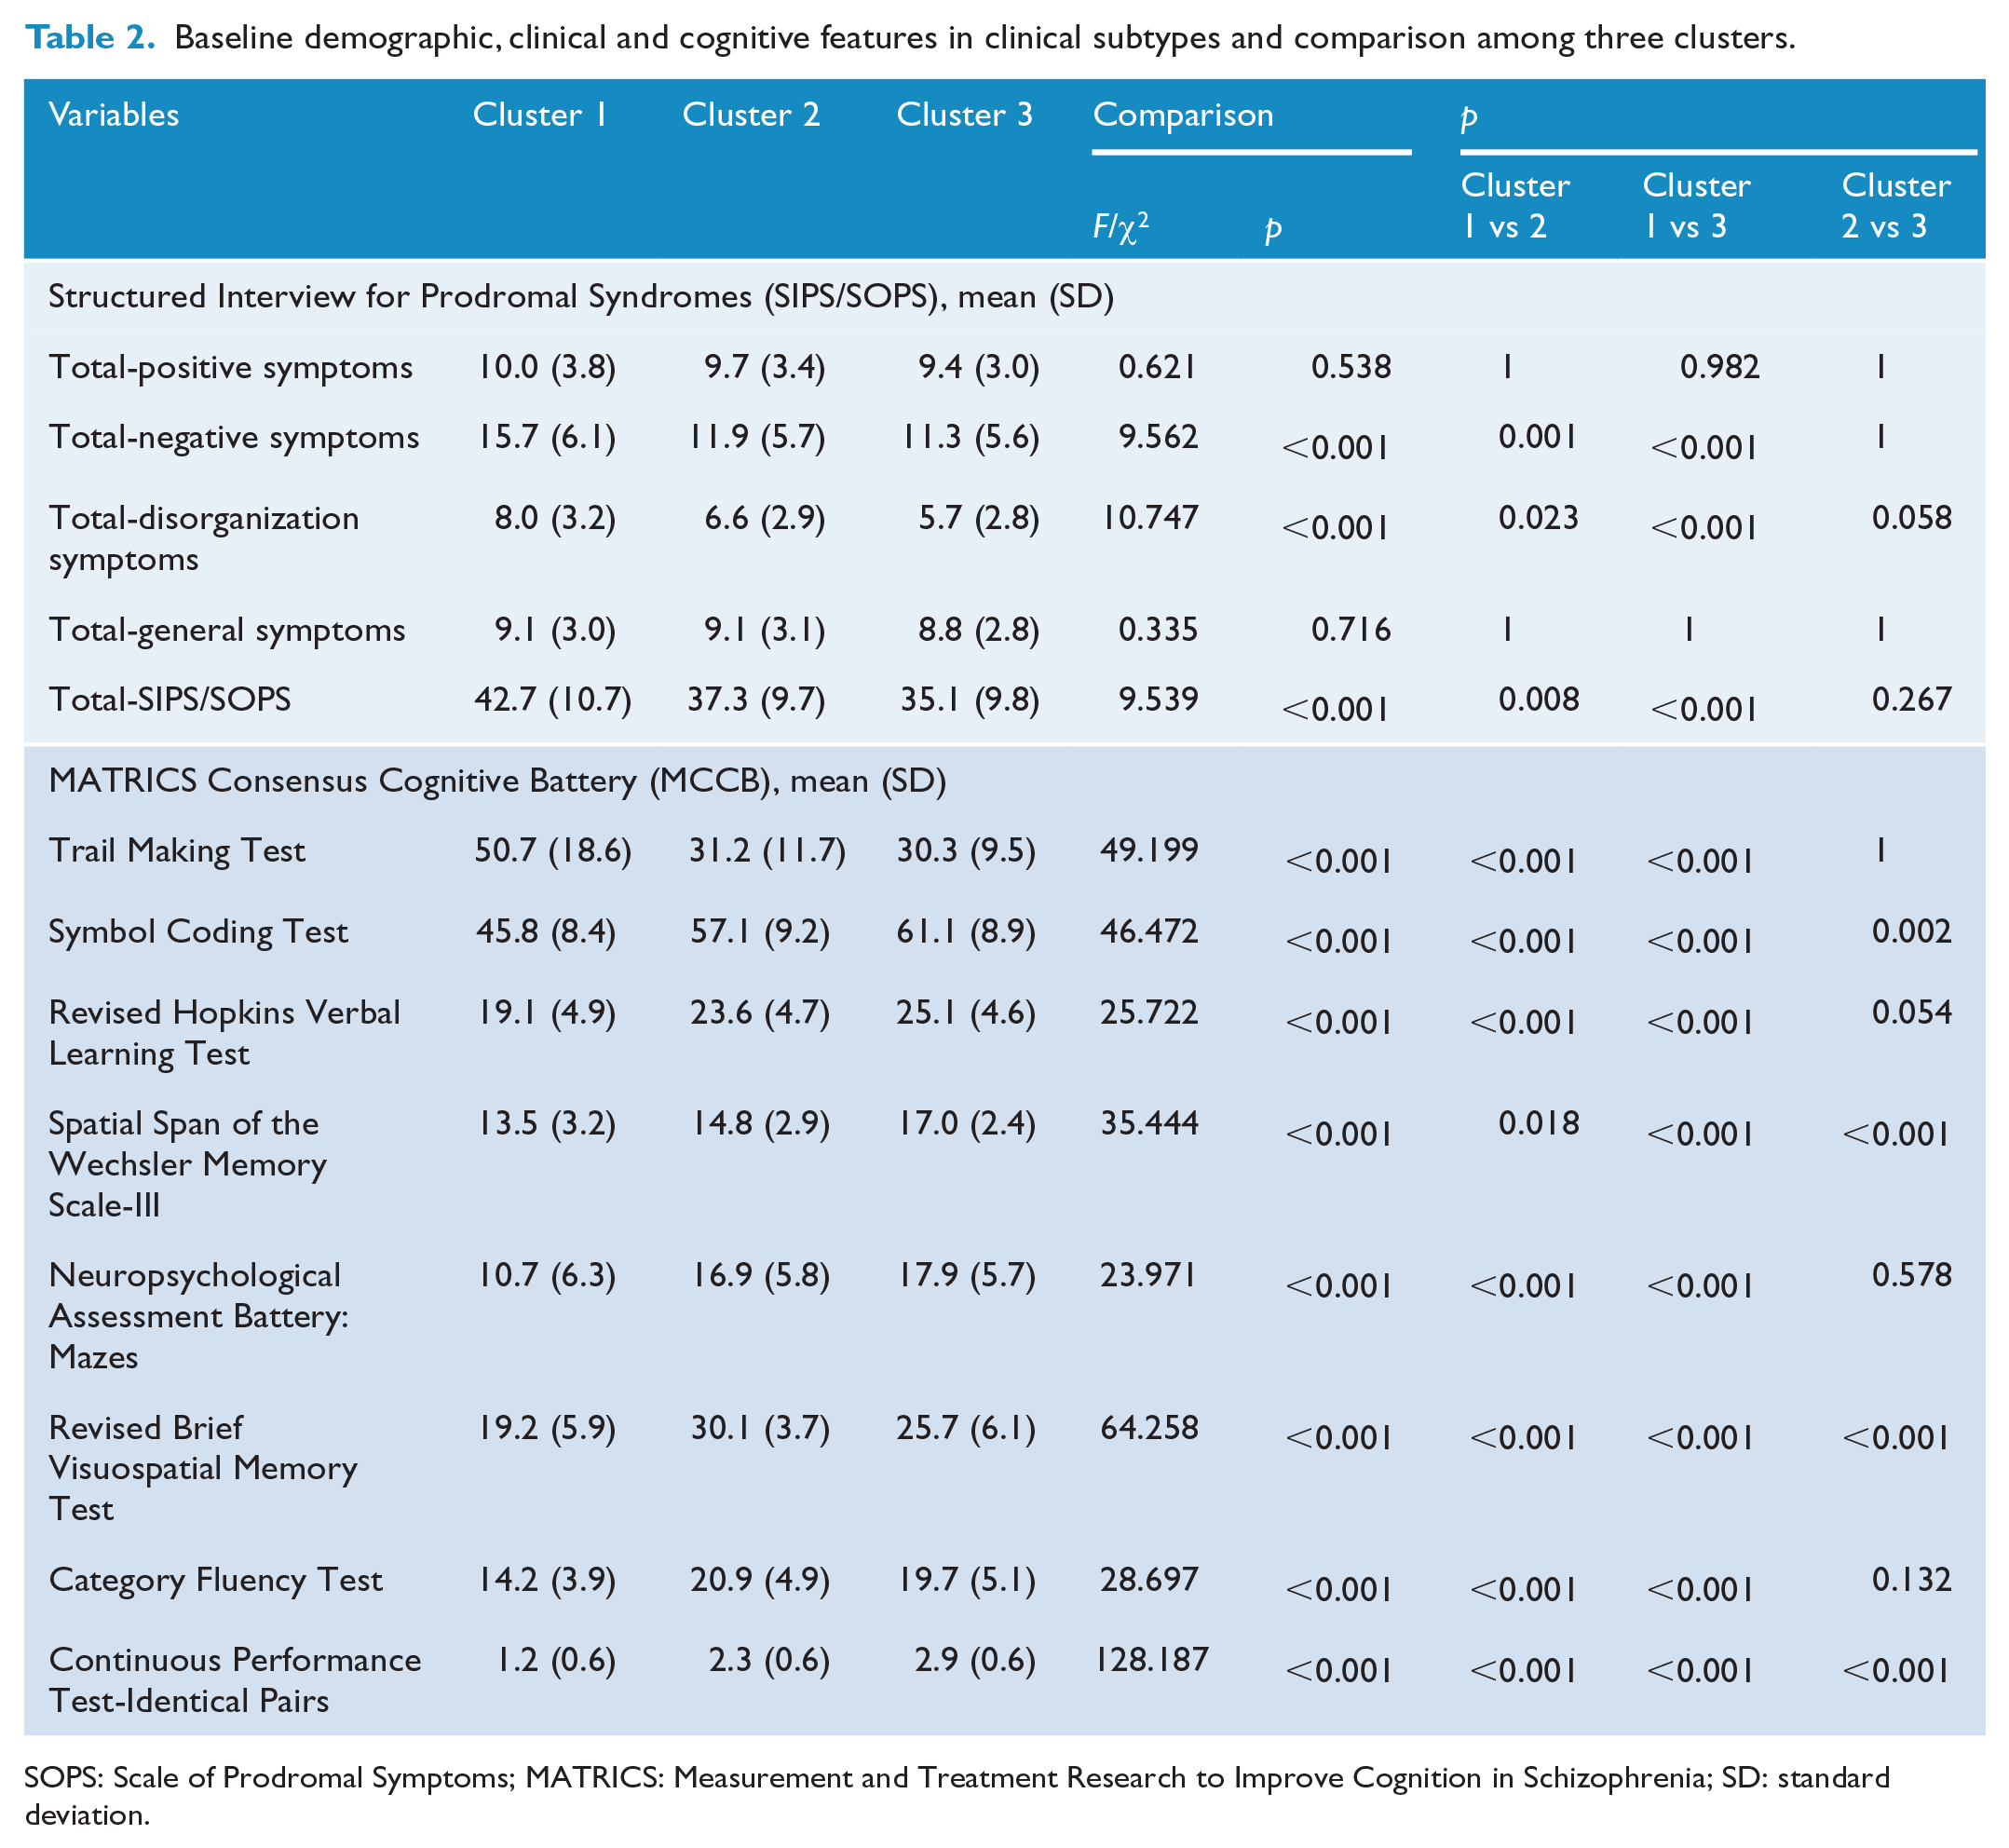
SOPS: Scale of Prodromal Symptoms; MATRICS: Measurement and Treatment Research to Improve Cognition in Schizophrenia; SD: standard deviation.
Prediction of conversion
We further assessed the utility of the extracted sub-clusters of CHR in predicting conversion of psychosis. To evaluate whether subtypes predicted conversion to psychosis, survival analysis (Kaplan–Meier) methods along with log-rank tests were performed to illustrate the relationship of this three-cluster solution to either conversion or non-conversion over time. Kaplan–Meier survival curves were plotted for each sub-cluster. The differences between survival curves were compared using a log-rank test (Figure 5).
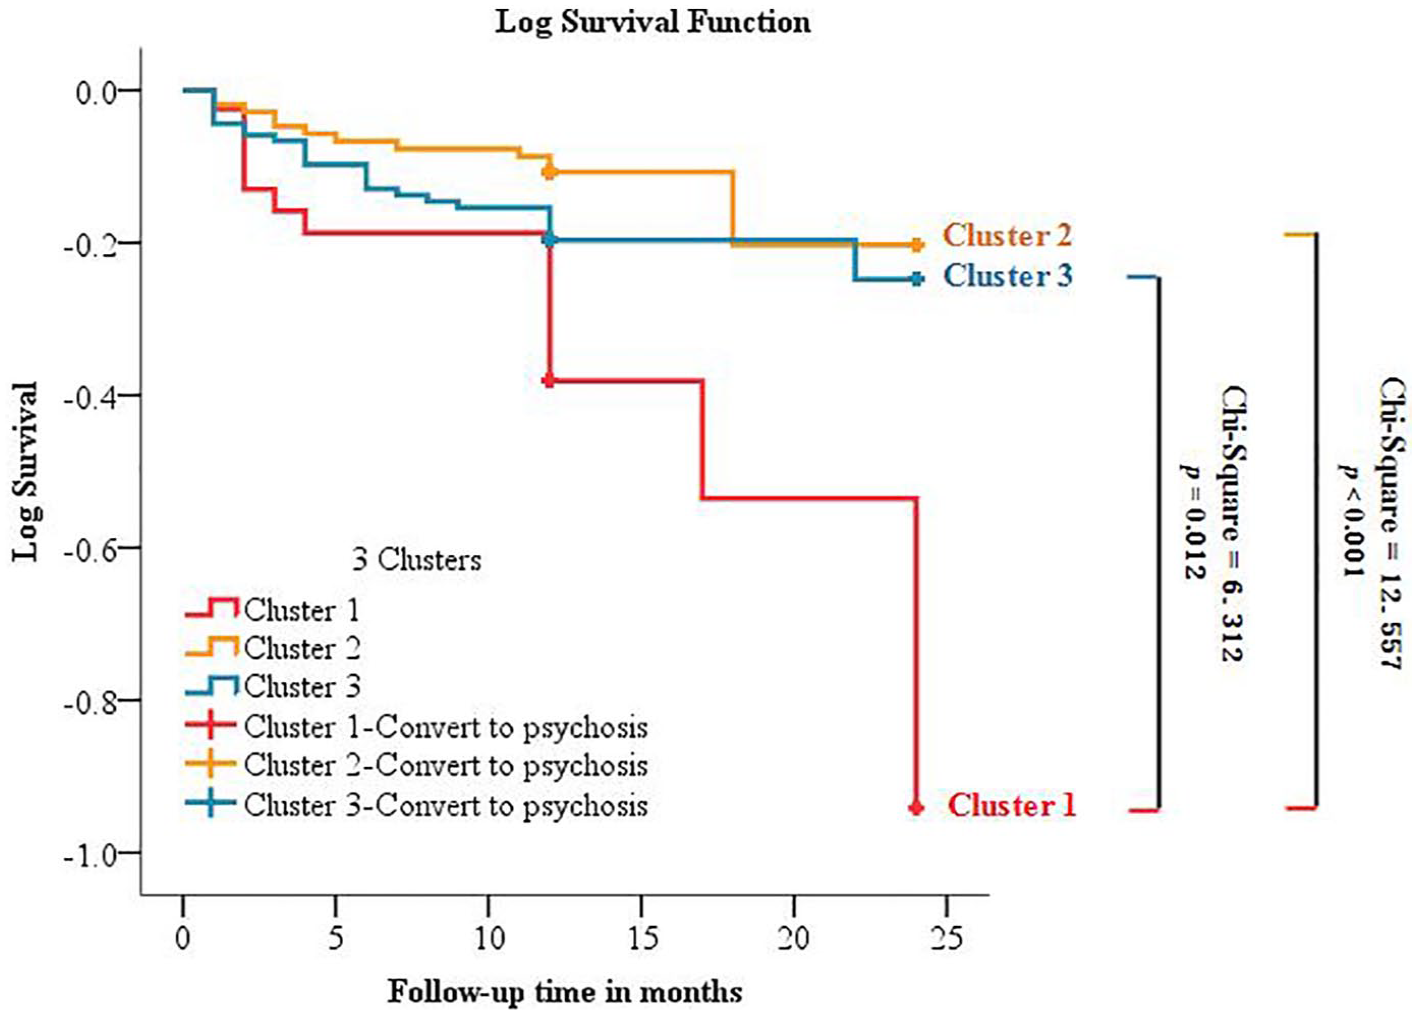
Survival curves for conversion to psychosis among the three clusters.
Results
Sample characteristics
Baseline characteristics of 289 CHR subjects are presented in the Supplementary-1 sTable 1 and sFigure 2, including demographics, 19 SIPS variables and 8 MCCB sub-tests.
Correlation
Most cognitive test scores, except the spatial span test, were significantly associated with negative symptoms, especially N5 (ideational richness) and N6 (occupational functioning). Other clinical variables, such as P5 (disorganized communication), D1 (odd behavior of appearance) and G2 (dysphoric mood), were also strongly associated with the C2 (BACS), C6 (BVMT-R), C7 (Category Fluency) and C8 (CPT-IP) (Figure 1 and Supplementary-1 sTable 2 for detailed statistics).
Canonical correlation
CCA identified dimensional representation of cognition features quantified by the MCCB that were associated with the dimensional representation of clinical symptoms quantified by the SOPS. The first leading pair of dimensions extracted by CCA from the cognition and clinical symptoms showed a statistically significant correlation coefficient of 0.49 (pChisq < 0.001).
The first cognition component (canonical variate) included a combination of the Trail Making A and the BACS Symbol Coding Test, defined as speed of processing features of cognition that were correlated with negative symptoms and functional deterioration (Figure 2). The scatter plot illustrates the correlation between dimensional cognitive scores and dimensional clinical scores for negative symptoms and functional deterioration. To the left of scatterplot, SOPS clinical score loadings are depicted for those symptoms with the strongest loadings. Below the scatterplot, MCCB cognitive score loadings are depicted for those tests with the strongest loadings.
The second leading pair of dimensions extracted from CCA showed a strong tendency toward a statistical significant correlation coefficient of 0.41 (pChisq = 0.076). The second cognition component included the HVLT-R (verbal learning domain), the Spatial Span (working memory domain) and the BVMT-R (visual learning domain) and was correlated with clinical symptoms defined to be positive symptoms and emotional disorganization (Figure 3).
Hierarchical cluster
To explore clusters in the CHR sample, hierarchical cluster analysis was applied to assign CHR individuals to nested subgroups with similar patterns of relationship between clinical symptoms and cognition. Our analysis revealed three CHR clusters defined by distinct and relatively homogeneous patterns along two dimensions (Figures 2 and 3), comprising 14.2% (Cluster 1, n = 41), 37.4% (Cluster 2, n = 108) and 48.4% (Cluster 3, n = 140) of the 289 CHR individuals, respectively.
This three-cluster solution was optimal for defining relatively homogeneous subgroups while ensuring that individual cluster sample sizes provided sufficient statistical power to detect meaningful differences for prediction of psychosis and clinical-cognitive features (Tables 1 and 2). The results of a four-cluster solution are presented in Supplementary-2 sFigure 3.
Prediction
Tables 1 and 2 depict the demographic, clinical and cognitive profiles of the three clusters defined by the CCA based on clinical and cognitive features. The features of the three subtypes are summarized as follows: Cluster 1—extensive and severe deficits in negative, cognitive and functional performance; Cluster 2—thought and behavioral disorganization, and partial and moderate cognitive deficits (working memory, attention and visual learning); and Cluster 3—limited and mild deficits in clinical symptoms and cognition (visuospatial memory; see Supplementary-3 sFigure 5). Of the total 289 CHR individuals, 54 (18.7%) converted to full psychosis during the follow-up period, 16 of 41 individuals (39.0%) in the Cluster 1 group, 12 of 108 individuals (11.1%) in the Cluster 2 group, and 26 of 140 individuals (18.6%) in the Cluster 3 group had converted to full psychosis during the follow-up period. Therefore, to test further the utility of the three cluster subtypes in predicting psychosis, Kaplan–Meier survival curves were constructed for the three clusters. In Figure 5, survival curves show that the conversion rate was significantly higher in Cluster 1 CHR individuals compared with the other two clusters. Supplementary-2 sFigure 4 shows that four cluster subtypes solution would not improve the prediction power of the three-cluster solution.
Discussion
This study used CCA to determine whether the CHR sample is composed of different subtypes that can be distinguished by combinations of clinical and cognitive variables. We found three such subtypes, with subjects from subtype 1 displaying extensive and severe deficits in negative, cognitive and functional performance, and showing the highest conversion risk (39.0%). The CCA method extends the previous work of the LCCA-driven approach (Healey et al., 2018; Ryan et al., 2017; Valmaggia et al., 2013) to avoid multicollinearity (Liu et al., 2009) (highly correlated relationship between the variables in the LCCA model make the model difficult to estimate accurately). CCA uses information from all the variables in the clinical and cognitive variable sets, maximizes the estimation of the relationship between the two sets (Kabir et al., 2014) and may identify CHR subtypes in a more efficient way. Compared with conventional multiple testing, CCA may also help reduce type-1 error and increase result accuracy. Our analyses produced statistical support for the existence of three subtypes within the Chinese CHR population, as well as effective characteristic variables for distinguishing subtype 1 subjects from the other two subtypes, which are negative symptoms and cognitive deficits.
Comparisons between CCA-driven subtype with LCCA-driven subtypes
Many attempts have been made to identify homogeneous CHR subtypes. Generally, as defined in the SIPS, there are three different CHR syndromes, including attenuated positive symptoms (APS), genetic risk and deterioration (GRD) and brief intermittent psychotic symptoms (BIPS). A meta-analytical stratification of the heterogeneity of CHR subjects by Fusar-Poli et al. (2016) found that subjects in the BIPS subtype demonstrated an increased risk of psychosis, greater than the risk of subjects in the APS or GRD subtypes. This kind of subtype model is difficult to apply to our present sample because there were only 7 (2.5%) subjects in the BIPS subtype, and only 21 (7.4%) subjects in the GRD subtype. This extremely unbalanced distribution of the three SIPS subtypes poses a major obstacle to its clinical application.
Interestingly, our CCA-driven subtypes were congruent with those based on the LCCA-driven subtypes. In Valmaggia’s four-class model (Valmaggia et al., 2013), they classified a group (Class 4) of subjects with the highest conversion risk, the most severe symptoms and the poorest function, which is most similar to our subjects in subtype 3. Although a cognitive test was not included in their model, and only 17 of 318 subjects were grouped into Class 4, both studies suggested an extensive impairment pattern underlying those at ‘real’ high risk for psychosis. Moreover, compared with Healey et al.’ s (2018) study, which also included clinical and cognitive variables for subgroup analysis, our results are surprisingly consistent. From the distribution, conversion risk and characteristics, subtype 1 in this study almost entirely replicates the characteristics of subtype 3 (negative-neurocognitive) in their model, although the classification method performed in these two studies is completely different.
In contrast to our findings and those of Healy’s study, there were three subgroups within the NAPLS-1 and NAPLS-2 samples that were identified by the Ryun’s LCCA model (Ryan et al., 2017): a perceptual abnormalities subgroup, a disorganized speech subgroup and an impaired hygiene subgroup. These subtypes are different from our three subtypes. However, it is noteworthy that the subjects in the disorganized speech subgroup seemed more likely to convert to psychosis than the other two subgroups. This so-called ‘disorganized speech subgroup’ was actually characterized by extensive and severe deficits in negative symptoms (the highest scores in all six related items in the SIPS) and general function. Thus, despite the fact that there was no cognitive variable included, we speculate that the disorganized speech subgroup is similar to our subtype 1 as well as the other highest risk LCCA-driven subgroups mentioned above.
Compared with subtype 1, subtype 2 in our study was characterized by higher thought and behavioral disorganization, and partial and moderate cognitive deficits (in domains of working memory, attention and visual learning). This category largely reflects positive symptoms and their related cognitive pattern. Compared with subtype 1, cognitive dysfunctions are partial and more likely to be specific. Many previous studies have provided solid evidence regarding the association between unusual thought content and disrupted working memory (Menon et al., 2001; Montojo et al., 2014), biased attention (Arguedas et al., 2006; Prochwicz and Klosowska, 2017) and visual learning (Cellard et al., 2009).
Conversely, subtype 3 in our study was characterized by the mildest clinical symptoms and cognitive deficits. It is important to note that subtype 3 was significantly older than subtype 2. Longitudinal findings have suggested that onset of cognitive deficits predates positive symptom onset (Mollon et al., 2018) and is more frequently observed in early onset youths than in adolescents with later onset (Puig et al., 2017). Thus, we speculate that subtype 3 may represent a group of CHR individuals with prodromal symptoms with later onset. In our study, cognitive function of subtype 3 CHR is less affected than those CHR youths with early onset, and they have better outcomes as well.
Conversion
Not surprisingly, subtype 1 had the highest conversion rate (39.0%) among the three subtypes, with no significant differences in conversion rates between subtypes 2 and 3. Subjects in subtype 1 scored the highest in severe negative symptoms, had the lowest Global Assessment of Functioning (GAF) and were the poorest in most cognitive subtests. All of these characteristics have been previously reported as effective predictors for a higher risk of conversion (Cannon et al., 2008, 2016; Fusar-Poli et al., 2012; Li et al., 2018; Yung et al., 2004). Our findings thus confirm that conversion can be predicted by the presentation of those symptoms, but, more importantly, they indicate that there is a subtype of CHR subjects that can be grouped by the characterization of multiple risk factors. Identification of this subtype could therefore indicate a heightened risk for psychosis in these individuals, and the subsequent an option of more aggressive monitoring and intervention strategies.
Clinical implications
Increasingly, the heterogeneity of CHR samples has emerged as a major obstacle to the development of intervention strategies and, in particular, to methods of monitoring and treatment. Similarly, efforts to develop new interventions are not efficient, owing in part to a lack of ability to select CHR individuals for intervention who are most likely to experience conversion to psychosis. Furthermore, the fact that CHR criteria are treated as a single label for a heterogeneous syndrome is also a problem since it is clear that different subtypes should be treated differently. In this study, we determined three subtypes of CHR that were associated with different patterns of abnormal cognition and distinct clinical symptoms, which have also been shown to evince different outcomes. However, we are in the initial stages of this subtype approach, and it is therefore premature to make definitive claims until more clinical interventions targeting CHR subtypes are conducted. Interestingly, our data-driven clinical subtypes are somewhat similar to the three biotypes of psychotic disorders recently identified by the Bipolar-Schizophrenia Network on Intermediate Phenotypes (B-SNIP) consortium (Clementz et al., 2016). However, B-SNIP biotypes were derived by combining cognitive and electrophysiological data, while we used a combination of clinical and cognitive data. The SHARP group will incorporate biological data into our subtyping scheme to see whether that would enhance the predictive value of this approach to classification of CHR.
Strengths and limitations
The strengths of this study include its longitudinal design and its novelty in developing CCA-driven subtypes for a CHR population, based on a large-scale Chinese clinical sample. The use of canonical variates (i.e. combination of clinical symptoms and cognitive function) as indicators is novel. However, several limitations of this study must be considered. First, a single center was used for sample recruitment, which could limit our ability to generalize the findings. However, the center is the largest mental health center in China, which serves over 800,000 outpatients per year. Moreover, 111 CHR individuals excluded in current analysis demonstrated older age, more severe suspiciousness and general symptoms and poorer functioning at baseline compared with those who included, which could bias our results by underestimating the clinical severity of our sample. Another limitation of the study is that the SHARP CHR cohort was surveyed naturalistically. More than 70% CHR individuals in this sample were treated with antipsychotic for at least 2 weeks during the follow-up period. Therefore, it remains unknown whether the antipsychotic can affect outcome. The various medications the participants took with varying compliance may have confounded the results of conversion rate, thereby limiting the generalizability to CHR subjects who have not taken any medication.
A further possible limitation is that the three subtypes were validated only for predicting conversion to psychosis; other outcomes, such as poor function and conversion to other nonpsychotic disorders, were not assessed. As noted by Van Os and Guloksuz (2017), the full range of a person-specific psychopathology for CHR youth should be considered in future studies. Thus, it remains unknown, but possible, that CHR subjects in subtype 2 or 3 may differ in other outcomes. While not a specific limitation for this study, future studies would benefit from the inclusion of data from additional domains of function, such as neurophysiological/neuroimaging and genetic data, to stratify subjects further into clinically and biologically meaningful subgroups (Insel and Cuthbert, 2015).
Conclusion
Our study extends the previous work of the LCCA-driven approach by applying the CCA-driven approach in order to determine subtypes of CHR subjects. Three subtypes emerged with distinctive features based on clinical and cognitive performance. Subtype 1, which is characterized by extensive negative symptoms and cognitive deficits, appears to have the highest risk for psychosis. Our results define one approach for using a combination of clinical and cognitive variables to delineate and group novel subtypes of CHR characterized by uniform cognitive substrates. If replicated, findings would suggest the clinical utility of these subtypes in psychosis prediction.
Supplemental Material
Supplemental_data-1 – Supplemental material for Clinical subtypes that predict conversion to psychosis: A canonical correlation analysis study from the ShangHai At Risk for Psychosis program
Supplemental material, Supplemental_data-1 for Clinical subtypes that predict conversion to psychosis: A canonical correlation analysis study from the ShangHai At Risk for Psychosis program by TianHong Zhang, XiaoChen Tang, HuiJun Li, Kristen A Woodberry, Emily R Kline, LiHua Xu, HuiRu Cui, YingYing Tang, YanYan Wei, ChunBo Li, Li Hui, Margaret A Niznikiewicz, Martha E Shenton, Matcheri S Keshavan, William S Stone and JiJun Wang in Australian & New Zealand Journal of Psychiatry
Supplemental Material
Supplemental_data-2 – Supplemental material for Clinical subtypes that predict conversion to psychosis: A canonical correlation analysis study from the ShangHai At Risk for Psychosis program
Supplemental material, Supplemental_data-2 for Clinical subtypes that predict conversion to psychosis: A canonical correlation analysis study from the ShangHai At Risk for Psychosis program by TianHong Zhang, XiaoChen Tang, HuiJun Li, Kristen A Woodberry, Emily R Kline, LiHua Xu, HuiRu Cui, YingYing Tang, YanYan Wei, ChunBo Li, Li Hui, Margaret A Niznikiewicz, Martha E Shenton, Matcheri S Keshavan, William S Stone and JiJun Wang in Australian & New Zealand Journal of Psychiatry
Supplemental Material
Supplemental_data-3 – Supplemental material for Clinical subtypes that predict conversion to psychosis: A canonical correlation analysis study from the ShangHai At Risk for Psychosis program
Supplemental material, Supplemental_data-3 for Clinical subtypes that predict conversion to psychosis: A canonical correlation analysis study from the ShangHai At Risk for Psychosis program by TianHong Zhang, XiaoChen Tang, HuiJun Li, Kristen A Woodberry, Emily R Kline, LiHua Xu, HuiRu Cui, YingYing Tang, YanYan Wei, ChunBo Li, Li Hui, Margaret A Niznikiewicz, Martha E Shenton, Matcheri S Keshavan, William S Stone and JiJun Wang in Australian & New Zealand Journal of Psychiatry
Footnotes
Acknowledgements
For memorial purpose, Dr Larry J Seidman passed away on 7 September 2017, and Dr Robert W McCarley passed away on 27 May 2017. Both were founders and core members of the ShangHai At Risk for Psychosis (SHARP) program.
Author Contributions
T.Z. and J.W. conceptualized the study, wrote the first draft of manuscript and conducted the statistical analyses. L.X., H.C. and Y.W. interviewed participants and collected and organized the primary data. Y.T., H.L. and X.T. managed the literature searches, statistical analyses and edited the manuscript. C.L., L.H., K.A.W., E.R.K., M.A.N., M.E.S., M.S.K. W.S.S. and J.W. designed the study and provided supervision in the implementation of the study. All authors have approved the final manuscript.
Declaration of Conflicting Interests
The author(s) declared no potential conflicts of interest with respect to the research, authorship and/or publication of this article.
Funding
The author(s) disclosed receipt of the following financial support for the research, authorship and/or publication of this article: This study was supported by the Ministry of Science and Technology of China, National Key R&D Program of China (2016YFC1306803, 2016YFC1306805); the National Natural Science Foundation of China (81671329, 81671332); the Clinical Research Center at Shanghai Mental Health Center (CRC2018ZD01, CRC2018ZD04 and CRC2018YB01); Clinical Research Plan of SHDC (16CR2015A, 16CR3016A); Science and Technology Commission of Shanghai Municipality (19441907800, 18411952400, 18ZR1432600); Shanghai Jiaotong University Foundation (ZH2018ZDB03); Shanghai Key Laboratory of Psychotic Disorders (13dz2260500); and Shanghai Mental Health Center Foundation (2016-FX-01, 2017-TSXK-03). This study was also supported by an R21 Fogarty/NIMH (1R21 MH093294-01A1), ‘Broadening the Investigation of Psychosis Prodrome to Different Cultural Groups’, by a United States–China Program for Biomedical Collaborative Research (R01) (1R01 MH 101052-01), entitled ‘Validating Biomarkers for the Prodrome and Transition to Psychosis in Shanghai’, and by a United States NIMH career award (K23 MH102358).
Supplemental Material
Supplemental material for this article is available online.
References
Supplementary Material
Please find the following supplemental material available below.
For Open Access articles published under a Creative Commons License, all supplemental material carries the same license as the article it is associated with.
For non-Open Access articles published, all supplemental material carries a non-exclusive license, and permission requests for re-use of supplemental material or any part of supplemental material shall be sent directly to the copyright owner as specified in the copyright notice associated with the article.