
Abstract
Objective:
While near-centenarians (95–99) and centenarians are the fastest growing sectors of the population in many countries, few studies have investigated their psychological health. We aimed to compare levels of psychological distress and life satisfaction in individuals aged 95 or above (95+) with younger age groups and identify the factors associated with psychological distress and life satisfaction in near-centenarians and centenarians.
Methods:
We assessed the physical, cognitive, social and psychological health of 207 participants aged 95+ in the Sydney Centenarian Study. Psychological distress and life satisfaction were rated on the Kessler Psychological Distress Scale (K10) and Satisfaction with Life Scale, respectively. Cross-sectional univariate comparisons were performed with participants aged 70–90 years from the Sydney Memory and Ageing Study. Factors associated with psychological distress and life satisfaction among Sydney Centenarian Study participants were examined using multiple regression analyses.
Results:
In Sydney Centenarian Study and Memory and Ageing Study, mean K10 scores were 15.3 (±5.9) and 13.4 (±3.6), and clinical levels of psychological distress (K10 ⩾ 20) were 19% and 7%, respectively. Sydney Centenarian Study participants demonstrated significantly higher levels and rates of psychological distress (t = 3.869, p < 0.001; χ2 = 27.331, p < 0.001). In Sydney Centenarian Study, more psychotropic medications and having fewer relatives and friends were associated with higher psychological distress. Sydney Centenarian Study participants reported significantly higher levels of life satisfaction than Memory and Ageing Study participants, mean scores 6.0 (±1.5) and 5.6 (±1.3); t = 5.835, p < 0.001. Lower Mini-Mental State Examination scores and having fewer relatives and friends were associated with lower life satisfaction in Sydney Centenarian Study.
Conclusion:
Despite showing higher levels of psychological distress in the prior 4 weeks than younger age groups, near-centenarians and centenarians remained highly satisfied with their overall lives. The identification of risk and protective factors for psychological distress and life satisfaction provides opportunities for interventions to maintain good psychological health in this vulnerable population.
Introduction
The near-centenarian and centenarian (95+) population has become the fastest growing sector in many developed countries. In 2015, the estimated 451,000 centenarians in the world are projected to reach 3,676,000 in 2050 (United Nations, Department of Economic and Social Affairs Population Division, 2015). In Australia, the 2016 census data reported 3569 centenarians (Australian Bureau of Statistics (ABS), 2017) and the Australian Institute of Health and Welfare predicted that there will be 15,700 in 2034 and more than 100,000 in 2084 (Australian Institute of Health and Welfare, 2015). Although the 95+ population continues to rise, research into this population remains significantly limited. Studies usually explore the physical health, cognition and functional ability of centenarians; very few specifically investigate their psychological health.
Estimates of the prevalence of depression in near-centenarians and centenarians range from 12.8% to 39.2% (Nyqvist et al., 2017; Tafaro et al., 2002). Anxiety prevalence has been examined in only two studies which reported rates of 45.4% in Portuguese centenarians and 9.5% in Australian centenarians (Ribeiro et al., 2015; Richmond et al., 2011).
Compared to younger age groups, those 95+ have been reported to have higher (Bergdahl et al., 2005; Jang et al., 2004; Nyqvist et al., 2017; Scheetz et al., 2012), similar (Cohen-Mansfield et al., 2013; Dello Buono et al., 1998; von Heideken Wagert et al., 2006) or lower depression scores or rates (Kiljunen et al., 1997).
Positive psychological health, defined by an individual’s level of life satisfaction, has been associated with longevity (Jopp et al., 2016). Life satisfaction is a broad construct that relates to overall well-being, encompassing aspects of emotional and mental health (MacDonald et al., 2009). Findings on the levels of life satisfaction in centenarians vary. Although most studies have reported that life satisfaction is high in centenarians, it remains uncertain whether centenarians are more satisfied with life than the younger cohorts (MacDonald et al., 2009). Martin et al. (1996) reported that 64.5% of participants in the 100+ group rated their life satisfaction as good, compared to 82.8% of participants in the 80–89 group and 81.3% of participants in the 60–69 group; only 1.3% of centenarians stated that their life satisfaction was poor while over 30% rated it as fair. Others have found higher life satisfaction in centenarians compared to octogenarians and nonagenarians (Dello Buono et al., 1998).
Very few studies have investigated factors associated with the psychological health of the oldest-old. Table 1 summarises the current literature on the associations of psychological morbidity and life satisfaction in the near-centenarian and centenarian population. There is significant heterogeneity in the small body of literature on the physical, functional, cognitive, psychiatric and social correlates of psychological health.
An overview of the literature on the correlates of psychological morbidity and life satisfaction in near-centenarians and centenarians.
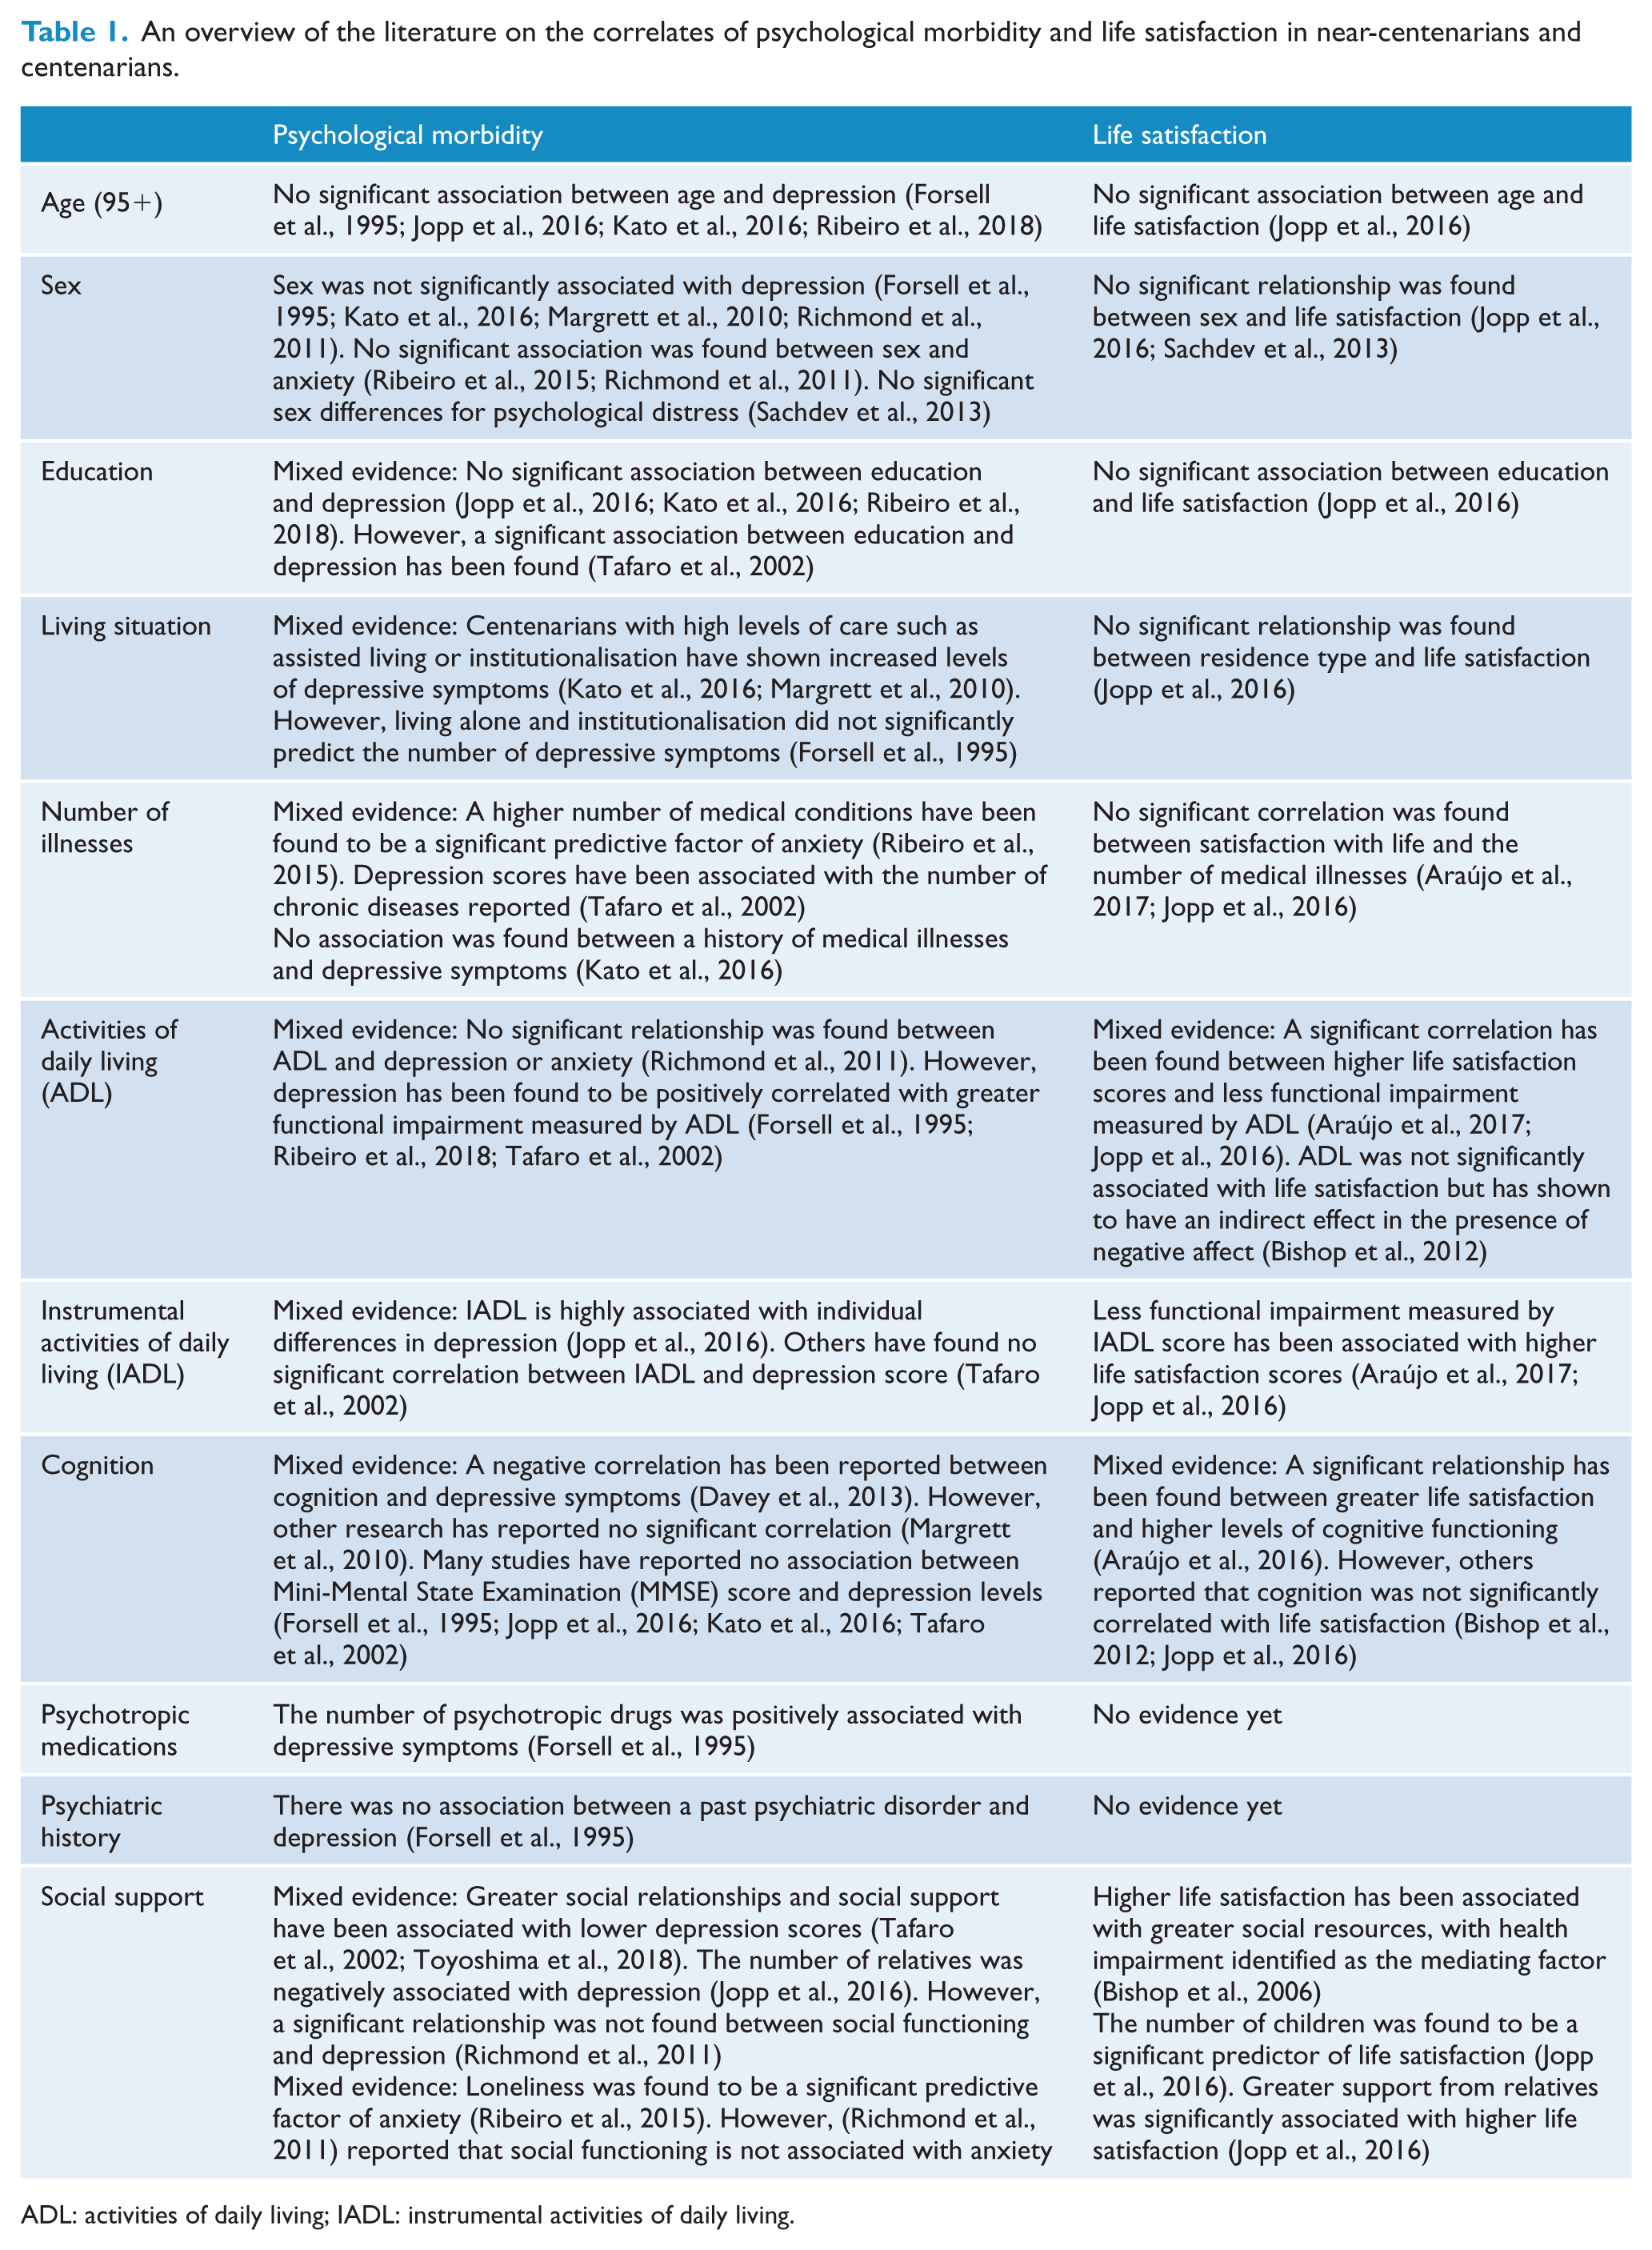
ADL: activities of daily living; IADL: instrumental activities of daily living.
These discrepancies in findings may be explained in part by methodological differences: failure to obtain a representative sample, the challenging nature of age validation, low participation rates and samples restricted to community-dwellers. The major centenarian studies over the past decade have taken place in Europe and America with few occurring in Australia. This study intended to address some of these limitations of the literature.
The Sydney Centenarian Study (SCS) is an ongoing population-based study that aims to obtain a better understanding of successful cognitive ageing by investigating the physical and mental health in Australian residents aged 95 and above (Sachdev et al., 2013). Cross-sectional comparisons were made with their younger counterparts aged 70–90 years from the Sydney Memory and Ageing Study (MAS) (Sachdev et al., 2010).
Aims and hypotheses
The aims of this study were as follows:
To examine psychological distress and life satisfaction in persons aged 95–106 years (SCS) and make cross-sectional comparisons with persons aged 70–90 years (MAS).
To investigate the risk and protective factors of psychological distress and life satisfaction in near-centenarians and centenarians (SCS).
Based on the most common findings (Bergdahl et al., 2005; Jang et al., 2004; Martin et al., 1996; Nyqvist et al., 2017; Scheetz et al., 2012; Yi and Vaupel, 2002), we hypothesised that those 95+ would show higher levels of psychological distress and be less satisfied with life compared to the younger cohorts. Hypotheses were not formulated for the second aim as there were even fewer studies on the predictors of psychological health in centenarians.
Methods
Participants
SCS
Participants were individuals aged 95 or above from seven local government districts in Sydney, Australia. Sampling strategies comprised invitations using the compulsory Australian electoral roll and Medicare lists on which 99.9% of Australians are registered (Department of Human Services, 2018), along with media campaigns, contacting aged care facilities and other recruitment strategies to achieve as comprehensive a coverage as possible. Written informed consent was given by either the participant or their next of kin. Age validation was achieved using multiple forms of evidence including birth certificates, old passports and marriage certificates. SCS collected data from 343 participants age 95 to 106 years at baseline. When we excluded those with dementia to enable comparison with MAS participants, 207 SCS participants remained. Data were also collected from 156 informants at baseline, who had regular contact with participants (at least 1 hour of contact per week). Further details are available in Sachdev et al. (2013).
Sydney MAS
At baseline, MAS collected data from 1037 participants recruited from the electoral roll, who were non-demented community-dwelling adults aged 70 to 90 years. However, five participants were removed from the sample because they also participated in SCS after they had reached the age of 95, leaving a total sample of 1032. Data were collected from 974 informants at baseline. Informants had at least 1 hour of contact per week with participants. All participants provided written informed consent. Inclusion criteria were participants who had a sufficient level of English proficiency to ensure completion of neuropsychological testing. Exclusion criteria were individuals who had a diagnosis of dementia, a Mini-Mental State Examination (MMSE) score of <24 adjusted for age, educational level and non-English speaking background status (Anderson et al., 2007), psychotic symptoms, bipolar disorder, schizophrenia, multiple sclerosis, progressive malignancy, motor neuron disease or other conditions that prevented the completion of assessments. Further details are available in Sachdev et al. (2010). Both SCS (HC12313) and MAS (HRECO9382) were approved by the Human Ethics Committees of the University of New South Wales and the South Eastern Sydney and Illawarra Area Health Service.
Measures
Methodological harmonisation was attempted when designing SCS and MAS. Both studies used the same measurement tools, enabling comparisons between the two different cohorts.
Psychological distress
The Kessler Psychological Distress Scale (K10) is a 10-item, self-report screening tool for non-specific psychological distress (Kessler et al., 2002). Participants (not informants) are asked how often they have felt distressed in the past four weeks. Each item is scored from 1 to 5, with a minimum score of 10 and a maximum score of 50. Higher scores indicate greater levels of psychological distress. The K10 has been significantly correlated with Diagnostic and Statistical Manual of Mental Disorders Fourth Edition (DSM-IV) mood and anxiety disorders (Slade et al., 2011). A score of ⩾20 suggests clinical levels of psychological distress and a high likelihood of having a mental disorder (Anderson et al., 2013). The K10 is a well-validated tool and in the original study, it demonstrated very high internal consistency with a Cronbach’s α of 0.93 (Kessler et al., 2002). In this study, Cronbach’s α for the combined SCS and MAS cohort was high at 0.83.
Life satisfaction
Life satisfaction of participants was measured by the third item from the Satisfaction with Life Scale (SWLS), which is a 7-point Likert-type scale with a score ranging from 1 to 7 (Diener et al., 1985). A higher score indicates greater levels of subjective well-being. The single-item life satisfaction measure has shown high reliability (Lucas and Brent Donnellan, 2012) and has been strongly correlated with the five-item SWLS (r = 0.75) (Kobau et al., 2010). Internal consistency of the five-item scale is high with a Cronbach’s α of 0.82 in the original study (Diener et al., 1985). The SWLS has been used across different age groups and has been specifically validated among elderly persons (Pavot et al., 1991).
Demographic statistics
Demographic statistics collected for both SCS and MAS comprised age, sex, education level, highest educational qualification attained, family and living conditions, marital status, non-English speaking background status and ethnicity.
Physical, functional, cognitive, psychiatric and social health (SCS only)
Physical health was assessed by calculating the number of current and lifetime illnesses of participants. This was measured using a questionnaire which had a list of common medical illnesses including stroke/transient ischaemic attack, heart attack, angina/blood vessel problems, high blood pressure, high cholesterol, type 2 diabetes, thyroid problems, epilepsy and meningitis/encephalitis. Both participants and informants responded to the questionnaire. If only the participant or the informant answered, this response was recorded. If there were discrepancies between participant and informant data, a diagnosis was recorded if either the participant or informant reported a clinically diagnosed illness. Functional ability was measured by activities of daily living (ADL) via the Lawton and Brody scale, which was completed by an informant (range: 7–35) (Lawton and Brody, 1969). A higher score indicates reduced function, with a cut-off score >7 suggesting impairment (Lawton and Brody, 1969). The Bayer Activities of Daily Living Scale, which was completed by an informant, assessed instrumental activities of daily living (IADL) (range: 1–10) (Hindmarch et al., 1998). A higher score suggests greater functional difficulties and a cut-off score of ⩾3 is usually employed (Folquitto et al., 2007). Cognitive health was assessed using the Addenbrooke Cognitive Examination-Revised (ACE-R) (range: 0–100) (Mathuranath et al., 2000). The questionnaire can be divided into five domains: attention (range: 0–18), fluency (range: 0–14), language (range: 0–26), memory (range: 0–26) and visuospatial (range: 0–16). This test includes a clock-drawing task and embeds the MMSE (range: 0–30) (Folstein et al., 1975).
Psychiatric history was recorded based on an open-ended question ‘what diagnosis was given?’ which was provided to both the participant and informant. A senior psychogeriatrician (H.B.) assessed participant and informant responses to determine the validity of the diagnoses, and the answers of ‘nervous, grievance counselling, grief, change of life, cognitive impairment, nerves and stress’ were not considered psychiatric diagnoses. Answers that were considered valid psychiatric diagnoses are demonstrated in Figure 1.
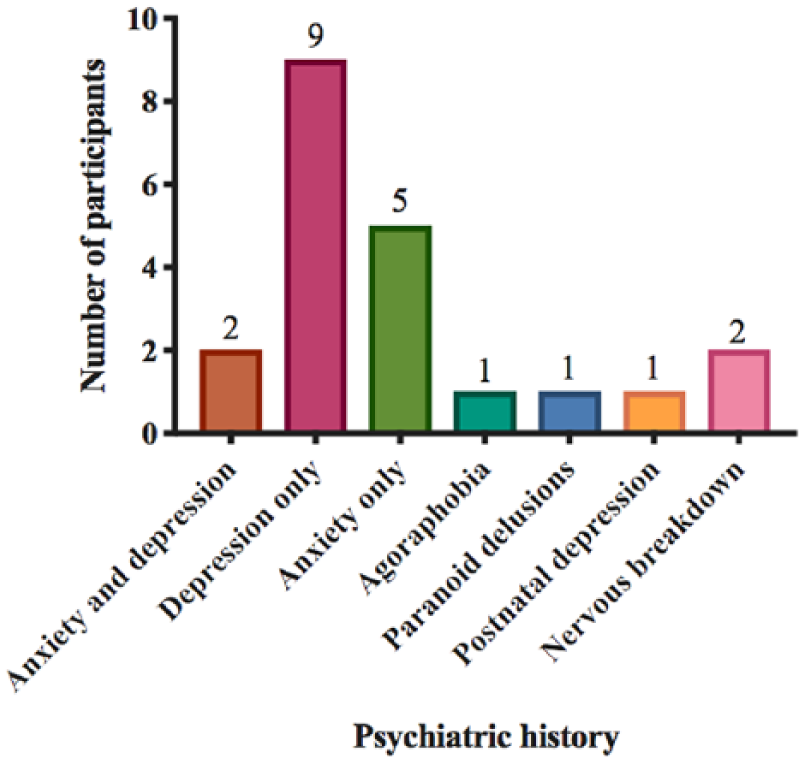
Psychiatric history in Sydney Centenarian Study participants.
Discrepancies between participant and informant data were resolved using the same method as above. Psychotropic medications were defined as any medication which belonged to the categories of sedatives, hypnotics, antianxiety agents, antipsychotic agents or antidepressants. A list of current medications was obtained for participants. Social support was measured by the number of relatives (not in the household) and friends that a participant was in regular contact with (visit, phone or write to at least once a month) and the number of confidants, as defined by a relative or friend with whom a participant could talk about private matters and call on for help. The concept of regular social contact is based on the Lubben Social Network Scale (Lubben, 1988).
Missing data
Multiple imputations were performed (30 repetitions) to replace item-level missing data for ADL, MMSE, ACE-R and K10. Thresholds for imputations were determined based on the distribution of missing items for each variable: cases were excluded if more than 29% of items were missing for ADL, if more than 27% of items were missing for MMSE, if more than 20% of items were missing for ACE-R, or if more than 20% of items were missing for K10. Imputations were performed using the MICE package in R (v.3.4.3).
Statistical analyses
Statistical analyses were performed using IBM™ SPSS™ 25. For SCS participants, sociodemographic, cognitive and physical profiles were compared between sexes and between near-centenarians and centenarians using independent samples t-tests/Mann–Whitney U tests for continuous variables and χ2/Fisher’s exact tests for categorical variables. Differences in the mean K10 and SWLS scores between SCS and MAS were assessed using independent samples t-tests. K10 scores for SCS and MAS were positively skewed and SWLS scores for SCS and MAS were negatively skewed. We performed log transformations to reduce skewness to between 1 and –1 and so more closely approximate the normal distribution. Predictors for the K10 and SWLS were analysed for the SCS cohort using multiple regression analyses. Multicollinearity was assessed using the variance inflation factor scores obtained from the output of the regression analyses. The sample size was not large enough to include all predictors in the regression model simultaneously without imputations. Therefore, a series of preliminary analyses using domain-specific models (i.e. physical and functional health variables in a single regression model) were initially constructed to find predictors to be included in a final combined model. Predictors from each domain-specific model with p-values ⩽0.2 were included in a combined model. A reduced, final model was then constructed by only including predictors from the combined model with a p ⩽ 0.1, to obtain a more parsimonious model and avoid a large cases-to-predictor ratio.
Results
Sociodemographic characteristics
The sociodemographic characteristics of SCS and MAS participants are shown in Tables 2 and 3 respectively.
Demographics of the Sydney Centenarian Study sample.
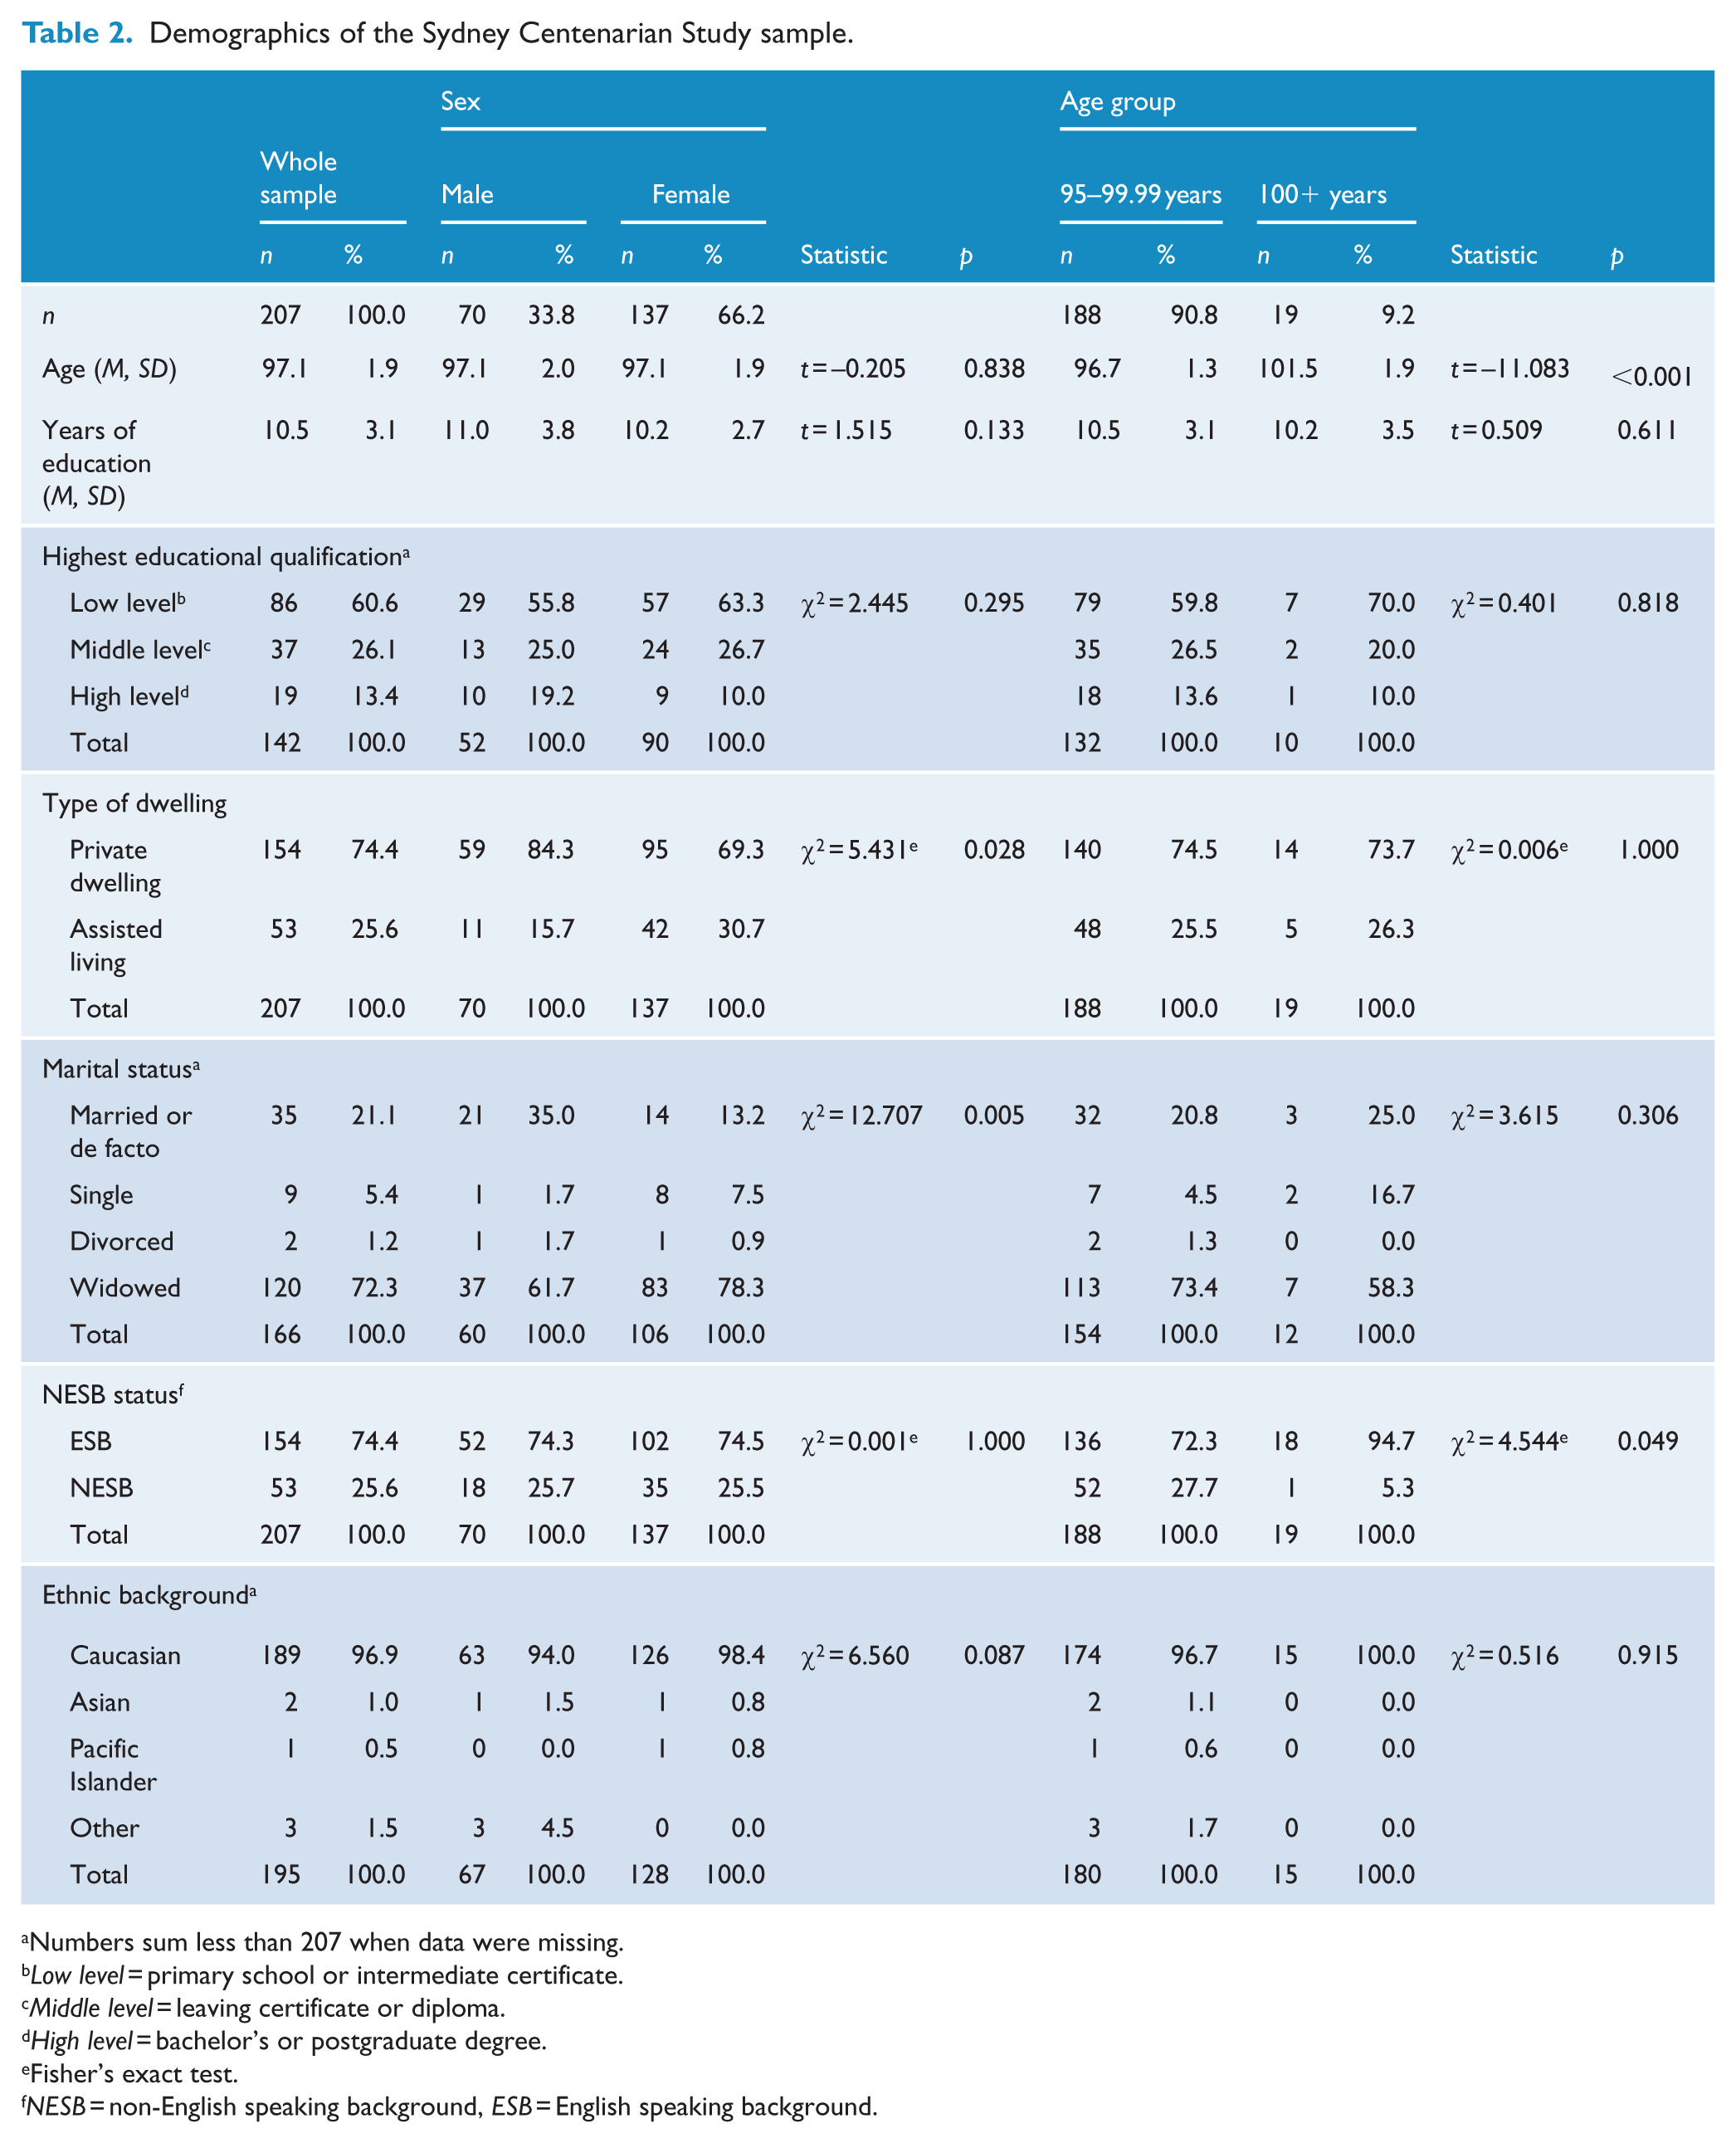
Numbers sum less than 207 when data were missing.
Low level = primary school or intermediate certificate.
Middle level = leaving certificate or diploma.
High level = bachelor’s or postgraduate degree.
Fisher’s exact test.
NESB = non-English speaking background, ESB = English speaking background.
Demographics of the Sydney Memory and Ageing Study sample.
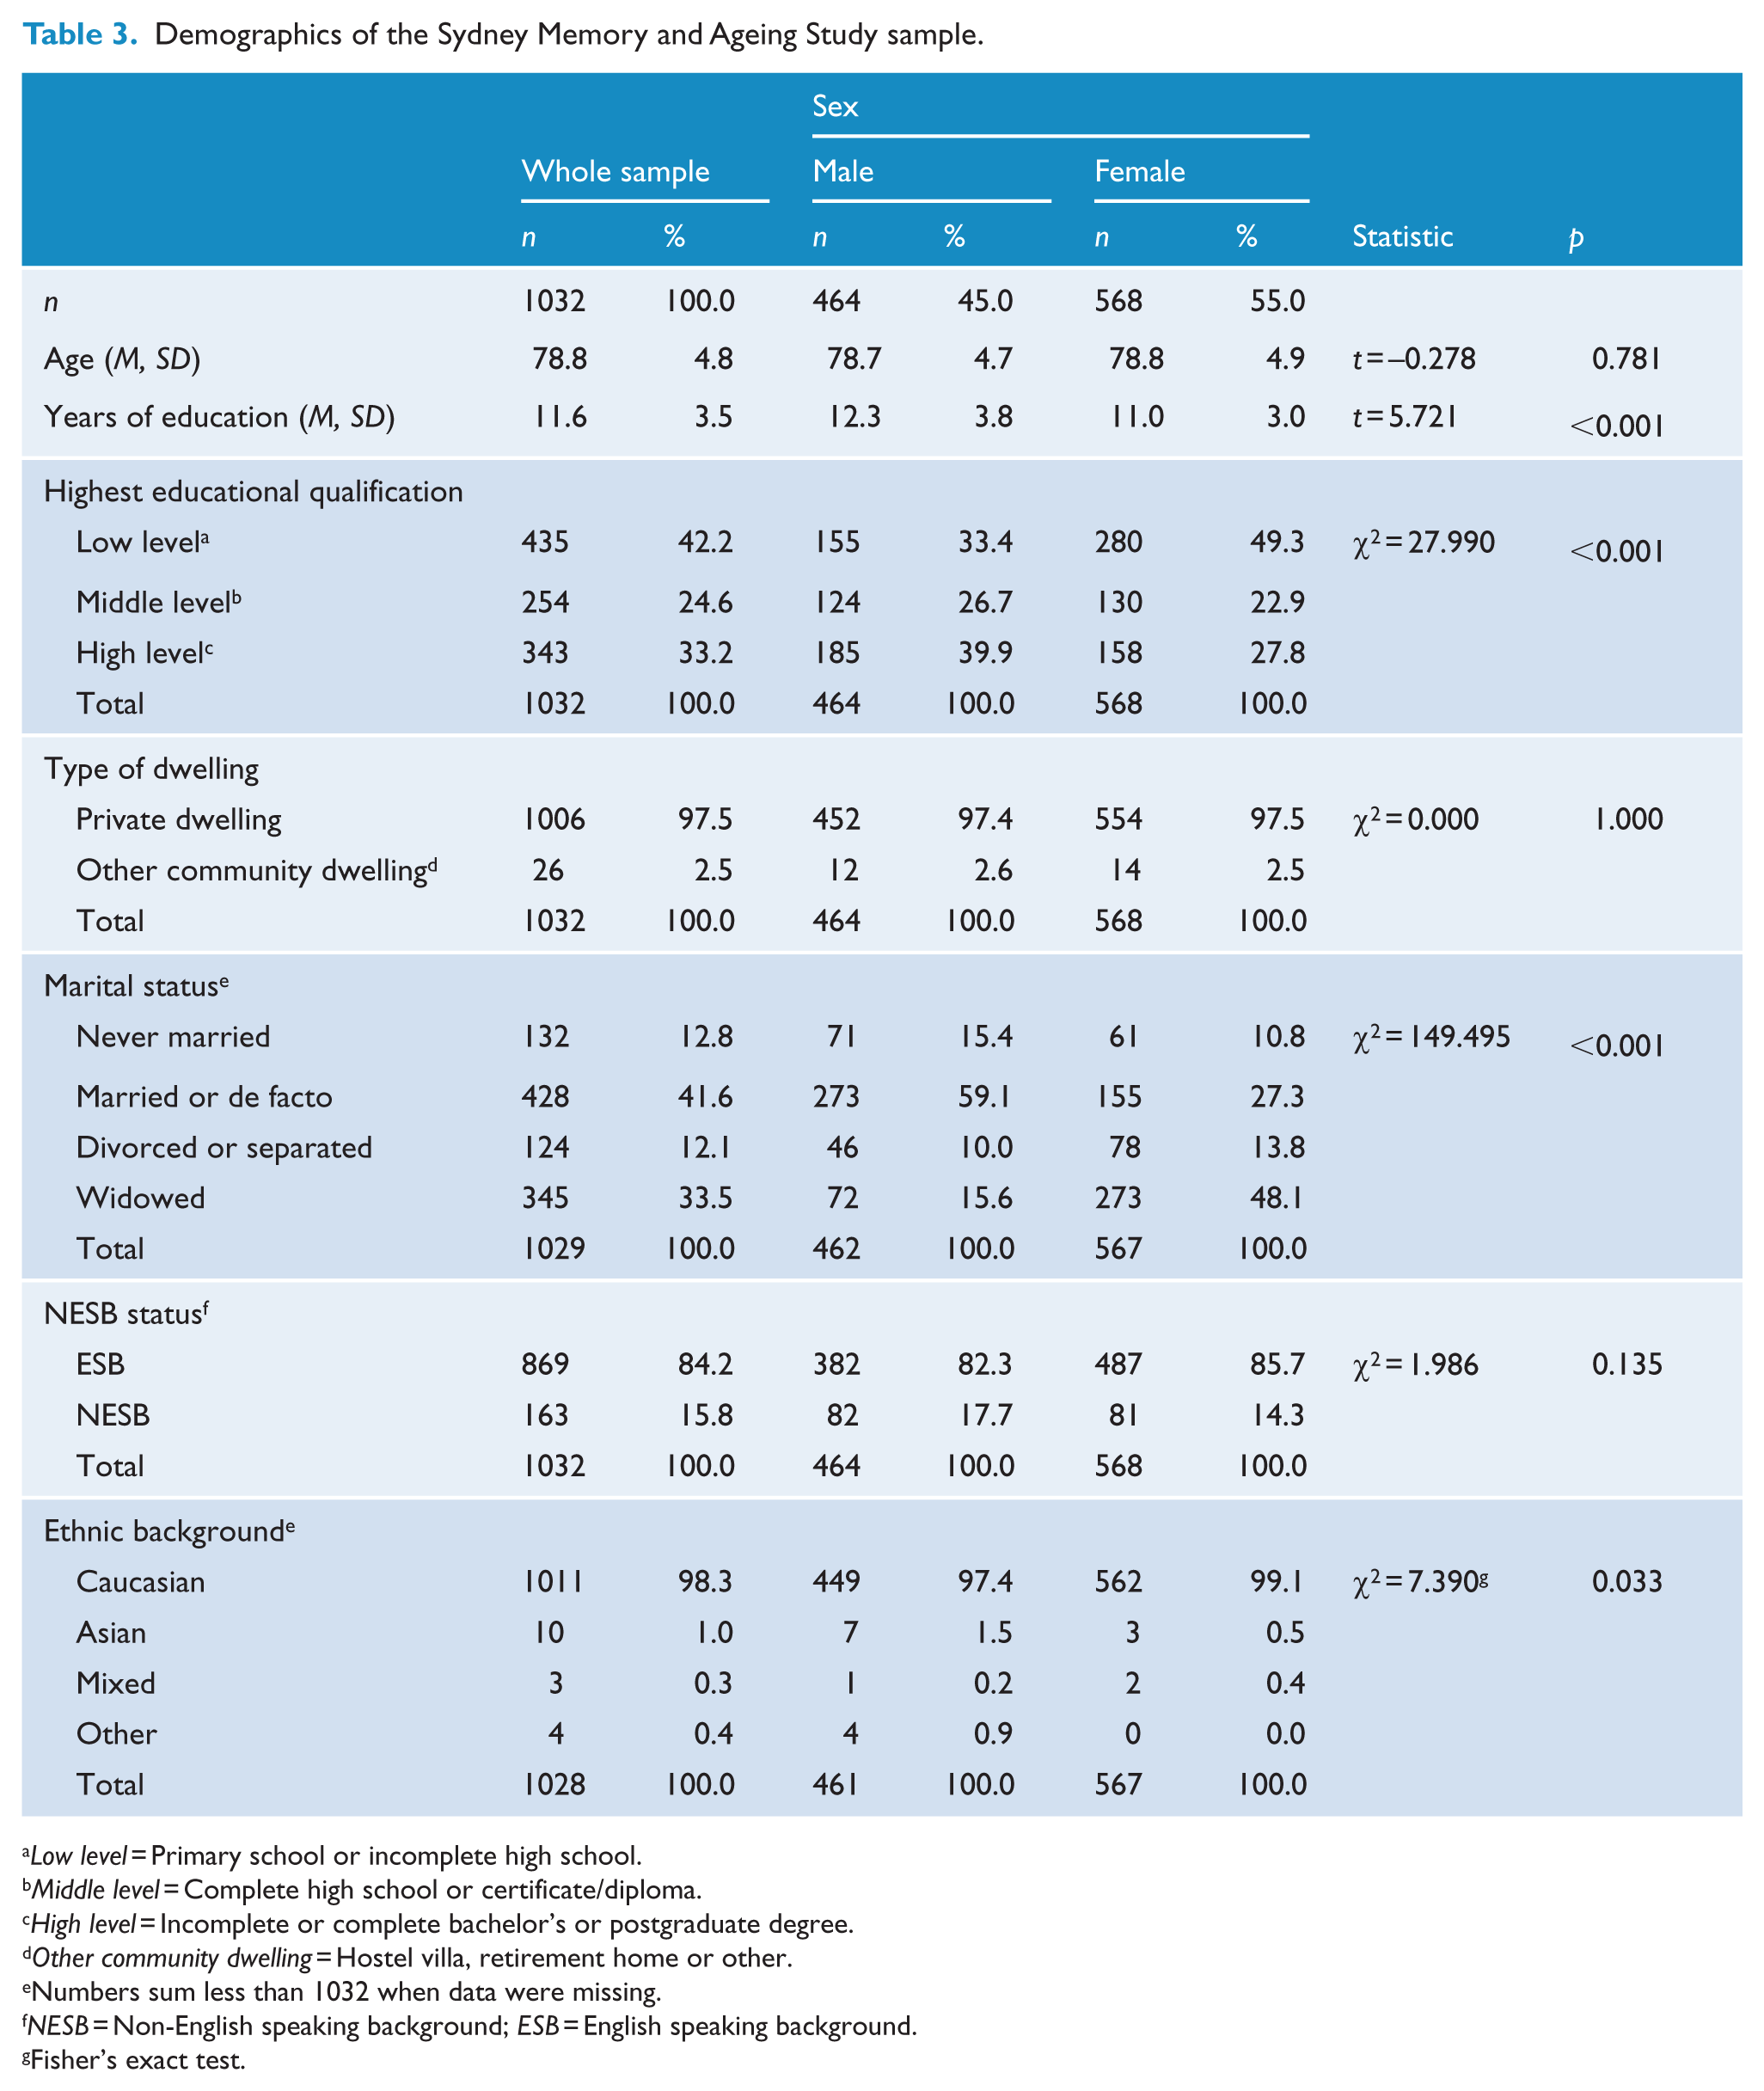
Low level = Primary school or incomplete high school.
Middle level = Complete high school or certificate/diploma.
High level = Incomplete or complete bachelor’s or postgraduate degree.
Other community dwelling = Hostel villa, retirement home or other.
Numbers sum less than 1032 when data were missing.
NESB = Non-English speaking background; ESB = English speaking background.
Fisher’s exact test.
Psychological health
SCS participants had significantly higher K10 scores than MAS participants (Table 4). There were no sex differences in K10 score in SCS, while in MAS, women (M = 13.7, SD 3.8) had significantly higher K10 scores than men (M = 13.2, SD 3.5; U = 115,959, p < 0.05). On the K10, 19% of SCS and only 7% of MAS participants had clinical levels of psychological distress, that is, score ⩾20 (χ2 = 27.331, p < 0.001).
Psychological distress and life satisfaction of the Sydney Centenarian Study and Sydney Memory and Ageing Study.
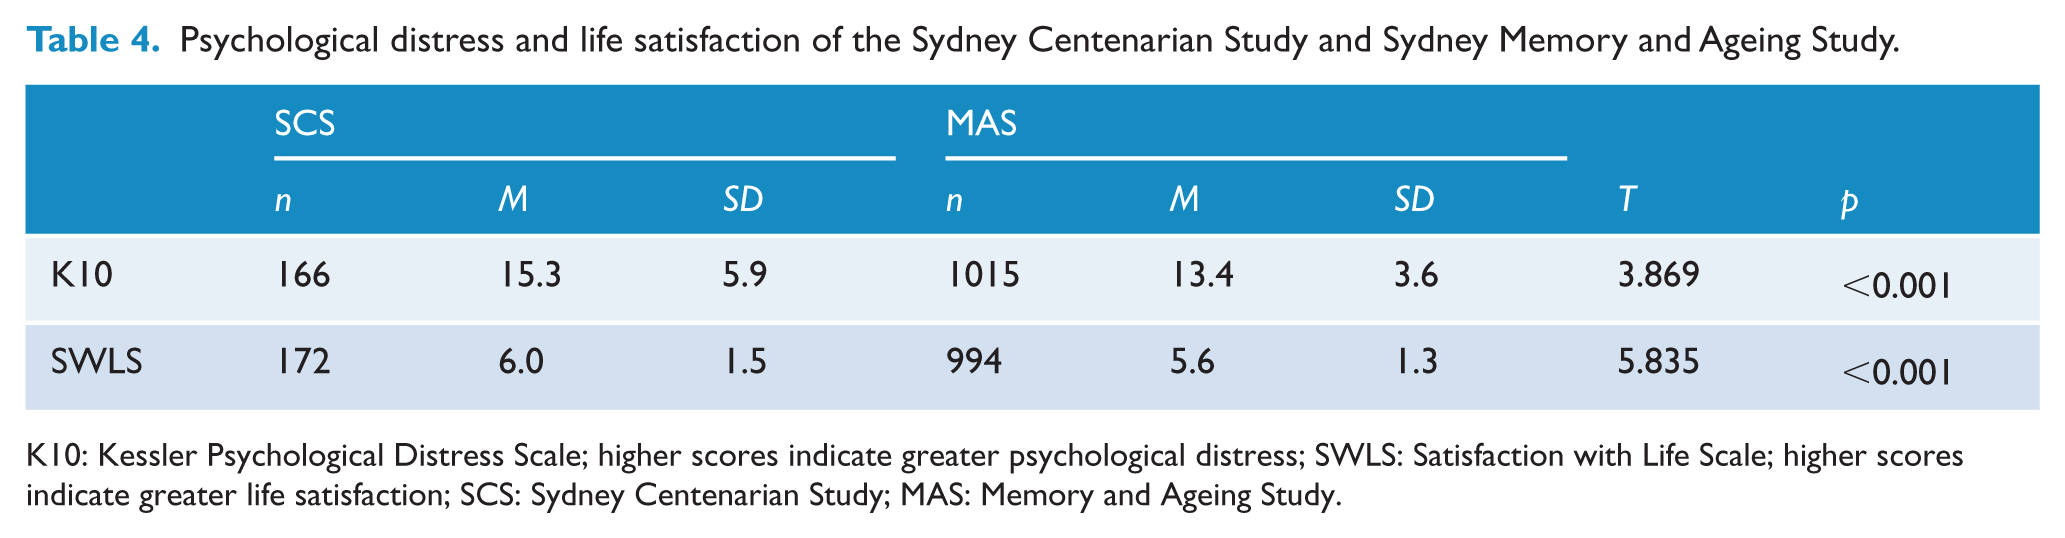
K10: Kessler Psychological Distress Scale; higher scores indicate greater psychological distress; SWLS: Satisfaction with Life Scale; higher scores indicate greater life satisfaction; SCS: Sydney Centenarian Study; MAS: Memory and Ageing Study.
On the SWLS, SCS participants’ scores were significantly higher than MAS participants’ scores (Table 4). There were no sex differences in SWLS score in SCS or MAS.
The SCS: physical, functional, cognitive, psychiatric and social status
The physical, functional, cognitive, psychiatric and social characteristics of SCS participants are shown in Table 5. There was evidence of functional impairment (mean ADL score of 10.2 was well above the cut-off point of >7). Men were less functionally impaired, scoring much lower on Bayer-ADL than women and had a higher mean ACE-R total score than women, performing significantly better on the language and visuospatial subscales. On average, near-centenarians had significantly more illnesses compared to centenarians. There were no other significant differences between men and women and between near-centenarians and centenarians.
Predictor variables for the Sydney Centenarian Study.
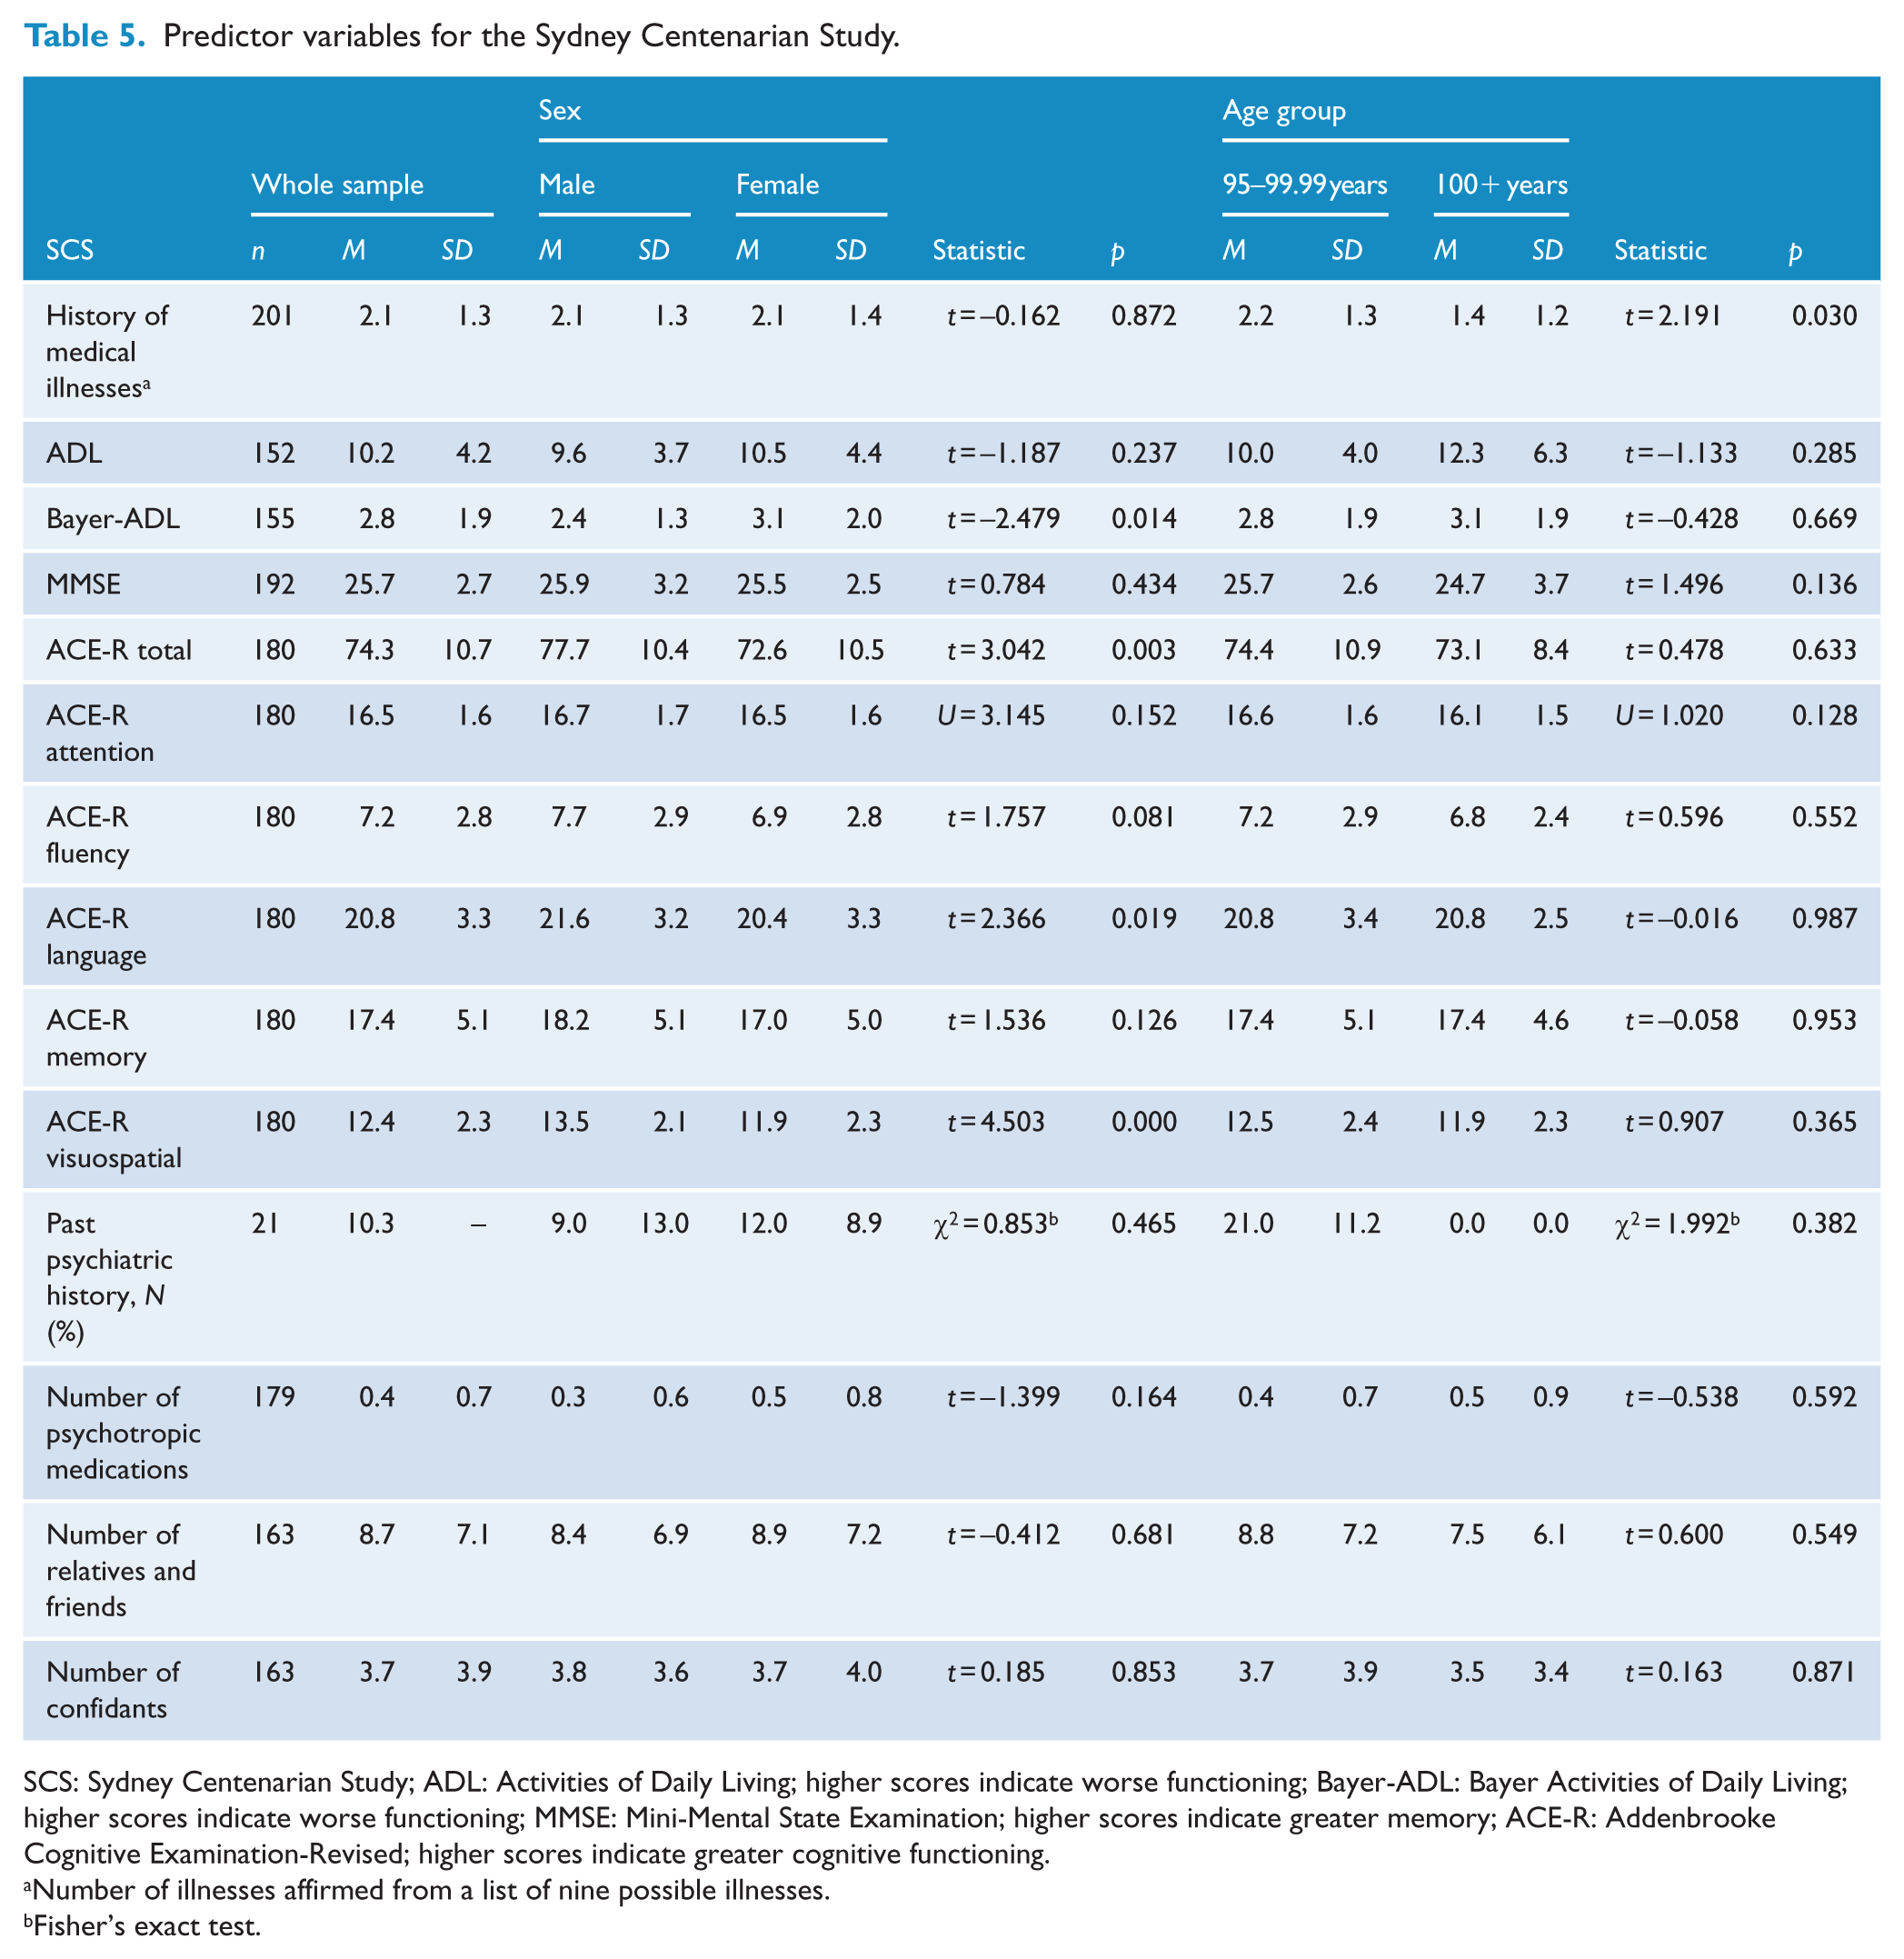
SCS: Sydney Centenarian Study; ADL: Activities of Daily Living; higher scores indicate worse functioning; Bayer-ADL: Bayer Activities of Daily Living; higher scores indicate worse functioning; MMSE: Mini-Mental State Examination; higher scores indicate greater memory; ACE-R: Addenbrooke Cognitive Examination-Revised; higher scores indicate greater cognitive functioning.
Number of illnesses affirmed from a list of nine possible illnesses.
Fisher’s exact test.
Risk and protective factors of psychological distress and life satisfaction
We analysed the predictive factors of psychological distress and life satisfaction in SCS participants using linear regression models by domains of demographics, physical functioning, cognition, psychiatric health and social resources. As MMSE and ACE-R had a correlation coefficient of r = 0.72 (see Supplemental Appendix 2), producing variance inflation scores of greater than 2, these predictor variables were entered in separate cognitive health models (cognitive models 1 and 2 in Table 6) to reduce multicollinearity.
Regression models for psychological distress and life satisfaction in the Sydney Centenarian Study.
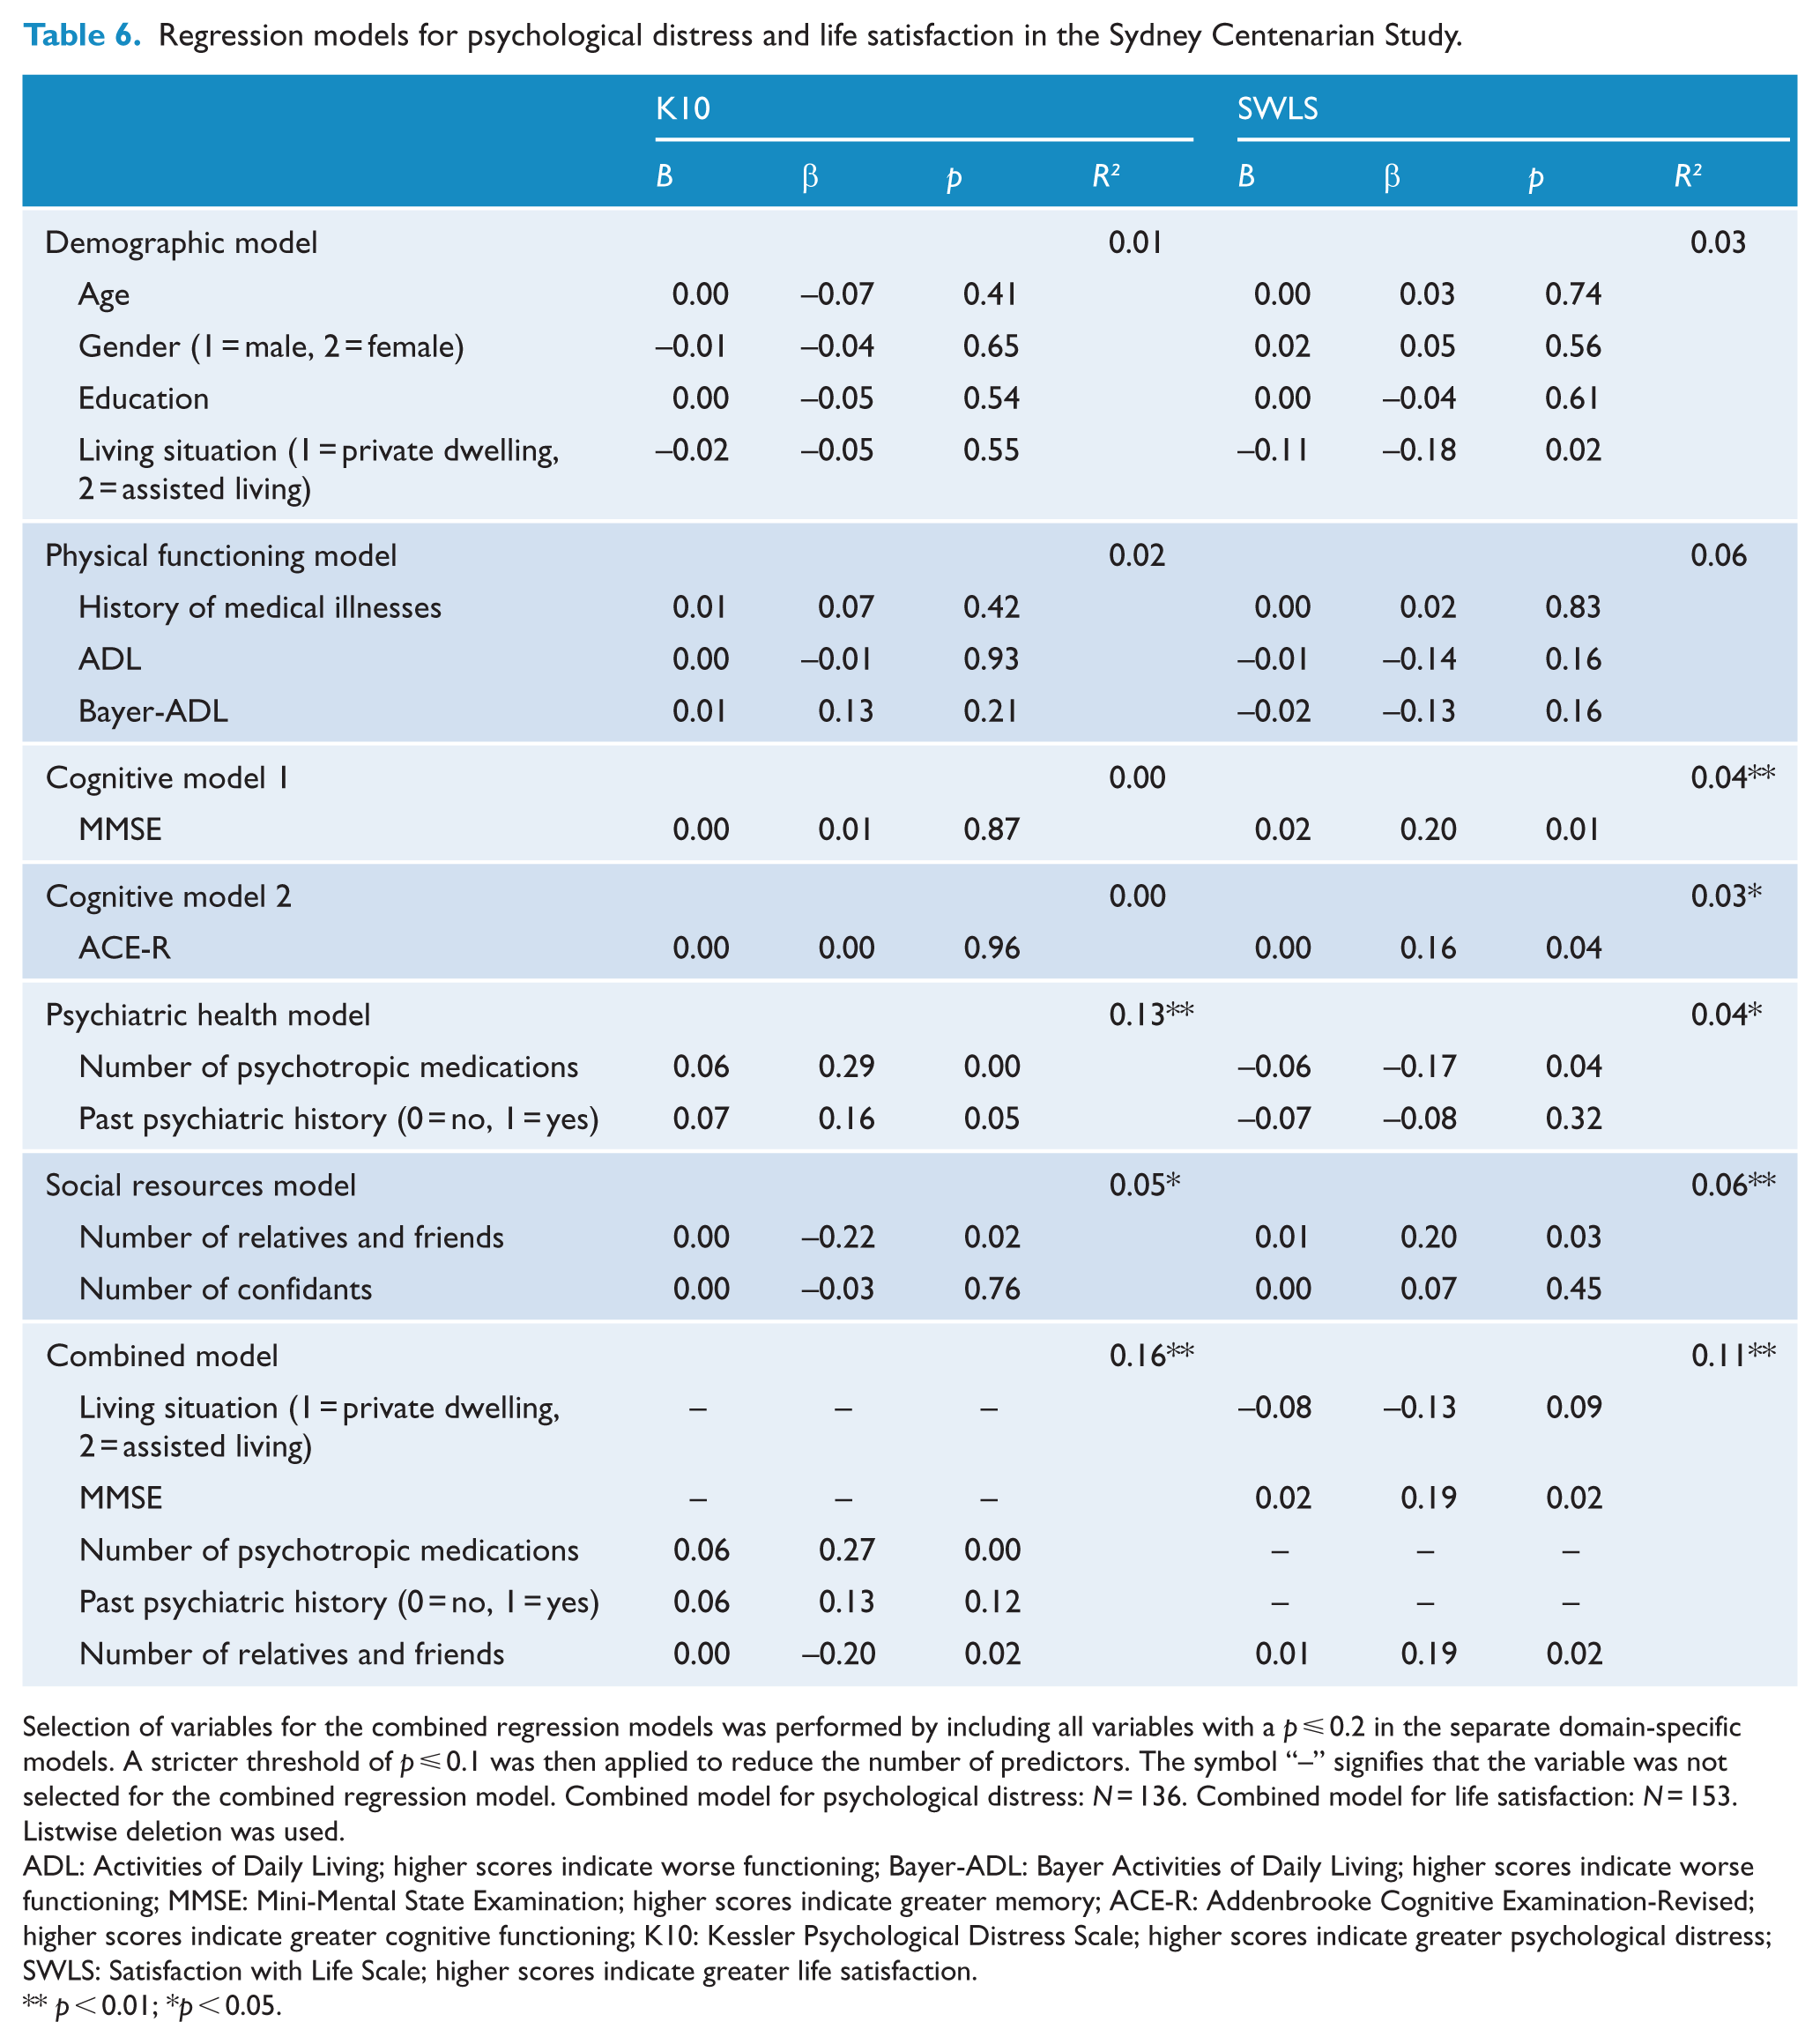
Selection of variables for the combined regression models was performed by including all variables with a p ⩽ 0.2 in the separate domain-specific models. A stricter threshold of p ⩽ 0.1 was then applied to reduce the number of predictors. The symbol “–” signifies that the variable was not selected for the combined regression model. Combined model for psychological distress: N = 136. Combined model for life satisfaction: N = 153. Listwise deletion was used.
ADL: Activities of Daily Living; higher scores indicate worse functioning; Bayer-ADL: Bayer Activities of Daily Living; higher scores indicate worse functioning; MMSE: Mini-Mental State Examination; higher scores indicate greater memory; ACE-R: Addenbrooke Cognitive Examination-Revised; higher scores indicate greater cognitive functioning; K10: Kessler Psychological Distress Scale; higher scores indicate greater psychological distress; SWLS: Satisfaction with Life Scale; higher scores indicate greater life satisfaction.
p < 0.01; *p < 0.05.
Demographic, physical functioning and cognitive health variables were not significantly associated with K10 score. By contrast, higher K10 scores were significantly associated with more psychotropic medications and fewer relatives and friends. The combined model with these two variables explained approximately 16.3% of the variance in psychological distress.
Life satisfaction was not significantly correlated with demographic, physical functioning and psychiatric health variables. Higher MMSE scores and regular contact with relatives and friends were significantly associated with higher life satisfaction. The combined model explained 11.1% of the variance in life satisfaction.
Discussion
The present study aimed to examine the psychological health of near-centenarians and centenarians by making cross-sectional comparisons with younger cohorts and investigating the risk and protective factors associated with psychological distress and life satisfaction. To the best of our knowledge, this is the largest study to examine psychological distress in those 95+ and the first study to investigate this using the K10.
As predicted and consistent with four previous studies (Bergdahl et al., 2005; Jang et al., 2004; Nyqvist et al., 2017; Scheetz et al., 2012), persons aged 95+ reported significantly higher levels of psychological distress than the younger counterparts aged 70–90 years. One reported explanation is that risk factors for psychological morbidity increase during the ageing process as the oldest-old experience greater loneliness, impaired mobility, declines in physical and cognitive function and institutionalisation (Stek et al., 2004). For example, 25.6% of the SCS cohort resided in assisted living facilities compared to 1.9% of the MAS cohort.
Our findings that 81% of SCS participants scored below the K10 cut-off of ⩾20 are consistent with reports from Australia and the United States. Richmond et al. (2011) reported that 86% of Australian centenarians did not describe depression; Jopp et al. (2016) from the United States reported that 80% of those 95+ did not have clinical levels of depressive symptoms, as assessed using a cut-off of ⩾8 on the 15-item Geriatric Depression Scale (GDS-15).
Inconsistent with our hypothesis, near-centenarians and centenarians reported significantly higher levels of life satisfaction compared to the younger age groups. This is a particularly interesting finding given that those 95+ were more psychologically distressed. Previous research has also reported these seemingly paradoxical results. Scheetz et al. (2012) found that although centenarians had higher scores than sexagenarians and octogenarians on the Geriatric Depression Scale (GDS-30), more reported being in good spirits than the younger age groups. Possible theoretical explanations are that high levels of life satisfaction may be a survivor effect or may occur as part of an adaptation process: centenarians accept the inevitable loss of function and reduction in activity and become content with their lives (Dello Buono et al., 1998).
The design of the instruments used to measure psychological distress and life satisfaction may also explain this seeming paradox. The K10 measures psychological distress over the past 4 weeks whereas the SWLS assesses satisfaction with a person’s life as a whole. Near-centenarians and centenarians may be psychologically distressed in the short-term, whereas in the long-run, they remain optimistic and satisfied with their overall lives. Furthermore, it is important to note that the K10 and SWLS measure different constructs. We found moderate negative correlations between K10 and SWLS in both the SCS and MAS cohort (see Supplemental Appendix 2).
Our findings from the SCS and MAS comparisons contradict previous research by Martin et al. (1996) and Yi and Vaupel (2002), who reported that centenarians were less satisfied with their lives than younger cohorts. These studies utilised different measurement tools to assess life satisfaction: Martin et al. (1996) employed the Older Americans Resources and Services (OARS) questionnaire and Yi and Vaupel (2002) asked a single item ‘how do you rate your life at present?’ with only four levels of responses available instead of the 7-point Likert-type scale used in this study. It is also possible that different sampling strategies, cultural diversity, age ranges, and inclusion and exclusion criteria for the studies may explain the variation in findings.
In line with previous findings, our study revealed that more psychotropic medications were associated with higher psychological distress (Forsell et al., 1995), although the direction of causality remains unclear. It may be that psychotropic drugs worsen psychological distress through medication interactions and side-effects; that those with high levels of psychological distress are more likely to be prescribed psychotropic drugs or that the association is bidirectional.
We found that regular contact with fewer relatives and friends was associated with greater psychological distress. These results confirm findings by Jopp et al. (2016) that a lack of support from relatives and friends significantly predicted levels of depressive symptoms, although they contradict Richmond et al. (2011) who found no association between levels of depression and social functioning. However, social support was operationalised differently in the two studies. Richmond et al. (2011) measured social functioning by assessing marital status, participation in social activities and time spent with families whereas this study and that by Jopp et al. (2016) used the number of relatives and friends as an indicator of social resources.
Surprisingly, we did not find that living situation was a significant predictor of psychological distress, unlike Margrett et al. (2010) who reported that institutional residence was associated with higher depression levels. However, depression and psychological distress are two different albeit overlapping concepts and comparisons should be treated with caution. Similar to Jopp et al. (2016) in the Fordham Centenarian Study, we found no association between residence type and life satisfaction. However, a large majority of the sample in both studies (74%) lived in a private dwelling, possibly implying a selection bias.
In our findings, ADL and Bayer-ADL did not emerge as significant predictors, in contrast to previous literature. One possible reason for the difference is that functional health was assessed by the informant, whereas previous studies (Jopp et al., 2016; Ribeiro et al., 2018) have only relied on participant responses, which has been associated with greater reporting bias (Jekel et al., 2015). Consistent with previous research (Forsell et al., 1995; Jopp et al., 2016; Kato et al., 2016), we found that cognition was not a significant predictor of psychological distress in near-centenarians and centenarians.
In line with previous findings, greater cognition was a significant predictor of higher life satisfaction. Higher cognitive functioning may facilitate individuals to perceive the positive aspects of life and adapt to the processes of ageing, thereby improving their satisfaction with life (Enkvist et al., 2013).
Regular contact with more relatives and friends was significantly associated with higher life satisfaction. Family members and friends often provide meaningful and enriching experiences that help maintain high levels of life satisfaction in the very old (Jopp et al., 2016).
Strengths and limitations
The current study is the largest sample of near-centenarians and centenarians to be studied in Australia. A further strength is the stringent age validation method to ensure the reliability of participants’ ages. The use of multiple sources of evidence to verify age safeguarded the study against inaccurate reporting.
Despite use of a mixed population and convenience sample, the entire SCS cohort from which the cognitively intact sample was drawn, was reasonably representative as compared to 2011 ABS census data (ABS, 2011) for the same geographical areas sampled. There were no significant differences in the proportion of females (71.7% in SCS vs 76.4% in the ABS data, p = 0.08), proportion of individuals in the 100+ age group (12.0% in SCS vs 8.6% in the ABS data, p = 0.08) proportion of individuals living in a private dwelling (58.6% in SCS vs 54.7% in the ABS data, p = 0.02) or in the educational qualifications attained (17.6% had a tertiary education, 18.1% had a leaving certificate and 64.3% did not complete a leaving certificate in SCS, compared to 15.6%, 22.6% and 61.8%, respectively, in the ABS data, p = 0.33).
However, the current findings cannot be generalised to all persons aged 95+ as the present study was restricted to seven local government areas in south-east Sydney, Australia. In addition, we only included centenarians without dementia to ensure the reliability of the psychological self-report measures. Utilising cognitively intact centenarians increases the reliability of self-report information about mental health status. Consequently, our findings may not characterise centenarians with cognitive impairment or dementia. Recruitment bias may have influenced the comparison of SCS and MAS. In the MAS study, participants were recruited solely from the electoral roll but had a response rate of 19.9% (1772 out of 8914 people) (Sachdev et al., 2010). Therefore, the findings may be susceptible to the healthy volunteer bias.
Although the minimum requirement for informants in this study was 1 hour of contact a week with participants, informants were relatives who knew participants well. In addition, the average time of contact was significantly higher in both SCS (7.6 hours) and MAS (8.3 hours).
A limitation of this study is the cross-sectional design, which does not allow causal relationships between variables to be inferred as well as the directions of associations. It is also unclear whether the differences in levels of psychological distress and life satisfaction between SCS and MAS are a result of age-related changes or cohort effects.
Although we used the Lubben Social Network Scale as a framework for defining regular social contact, regular contact may vary across cultures as demonstrated by Georgas et al. (2001). Finally, our regression model only explained 11% in the variance of life satisfaction, indicating that other important factors influence life satisfaction such as the extraversion personality trait and an optimistic outlook on life (Kato et al., 2016).
Conclusion
This study adds to the small body of research on the mental health of near-centenarians and centenarians. Our findings have considerable implications for the development of services tailored towards the oldest-old and their specific needs. Despite the growing population of centenarians, many developed countries including Australia have few policies adapted to this unique group of individuals. Given that the 95+ population suffer higher rates of psychological distress than younger age groups, policies could focus on prevention through enhancing social networks.
Future research should continue to examine the prevalence and risk factors of psychological morbidity and life satisfaction in the oldest-old due to the conflicting results. Other facets of psychological health should be examined, including behavioural and psychological symptoms of dementia and apathy, as these concepts have not been investigated in those at the extreme ages, as well as personality variables. Longitudinal data could examine the relationship between declines in psychological health and time to death. Longitudinal analysis can also provide insight into whether the variations in psychological health are caused by age or cohort differences. The findings of this study are an important step in determining the specific needs of the oldest-old, who are the fastest growing segment in Australia and other developed countries and point the way to improved care for this vulnerable group.
Supplemental Material
Supplemental – Supplemental material for The psychological health of 207 near-centenarians (95–99) and centenarians from the Sydney Centenarian Study
Supplemental material, Supplemental for The psychological health of 207 near-centenarians (95–99) and centenarians from the Sydney Centenarian Study by Adrian Cheng, Yvonne Leung, John D Crawford, Fleur Harrison, Perminder Sachdev and Henry Brodaty in Australian & New Zealand Journal of Psychiatry
Footnotes
Acknowledgements
The authors would like to thank the study coordinators and research assistants of SCS and MAS at CHeBA for data collection and Dr Kristan Kang for data management support.
Declaration of Conflicting Interests
The author(s) declared no potential conflicts of interest with respect to the research, authorship and/or publication of this article.
Funding
The author(s) disclosed receipt of the following financial support for the research, authorship and/or publication of this article: The Sydney Centenarian Study was funded by the National Health and Medical Research Council (NHMRC) of Australia (Project Grant 630593 and Programme Grant 568969). The Sydney Memory and Ageing Study was funded by a NHMRC Programme Grant (350833).
Supplemental material
Supplemental material for this article is available online.
References
Supplementary Material
Please find the following supplemental material available below.
For Open Access articles published under a Creative Commons License, all supplemental material carries the same license as the article it is associated with.
For non-Open Access articles published, all supplemental material carries a non-exclusive license, and permission requests for re-use of supplemental material or any part of supplemental material shall be sent directly to the copyright owner as specified in the copyright notice associated with the article.