
Abstract
Objective:
Disruptions in biological rhythms and sleep are a core aspect of mood disorders, with sleep and rhythm changes frequently occurring prior to and during mood episodes. Wrist-worn actigraphs are increasingly utilized to measure ambulatory activity rhythm and sleep patterns.
Methods:
A comprehensive study using subjective and objective measures of sleep and biological rhythms was conducted in 111 participants (40 healthy volunteers [HC], 38 with major depressive disorder [MDD] and 33 with bipolar disorder [BD]). Participants completed 15-day actigraphy and first-morning urine samples to measure 6-sulfatoxymelatonin levels. Sleep and biological rhythm questionnaires were administered: Biological Rhythms Interview of Assessment in Neuropsychiatry (BRIAN), Munich Chronotype Questionnaire (MCTQ), Pittsburgh Sleep Quality Index (PSQI) and Epworth Sleepiness Scale (ESS). Actigraph data were analyzed for sleep and daily activity rhythms, light exposure and likelihood of transitioning between rest and activity states.
Results:
Mood groups had worse subjective sleep quality (PSQI) and biological rhythm disruption (BRIAN) and higher objective mean nighttime activity than controls. Participants with BD had longer total sleep time, higher circadian quotient and lower 6-sulfatoxymelatonin levels than HC group. The MDD group had longer sleep onset latency and higher daytime probability of transitioning from rest to activity than HCs. Mood groups displayed later mean timing of light exposure. Multiple linear regression analysis with BRIAN scores, circadian quotient, mean nighttime activity during rest and daytime probability of transitioning from activity to rest explained 43% of variance in quality-of-life scores. BRIAN scores, total sleep time and probability of transitioning from activity to rest explained 52% of variance in functioning (all p < 0.05).
Conclusions:
Disruption in biological rhythms is associated with poorer functioning and quality of life in bipolar and MDD. Investigating biological rhythms and sleep using actigraphy variables, urinary 6-sulfatoxymelatonin and subjective measures provide evidence of widespread sleep and circadian system disruptions in mood disorders.
Introduction
Changes in biological rhythms and sleep occur during most major mood episodes and are linked to clinical severity in both major depressive disorder (MDD) and bipolar disorder (BD; Malhi and Kuiper, 2013). Notably, sleep disturbances are frequently reported by patients prior to the onset of either depressive or (hypo)manic mood episodes (Jackson et al., 2003; Van Meter et al., 2016), indicating sleep and biological rhythm disturbances persist beyond mood episodes (Geoffroy et al., 2015; Mondin et al., 2017).
While polysomnography is the gold standard of measuring sleep, use of actigraphy to estimate sleep and daily activity rhythms offers the advantage of continuous, ambulatory monitoring. Though research using measurement of activity and sleep patterns in mood disorders has grown exponentially, methods of collection, aggregation and analysis of these data are still under development. Use of objective measures of activity and sleep can help in designing the mechanistic rationale for chronotherapeutic treatments of these disorders. In this context, a deeper investigation of patterns, rhythms and variability of activity is becoming increasingly relevant in the context of mood disorders (Scott et al., 2017). For instance, the Diagnostic and Statistical Manual of Mental Disorders (5th ed.; DSM-5) has revised the core diagnostic criteria for (hypo)mania to include increased energy or activity in addition to mood changes. This has led to a multidomain conceptualization of activation, as a combination of objectively observable motor activity and subjective experience of energy, caused by physiological underpinnings. While previous reports have shown that activity in bipolar depression is more variable and lower than that of healthy controls (HCs), manic episodes appear to differ in variability in activity patterns and the robustness of these patterns, rather than activity levels. In addition, activity levels in bipolar euthymia are lower in comparison to HCs and MDD (Scott et al., 2017). Furthermore, a recent study found that individuals with BD had desynchronization of diurnal heart rate rhythms with sleep and activity rhythms, while ultradian rhythms in negative affect and irritable mood were more highly correlated with sleep and heart rate rhythms (Carr et al., 2018).
The circadian system is synchronized to the environment through the process of entrainment involving time-keeping factors called zeitgebers, which set the master clock located in the suprachiasmatic nucleus (SCN). The most robust of these factors is light, though physical activity, eating patterns and social activity also play an important role (Mistlberger and Antle, 2011). Social rhythms and light have served as targets for chronobiological interventions for mood disorders, such as bright light therapy, interpersonal and social rhythm therapy and blue-blocking glasses (Al-Karawi and Jubair, 2016; Frank et al., 2005; Henriksen et al., 2016). However, levels of illuminance exposure have been under-investigated in mood disorders. Similarly, melatonin secretion may provide additional insight into biological rhythms in mood disorders, given its central role in entrainment. It has been shown that manic subjects display higher daytime melatonin secretion compared to depressed individuals and controls (Nováková et al., 2015).
Subjective disturbance in sleep and biological rhythms in mood disorders has been extensively investigated using clinical questionnaires. For instance, evening chronotype is more prevalent in BD (Wood et al., 2009) and is associated with worse depressive symptom severity (Au and Reece, 2017). Patients with BD have displayed dysfunctional beliefs about sleep, which may lead to maintenance of sleep disturbances in this population (Harvey et al., 2005). In addition, subjective biological rhythm disturbances have been found to predict quality of life (QOL) in BD (Cudney et al., 2016) and functional impairment in BD and HCs (Giglio et al., 2010; Pinho et al., 2016). However, prior studies investigating sleep and biological rhythm disturbances have been limited by sample size, inadequate duration of actigraphy data collection and use of either subjective or objective measurements of sleep and activity. To our knowledge, no prior study has reported on differences in light exposure or subjective and objective measures of biological rhythms and sleep, in both BD and MDD; neither are there reports on objective measurements of activity and sleep as predictors of functional impairment and QOL in mood disorders.
Here, we present a study where sleep and biological rhythm disruption was assessed through a variety of measures, including subjective questionnaires, actigraphy-measured activity, sleep patterns and light exposure, as well as nocturnal melatonin secretion in a well-characterized sample of individuals with MDD and BD. We hypothesize that sleep and biological rhythms will be more disrupted in the mood disorder groups compared to HCs, on both subjective and objective measures. We additionally hypothesize that impairment on measures of functional outcomes and QOL will be linked to worse subjective and objective markers of sleep and biological rhythms.
Methods and materials
Participants
Participants were between the ages of 18 and 65 years, had a diagnosis of MDD or BD or had no history of a psychiatric diagnosis (HC). To determine clinical diagnosis, psychiatric history and current mood state, the Mini International Neuropsychiatric Interview (MINI) English Version 6.0.0. was administered to all participants (Sheehan et al., 1998).
Participants were excluded from the study if they (1) had a current or lifetime history of a sleep disorder; (2) had used melatonin within 2 months prior to commencing the study; (3) were employed in shiftwork; (4) were currently using prescribed sleep medications (e.g. trazodone, zopiclone, zolpidem) or sedative-hypnotic medications (e.g. benzodiazepines, barbiturates); (5) were currently using illicit substances as sleep aids or recreationally (e.g. marijuana); (6) currently used prescription analgesics with sedative effects, such as opioids or non-steroidal anti-inflammatory drugs; (7) met current criteria for current alcohol/substance abuse or dependence according to the MINI or (8) if they were currently experiencing jet lag from a recent trip outside of the Eastern Standard Time. Participants were recruited from two psychiatric outpatient clinics (the Mood Disorders Program and Women’s Health Concerns Clinic) at St Joseph’s Healthcare Hamilton, Ontario, and from online and local community advertisements. All study participants gave written informed consent to take part in the study, with accordance to the Declaration of Helsinki, as approved by the Hamilton Integrated Research Ethics Board (Project #14-251).
Study procedures
Participants made two visits to St Joseph’s Healthcare Hamilton over the span of 15 days. During the first visit, written informed consent was obtained. Clinical diagnosis, psychiatric history and mood state were determined using the MINI. Participants were then fitted with a configured actigraph (Actiwatch 2; Philips Respironics Inc., Biolynx, Montreal, QC, Canada), which they were instructed to wear throughout the 15-day duration of the study. A sleep log was given to participants in order to record periods of actigraph removal, morning wake-up times, naps and bedtimes. Subjects were then given a urine sample container and were instructed to collect the first morning urine sample on day 15. On day 15, participants returned for a second and final visit and were asked to return the actigraph, urine container and sleep log.
Clinical assessments
Subjective disturbances in biological rhythms were assessed using the self-report Biological Rhythms Interview of Assessment in Neuropsychiatry (BRIAN; Giglio et al., 2009). The BRIAN is an 18-item self-report questionnaire, developed for use in mood disorder populations, which monitors biological rhythm disruption over the preceding 15 days, evaluating sleep, activity, eating patterns and social patterns. The BRIAN questionnaire additionally included a previously unvalidated 3-item measure of chronotype.
Sleep quality was assessed using the Pittsburgh Sleep Quality Index (PSQI), a self-report questionnaire developed to assess sleep quality in individuals with affective disorders (Buysse et al., 1989). The Munich Chronotype Questionnaire (MCTQ) was used to assess chronotype, based on the mean mid-sleep point, calculated from the self-reported sleep onset and offset on work-free days, corrected for sleep debt accumulated throughout the week (Roenneberg et al., 2003). Functioning was assessed using the Functioning Assessment Short Test (FAST), a self-report checklist developed for use in psychiatric patients, which assesses functioning in six domains: autonomy, occupational and cognitive functioning, financial issues, interpersonal relationships and leisure time (Rosa et al., 2007).
The World Health Organization’s Quality-of-Life Assessment—BREF (WHOQOL-BREF) was administered to evaluate QOL (World Health Organization [WHO], 1996).
Daytime sleepiness was measured using the Epworth Sleepiness Scale (ESS; Johns, 1991). The clinician-administered Young Mania Rating Scale (YMRS) was used to assess symptoms of mania (Young et al., 1978), and Montgomery-Åsberg Depression Rating Scale (MADRS) was used to assess depressive symptoms (Montgomery and Åsberg, 1979). Finally, a General Circadian Disorder Checklist, consisting of three clinician-administered items, was used to confirm that participants in the study did not have a current circadian disorder.
Urinary 6-sulfatoxymelatonin
A first morning urine sample was used to measure melatonin’s primary urinary metabolite, 6-sulfatoxymelatonin (6-SM). Participants were instructed to refrigerate the urine sample prior to arrival to the laboratory on the day that it was collected. 6-sulfatoxymelatonin levels were normalized to creatinine concentration, expressed as nanogram/milligram. Creatinine levels in the urine were analyzed by the Hamilton Regional Laboratory Medicine Program at St Joseph’s Healthcare Hamilton (license no. 4037) using the Jaffe method (kinetic alkaline picrate; Abbott Diagnostics, Santa Clara, CA, USA). Samples were then analyzed for 6-SM using enzyme-linked immunosorbent assay (ELISA) for 6-SM (Buhlmann Diagnostics Corporation, Amherst, NH, USA). Assay sensitivity was 0.14 ng/mL. The intra- and inter-assay coefficients of variation were 7.1% and 11.9%, respectively.
Actigraphy
Objective measures of sleep and daily activity rhythms were obtained using the Actiwatch 2 monitor. Actigraphy data were extracted by a specialized software, which distinguishes sleep from waking and information collection regarding sleep and activity phases. These data were collected in 1-minute epochs continuously for 15 days and retrieved for processing using the Philips Actiware software Version 6.0. Default sleep/wake thresholds were used to determine sleep and activity periods throughout the observation period. Sleep and illuminance measures were extracted and averaged to produce a single value for each measure using Actiware software: total sleep time (TST)—amount of hours spent asleep, excluding time spent awake in bed; sleep onset latency (SOL)—number of minutes encompassing the transition from wakefulness to sleep; sleep efficiency (standard error [SE])—percentage of TST divided by time in bed, where lower SE is reflective of worse sleep quality and wake after sleep onset (WASO)—number of minutes spent active from sleep onset to sleep offset. Mean Mid-Sleep Time was calculated manually as the midpoint between sleep onset and get up time, adjusting for SOL. Any periods during which actigraphs were removed, as recorded using the sleep log, were excluded from the analysis. In addition, visual inspection was used to identify and remove intervals ⩾20 minutes where no movement was observed. Intervals with ⩾4 excluded hours were identified, and the 24-hour period surrounding these intervals was removed from the analysis. Data were split into weekend and weekday data, of which only weekday data were used in the final analyses.
Illuminance variables extracted from Actiware included the following variables for rest, active and sleep periods: light exposure, average light, maximum light, time above light threshold (TAT; 1000 lux) and percent invalid light.
Statistical analysis
Statistical analyses were performed using R (Version 3.2.2; Team RC, 2016) and Python (Version 2.7.6).
Cosinor and non-parametric actigraphy
Cosinor analysis was employed to evaluate daily activity rhythms, using the R package ‘cosinor’. This analysis fits time-series data to a single cosine wave, giving characteristics of the wave which include (1) MESOR—midline estimating statistic of the rhythm; (2) amplitude of the rhythm; (3) acrophase—a measure of the timing of peak activity and (4) circadian quotient—the ratio of amplitude to MESOR, which can be used as a measure of the strength of an individual rhythm. Individual circadian activity rhythm periods were calculated using non-linear regression, where a period was assigned through extracting a peak between T = 23 hours and T = 25 hours from the periodogram. This individual analysis allowed for more accurate representation of each participant’s endogenous period.
Applicability of cosinor analysis can be limited by non-sinusoidality of time series data and inability to detect fragmentation of rhythms, which has led to the introduction of non-parametric circadian rhythm analysis. This approach complements cosinor analysis by addressing rhythm fragmentation, stability, average levels and timing of activity (Thomas et al., 2015). Non-parametric circadian activity rhythm analysis was employed using the nparACT (Version 0.8) package, which obtained the following measures: (1) Interdaily stability (IS)—a measure of the strength of coupling between the endogenous circadian activity rhythm and external zeitgebers. IS ranges from 0 to 1, with higher values indicating greater synchronization of circadian activity rhythm to the external environment. It is the normalized ratio of the variance of the mean rhythm over the total variance throughout the study duration. (2) Intradaily variability (IV) is a measure of circadian activity rhythm fragmentation, which is the ratio of the mean square difference between successive measurements to the overall variance of the data. IV ranges from 0 to 2, with higher values indicating higher fragmentation of the circadian rhythm. (3) Five consecutive hours of lowest average activity amplitude (L5), (4) start time of L5, (5) 10 consecutive hours with highest amplitude values (M10) and (6) M10 start time. (7) Relative amplitude (RA) of the rhythm, consisting of the difference between average M10 and L5, divided by sum of activity during these 15 hours. RA ranges from 0 to 1, with higher values representing higher amplitude.
We calculated nighttime activity mean—the total of the activity counts measured every night during sleep intervals, averaged across the data collection period. Higher nighttime activity mean indicates higher sleep disturbance.
Light exposure
Minute-by-minute illuminance levels, as obtained from actigraphy, were used to calculate whole-day TAT and mean timing above light threshold (MLiT)—a measure of the average time during which TAT occurs. Four different thresholds of illuminance were used to calculate TAT and MLiT: 10 lux (dim light), 100 lux, 500 lux (approximate illuminance of office lighting) and 1000 lux (approximate illuminance of an overcast day).
Transition probabilities
We estimated transition probabilities from actigraphy data based on methods described by Ortiz et al. (2016) and a prior publication from our group (Allega et al., 2018). A transition series was created between two states (rest and activity), estimated from the probability of staying in each state for each of the individual minute-by-minute activity records. The probability of transitioning from each state was then calculated, as the probability that after a series of minute-by-minute epochs of remaining in one state, the individual would switch to the other state or vice versa (Ortiz et al., 2016). This analysis was performed using the Hidden Markov Model (HMM)—a statistical model based on the theory that a time series of observed data is the outcome of a hidden state variable. The hidden state sequence, therefore, is dependent on the current state. The hmmlearn package (Version 0.2.0) was used in Python to build the model and calculate its parameters, using the Baum–Welch algorithm. We separated data into nighttime and daytime periods, where the nighttime period was defined as the lowest 8 mean activity hours, and the other 16 hours were defined as the daytime period (Ortiz et al., 2016). The mean activity counts of rest and activity states (µR and µA) and the probability of transitioning between states (Prest-active [pRA] and Pactive-rest [pAR]) were calculated for day and night. Higher values of pRA are indicative of the individual staying in an active state.
Group differences
Chi-square tests were used to evaluate differences in categorical variables across groups. One-way ANOVAs and Kruskal–Wallis tests were used to compare continuous variables across groups. Next, we performed a multiple linear regression analysis to predict FAST and WHOQOL-BREF scores using variables obtained from actigraphy, the BRIAN questionnaire and MCTQ chronotype. We tested whether assumptions were met for linear regression analysis, including normality, linearity, independence of variance, multicollinearity and homoscedasticity. Variables were transformed to meet regression assumptions if they were not normally distributed.
Results
Of the total of 131 participants enrolled in the study, 20 withdrew for a variety of reasons (family emergency, work schedule, exams and failure to report current melatonin use). The final sample consisted of 111 subjects (MDD = 38; BD = 33; HC = 40; see Table 1 for demographic and clinical characteristics of the sample). A larger proportion of the BD group was unemployed compared to the HCs, and participants in the HC group had more years of education (p < 0.05). In terms of clinical variables, participants with BD had an earlier age of onset than those with MDD (p < 0.05). Approximately 36% of both mood groups were currently in a major depressive episode. Expectedly, the MDD and BD groups had higher scores than controls on the MADRS, indicating worse depressive symptoms. The BD group had higher manic symptoms (YMRS) compared to HCs (all p < 0.001), although no participants with BD met criteria for a current (hypo)manic or mixed episode. In addition, both the MDD and BD groups had worse functioning (FAST) and QOL (WHOQOL-BREF) (p < 0.0001; Table 2).
Demographic and clinical variables.
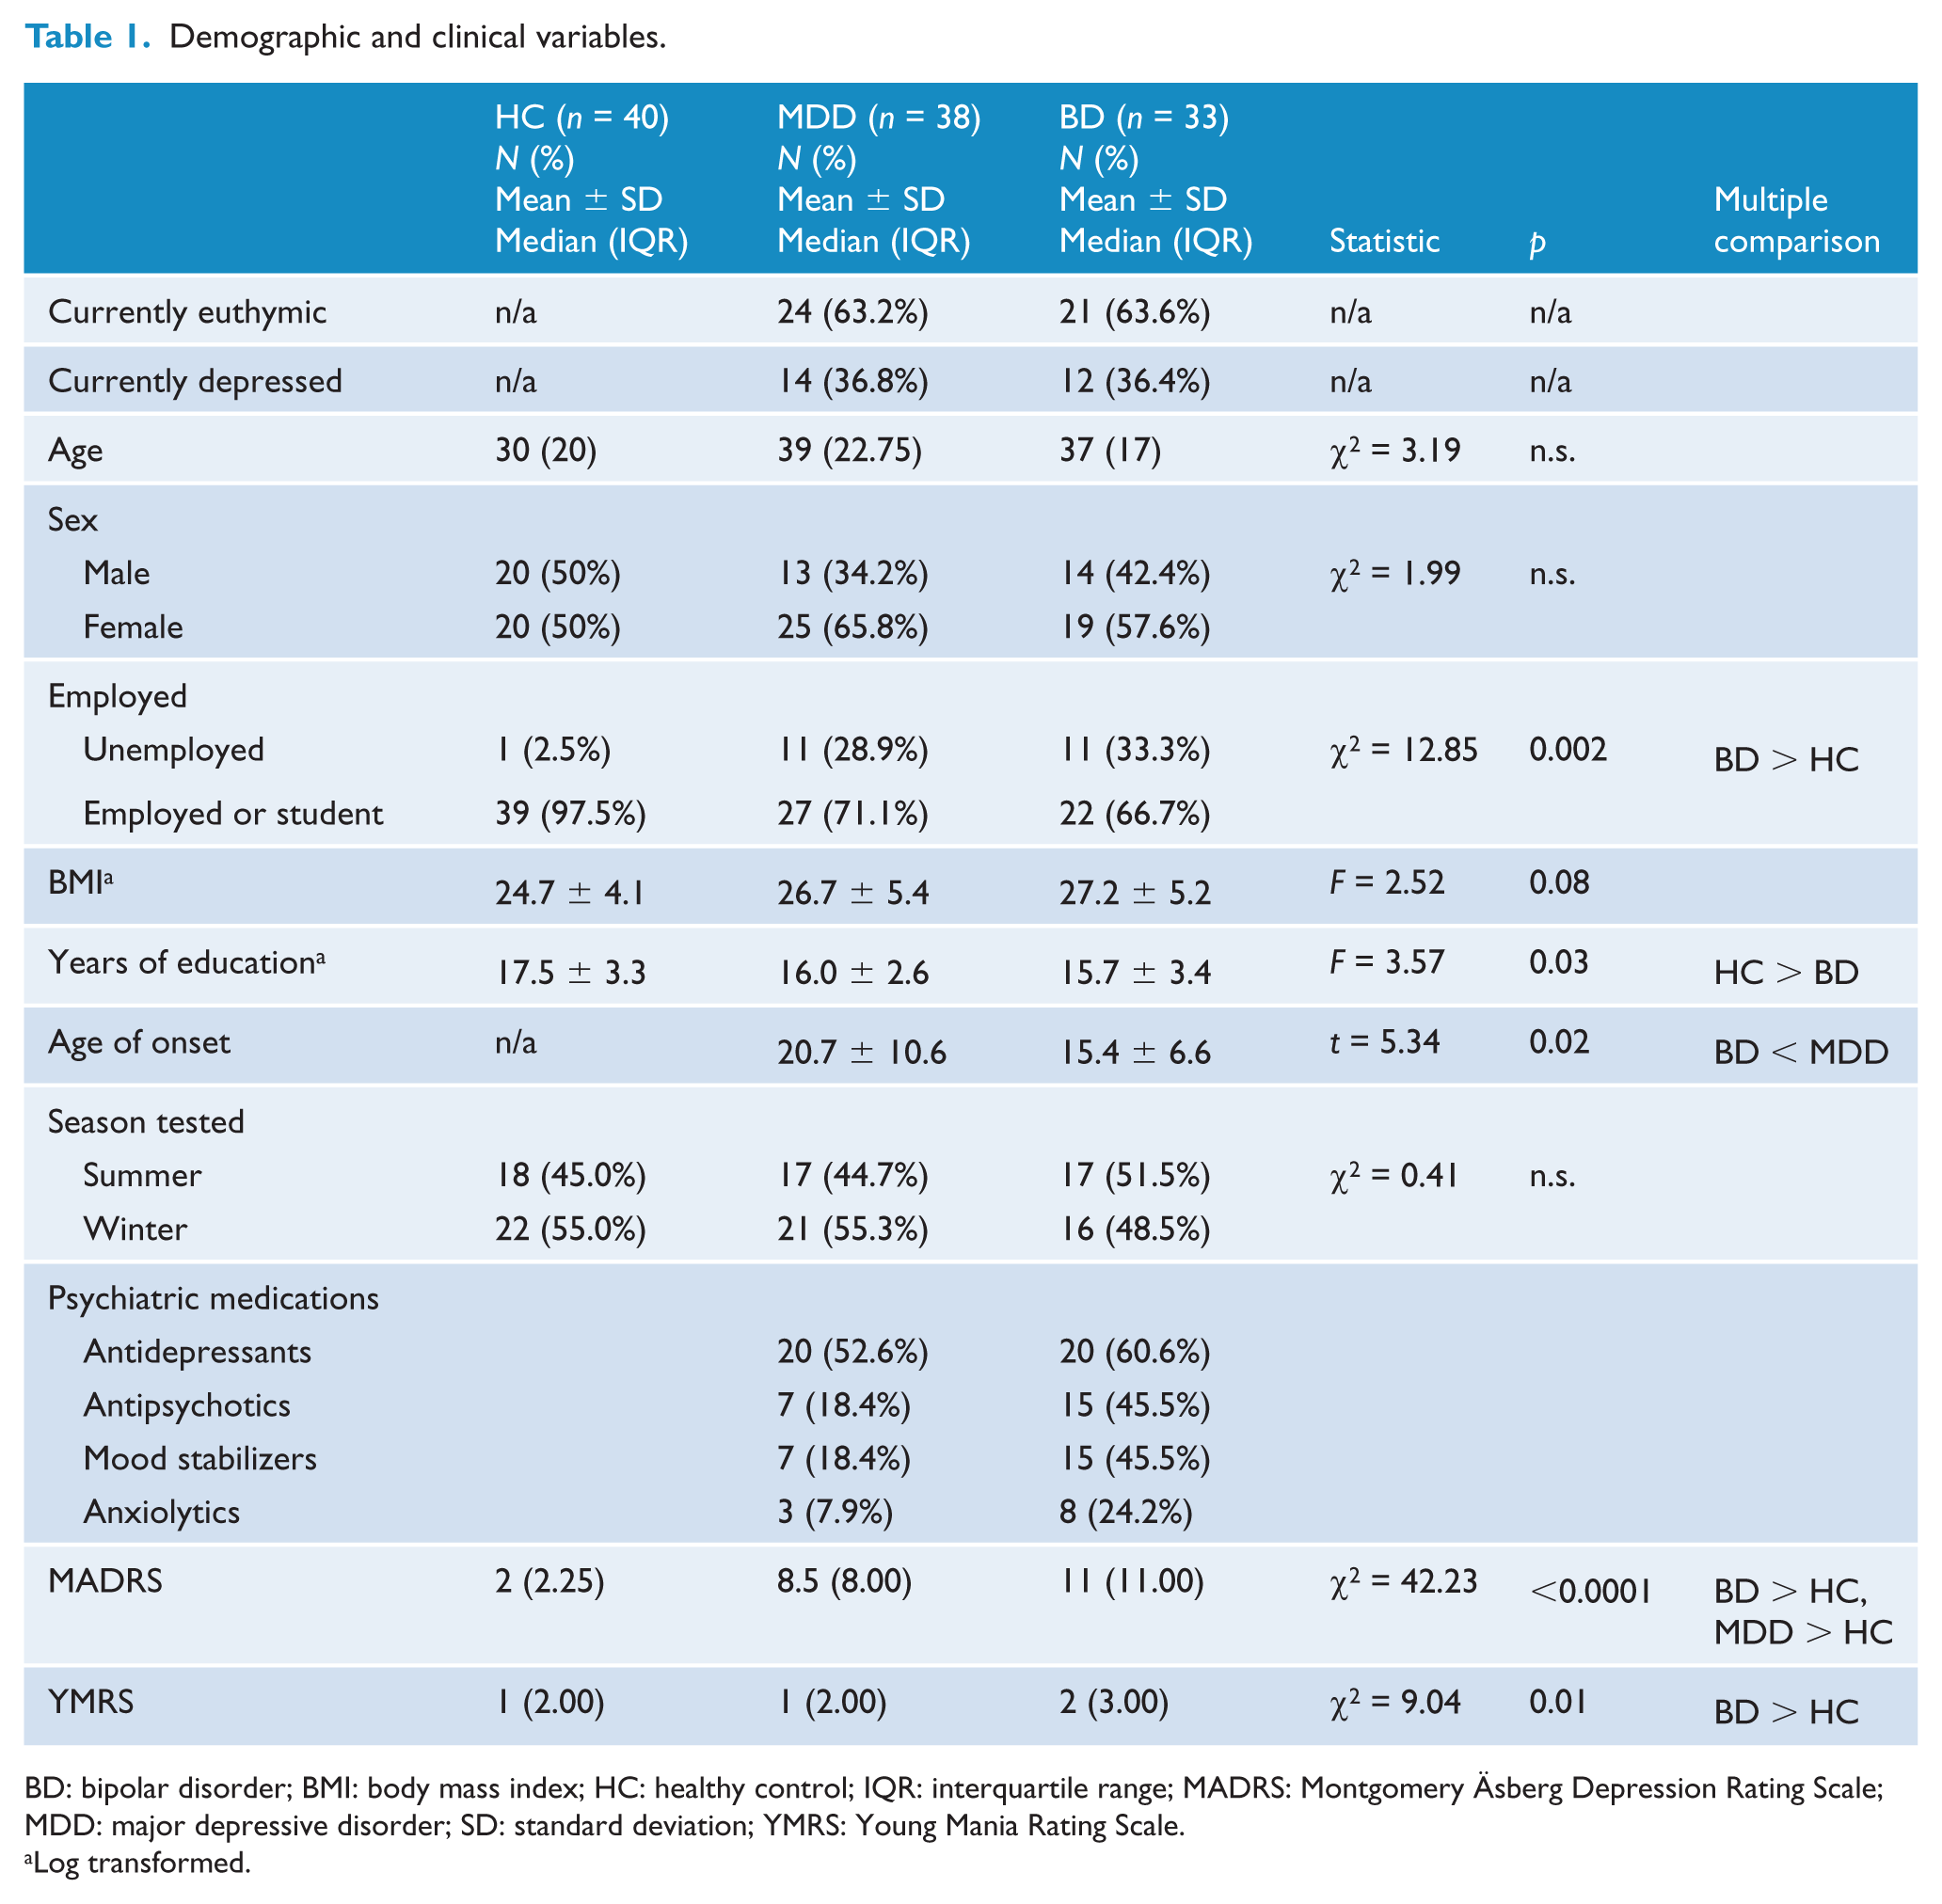
BD: bipolar disorder; BMI: body mass index; HC: healthy control; IQR: interquartile range; MADRS: Montgomery Äsberg Depression Rating Scale; MDD: major depressive disorder; SD: standard deviation; YMRS: Young Mania Rating Scale.
Log transformed.
Group differences in measures of subjective biological rhythms, sleep, functioning and quality of life.
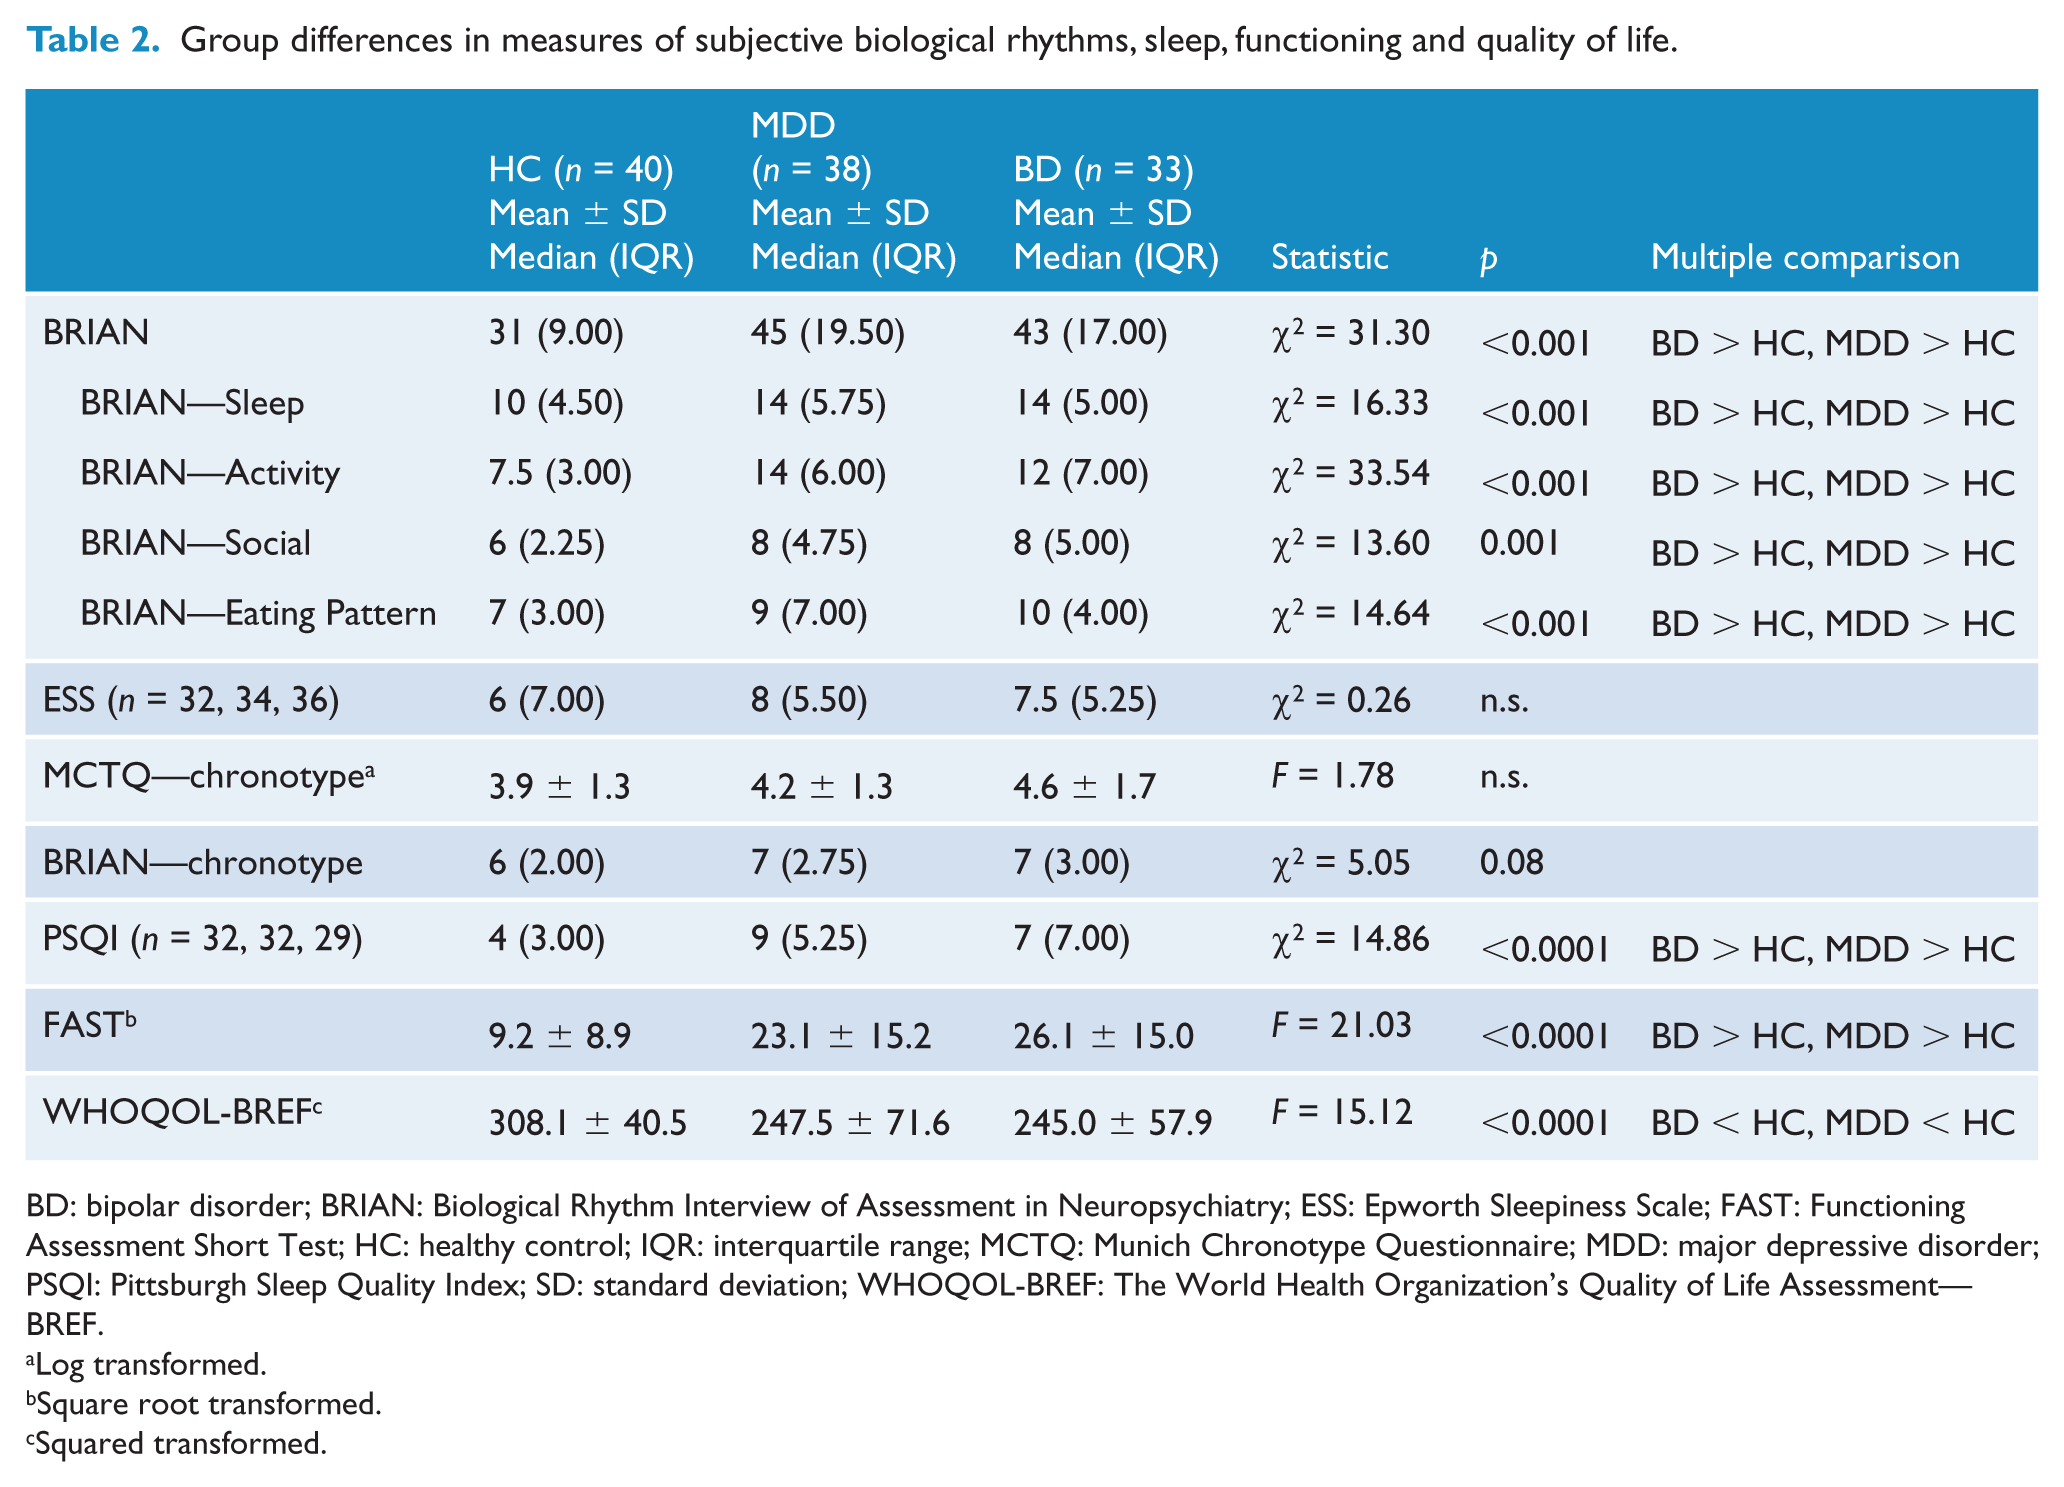
BD: bipolar disorder; BRIAN: Biological Rhythm Interview of Assessment in Neuropsychiatry; ESS: Epworth Sleepiness Scale; FAST: Functioning Assessment Short Test; HC: healthy control; IQR: interquartile range; MCTQ: Munich Chronotype Questionnaire; MDD: major depressive disorder; PSQI: Pittsburgh Sleep Quality Index; SD: standard deviation; WHOQOL-BREF: The World Health Organization’s Quality of Life Assessment—BREF.
Log transformed.
Square root transformed.
Squared transformed.
Subjective assessments of sleep and biological rhythms
Both the MDD and BD groups had higher scores on the BRIAN questionnaire and its subdomains, excluding chronotype, indicating higher disturbances in all four domains of biological rhythmicity (all p ⩽ 0.001; See Table 2). Sleep quality according to the PSQI was also subjectively worse in both mood groups. No significant differences were found between the mood groups in subjective sleep quality (PSQI) or subjective biological rhythm disturbance (BRIAN). No differences were detected in daytime sleepiness (ESS) or chronotype (MCTQ, BRIAN; p > 0.05) between the groups. It should be noted that as PSQI and ESS were added later in the study, data for 15 participants were missing for ESS and data for 18 participants were missing for PSQI.
Objective assessments of sleep and biological rhythms
See Tables 3 and 4 for a summary of comparisons between BD, MDD and HC in objective measures of sleep, biological rhythms and light exposure.
Group differences for objective measures of sleep and biological rhythms.
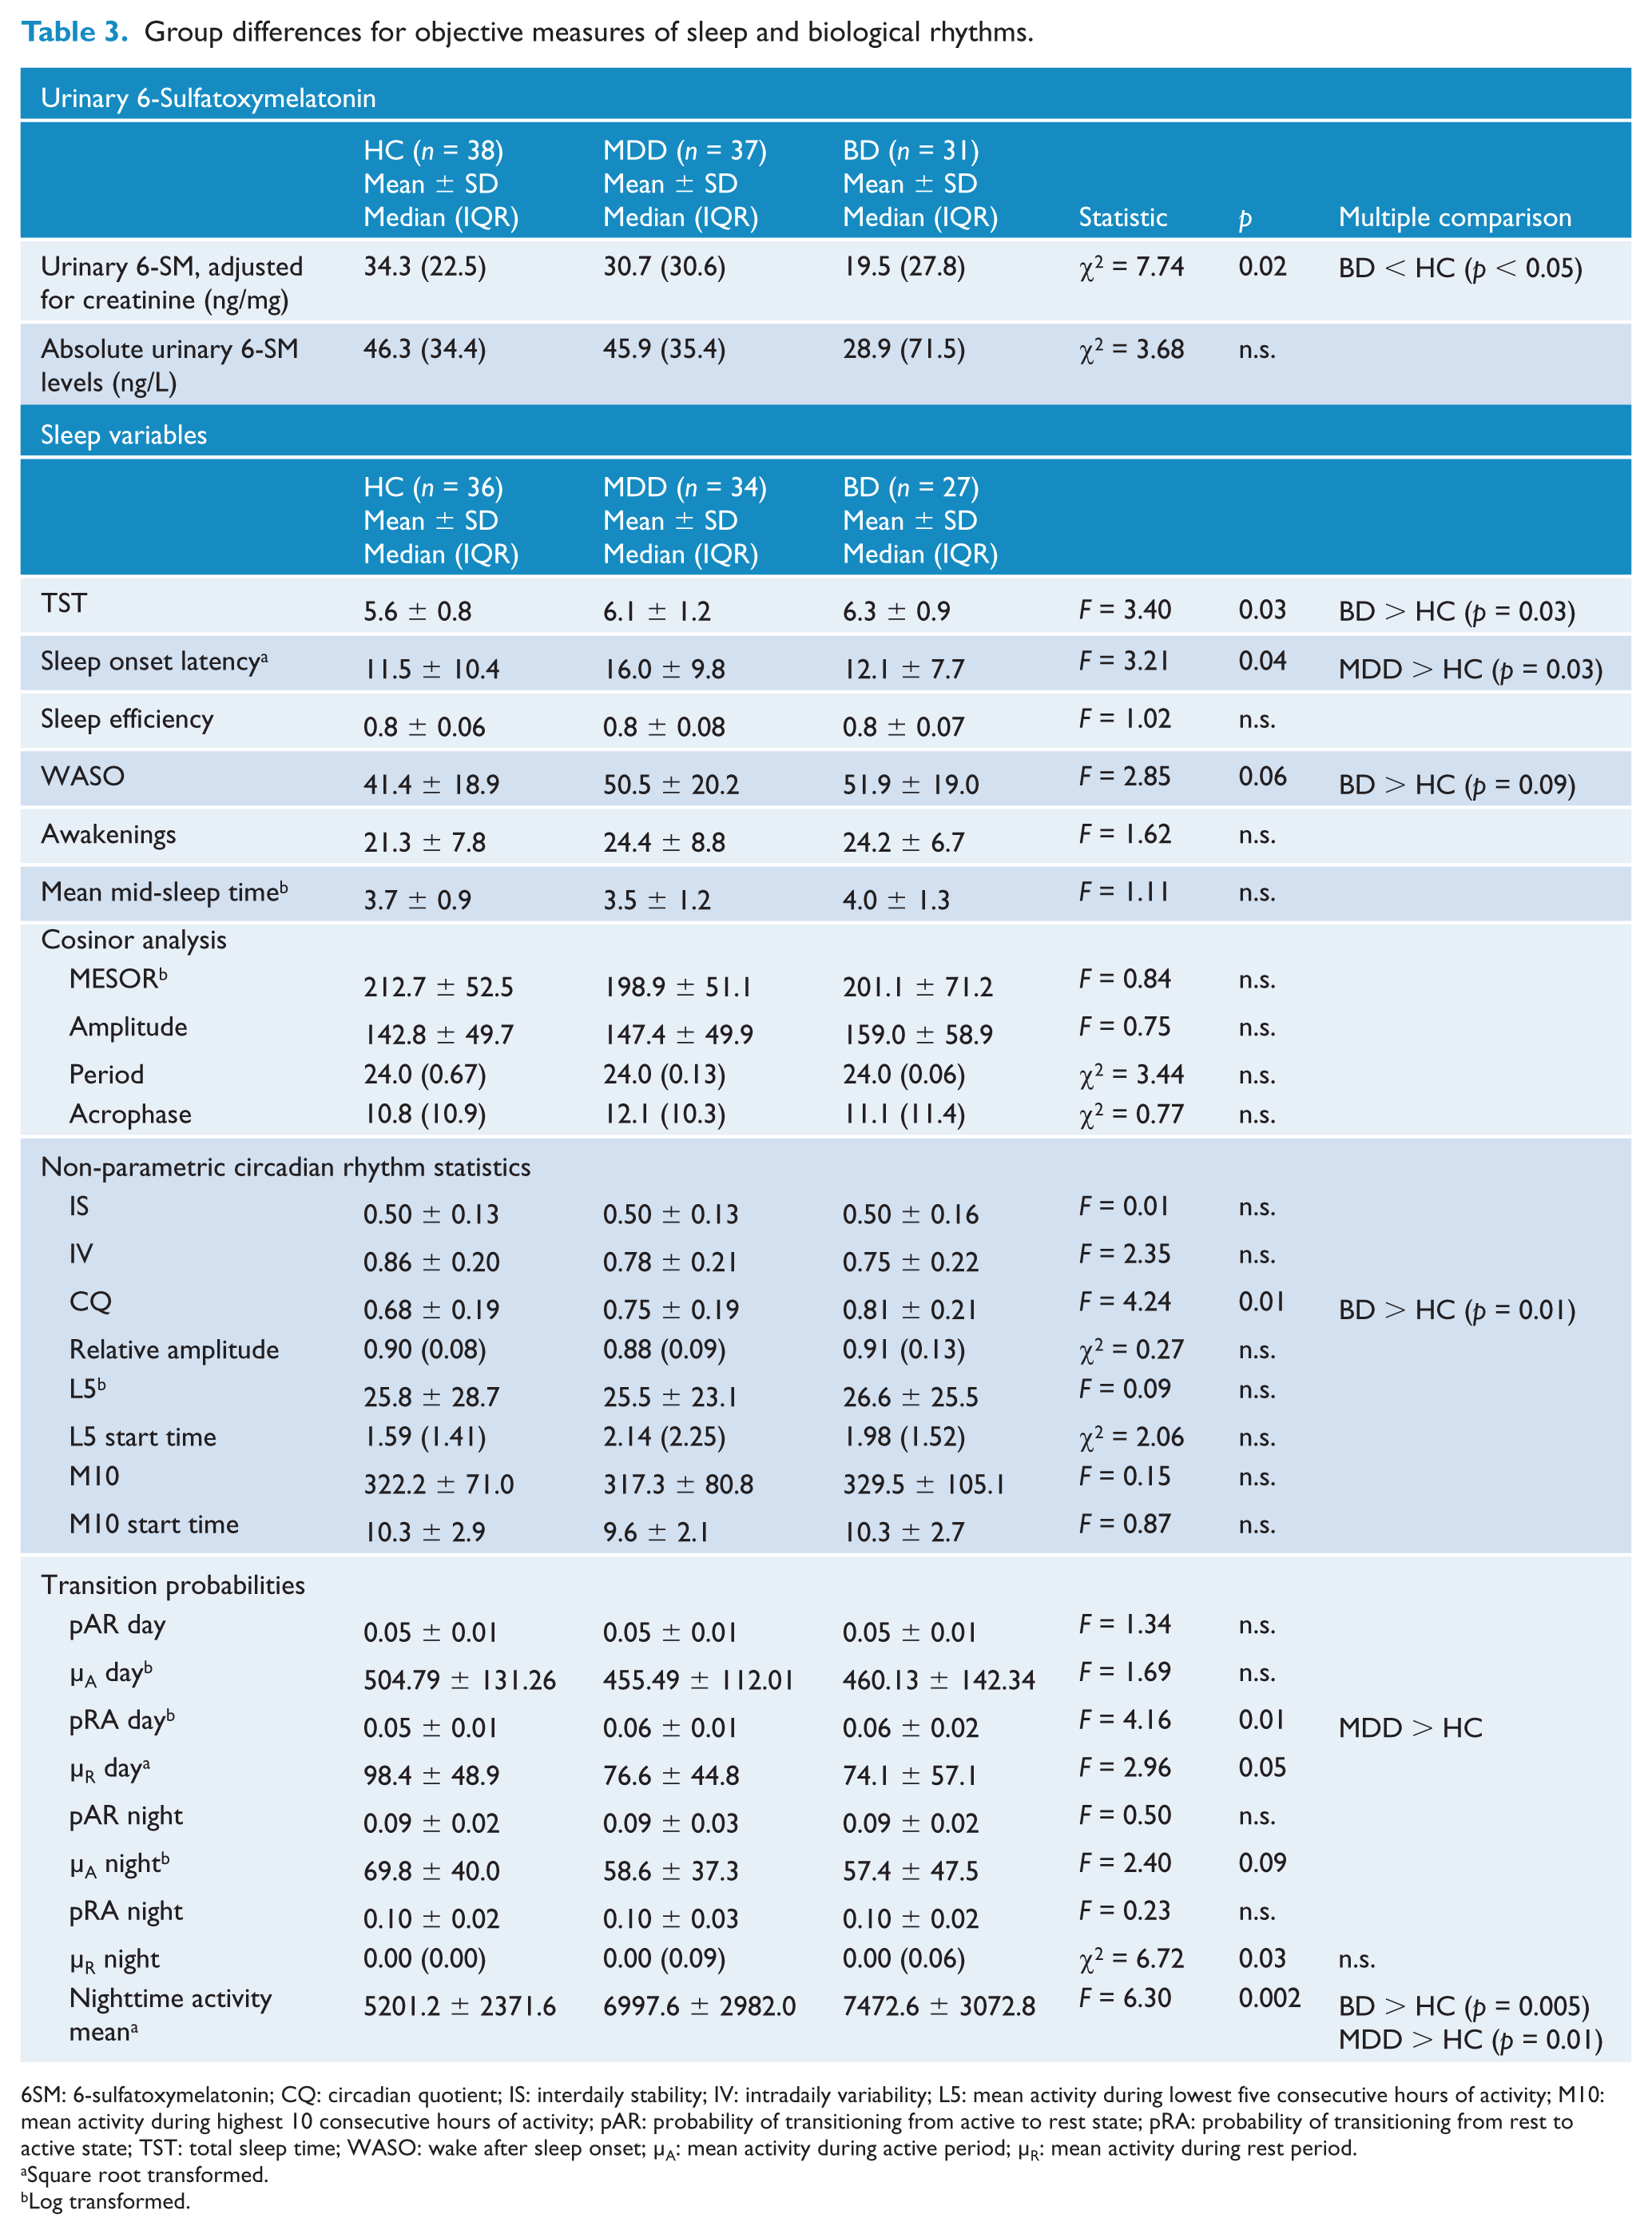
6SM: 6-sulfatoxymelatonin; CQ: circadian quotient; IS: interdaily stability; IV: intradaily variability; L5: mean activity during lowest five consecutive hours of activity; M10: mean activity during highest 10 consecutive hours of activity; pAR: probability of transitioning from active to rest state; pRA: probability of transitioning from rest to active state; TST: total sleep time; WASO: wake after sleep onset; µA: mean activity during active period; µR: mean activity during rest period.
Square root transformed.
Log transformed.
Group differences in light exposure variables, abnormally high light exposure outliers removed (i.e. >200,000 lux exposure continuously throughout 24 hours).
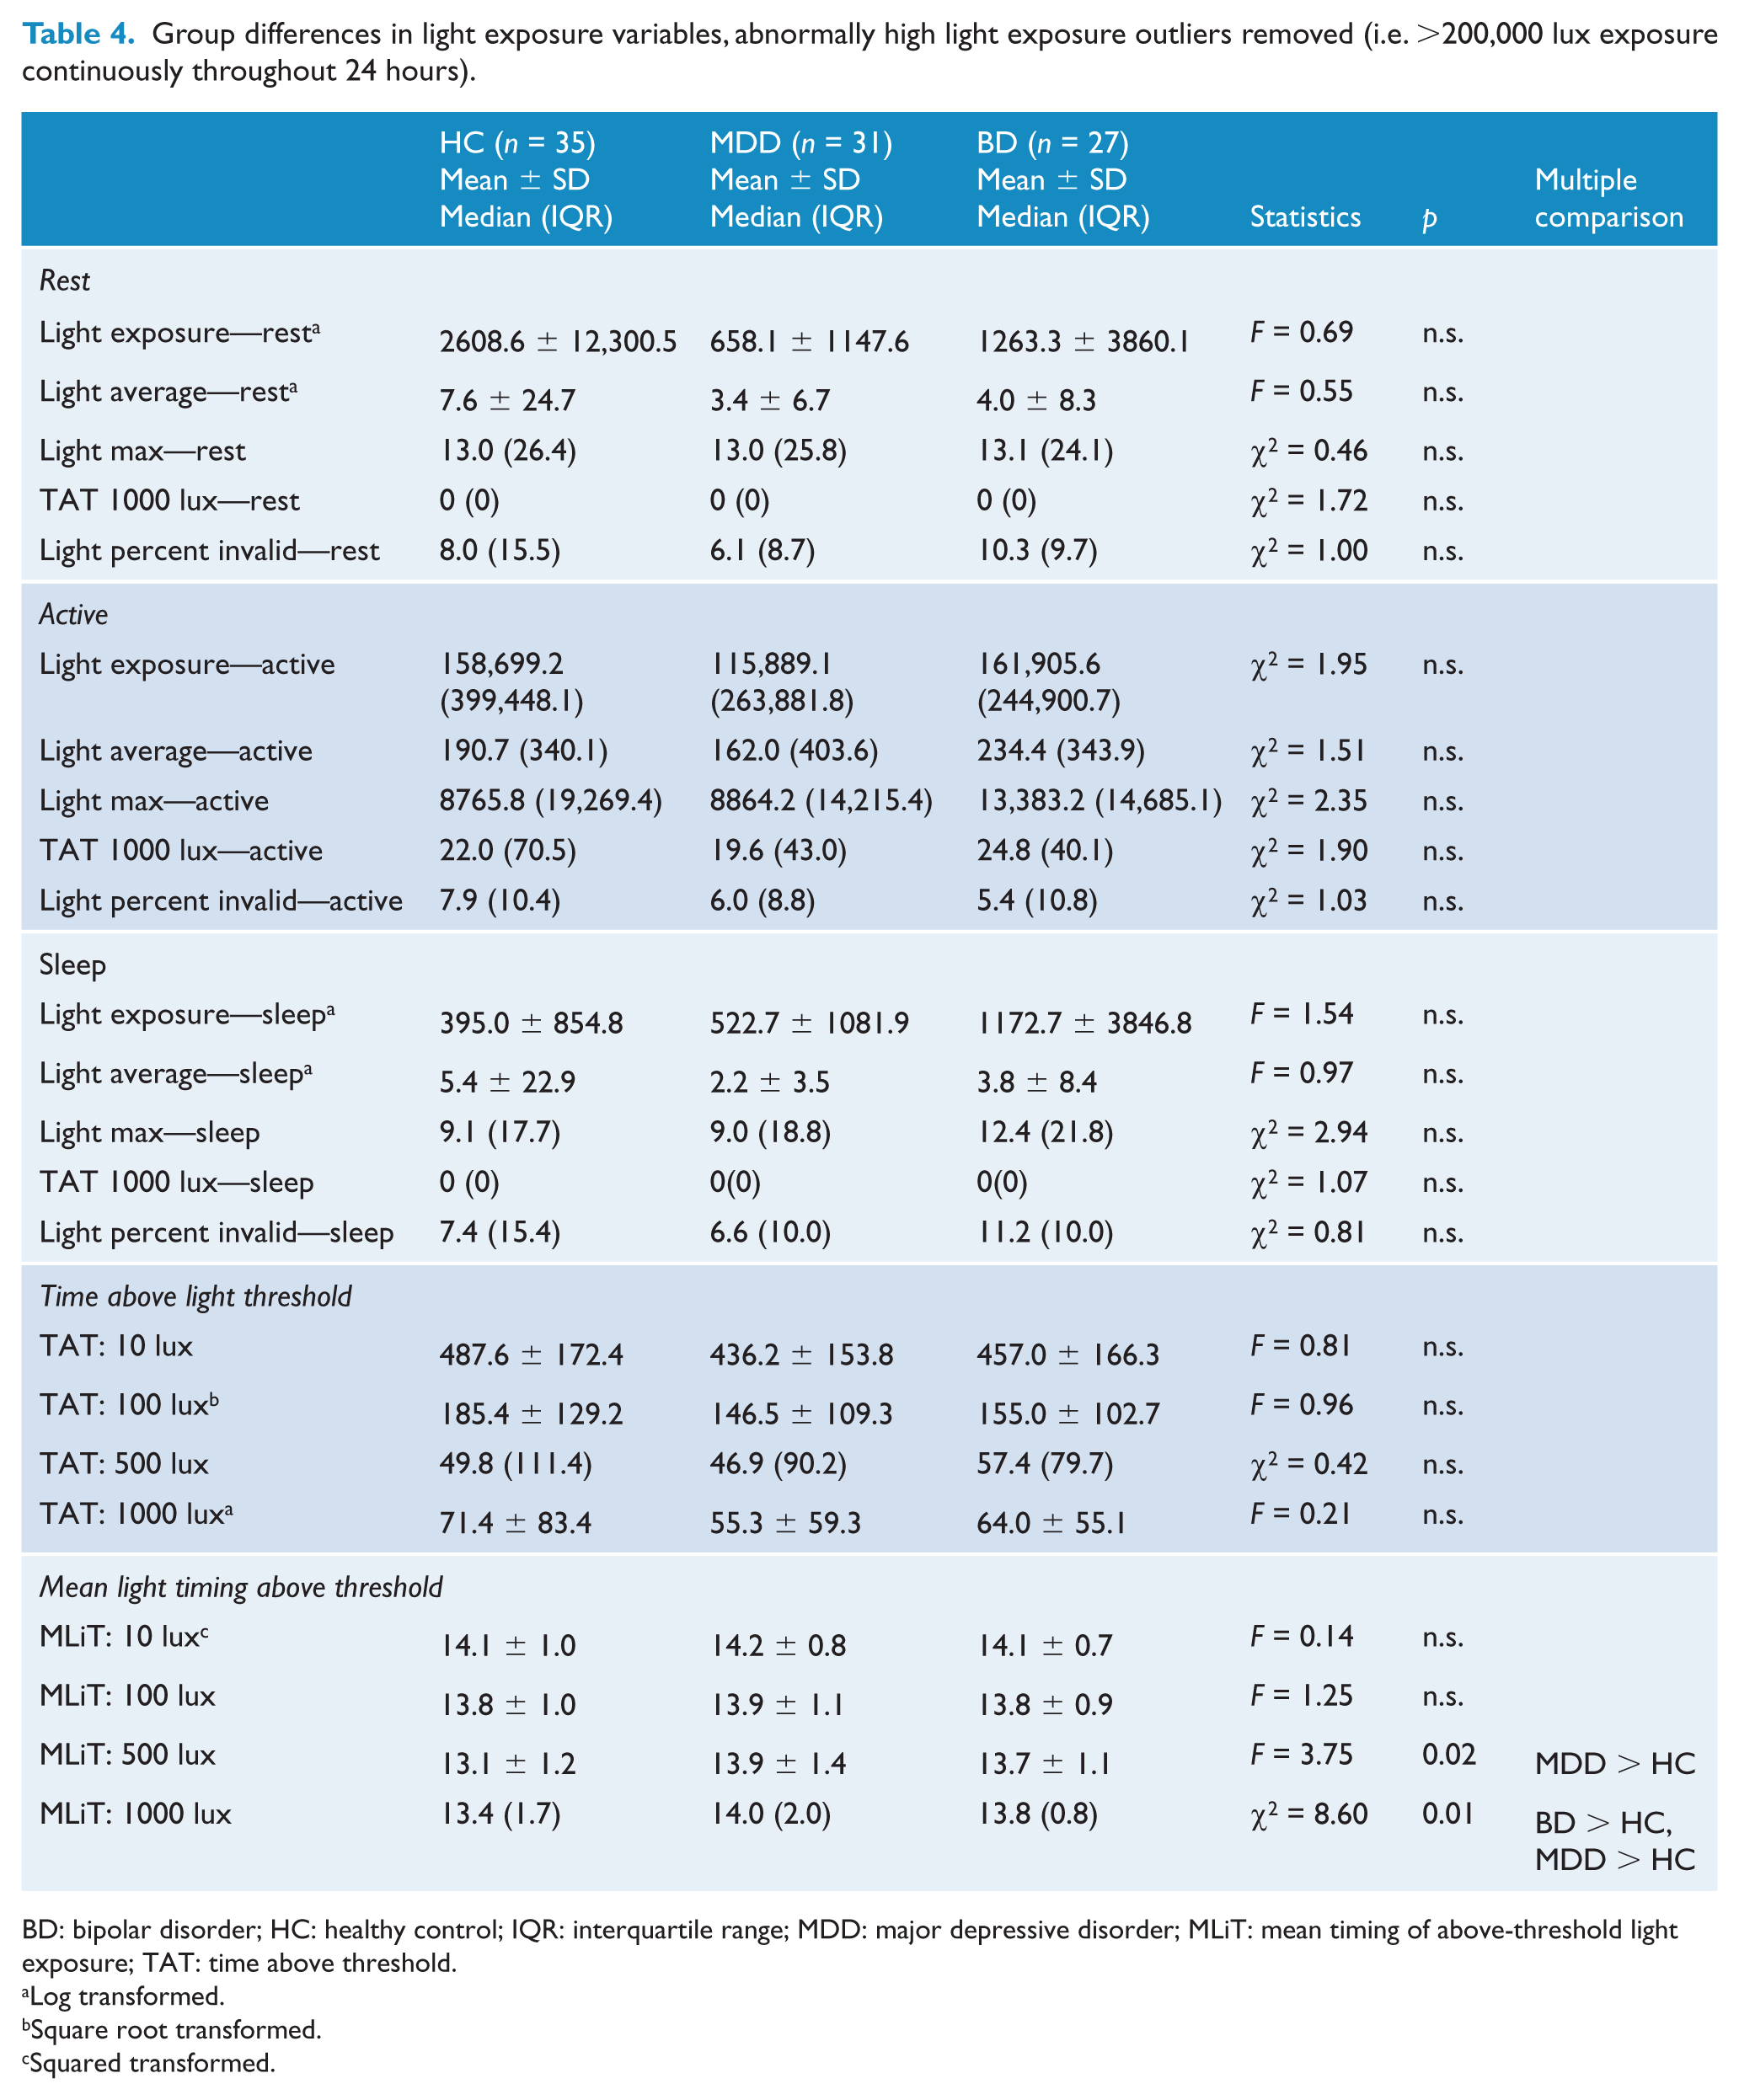
BD: bipolar disorder; HC: healthy control; IQR: interquartile range; MDD: major depressive disorder; MLiT: mean timing of above-threshold light exposure; TAT: time above threshold.
Log transformed.
Square root transformed.
Squared transformed.
Urinary 6-sulfatoxymelatonin
Levels of 6-sulfatoxymelatonin, adjusted for creatinine, were lower in BD compared to the control group, indicating lower levels of overnight melatonin secretion in BD (p < 0.05). Five subjects (n = 2 HC, n = 1 MDD and n = 2 BD) did not complete urinary 6-SM sampling.
Actigraphy variables
The BD group had a higher circadian quotient (p = 0.01), longer TST (p = 0.03) and higher mean nighttime activity (p = 0.005) and trended toward higher WASO (p = 0.09) than HC. The MDD group had longer SOL (p = 0.03) and higher mean nighttime activity (p = 0.01) than HC. In terms of light exposure, the MDD group had a later peak of light exposure above 500 lux (MLiT500) and 1000 lux (MLiT1000) than HC (p < 0.05). The BD group had later peak of MLiT1000 than HC (p < 0.05). No differences were observed between groups for any of the circadian cosinor variables or mean light exposure at rest, activity or sleep. Data from 1 HC and 3 MDD participants had to be removed from light analyses, due to a constant, high level of light exposure in these participants (>200,000 lux throughout 24 h). Figures 1 and 2 provide a visualization of mean activity and light exposure patterns across 15 days for all participants.
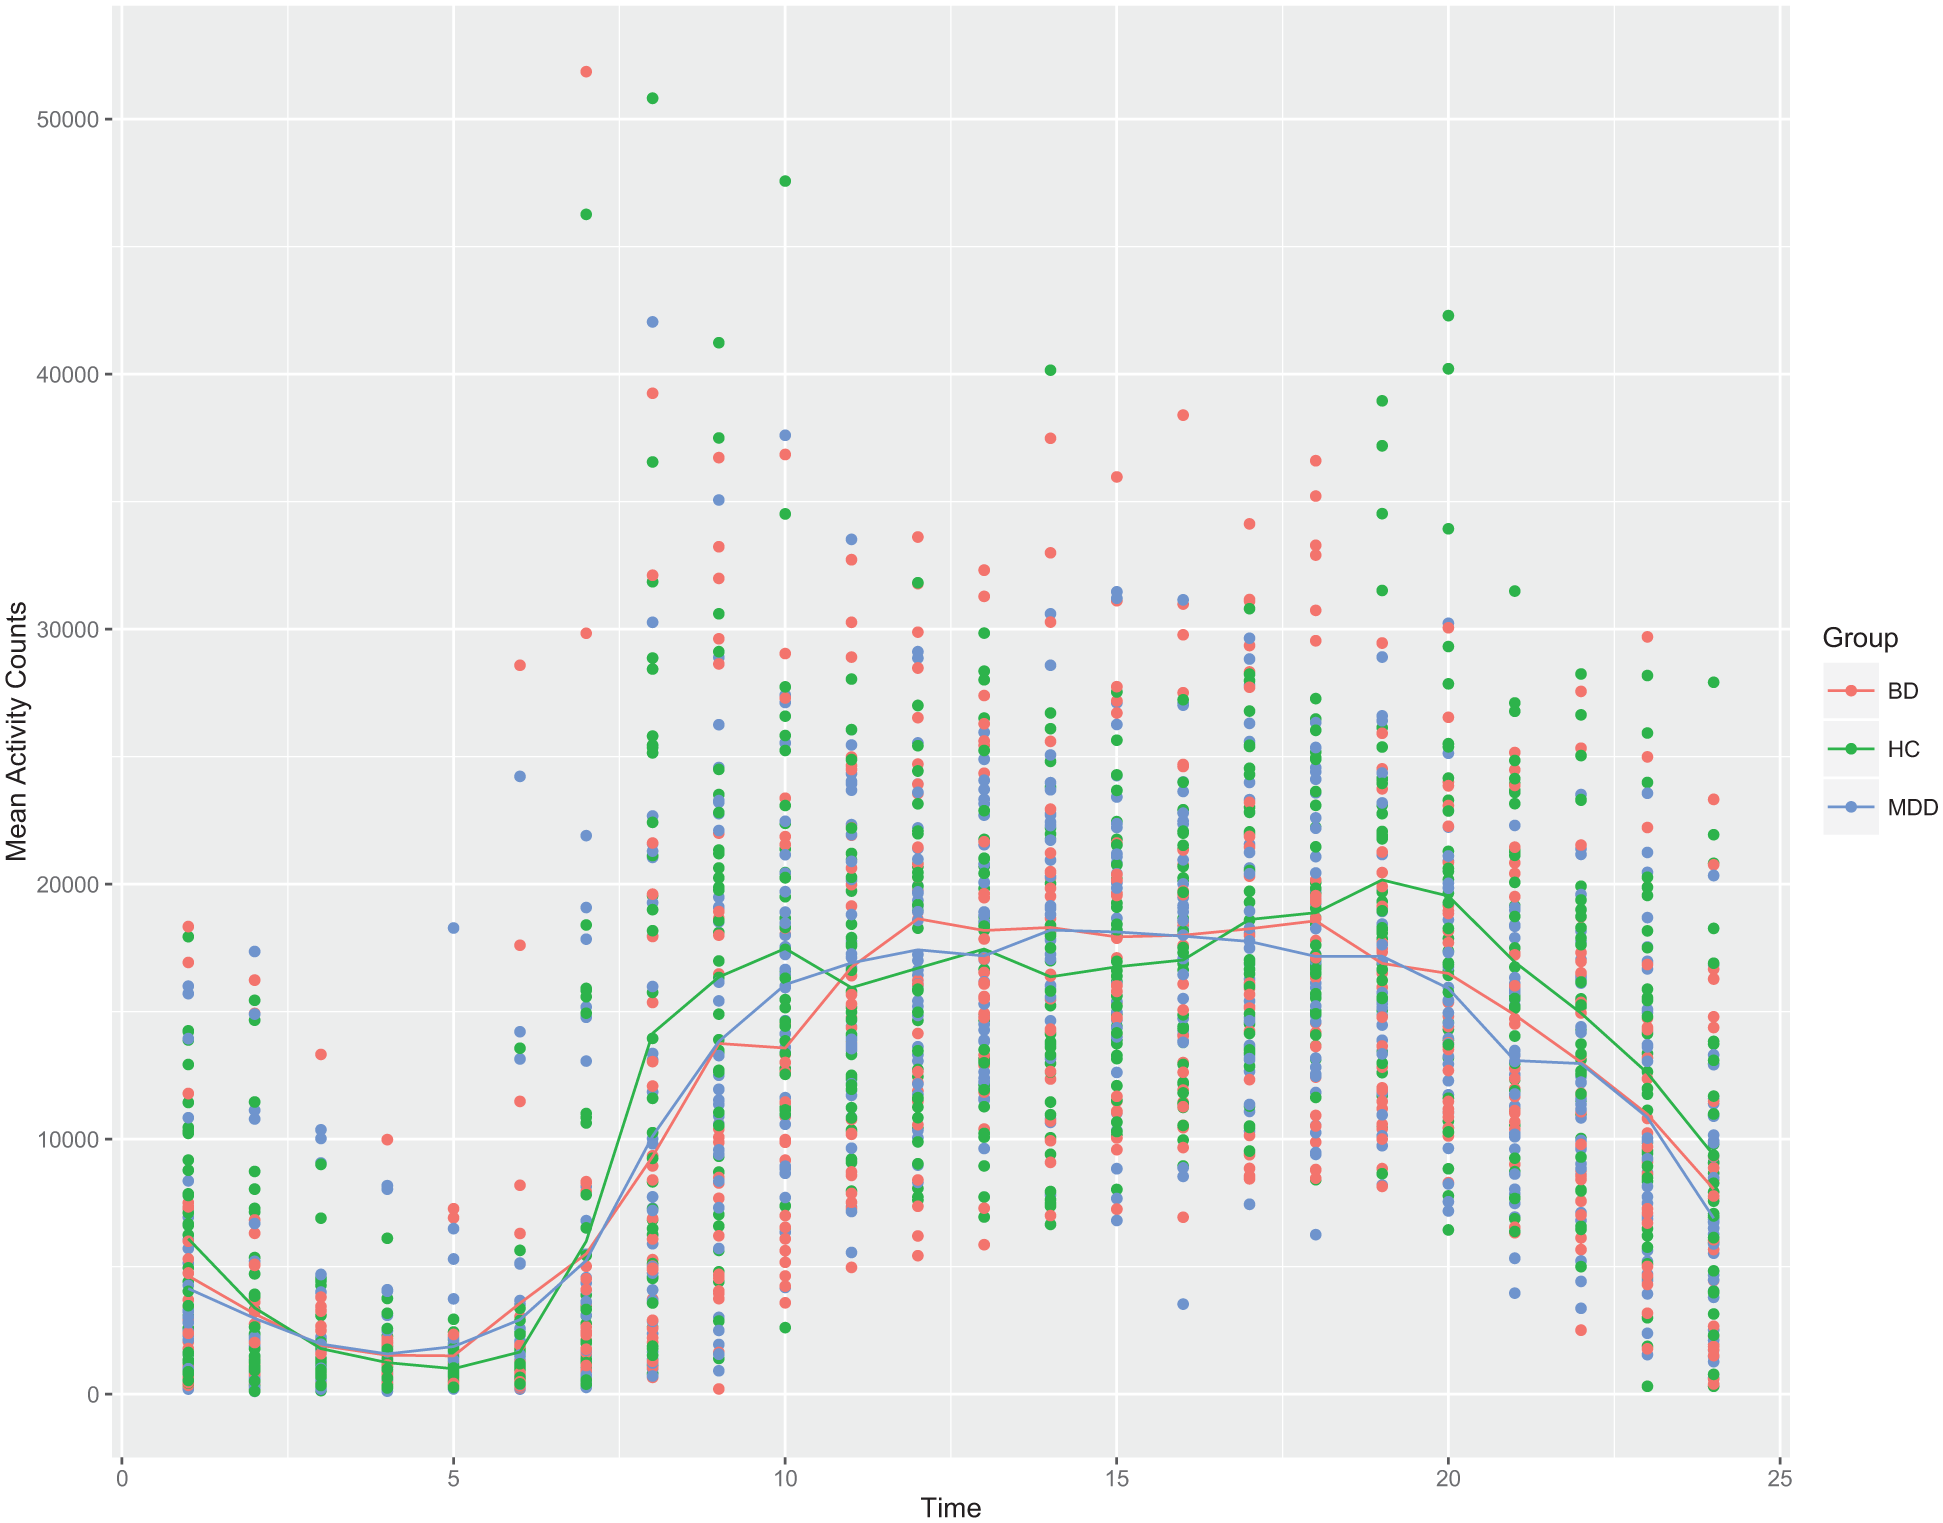
Plot of mean hourly activity counts from 1 a.m. to midnight for all participants. Colored lines denote group means. Activity patterns show a circadian pattern.
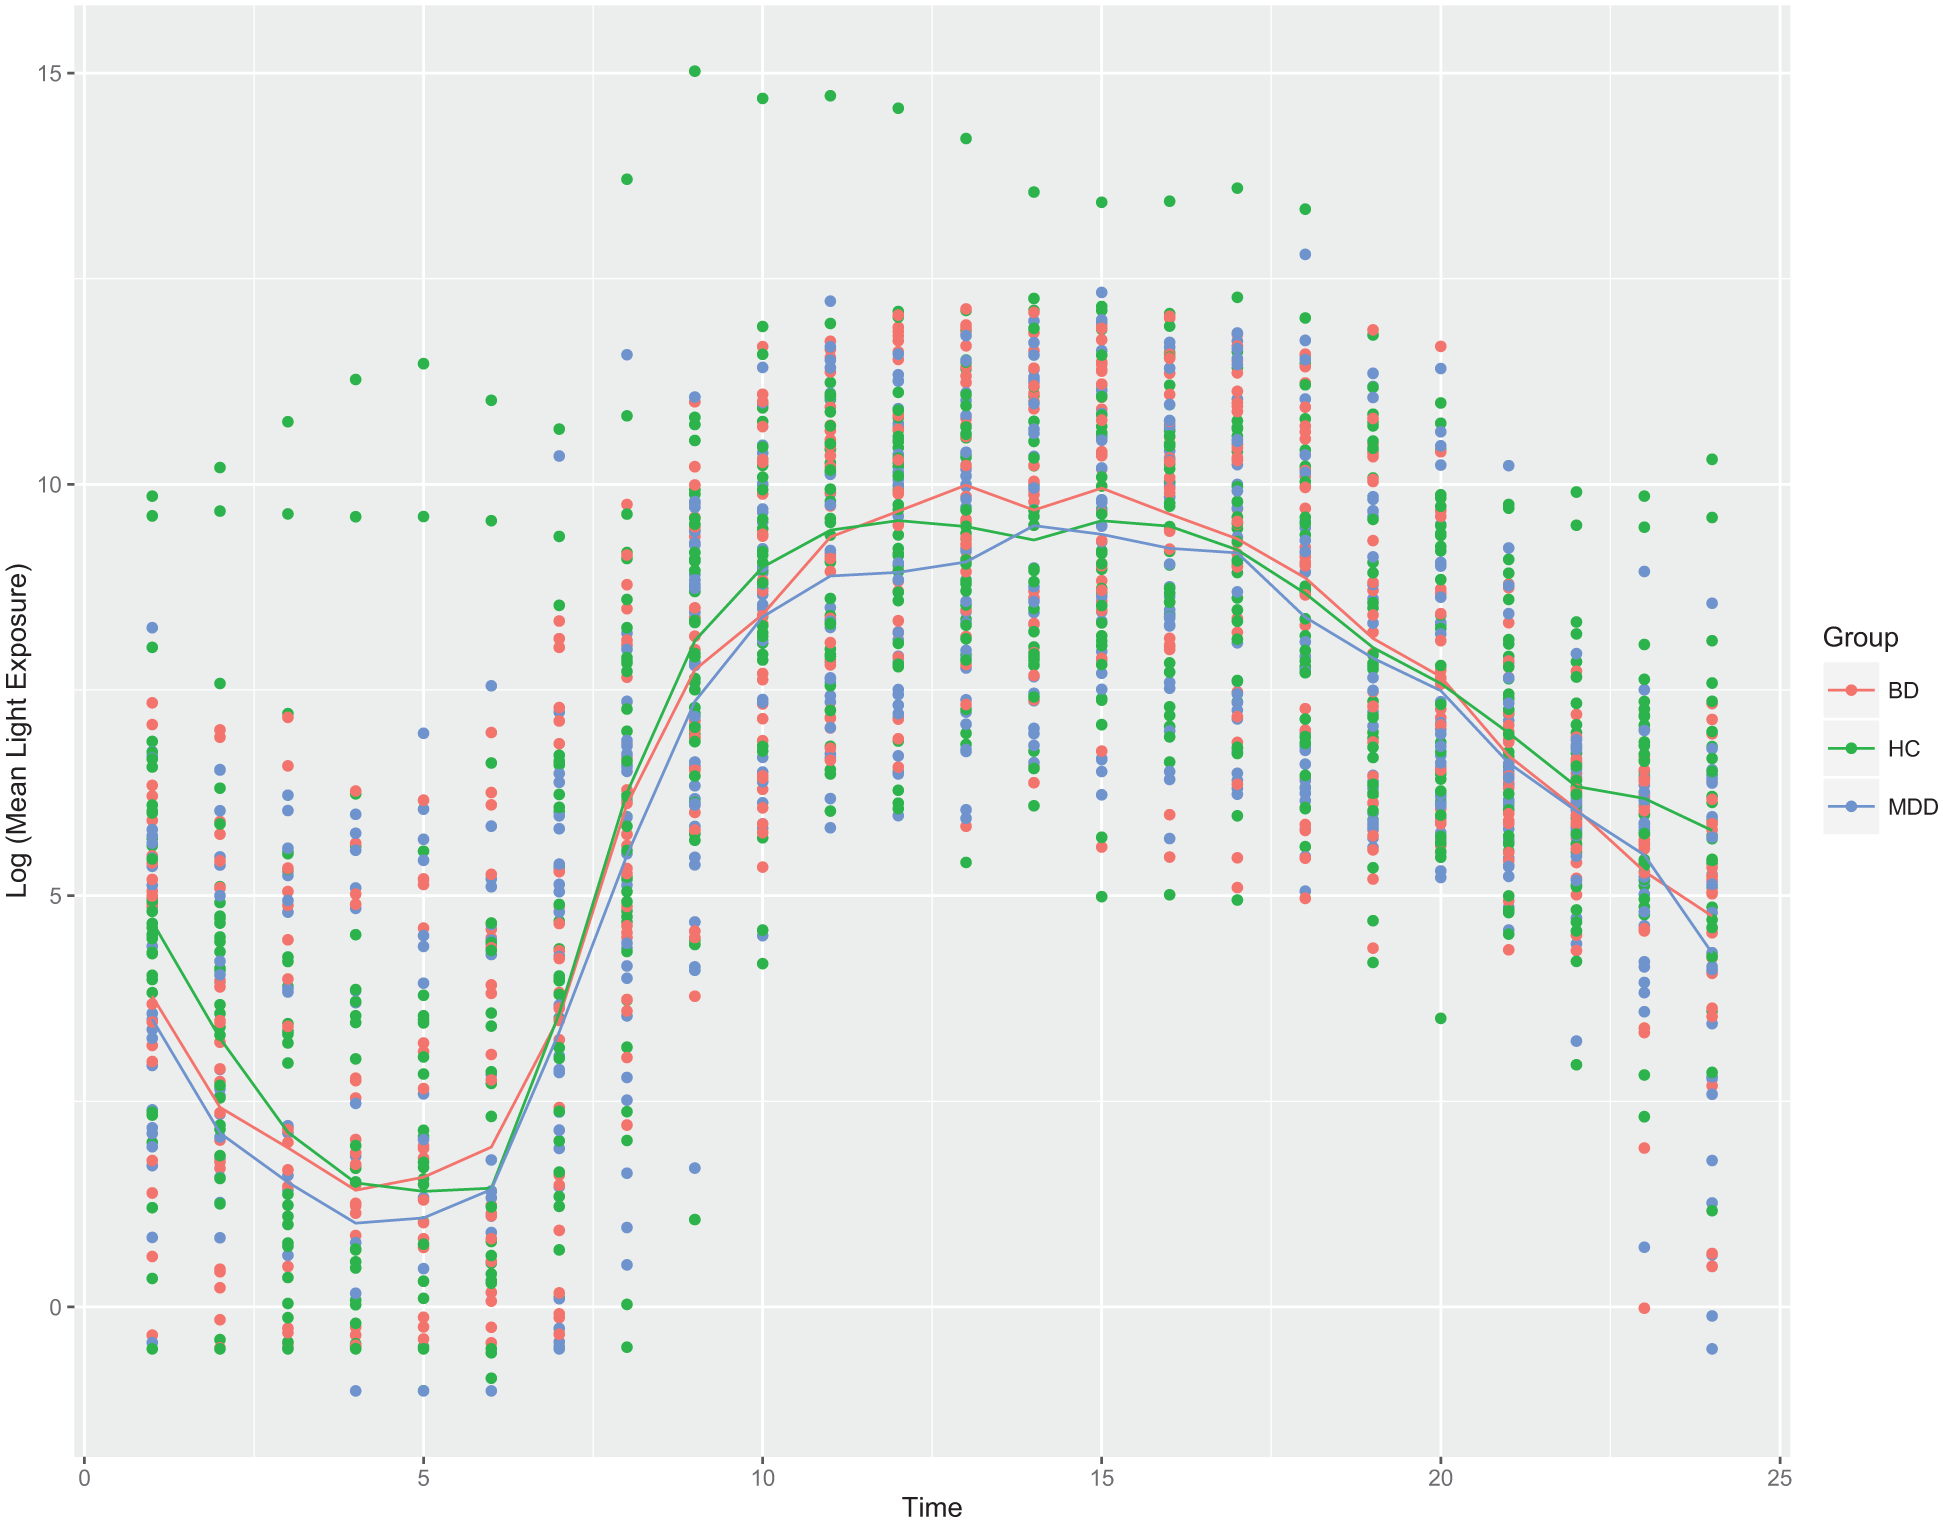
Plot of log of mean light exposure (in lux) from 1 a.m. to midnight for all participants. Colored lines denote group means. Data from four participants were removed, as they displayed a constant, abnormally high level of light exposure (i.e. >200,000 lux) throughout the day. Mean light levels were log transformed in order to better visualize the circadian pattern throughout the day. (BD: bipolar disorder; HC: healthy control; MDD: major depressive disorder.)
Transition state probabilities
The MDD group had higher pRA throughout the day compared to the HC group (p < 0.05). Both the MDD and BD subjects had higher nighttime activity than HC (p ⩽ 0.01).
Predicting functioning and QOL from actigraphy, BRIAN scores and chronotype
Multiple linear regression analysis revealed that QOL (WHOQOL-BREF) was independently predicted by BRIAN scores (Std.β = −0.58, t = −7.39, p < 0.001), circadian quotient (Std.β = 0.26, t = 2.79, p = 0.006), nighttime µrest (Std.β = −0.19, t = −2.33, p = 0.02) and daytime pAR (Std.β = 0.19, t = 2.05, p = 0.04), explaining 43% of variance in QOL (F13,97 = 7.28, Adj. R2 = 0.43, p < 0.001). Functioning, in turn, was independently predicted by BRIAN scores (Std.β = 0.71, t = 9.91, p < 0.001), TST (Std.β = −0.28, t = −2.84, p = 0.005) and daytime pAR (Std.β = −0.19, t = −2.37, p = 0.02), explaining 52% of variance in functioning (F13,97 = 10.28, Adjusted R2 = 0.52, p ⩽ 0.001; Table 5).
Linear regression predicting functioning and quality of life from BRIAN, MCTQ and actigraphy variables.
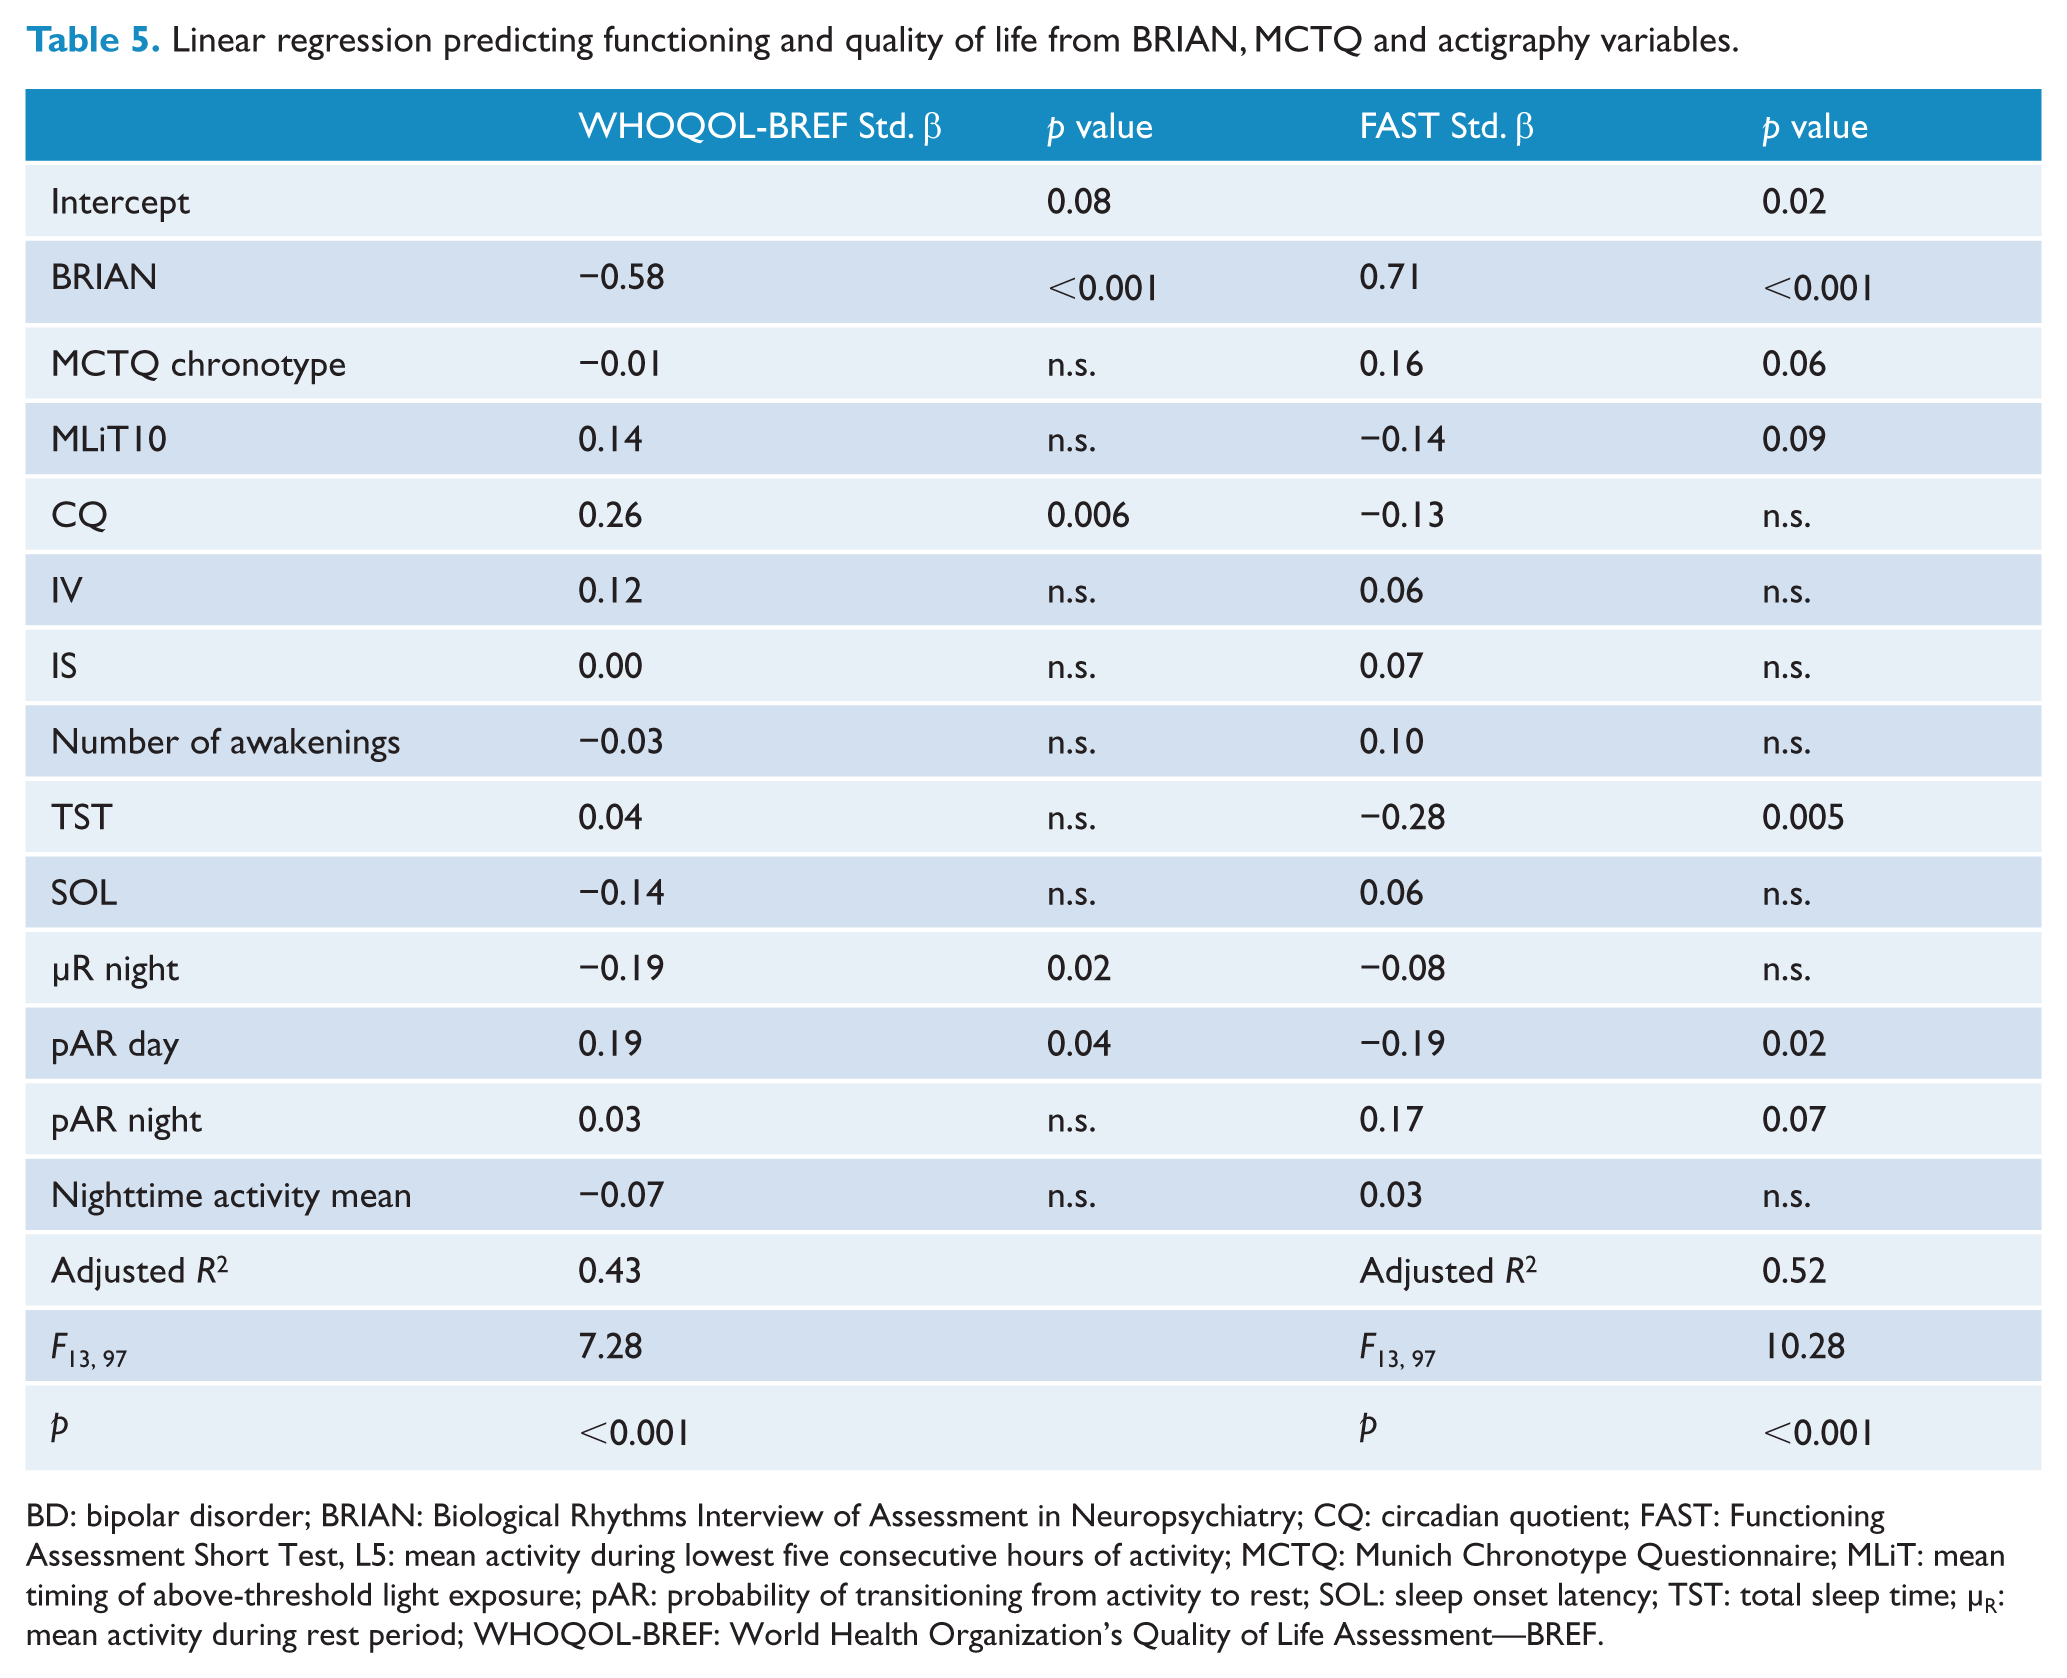
BD: bipolar disorder; BRIAN: Biological Rhythms Interview of Assessment in Neuropsychiatry; CQ: circadian quotient; FAST: Functioning Assessment Short Test, L5: mean activity during lowest five consecutive hours of activity; MCTQ: Munich Chronotype Questionnaire; MLiT: mean timing of above-threshold light exposure; pAR: probability of transitioning from activity to rest; SOL: sleep onset latency; TST: total sleep time; µR: mean activity during rest period; WHOQOL-BREF: World Health Organization’s Quality of Life Assessment—BREF.
Discussion
In this comprehensive investigation of objective and subjective biological rhythms and sleep in BD and MDD, several key findings emerged: we found evidence of disturbances in subjective sleep quality and biological rhythms in both mood groups, though no differences were found in daytime sleepiness or chronotype. Both mood groups had higher mean nighttime activity than controls. Participants with BD had a sleep profile characterized by a longer TST, higher circadian quotient and lower urinary 6-SM levels than controls. The MDD group had longer SOL and higher probability of transitioning from rest to activity during the day than controls, suggesting that MDD patients are more likely to stay active throughout the day than healthy volunteers. Disruptions in the sleep and biological rhythm profiles of the two disorders were not restricted to any specific domain—rather, disruptions were widespread across each category of variables. We measured subjective disruptions, sleep variables, transition state probabilities, activity, light exposure, daily activity rhythms and urinary 6-sulfatoxymelatonin, finding at least one disturbance in each category of measurements.
An important, novel finding of our study is that we were able to predict QOL and functional impairment using subjective and objective measures of sleep and biological rhythms in individuals with mood disorders. Our results are consistent with prior reports of disturbances in subjective biological rhythms according to the BRIAN being predictive of poor functioning (Giglio et al., 2010; Pinho et al., 2016) and worse QOL (Cudney et al., 2016) in BD. Specifically, we found that QOL scores were predicted by circadian quotient, mean activity count during nighttime rest and probability of transitioning from activity to rest during the day. Functional impairment was predicted by shorter TST and lower probability of transitioning from activity to rest during the day. To our knowledge, no prior study has investigated the link between QOL, functioning and objectively measured biological rhythms or sleep in a mood disorder population. However, several prior studies linked subjective reports of sleep disturbance to poorer functioning and QOL in mood disorders and other populations. For instance, in a large study of individuals with BD, functioning and QOL were worse in those with longer or shorter self-reported sleep duration as compared to normal sleepers (Gruber et al., 2009). Elsewhere, BD individuals with delayed sleep phase had worse functioning (Steinan et al., 2016). Similarly, in a population-based study, individuals with self-reported non-restorative sleep and insomnia symptoms reported worse functioning than their counterparts (Zhang et al., 2013). Finally, greater disruptions in subjective and objective sleep measures were linked to worse functioning and health-related QOL in elderly individuals: sleep-related dysfunction was prospectively linked to health-related QOL, while daily functioning was prospectively linked to percentage of nighttime sleep after a 6-month follow-up (Martin et al., 2010).
In terms of profiles of light exposure, participants with MDD had later mean timing of light exposure over 500 and 1000 lux, although average time spent exposed to light levels above this threshold did not differ from controls. Similarly, BD subjects had later mean timing of light exposure over 1000 lux. To the best of our knowledge, very little is known about light exposure in mood disorders, in spite of reports evaluating light exposure therapies in mood disorder patients, such as bright light therapy (Al-Karawi and Jubair, 2016) and blue-blocking glasses (Henriksen et al., 2016). A previous study suggested that higher early-life light exposure may influence earlier age of onset for patients with BD (Bauer et al., 2012). In healthy elderly individuals, levels of light exposure have been found to be negatively associated with depression scores (Ichimori et al., 2013). Light influences the circadian system directly through the SCN, where information about light intensity is transmitted through specialized intrinsically photosensitive retinal ganglion cells directly in the retina, which contain a photopigment called melanopsin, with peak sensitivity to blue light. These cells additionally signal to the ventro-lateral preoptic nucleus, which plays an important role in non-circadian sleep promotion. Light is therefore interlinked with the homeostatic and circadian processes of sleep, creating complex effects on mood, and alertness (Reviewed by Stephenson et al., 2012).
The BRIAN questionnaire has been suggested to be able to discriminate biological rhythm disturbances specifically between mood disorder groups and across mood states, with the greatest disturbances seen in individuals with BD in a current depressive episode (Mondin et al., 2017). Euthymic individuals with BD had a similar degree of disruption as currently depressed individuals with MDD, corroborating evidence that subsyndromal BD symptoms persist into remission (Mondin et al., 2017). Due to limited sample size, we were unable to compare depressed with euthymic patients. However, an interesting finding was that worsening of biological rhythm disturbances in patients with BD and MDD was not accounted for by chronotype or daytime sleepiness. In addition to measuring disruptions in the rhythmicity of sleep and activity, one of the defining features of the BRIAN is that it includes measures of social rhythm disruption and eating pattern disruption. The two mood groups displayed worse disruption in all four BRIAN subdomains, including the social and eating subdomains. As mentioned previously, these factors also appear to play a role in the timekeeping mechanisms of mammals (Mistlberger and Antle, 2011). These findings are consistent with previous studies showing that disruption in social rhythms was associated with earlier onset of depressive and (hypo)manic episodes in BD (Shen et al., 2008) and depressive symptom severity in MDD (Szuba et al., 1992). Moreover, interpersonal and social rhythm therapy is a well-established treatment for BD (Frank et al., 2005).
We also found that levels of first morning urinary 6-SM were lower in individuals with BD, indicating lower overnight melatonin secretion in BD subjects. A prior study found morning melatonin levels to be lower in cerebrospinal fluid, but not in serum of patients with BD and vice versa for MDD (Bumb et al., 2016). Another study using salivary melatonin found that young mood disorder patients had delayed and reduced melatonin secretion, indicating a lower amplitude of secretion (Robillard et al., 2013). We did not find differences in morning urinary 6-SM levels between MDD and healthy volunteers. Investigations of melatonin levels in MDD have provided some inconsistencies, where some studies have found increased nocturnal serum melatonin in MDD patients (Rubin et al., 1992) and others have found decreased nocturnal serum melatonin and increased morning serum melatonin (Crasson et al., 2004; Khaleghipour et al., 2012). A study investigating serum and urinary 6-SM secretion found that there appears to be a phase shift in melatonin secretion for depressive patients, with higher melatonin secretion in the morning, as opposed to nighttime, and a delay of serum melatonin secretion (Crasson et al., 2004).
Activity patterns beyond sleep are an emerging topic in mood disorders. A systematic review of activity patterns in depression found heterogeneous results with regard to actigraphy-measured nighttime activity in patients with current depressive disorders and hypothesized that nighttime activity is higher in depressive patients, though this is not reflected in measurements of sleep efficiency and sleep duration (Burton et al., 2013). This was in part consistent with our findings, as both MDD and BD groups had higher nighttime activity levels than controls, and no differences were found in sleep efficiency. In addition, SOL was higher in the MDD group compared to healthy volunteers. In our sample, BD subjects had longer TST than HCs. This was consistent with findings from recent systematic reviews and meta-analyses, which found euthymic and depressed BD patients to have longer TST (De Crescenzo et al., 2017; Geoffroy et al., 2015). Mean nighttime activity, a variable which was highly correlated with WASO, was higher in BD than HCs.
A large-scale actigraphy study of (n = 339) euthymic participants with BDI, BDII and MDD and HCs investigating timing, levels and variability of activity found participants with BDI and BDII to have higher variability in activity from day to day during the afternoon and evening, respectively, compared to controls (Shou et al., 2017). However, we did not find any differences between groups on measures of interdaily stability or IV. Circadian quotient, a measure of individual rhythm strength, was higher in BD than the healthy volunteer group. Similarly, we did not find differences in chronotype between the groups, which is inconsistent with prior findings of BD being associated with eveningness (Melo et al., 2017).
Several limitations of our study must be noted. The cross-sectional nature of the study does not allow us to explore the causal relationships between sleep and biological rhythm disturbances and mood in our samples. Our sample included individuals who were receiving treatment with various psychotropic medications, which may have influenced patterns of melatonin secretion through effects on the circadian oscillator given prior reports that antipsychotics, lithium and sodium valproate influence sleep and circadian rhythms in BD (Geddes and Miklowitz, 2013). In addition, we were unable to study differences in biological rhythms and sleep in depressed and euthymic patients, as our sample size for each subgroup was insufficient to make meaningful comparisons. Future studies should additionally recruit participants in mixed states, as daily activity rhythms, transition state probabilities and light exposure profiles have been under-investigated in this mood state. Future investigations should consider tracking objective parameters of social and eating patterns in mood disorders. Finally, actigraphy, while having high concordance with polysomnography in healthy adults, has less accuracy in populations with worse sleep quality, where quiet wakefulness might be scored as sleep. However, longer recording periods (i.e. 7–14) nights improve sleep parameter stability (Van De Water et al., 2011). Strengths of our study include the use of 15-day actigraphy, which allows for a representative analysis of sleep and daily activity rhythm patterns. Our methods of collecting data regarding both subjective and objective sleep and activity variables, along with light exposure and nocturnal 6-SM secretion, provide a comprehensive look at biological rhythm variables across BD and MDD. To our knowledge, this is the first investigation to examine objective actigraphy and melatonin profiles, in addition to subjective measures of sleep and biological rhythms in both BD and MDD.
Conclusion
We found that subjective and objective sleep and biological rhythm disturbances are strongly associated with QOL and functioning in BD and MDD. Investigating sleep and biological rhythms in mood disorders is a complex, multidimensional process, which can involve a variety of subjective and objective measures. Subjective measures of sleep and biological rhythm disruptions consistently detect worsening in these variables for BD and MDD in a population with mixed current mood state. Measuring sleep, transition state probabilities, activity, light exposure, daily activity rhythms and urinary 6-sulfatoxymelatonin in addition to subjective measures may eventually become a clinically viable and useful tool to help provide diagnostic accuracy for clinicians. However, further longitudinal investigations must be conducted to analyze temporal relationships between sleep, biological rhythms and mood episodes.
Footnotes
Acknowledgements
A special thanks to Marg Coote and Jodi Gilchrist who completed the laboratory analyses of the urinary melatonin samples.
Declaration of Conflicting Interest
The author(s) declared no potential conflicts of interest with respect to the research, authorship and/or publication of this article.
Funding
This work was supported in part by the Canadian Biomarker Integration Network in Depression (CAN-BIND), an Integration Discovery Program carried out in partnership, and partially sponsored by the Ontario Brain Institute under Grant no. 00000, an independent non-profit corporation, funded partially by the Ontario government. The opinions, results and conclusions are those of the authors and no endorsement by the Ontario Brain Institute is intended or should be inferred. This work was also supported in part by the Ontario Ministry of Research and Innovation (Early Research Award—Dr Frey) under grant no. ER13-09–229.