
Abstract
Objective:
Few studies have examined differential predictors of response to psychotherapy for depression. Greater understanding about the factors associated with therapeutic response may better enable therapists to optimise response by targeting therapy for the individual. The aim of the current exploratory study was to examine patient characteristics associated with response to cognitive behaviour therapy and schema therapy for depression.
Methods:
Participants were 100 outpatients in a clinical trial randomised to either cognitive behaviour therapy or schema therapy. Potential predictors of response examined included demographic, clinical, functioning, cognitive, personality and neuropsychological variables.
Results:
Individuals with chronic depression and increased levels of pre-treatment negative automatic thoughts had a poorer response to both cognitive behaviour therapy and schema therapy. A treatment type interaction was found for verbal learning and memory. Lower levels of verbal learning and memory impairment markedly impacted on response to schema therapy. This was not the case for cognitive behaviour therapy, which was more impacted if verbal learning and memory was in the moderate range.
Conclusion:
Study findings are consistent with the Capitalisation Model suggesting that therapy that focuses on the person’s strengths is more likely to contribute to a better outcome. Limitations were that participants were outpatients in a randomised controlled trial and may not be representative of other depressed samples. Examination of a variety of potential predictors was exploratory and requires replication.
Introduction
Clinical trials, supported by recent meta-analyses, demonstrate that several short-term psychotherapies for depression are effective (Barth et al., 2013; Braun et al., 2013). Despite treatment effectiveness, only half to two-thirds will make a full recovery with their first course of treatment (Hollon et al., 2005). This is the same proportion likely to relapse within a 2-year period and 3–5% will continue to a chronic course (Pintor et al., 2009).
Failure to respond to therapy relates to a variety of factors. Individual predictors of response have been identified; however, evidence for most is scant or weak and few studies have examined modality-specific predictors. Poor response to cognitive behaviour therapy (CBT) is associated with high initial depression severity, chronic and recurrent depression, younger age at depression onset, comorbid axis I disorders (Jarrett et al., 1991; Simons et al., 1985), perfectionism (Enns and Cox, 2002), and a belief that interpersonal problems caused the depression (Addis et al., 1995) and dysfunctional attitudes (Jarrett et al., 1991) predict poorer response to CBT in particular, but also in general. Few studies have examined predictors of response to schema therapy (ST); however, ST may be particularly effective for chronic depression (Renner et al., 2016). Some research suggests that schema change is not specific to ST but reflects general therapeutic change (Halford et al., 2002). Research about therapeutic response for depression when personality disorder symptoms are comorbid has been mixed, with studies reporting both poorer therapeutic outcome (Newton-Howes et al., 2006) and no impact on outcome (Blom et al., 2007; Mulder, 2002). Poorer response to interpersonal psychotherapy than CBT has been found for those with high harm avoidance (Joyce et al., 2007) and comorbid personality disorder symptoms (Carter et al., 2011).
Neuropsychological deficits in patients with major depression, including poor executive functioning (Schmid and Hammar, 2013) and impaired inhibition and verbal fluency (Majer et al., 2004), have been associated with poorer outcomes and an increased likelihood of future relapse. Impaired divided attention (Majer et al., 2004) and impaired executive functioning (Alexopoulos et al., 2005) predict poorer response to medication. Only two studies have examined neuropsychological predictors of therapeutic response. Beaudreau et al. (2015) reported that impaired cognitive flexibility predicted poorer therapeutic response (problem-solving therapy and supportive therapy) in older depressed patients. Similarly, Bastos et al. (2017) found that better performance on measures of cognitive flexibility/executive functioning predicted better response to psychotherapy (psychodynamic) and medication or a combination of the two. These findings are also consistent with Mason et al.’s (2016) recent review reporting that connections from the prefrontal cortex appear to be an important predictor of outcome in CBT.
Understanding more about factors associated with response to therapy generally, and to different therapies, may enable clinicians to tailor therapy to the individual and to optimise response. Determining differential response to therapy may provide indirect evidence about mechanisms underlying response. This study aimed to examine patient characteristics associated with response to CBT and ST in outpatients in a randomised clinical trial for depression.
Materials and methods
Participants
Participants were outpatients (males n = 31; females n = 69) in a randomised clinical trial comparing CBT and ST for depression (Carter et al., 2013). All were over the age of 18 and had a principal diagnosis of major depressive disorder (Diagnostic and Statistical Manual of Mental Disorders, 4th ed. [DSM-IV]; American Psychiatric Association, 1994). Referrals came from general practitioners, mental health services or self-referral, and participants were required to be free of centrally acting drug for a minimum of 2 weeks, other than an occasional hypnotic and the oral contraceptive pill. Exclusion criteria were a history of bipolar I disorder, schizophrenia, major physical illness that would interfere with treatment, moderate/severe alcohol or drug dependence, and failure to respond to a recent (past year) adequate trial of CBT or ST.
Procedure
After initial telephone screening for inclusion and exclusion criteria, all potential participants were invited for assessment. If suitability was confirmed, written informed consent was obtained, and a baseline research assessment scheduled. Baseline assessment prior to randomisation consisted of Structured Clinical Interview for DSM-IV Axis I disorders (SCID; First et al., 2004), completion of self-report questionnaires and neuropsychological assessment. Randomisation to treatment type was performed by a person independent from the study and made available to the therapist and patient after completion of the baseline assessment.
CBT was delivered according to Beck et al. (1979) and Beck (1995) manuals by six clinical psychologists. The key components of CBT were behavioural activation, thought monitoring and challenging, and behavioural experiments. ST was delivered according to Young’s manuals (Young et al., 2003; Young and Klosko, 1993). Key components of ST include experiential focus on identifying and modifying self-defeating schema, empathic confrontation and behavioural change to modify maladaptive coping styles. CBT (n = 50) and ST (n = 50) occurred weekly for 6 months, followed by monthly sessions for 6 months. Predictors of response at the end of weekly therapy sessions are reported here. The average number of weekly sessions for ST was 18.0 (standard deviation [SD] = 5.3) and for CBT was 15.9 (SD = 5.7) (t(98) = 0.967, p = 0.052). Therapist competence and adherence to treatment type was monitored by weekly group supervision, through ratings of randomly selected recorded therapy sessions using the Cognitive Therapy Rating Scale (CTS) for CBT (Dobson et al., 1985) and a modified form of the CTS for ST. A score of 40 or more on the CTS reflected competency. The average CTS rating over the course of the study for CTS was 47.12 (SD = 7.65) and for ST was 54.4 (9.1) from randomly selected sessions.
Potential predictors of response
Putative predictors were grouped into six domains: (1) demographic (age, marital status, gender); (2) clinical (depression severity, recurrence, chronicity, depression subtype, Axis I comorbidity, age at onset of depression); (3) functioning (social adjustment, Global Assessment of Functioning, GAF); (4) personality (personality disorder symptoms); (5) cognitive (dysfunctional attitudes, reasons for depression, rumination, treatment credibility); and (6) neuropsychological functioning (verbal learning and memory, psychomotor speed, executive functioning, visual learning and memory).
Demographic, clinical, diagnostic variables and GAF were assessed with a structured clinical interview (SCID; First et al., 2004). Recurrence of depression was defined as two or more depressive episodes over the lifetime, and chronicity was defined as a major depressive episode present for 50% or more of the last 5 years. Comorbidity was categorised as any other comorbid psychiatric disorder in the last month (yes/no). Personality was assessed with the Structured Clinical Interview for DSM-IV Personality Disorders (First et al., 2004) by independent clinicians trained in personality disorder assessment. Inter-rater reliability in a previous study (Joyce et al., 2007) with the same raters assessing the presence of any personality disorder was 0.78.
Functioning (other than GAF) and cognitive domains were assessed with self-report measures as follows.
General functioning was measured with the Social Adjustment Scale – modified (SAS, Cooper et al., 1982) which assesses functioning across four subscales: role performance, interpersonal relations, friction with others, and inner feelings and satisfaction over the preceding 2 weeks. Higher scores indicate lower levels of functioning. Psychometric properties of the SAS with depressed outpatients are well documented (Weissman and Bothwell, 1976).
Cognitive functioning
The Reasons for Depression Questionnaire (RFD, Addis et al., 1995) assessed participants’ beliefs about the cause of their depression. The RFD consists of 9 subscales: characterological, existential, interpersonal conflict, intimacy, achievement, relationship, physical, biological and childhood reasons. RFD scales are distinct from current depression and relate to functioning in corresponding areas (Addis et al., 1995).
Treatment credibility was assessed with Borkovec and Naus’ (1972) four-item measure modified by Morrison and Shapiro (1987). The four questions, rated on a 7-point Likert-type scale, were as follows: (1) How logical does this treatment seem to you? (not at all logical–very logical); (2) How useful does this treatment seem to you? (not at all useful–very useful); (3) How confident are you that this treatment will be successful? (not at all confident–very confident); and (4) How confident would you be in recommending this treatment to a friend with similar difficulties (not at all confident–very confident). Participants completed the scale immediately before the second therapy session.
Negative automatic thoughts were assessed with the 30-item self-report Automatic Thoughts Questionnaire (ATQ, Hollon et al., 1986). The scale measures depression-related cognitions in both college (Dobson and Breiter, 1983) and clinical populations (Hollon et al., 1986).
Neuropsychological functioning
Neuropsychological tasks in this study have been reported in detail elsewhere (Porter et al., 2016). In brief, these tasks were as follows:
Cambridge Neuropsychological Test Automated Battery (CANTAB®) tests: Motor Screening, Pattern Recognition Memory, Spatial Recognition Memory, Spatial Span;
Controlled Oral Word Association Test (COWAT; using letters ‘F’, ‘A’, ‘S’) (Benton and Hamsher, 1976);
Digit Span Forwards and Backwards (Wechsler, 1997);
Rey Auditory-Verbal Learning Test (RAVLT; Rey, 1964);
Consonant Vowel Consonant Verbal Learning Test (CVCT; Vierck et al., 2015).
Pencil-and-paper tests were administered according to standardised instructions. CANTAB was administered according to manual protocols on a laptop with a colour touch-screen monitor. Recognition components of the two verbal learning and memory tests were administered using experimental laboratory software SuperLab Version 2 (Abboud, 1999).
Individual neuropsychological variables were categorised under four broad neuropsychological domains:
Psychomotor Speed (three variables). Motor Screening (response latency), Pattern Recognition Memory (response latency), Spatial Recognition Memory (response latency);
Executive Functioning (four variables). COWAT (total words generated), Digit Span (total score), Spatial Span (length), Spatial Working Memory (strategy score);
Visual Learning and Memory (three variables). Spatial Working Memory (between search errors), Pattern Recognition Memory (total correct), Spatial Recognition Memory (total correct);
Verbal Learning and Memory (12 variables). RAVLT – Total Learning Trials 1–5, Distractor List Recall, Trial 6 Recall, Trial 7 (delay) Recall, Recognition List A (%), Recognition Distractor List (%); CVCT variables – Total Learning Trials 1–5, Distractor List Recall, Trial 6 Recall, Trial 7 (delay) Recall, Recognition List A (%), Recognition Distractor List (%).
Scores were calculated as Z-scores based on the performance of a healthy control group (n = 58) completing the battery under identical testing conditions. Z-scores were calculated using the following formula: (raw score – meancontrol group)/SDcontrol group. A higher Z-score reflected poorer performance in the depressed group compared with the control group. Neuropsychological domain scores were the mean performance across each domain for each participant.
Clinical outcome
Outcome was defined a priori as percentage improvement on the Montgomery Asberg Depression Rating Scale (MADRS; Montgomery and Asberg, 1979) at the end of weekly therapy sessions. The MADRS was completed by an independent clinician, unaware of randomisation.
This study obtained ethical approval from the NZ Upper South Ethics Committee and was registered with the Australian and New Zealand Clinical Trials Registry (ACTRN12605000723684). The study complied with the ethical standards for human experimentation as defined by the Helsinki Declaration 1964.
Statistical analyses
An intention-to-treat analysis was used in all analyses. Descriptive statistics such as means, frequencies, SD and ranges summarised baseline and outcome variables. Chi-square and independent t-tests compared baseline variables between treatment groups. Hierarchical regression generated a model that most efficiently explained response to treatments. The association of each independent variable with MADRS percent improvement was first explored using a two-way analysis of covariance (ANCOVA). ANCOVA models controlled for baseline MADRS and included randomisation as well as the independent variable as main effects and the interaction of the independent variable with treatment, thus identifying any independent variables differentially associated with outcome of one treatment. As nonlinear associations between patient characteristics and outcome have previously been reported (Carter et al., 2011), all continuous variables were categorised into tertiles and treated as categorical factors.
Second, those variables or interactions showing some association with outcome (p < 0.10) were included in models for each of the six domains: demographic, clinical, personality, cognitive, functioning and neuropsychological, also controlling for baseline depression severity. Both forward and backward stepwise modelling ensured robust models for each domain. When an interaction was identified as a predictor, the associated main effect was retained in the model. Finally, variables and interactions showing some association (p < 0.10) with outcome from step two were entered into a single model using forward/backward stepwise modelling. Probability in the final model was set at p < 0.05. Any significant interactions present in the final model for the final step were summarised and explored by analysing the association between predictor variables and percent improvement within each treatment group. The large number of patient characteristics analysed increased chance of type I error. These analyses should be considered exploratory. However, this hierarchical approach reduces the likelihood of type I error and is likely to lead to robust estimation of the independent associations between important predictors and outcome.
Results
Participants were predominantly female and had chronic and/or recurrent depression (Table 1). Average age was 38 years and approximately 50% were married, 85% identified as NZ European and 2% as NZ Māori. Participants receiving ST had higher rates of personality disorder symptoms and poorer executive functioning than participants receiving CBT, and CBT participants were more likely to recommend this treatment.
Comparison of demographic, clinical, functioning, personality, cognitive and neuropsychological predictor variables at baseline across CBT and ST (N = 100).
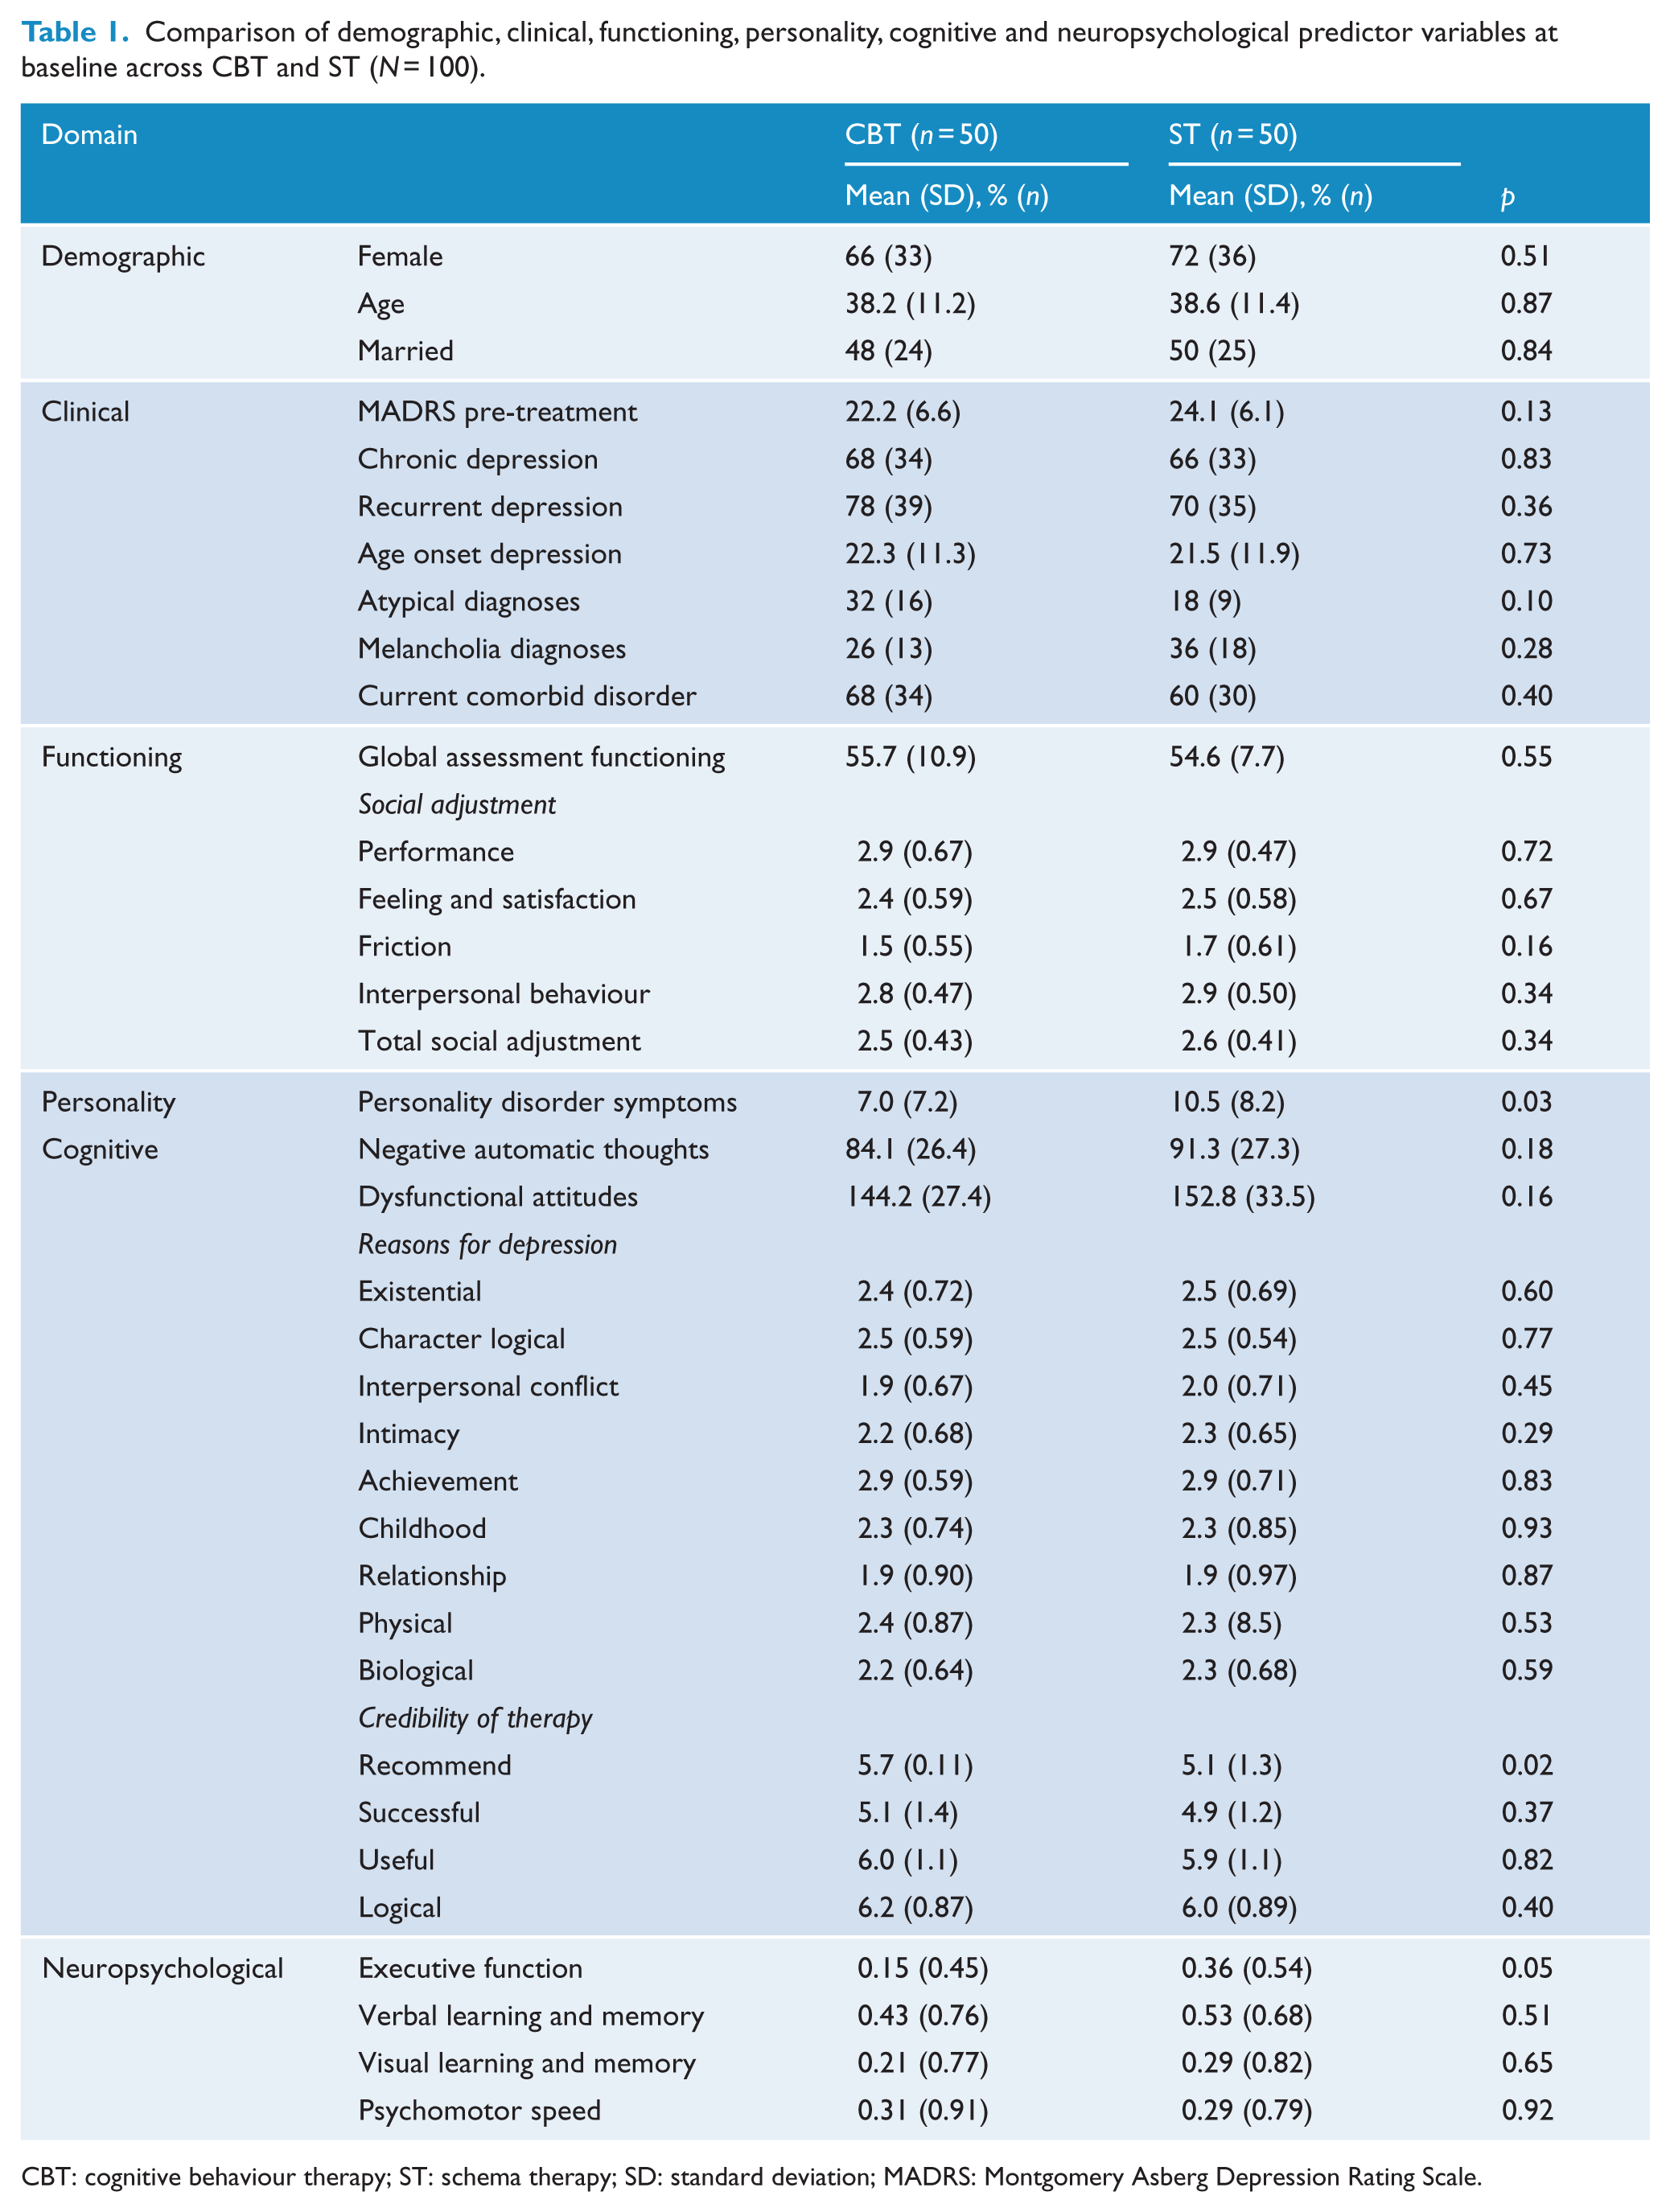
CBT: cognitive behaviour therapy; ST: schema therapy; SD: standard deviation; MADRS: Montgomery Asberg Depression Rating Scale.
Baseline depression severity (MADRS) was not different for ST (mean = 24.1, standard error [SE] = 0.86) and CBT (mean = 22.0, SE = 0.93, p = 0.13). Primary outcome, MADRS percentage change at the end of weekly therapy sessions, was not different for CBT and ST (ST = 41.3, SE = 5.9, confidence interval [CI], [29.6, 53.1]; CBT = 41.4, SE = 5.9, CI [29.3, 53.9], F(1, 97) = 0.001, p = 0.99). Table 2 shows intercorrelations between demographic, clinical, functioning, personality, cognitive and neuropsychological domains, with MADRS percentage change for the total sample and for CBT and ST. Percentage change at the end of weekly sessions was not different for males (mean = 52.0, SE = 6.7) and females (mean = 39.9, SE = 46.4, p = 0.17), nor for married (mean = 49.5, SE = 5.6) and single (mean = 36.6, SE = 6.8, p = 0.13) participants.
Correlation matrix for continuous demographic, clinical, functioning, personality, cognitive and neuropsychological domains with MADRS percentage improvement for whole sample and for CBT and ST.
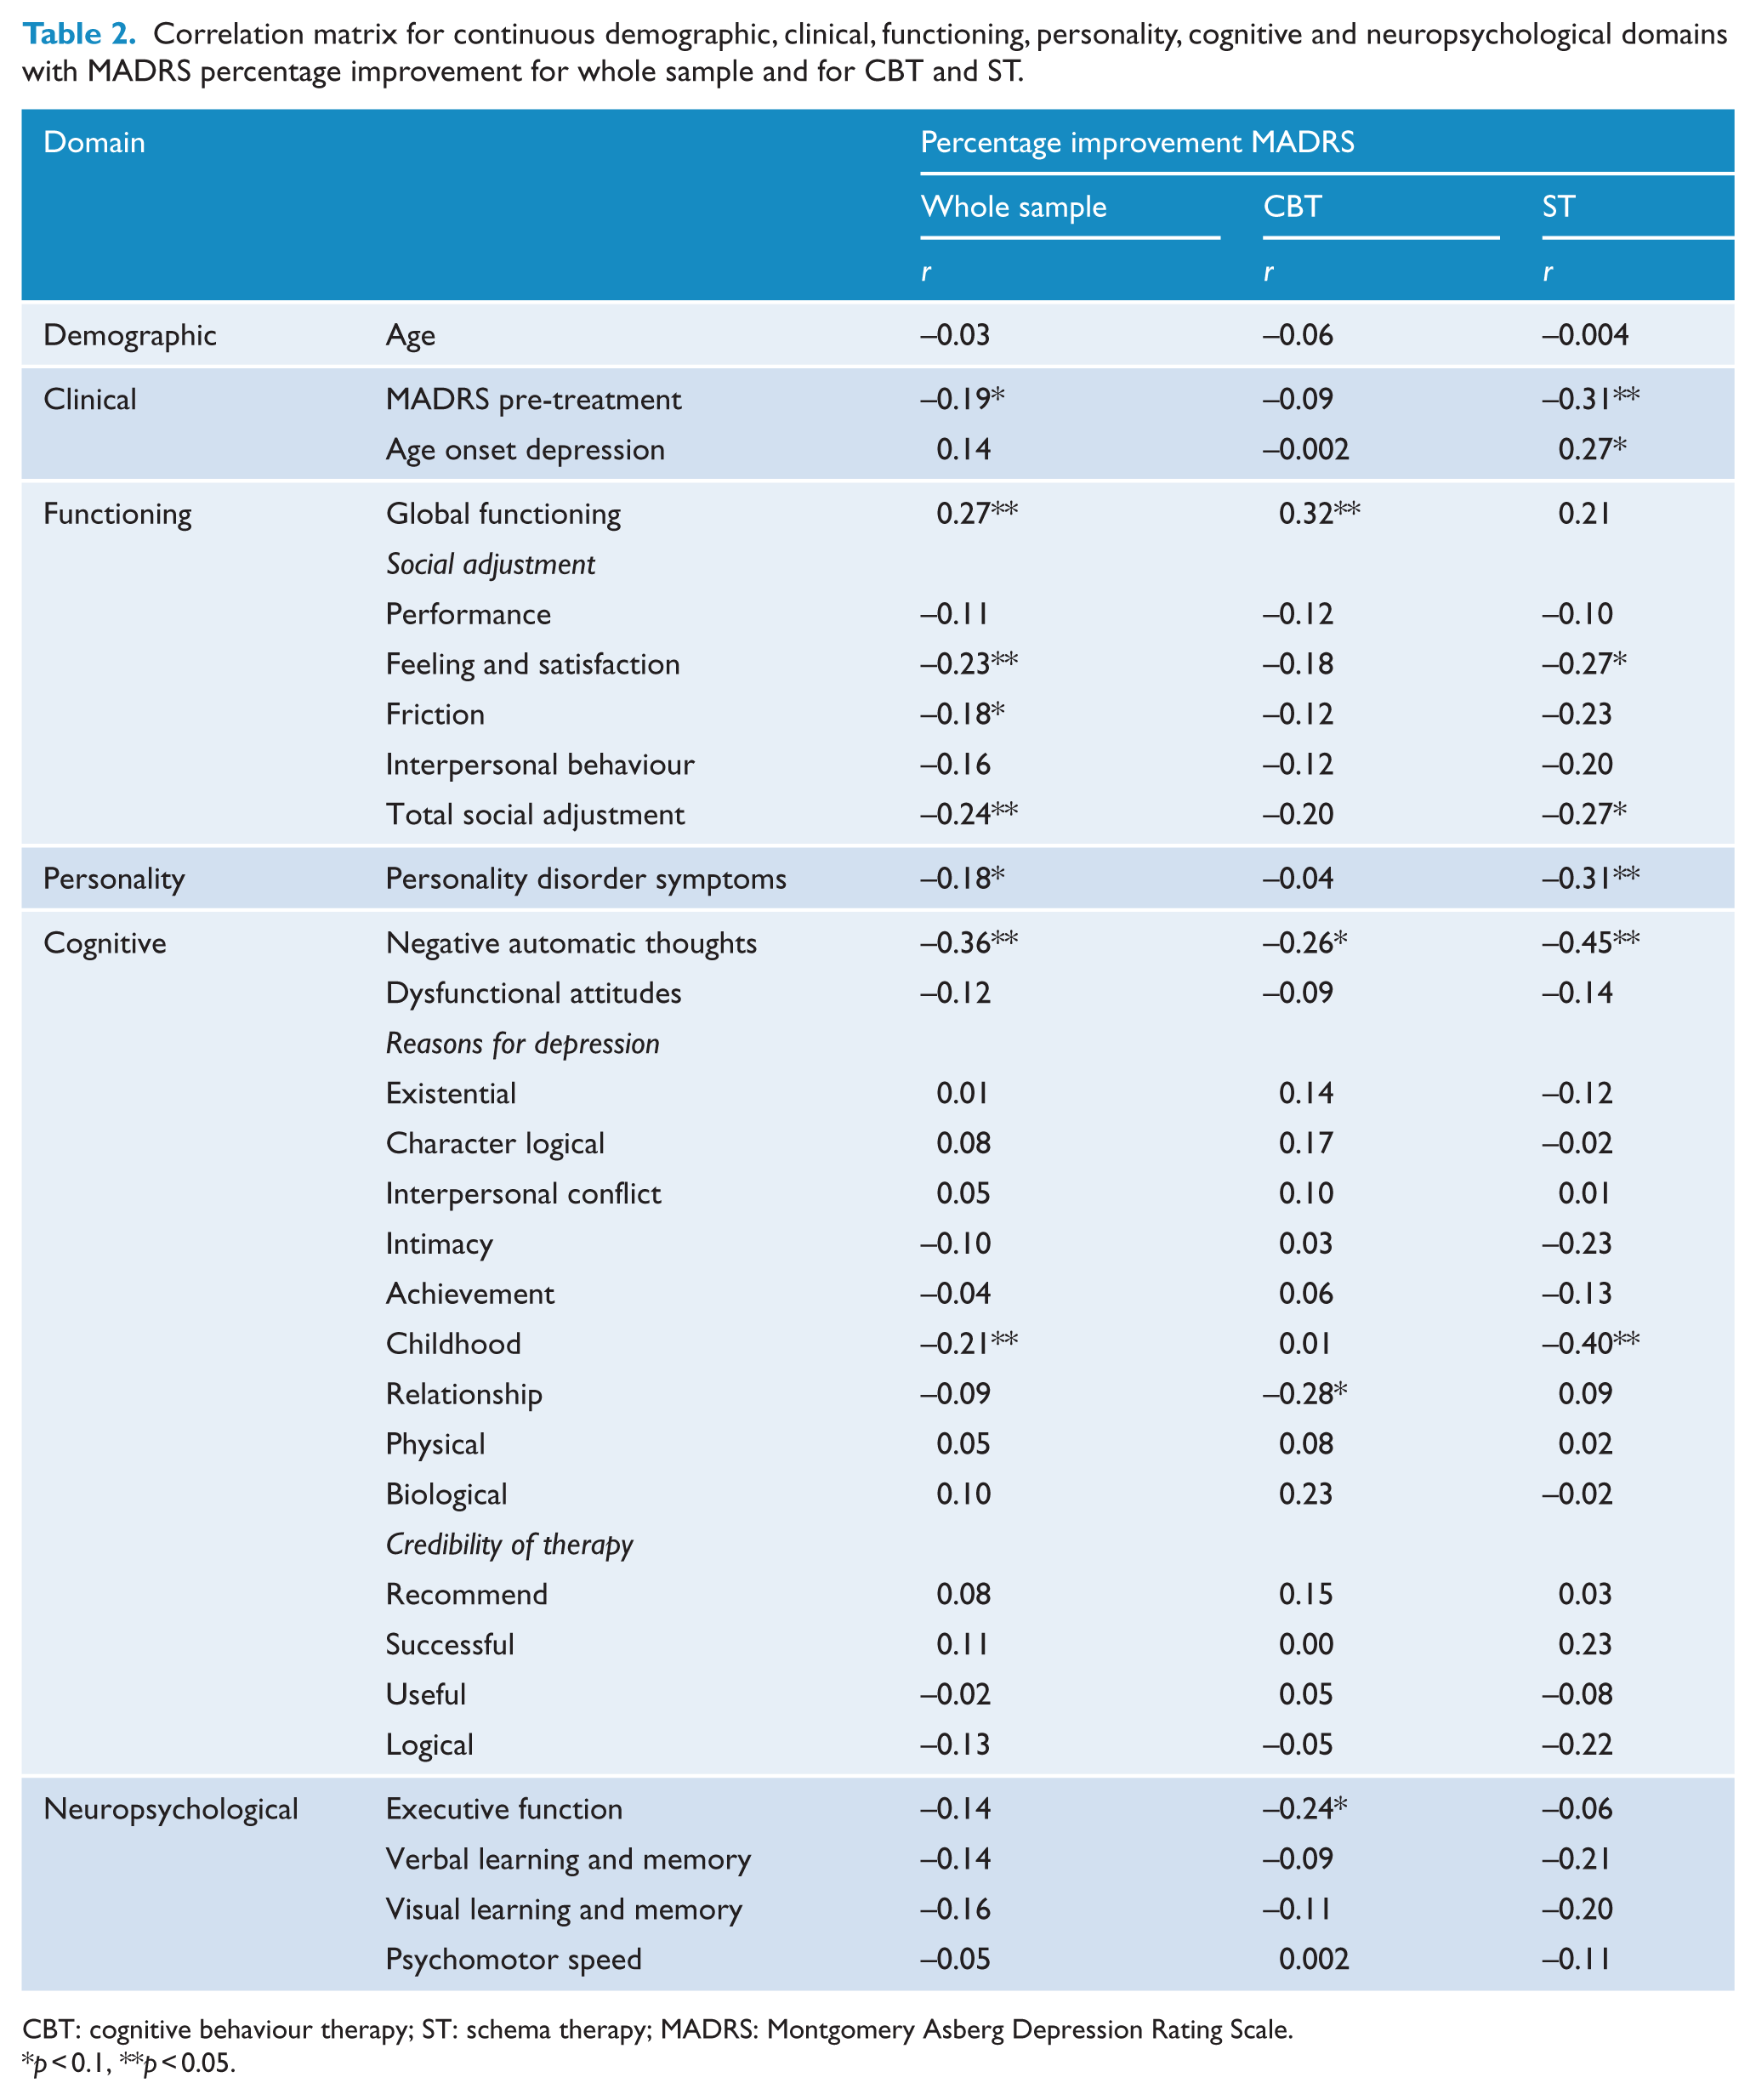
CBT: cognitive behaviour therapy; ST: schema therapy; MADRS: Montgomery Asberg Depression Rating Scale.
p < 0.1, **p < 0.05.
Results meeting the significance criterion from step one (p < 0.10) examining the association of each independent variable and treatment type interactions with MADRS percentage change are shown in Tables 3 and 4. No demographic variables were significantly associated with MADRS percentage change. Clinical domain main effects were chronic depression and age at depression onset. Chronic-by-treatment type and age at onset of depression-by-treatment type interactions were significant. Functioning domain main effect of performance (SAS) and two SAS treatment type interactions were significant: total social adjustment-by-treatment type and interpersonal social adjustment-by-treatment type. Significant cognitive domain results included a main effect for negative automatic thoughts and negative automatic thoughts-by-treatment type and childhood reasons for depression-by-treatment type interactions. Personality was not a significant predictor of response. Significant neuropsychological results were verbal learning and memory-by-treatment type interaction.
Mean and standard error for significant (p < 0.10) main effects for single variable models predicting improvement on the MADRS (step one) (baseline depression severity and treatment type in each model).
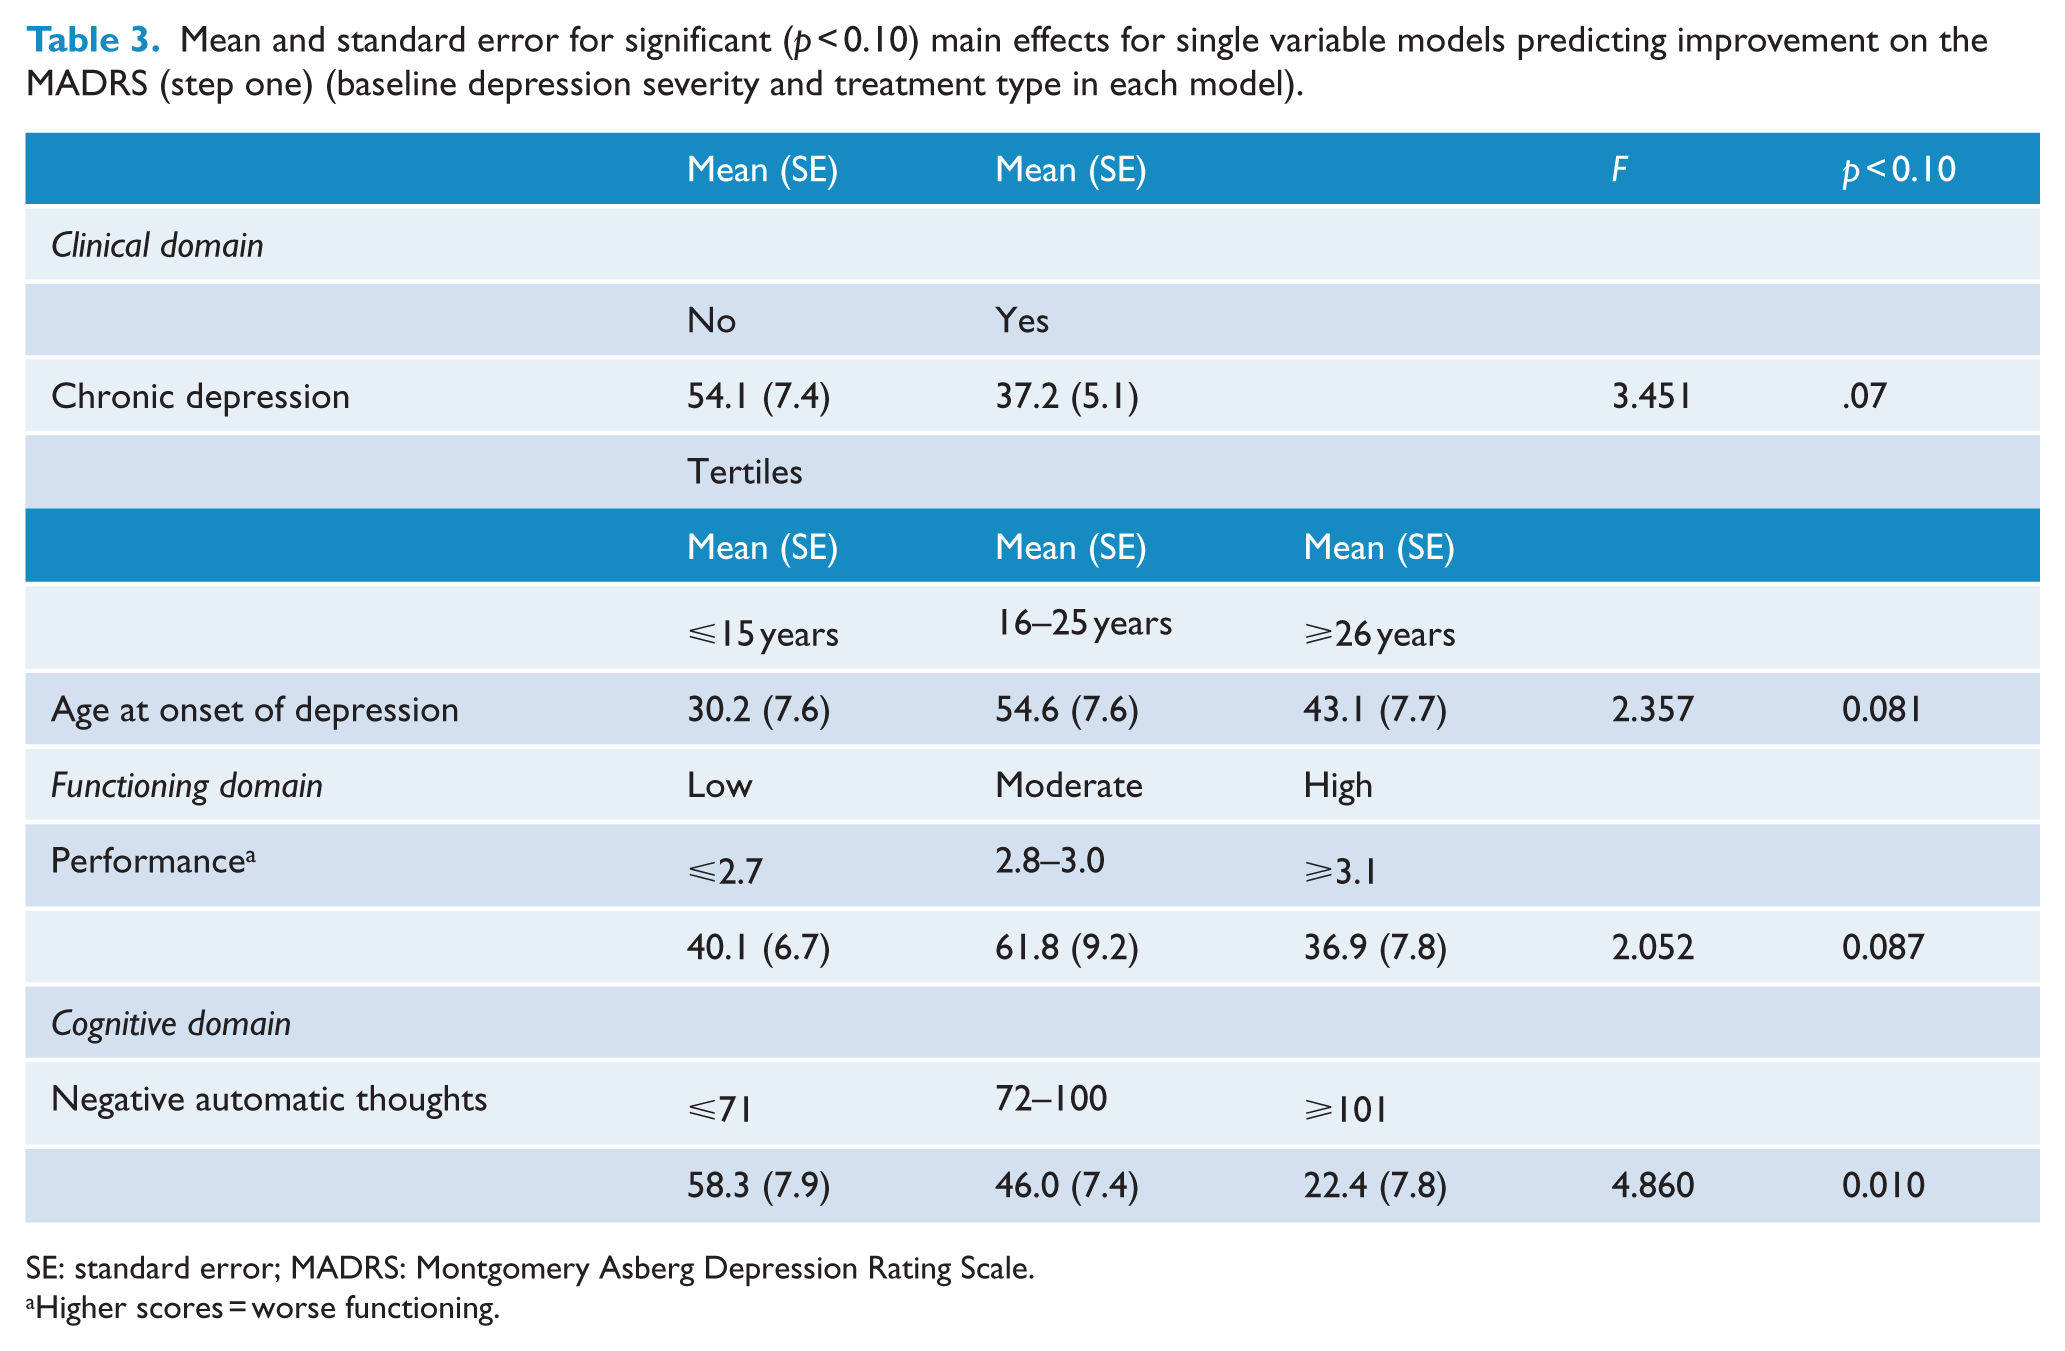
SE: standard error; MADRS: Montgomery Asberg Depression Rating Scale.
Higher scores = worse functioning.
Mean and standard error for significant (p < 0.10) interactions for single variable models predicting improvement on the MADRS (step one) (baseline depression severity and randomised treatment in each model).
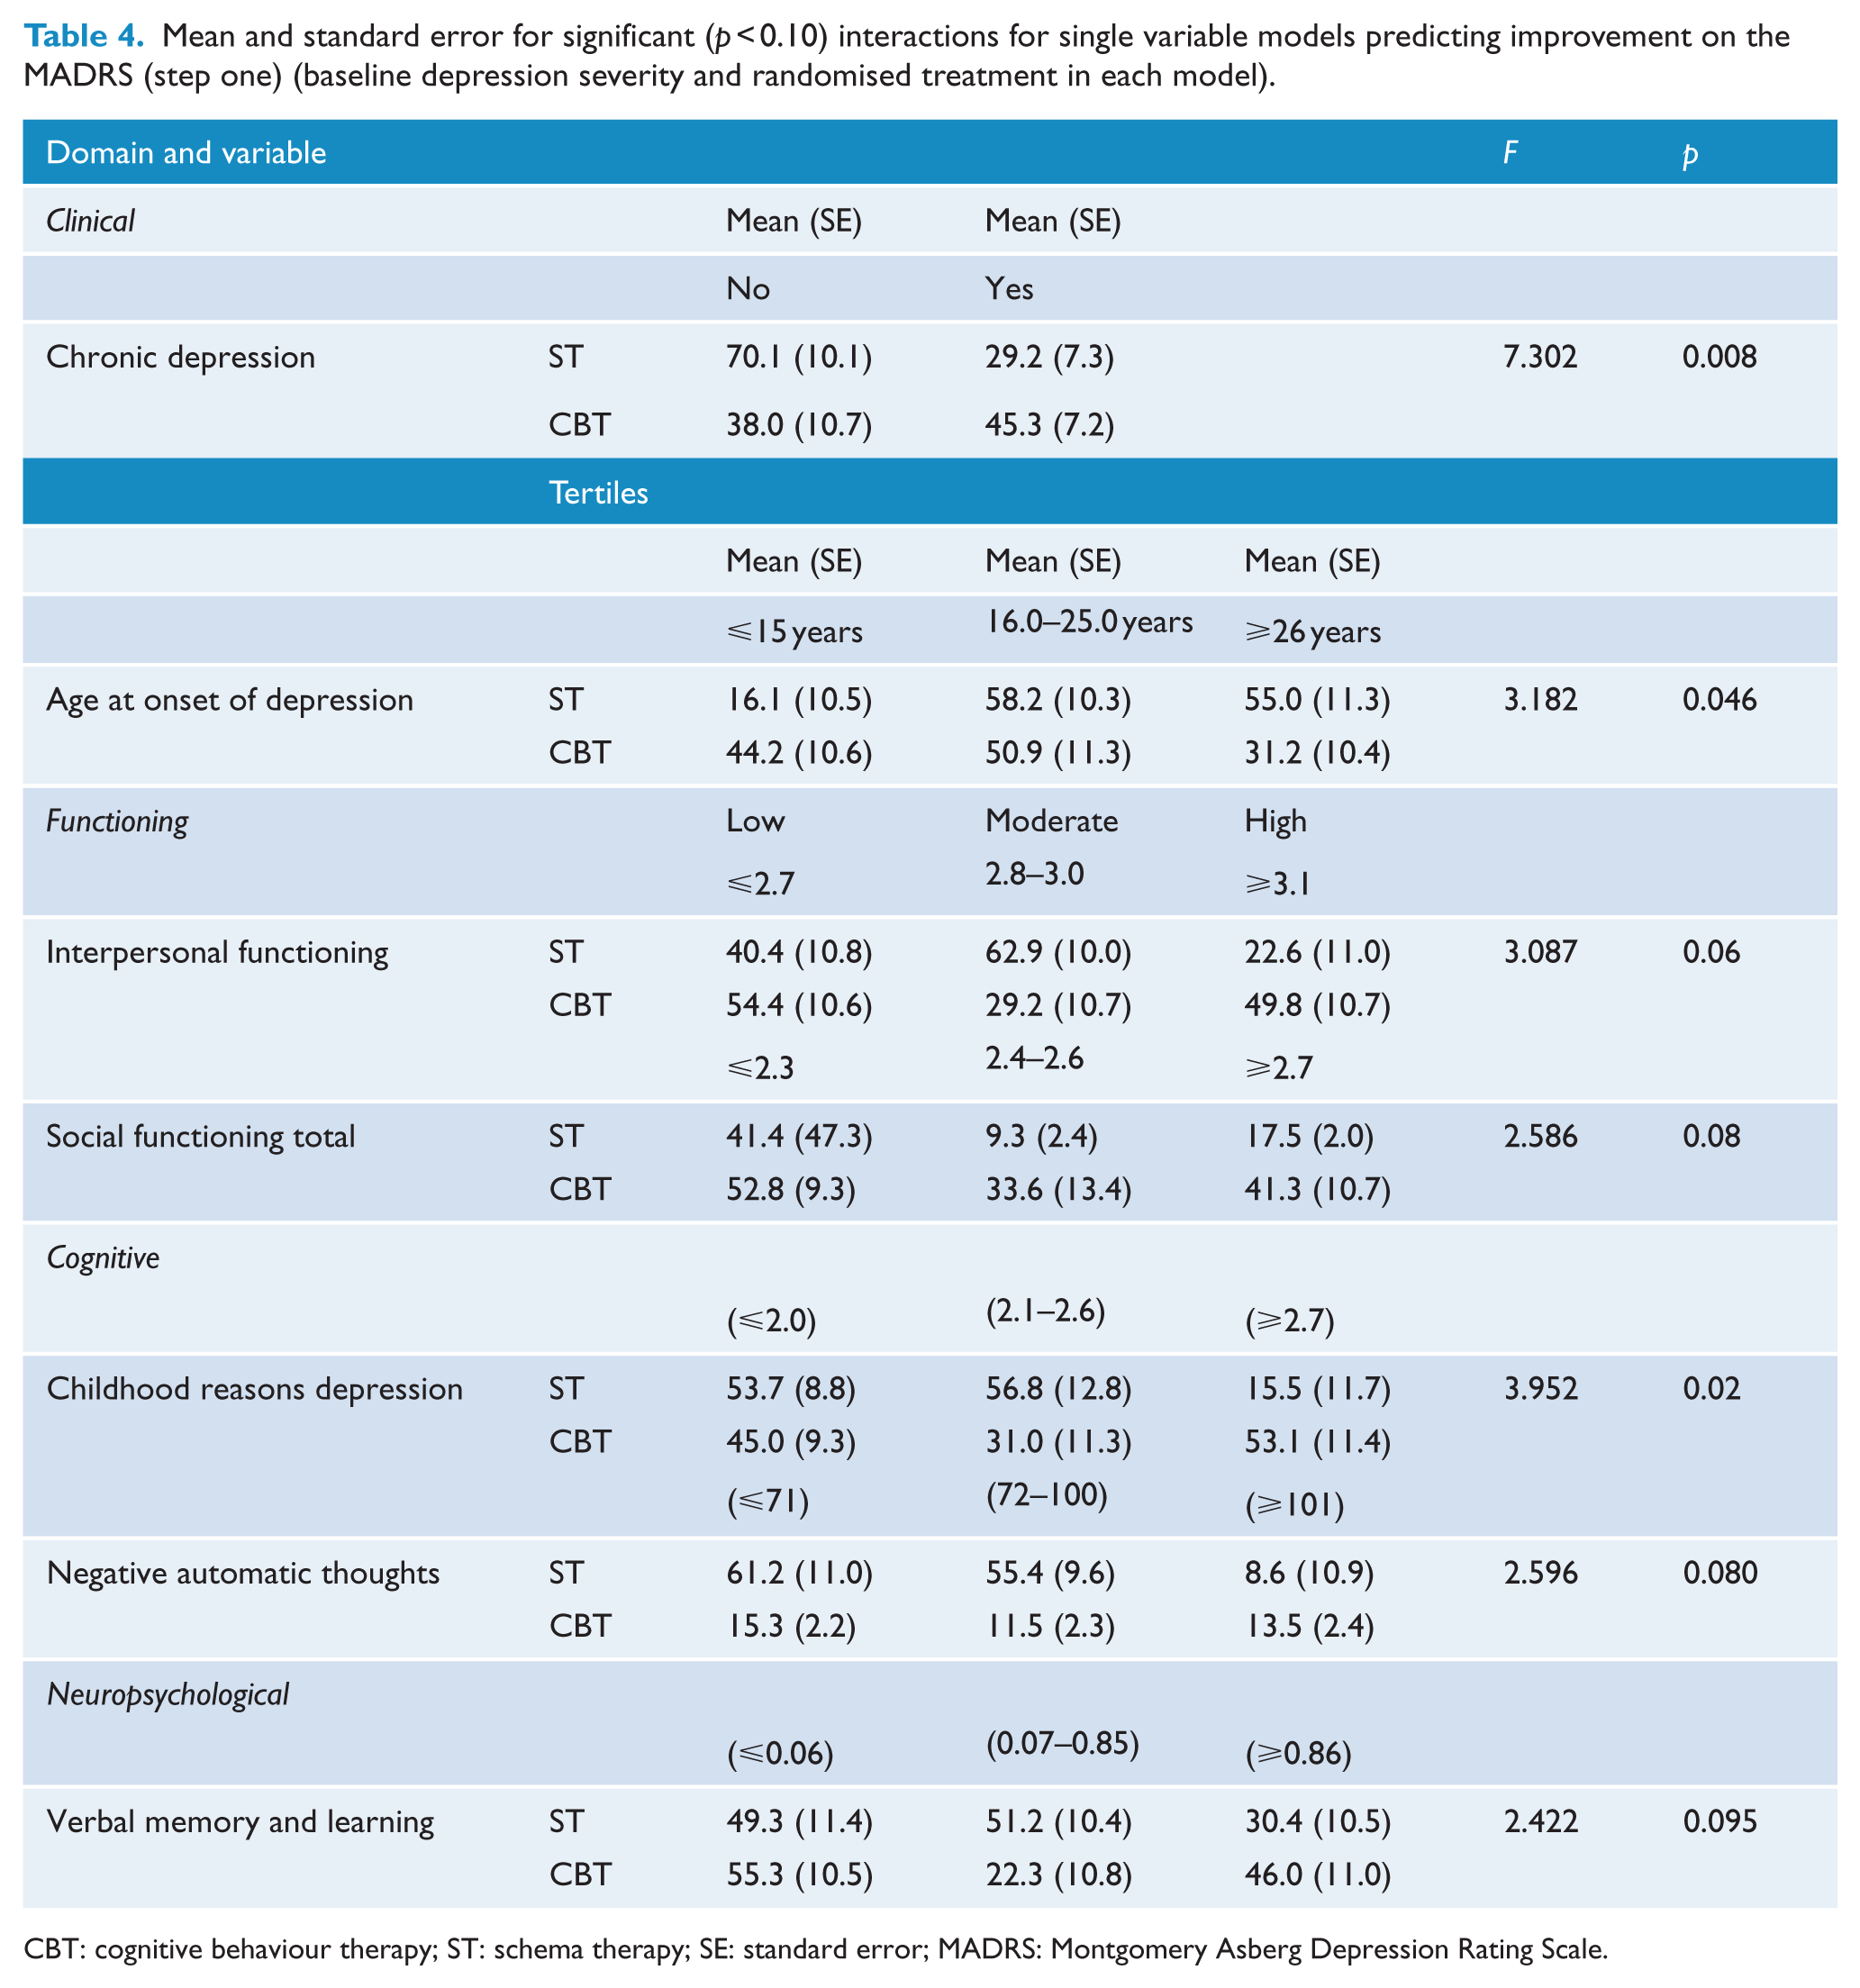
CBT: cognitive behaviour therapy; ST: schema therapy; SE: standard error; MADRS: Montgomery Asberg Depression Rating Scale.
Significant main effects and interactions at step one progressed to forward/backward stepwise models (step two of analyses). The clinical domain main effect of chronic depression (p = 0.03) and age at onset of depression (p < 0.09) and the interaction of chronic depression-by-treatment type (p = 0.04) and age at onset of depression-by-treatment type (p = 0.09) remained significant (r2 = 0.17). In the functioning domain, the main effect of performance (p < 0.02) and the interaction of total social adjustment-by-treatment type (p = 0.03) and the interaction of interpersonal functioning-by-treatment type (p = 0.02) remained significant (r2 = 0.14). The cognitive domain main effect for negative automatic thoughts (p = 0.03) and interaction of childhood reasons for depression-by-treatment type (p = 0.03) remained significant (r2 = 0.14). Finally, the neuropsychological domain verbal learning and memory-by-treatment type interaction (p = 0.05) was significant (r2 = 0.05).
In the final model (see Table 5), depression chronicity and increased levels of negative automatic thoughts both predicted poorer therapy outcome. There was no main effect for treatment type or baseline depression severity. Specifically, for those with chronic depression, the average percentage response on the MADRS was 37.1 (SE = 5.3), whereas for those without chronic depression the percentage change was 55.9 (SE = 7.5). The average percentage change for those with high levels of negative automatic thoughts was 22.6 (SE = 8.0), for moderate levels was 47.5 (SE = 7.4) and for low levels was 57.5 (SE = 8.0). The interaction of verbal memory learning and treatment type was also significant in the final model (see Figure 1). The highest verbal learning and memory score (Tertile 1, reflecting least impaired performance) made little difference to response for both CBT and ST. However, those with the lowest verbal learning and memory score (Tertile 3, reflecting lowest performance) had a poorer ST response compared with CBT. The reverse was true for those with moderate verbal learning and memory scores (Tertile 2), with poorer CBT response compared with ST. Together the significant predictors in the final model accounted for 23% of the variance in outcome.
Final model predicting percentage change on MADRS.
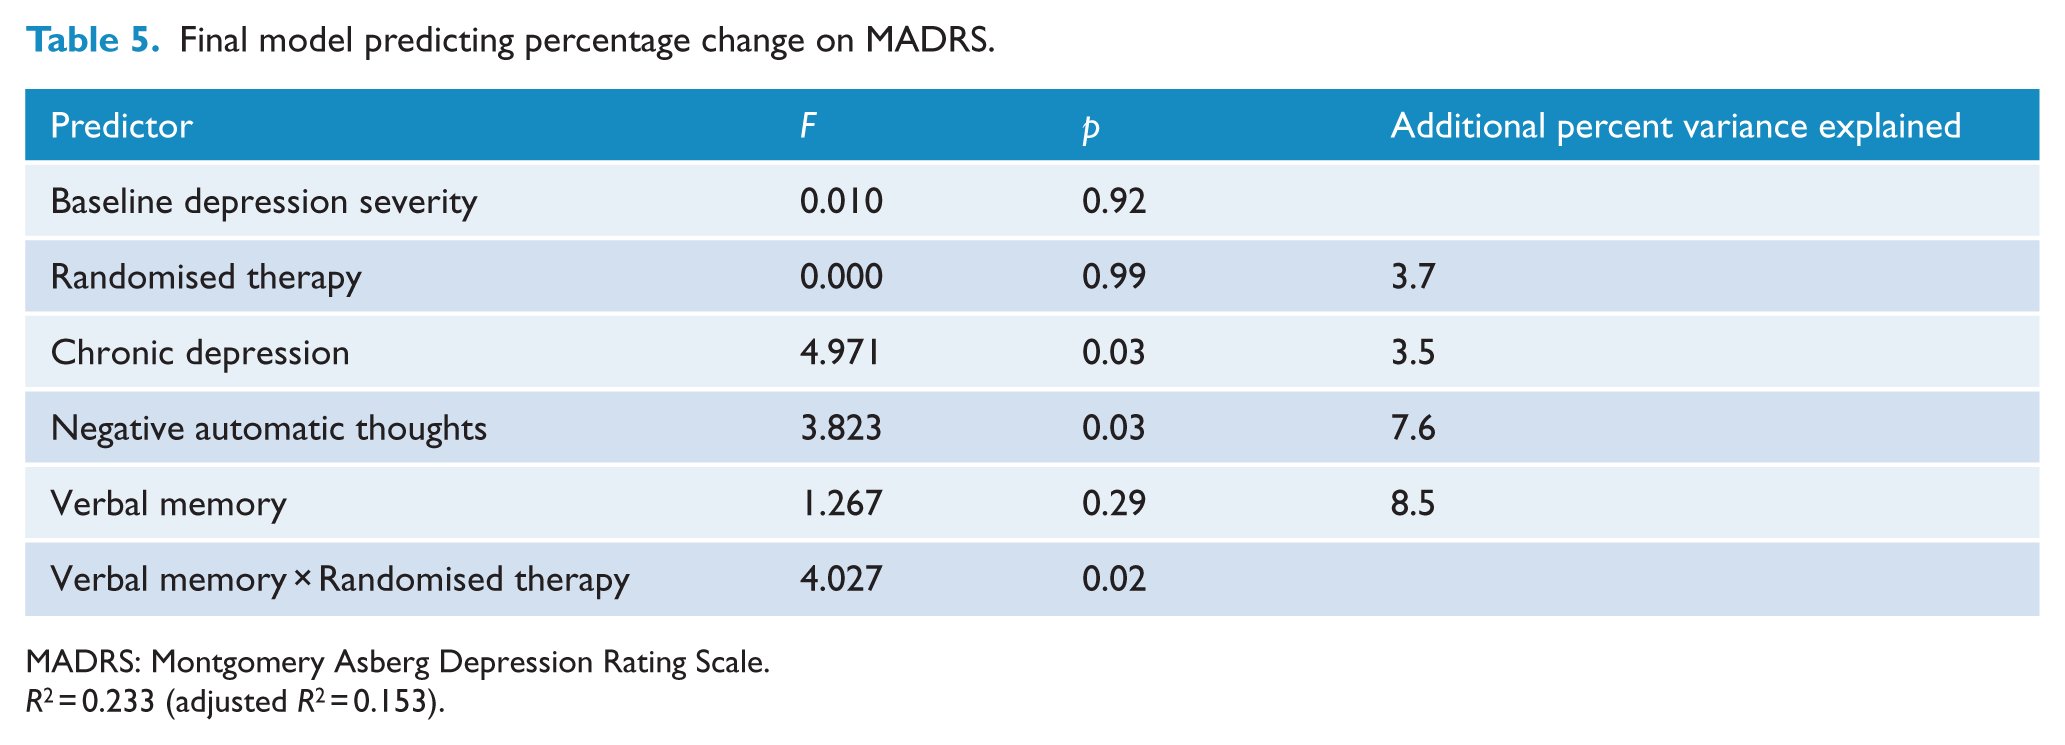
MADRS: Montgomery Asberg Depression Rating Scale.
R2 = 0.233 (adjusted R2 = 0.153).
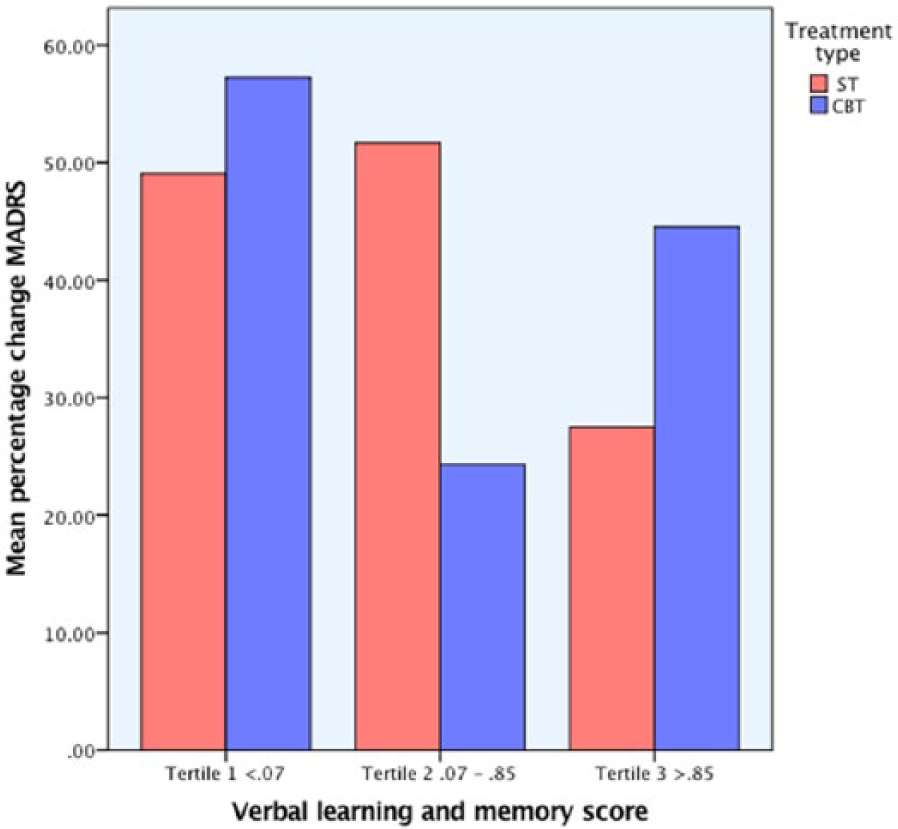
Interaction of verbal memory and learning with treatment type.
Discussion
This study examined general and treatment-specific patient factors associated with response to CBT and ST for depression. Predictors of poorer response were depression chronicity and elevated pre-treatment negative automatic thoughts. Other studies have reported poorer response to acute treatment for chronic depression; however, it remains unclear whether this occurs because the dose or content of therapy is insufficient. McCullough (2000) has proposed that chronic and nonchronic forms of depression are qualitatively different, and differential treatment strategies are needed. The current findings are consistent with Cristea et al.’s (2015) meta-analysis, which reported a strong inverse association between negative automatic thoughts and therapeutic response. The current results support Cristea et al.’s summation that cognitive change is important for remediation of depression regardless of how it occurs and it is important in all therapies not only those with a cognitive focus and may be a common mechanism of action.
In this study, there was no impact on response to CBT or ST for those who had a high verbal learning and memory score (Tertile 1, Figure 1). There was, however, a differential response for those with moderate (Tertile 2, Figure 1) and lowest (Tertile 3, Figure 1) levels of verbal learning and memory. The pattern of response suggests that while ST is less impacted by high to moderate levels of pre-treatment verbal learning and memory, low pre-treatment verbal learning and memory scores impact negatively on response. In contrast, response to CBT was markedly worse for those with moderate levels of verbal learning and memory.
The Capitalisation Model provides one way of interpreting these findings (Cheavens et al., 2012). As noted by Cheavens, patients differ in the degree to which they have pre-existing strengths or deficits. The Capitalisation Model proposes that therapy focusing on a patient’s strengths is more likely to be successful than therapy focusing on reducing patient’s deficits, impairment or relative weakness (i.e. Compensation Model). Previous research has supported the Capitalisation Model. Sotsky et al. (1991), for example, reported that those with lower levels of dysfunctional attitudes had a superior response to CBT and higher levels of interpersonal functioning resulted in superior response to Interpersonal Psychotherapy. The current findings indicated that in those individuals with strong verbal learning and memory performance, there was no impact on treatment response. One other study in this area (Beaudreau et al., 2015) reported that impaired executive functioning (Trail Making Test, Part B), but not verbal learning and memory (Hopkins Verbal Learning Test – Revised), predicted poorer response to problem-solving therapy and supportive therapy.
The Capitalisation Model could also account for the curvilinear and opposite response between verbal learning and memory, CBT and ST. It is possible that low verbal learning and memory scores may be more evident to CBT therapists, as the cognitive strategies rely explicitly and centrally on these skills. This may result in therapists taking a more behavioural rather than cognitive focus in therapy, thereby shifting therapy strategies away from patient’s area of weakness and resulting in a better therapeutic response. Behavioural strategies are a core component of CBT and are often recommended when patients have difficulty with the cognitive work. In contrast, moderate levels of verbal learning and memory may not be identified by CBT therapists as particularly problematic, and therefore a shift in focus to behavioural strategies is less likely to occur, thereby impacting negatively on treatment response. With regard to ST, although not explicitly or centrally focused on, cognitive ability is still important (e.g. schema change, imagery rescripting). It may be the case that it is only when relatively low verbal learning and memory levels are evident that this becomes problematic. Of course, this interpretation of the verbal learning and memory-by-treatment type interaction is speculative and further research is required. It is also noteworthy that the Z-scores for verbal and learning and memory, while clearly below the scores of healthy controls, showed a mean of less than 1 even in the lowest functioning group and hence performance was at the low end of normal. Replication of these findings with individuals with verbal learning and memory impairment is needed. If replicated it would also be interesting to examine whether or not cognitive remediation increased therapeutic response (Trapp et al., 2016).
This study has limitations. The sample comprised outpatients in a clinical trial and may not be representative of all clinical outpatients. The study is correlational and therefore cause and effect associations are speculative. The initial use of an alpha level of p < 0.10 enabled greater power to identify potential predictors than a more stringent criterion might have, but increases the possibility of chance findings. However, a more stringent significance level p ⩽ 0.05 was used in the final model. Therapy occurred weekly for 6 months and outcome was measured by clinician-rated depression symptoms (MADRS). The association of predictor variables and outcome may vary depending on the length of therapy and outcome measures. Outcome in this study was confined to clinician-rated outcome of depression. Self-report measures of depression and/or other outcome measures of functioning may result in different findings. Finally, the current findings require replication.
A strength of this study is the use of a systematic approach to examine the relative contribution of potential client predictors of response. In addition to the specific findings reported here, and perhaps as importantly, while a variety of potential variables were examined in this study, only two general predictors of response and only one differential treatment type predictor were identified. Together these variables account for 23% of variance in outcome leaving 77% of variance unaccounted for. Thus, patient factors made a modest contribution to outcome and other factors not measured in this study are important contributors to response. This result is consistent with other research examining predictors of response (Blom et al., 2007; Carter et al., 2011). These findings raise the question of what other patient factors might be unaccounted for which were not examined. There is some indication from existing research that therapeutic alliance, attachment style, perfectionism, reflective functioning ability and self-criticalness might contribute to outcome. There have been suggestions that therapist effects may be an important contributor to outcome; however, no effect of therapist and outcome was apparent in this study. There is relatively little robust research in this area with most methodologically sound studies reporting small effects (Elkin et al., 2006).
Conclusion
Consistent with previous research, chronic depression and increased levels of pre-treatment negative automatic thoughts were associated with poorer response to therapy. A novel finding requiring replication is that poor verbal learning and memory performance markedly impacted response to ST, but not to CBT, which was more impacted if moderate performance existed. Identification of predictors of treatment response provide the opportunity to enhance psychotherapy outcomes by selecting or adapting therapies that better target individuals’ specific needs. The Capitalisation and Compensation models provide fruitful frameworks within which to understand research in this area. The findings here suggest that personalising therapy to a patient’s strengths and not their weaknesses may result in better treatment outcomes.
Footnotes
Acknowledgements
Particular thanks to the researchers, therapists and clinicians who worked on this study and a special thanks to all those who participated in the study. This clinical trial was registered with the Australian and New Zealand Clinical Trials Registry (ACTRN12605000723684).
Declaration of Conflicting Interests
The author(s) declared no potential conflicts of interest with respect to the research, authorship and/or publication of this article.
Funding
This research was funded by a grant from the Lottery Health Board and funding from the Health Research Council of NZ (HRCNZ) (grant number 03/096E). The Lottery Health Board and HRCNZ did not have any involvement in any aspect of study design or dissemination.