
Abstract
Objective:
To examine changes in annual patterns of psychotropic medication use in Australia from 2007 to 2015.
Methods:
We used a 10% sample of individual-level nationwide dispensing claims for concessional beneficiaries dispensed psychotropic medications (stratified by class, subclass) to investigate annual trends and changes in the incidence and prevalence of use, median annual duration of exposure, proportion of people with single psychotropic dispensing and median defined daily doses per person dispensed each medicine per year.
Results:
Over the study period, there was a 26.1% decrease in the incidence and a 2.6% increase in the prevalence of all psychotropic medicine use. We observed a decrease in the annual incidence and prevalence of antidepressants (11.6% and 16.8%, respectively) but increases in the median annual duration of exposure (7.4%). Amitriptyline had the highest proportion of single dispensings of all antidepressants throughout the study period (26.5% in 2015) and defined daily doses per person dispensed each medicine per year increased by 20% for antidepressants overall. Benzodiazepine use decreased across all measures over the study period apart from long-term use (exposure for >240 days of the year), which in 2015 was 23.6% of those dispensed a benzodiazepine. We observed a relative increase in the incidence and prevalence of antipsychotic use (14.2% and 26.8%, respectively), and haloperidol had the highest proportion of single dispensings of any antipsychotic throughout the study period (47.5% in 2015). We observed a relative increase in the incidence and prevalence of attention-deficit hyperactivity disorder medication use of 114.0% and 101.8%, respectively, over the study period.
Conclusion:
Increasing doses and treatment durations of antidepressants warrants further investigation due to concerns about overuse. Single dispensings of amitriptyline and haloperidol may indicate off-label use and long-term use of benzodiazepines remains problematic. Despite increases in attention-deficit hyperactivity disorder medication use, prevalence of use is still much lower than the estimated prevalence of attention-deficit hyperactivity disorder in the adult population.
Keywords
Introduction
The past two decades have seen worldwide increases in the pharmacological treatment of mental illness (Ilyas and Moncrieff, 2012; Medco Health Solutions, 2011; Stephenson et al., 2013). In the United Kingdom, prescriptions for psychotropic medications increased, on average, by 6.8% per year between 1998 and 2010 (Ilyas and Moncrieff, 2012). There has also been a 22% increase in the number of privately insured US adults dispensed psychotropic medications between 2001 and 2010 (Medco Health Solutions, 2011). In Australia, the dispensing of psychotropic medicines increased in volume by 23.5% between 2007 and 2015 (Pharmaceutical Benefits Scheme [PBS], 2016). Increases in antidepressant and antipsychotic use appear to underlie these changes worldwide, although increases in the use of psychostimulants have also been reported (Ilyas and Moncrieff, 2012; Olfson et al., 2014; Renoux et al., 2016; Stephenson et al., 2013). While some of this growth undoubtedly represents better access to treatment and improved quality of care in mental illness, there are concerns about over-treatment of some patient groups and increasing off-label use (Kjosavik et al., 2015; McKean and Monasterio, 2012).
To date, there is little detailed evidence about how psychotropic medicines are used in Australian clinical practice. Most studies examining trends in psychotropic use have used aggregated claims-level data (Pearson et al., 2015), an approach that yields insights on a population level but provides limited understanding about how medications are used by individuals. Tracking psychotropic medication use at the person-level allows for a deeper understanding of how these medications are used and how use is changing over time.
We used individual-level dispensing claims to examine annual changes in psychotropic medicine use among adults in Australia from 2007 to 2015. Specifically, we aimed to examine the annual incidence and prevalence of use, median annual duration of exposure, annual proportion of people with a single psychotropic dispensing and median annual defined daily dose (DDD) per person for four psychotropic medicine classes (antidepressants, benzodiazepines, antipsychotics and medications used in the treatment of attention-deficit hyperactivity disorder [ADHD]). This is the first study to provide a comprehensive overview of psychotropic class and subclass utilization based on individual-level metrics across the entire Australian population with the intent of highlighting areas of concern for further investigation.
Methods
Setting
Australia has a publicly funded universal healthcare system entitling all citizens and permanent residents subsidized access to prescribed medicines via the PBS (Mellish et al., 2015). PBS-eligible patients pay a co-payment according to their beneficiary status. Concessional beneficiaries (patients eligible for government entitlements, including pensioners and low-income earners) have a lower co-payment threshold than general beneficiaries (all other patients). PBS medications priced below the general beneficiary co-payment threshold and private prescriptions are not subsidized by the PBS.
Data source and study population
We used PBS dispensing records from 1 January 2006 to 31 December 2015 from a 10% random sample of persons 18 years and older eligible to receive a PBS-listed medicine. The PBS 10% sample is a standard dataset provided by the Australian Government Department of Human Services for analytical use (Mellish et al., 2015). The sample only includes dispensing records of PBS-subsidized medicines; it does not capture medicines priced below the co-payment threshold or those dispensed privately.
The cost of many medications falls below the general co-payment threshold but above the concessional co-payment threshold. To ensure complete capture of individuals’ dispensing histories, we defined our study population as persons 18 years or older who were also long-term concessional beneficiaries (i.e. individuals dispensed only medications attracting a concessional co-payment during the entirety of the study period).
Medicines of interest
Medications belonging to Anatomical Therapeutic Chemical (ATC) Classification classes NO5 (psycholeptics) and NO6 (psychoanaleptics) (World Health Organization [WHO], 2016b) that were PBS-subsidized in Australia were reclassified into clinically meaningful therapeutic classes and subclasses according to the Australian Medicines Handbook (Table 1; see Supplementary Table S1 for details of all medications and ATC codes). We did not include anticonvulsant mood stabilizers (ATC N03) in this analysis as their use in mental illness cannot be differentiated from use in epilepsy. Nor did we include modafinil (ATC N06BA07), as this is most commonly prescribed for narcolepsy. We also excluded medications used to treat dementia (ATC N06D) as they were considered out of scope.
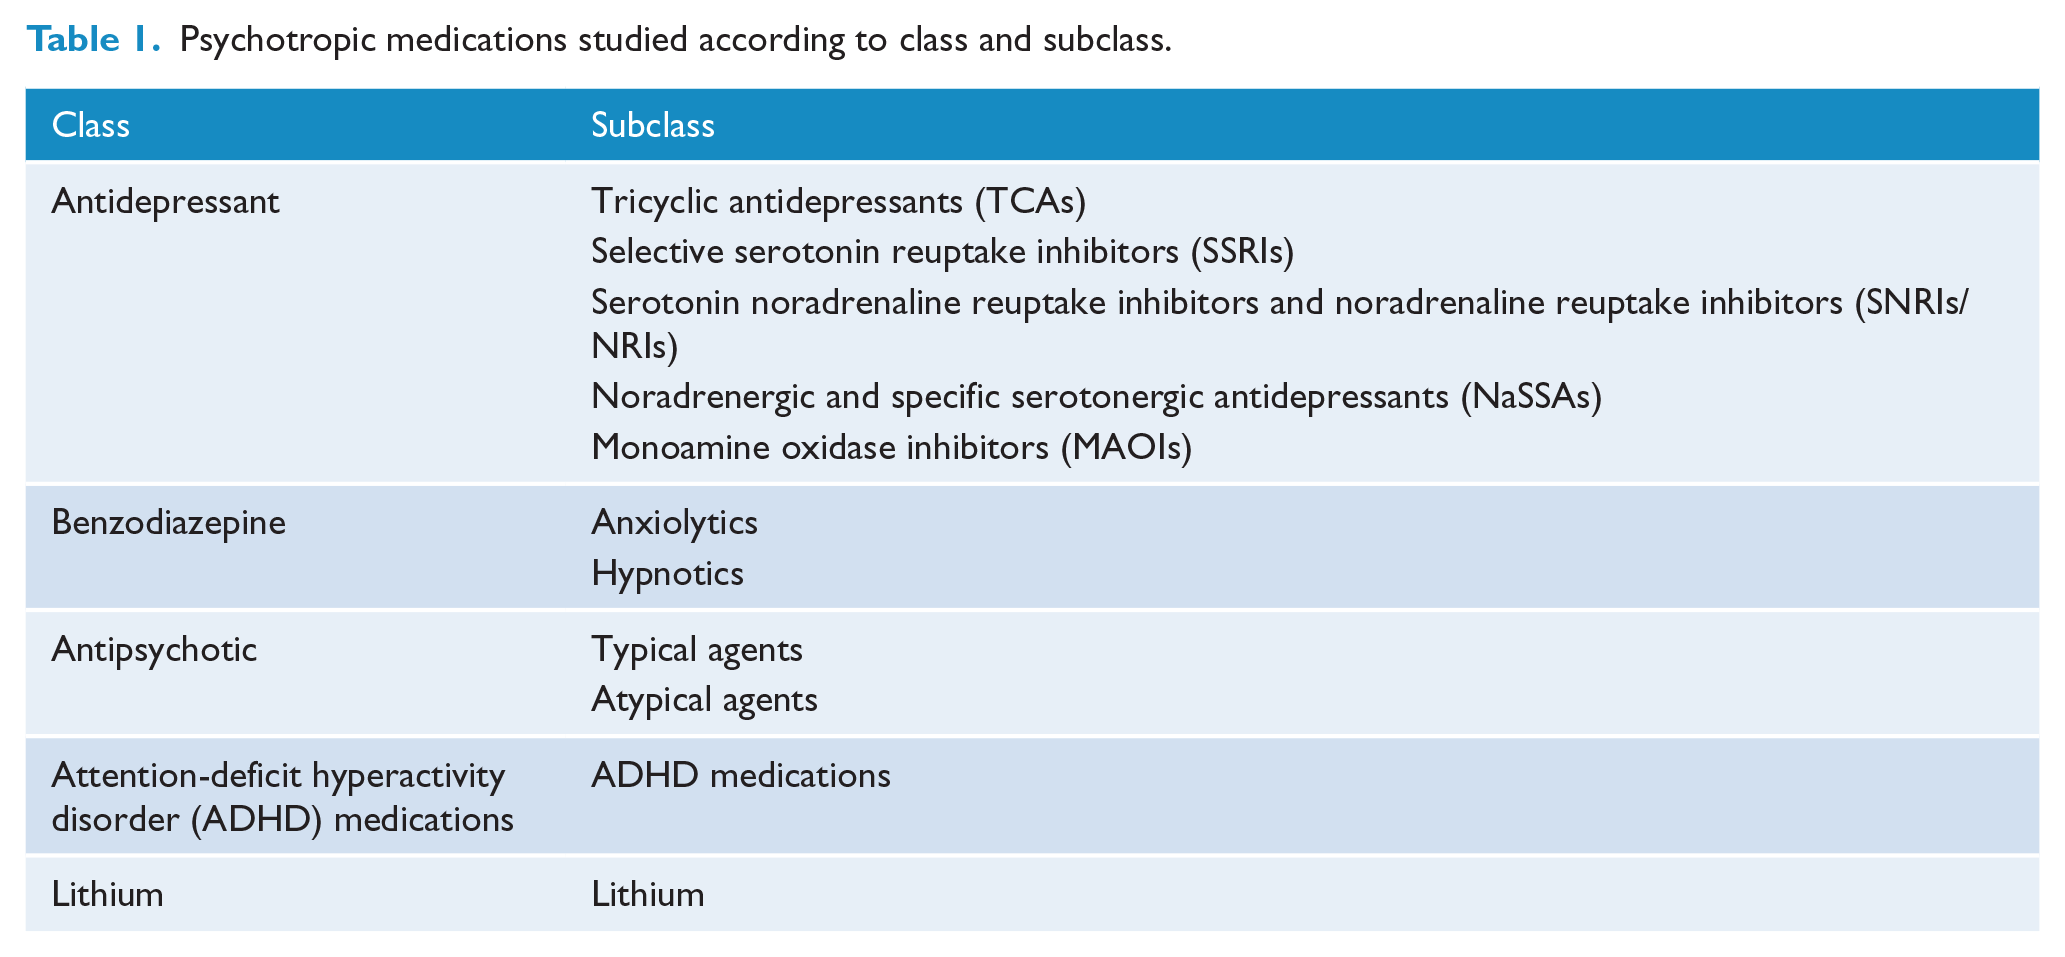
Psychotropic medications studied according to class and subclass.
Metrics and statistical analysis
Annual incidence and prevalence
We estimated incident (new) use by identifying persons with a dispensing for a specific psychotropic medication within a given calendar year and no dispensing of that medication in the previous 12 months. We report our estimates from 2007 to allow for a 1-year look-back for incidence calculation. We estimated prevalent use by identifying persons with at least one dispensing of a specific psychotropic medicine within a given calendar year. We calculated the annual incidence and prevalence at the medicine, subclass and class level expressed as proportion of users per 1000 persons (/1000) within the study population.
Median annual duration of exposure and single dispensings
We explored annual duration of exposure by estimating the median number of days in a calendar year that individuals were exposed to specific psychotropic medications. PBS dispensing claims contain only the date medications are dispensed, and so to calculate annual duration of exposure to a medication, we first estimated the duration of exposure (in days) following a single dispensing of that medication, hereafter referred to as the estimated period of exposure (EPE). For each medication, we measured the intervals between dispensings of the same medication in individuals who had more than one dispensing of that medication over the study period. We then calculated the EPE for a medicine as the number of days in which 75% of people had received a subsequent dispensing of that medication. We excluded intervals between dispensings of >180 days from EPE calculations as it is unlikely that dispensings after this period would be part of the same treatment course. This method has been applied previously to psychotropics and accounts for variability in dispensing due to adherence, dose changes and seasonality (Pottegård and Hallas, 2013; Pratt et al., 2014).
For each individual, we calculated annual duration of exposure for a given medication by adding the days exposed to that medicine, based on its EPE. We then calculated the median annual duration of exposure for each medication, subclass and class.
To estimate long-term use, we calculated the proportion of individuals who were exposed to each medicine for 240 days or more in that year among those dispensed that medicine. To capture intermittent use, we examined the proportion of individuals with a single dispensing among those dispensed that medication within a calendar year and whose EPE did not overlap with a dispensing of the same medication in the previous or subsequent year.
Finally, we conducted a sensitivity analysis using data from 2015 to explore how the estimated annual duration of exposure and the proportion of single dispensings for each medication class changed when using an EPE equal to the number of days in which 90% (P90) rather than 75% (P75) of individuals receive a subsequent dispensing of the same medication.
Median DDD per person per year
The DDD is an index established by the WHO to facilitate comparisons in medicine use and is the assumed average maintenance dose per day for a drug used for its main indication in adults (WHO, 2016a). For each medication, we calculated the annual weight volume dispensed by multiplying the dosing unit strength by the number of units per item and then by the number of dispensings that year. To calculate the number of DDDs dispensed to each individual per calendar year, we then divided the volume of the medication dispensed by its corresponding DDD. For each individual, we summed the number of DDDs for each medication within the same subclass, class and overall to determine the number of DDDs per person at these levels per year. We then calculated the median DDDs/person/year (DDD/p/y) overall and by class and subclass. This measure does not account for duration of exposure during the year. For instance, if the DDD/p/y is 100 per year for an individual, this could mean that they were dispensed the medicine at twice the DDD of that medication over 50 days or half the DDD over 200 days.
Changes in medicine use from 2007 to 2015
We examined the changes between our 2007 and 2015 estimates for all metrics, which were expressed as a ratio (2015:2007) and as relative changes.
The New South Wales Population and Health Services Research Ethics Committee granted ethics approval for this study (Approval Number 2013/11/494). Data access was granted by the Department of Human Services (Approval Number MI5399).
Results
Cohort characteristics
We identified 519,999 long-term concessional beneficiaries in the period 2007–2015, 269,237 (51.8%) of whom were dispensed at least one psychotropic medication. Of these, 28.5% were aged 18–49 years, 27.4% were aged 50–69 years and 44.0% were aged 70 years and over; 61% were female.
All psychotropic medicines
We observed a 2.6% relative increase in the annual prevalence of any psychotropic medication use over the study period (from 352.4 to 361.6/1000). Conversely, annual incidence decreased by 26.1% (from 85.4 to 63.1/1000).
Hereafter, we discuss individual psychotropic classes and subclasses. Changes in all metrics for all classes and subclasses of psychotropics between 2007 and 2015 are summarized in Figure 1 (ratio of 2015:2007) and Table S2 (relative changes). In the subsequent text, we refer to relative changes.
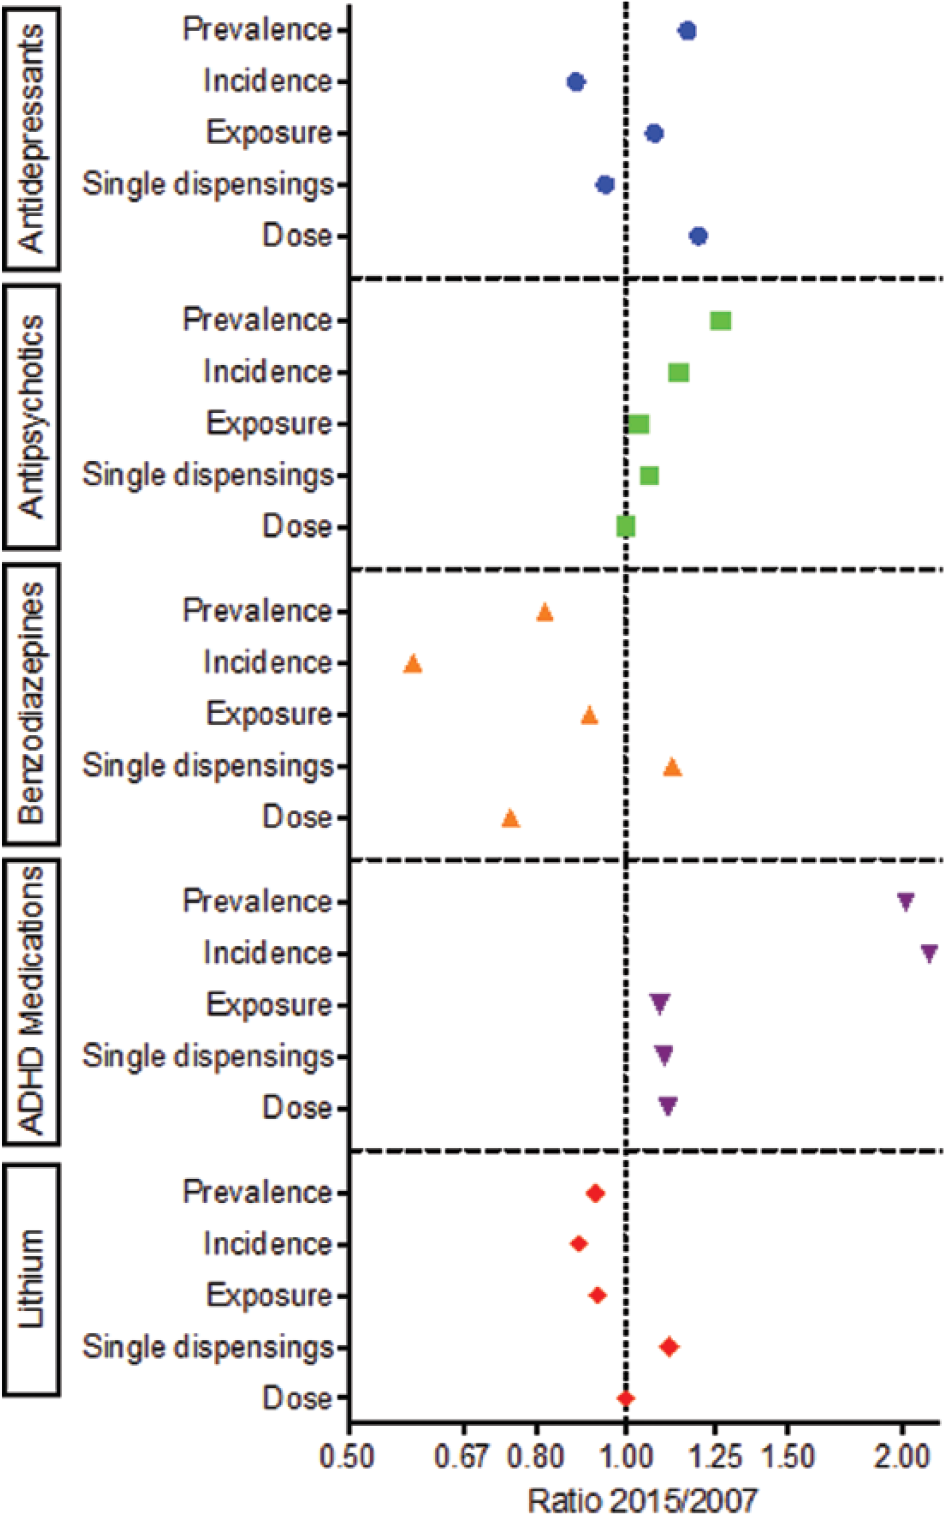
Changes in study metrics of psychotropic medication use from 2007 to 2015 expressed as a ratio of 2015:2007. Incidence and prevalence are expressed per 1000 in the population, exposure is median annual exposure, single dispensings is the number of individuals with a single dispensing as a proportion of people with any dispensing of that class and dose is median DDD per person per year. Note the logarithmic scale.
Antidepressants
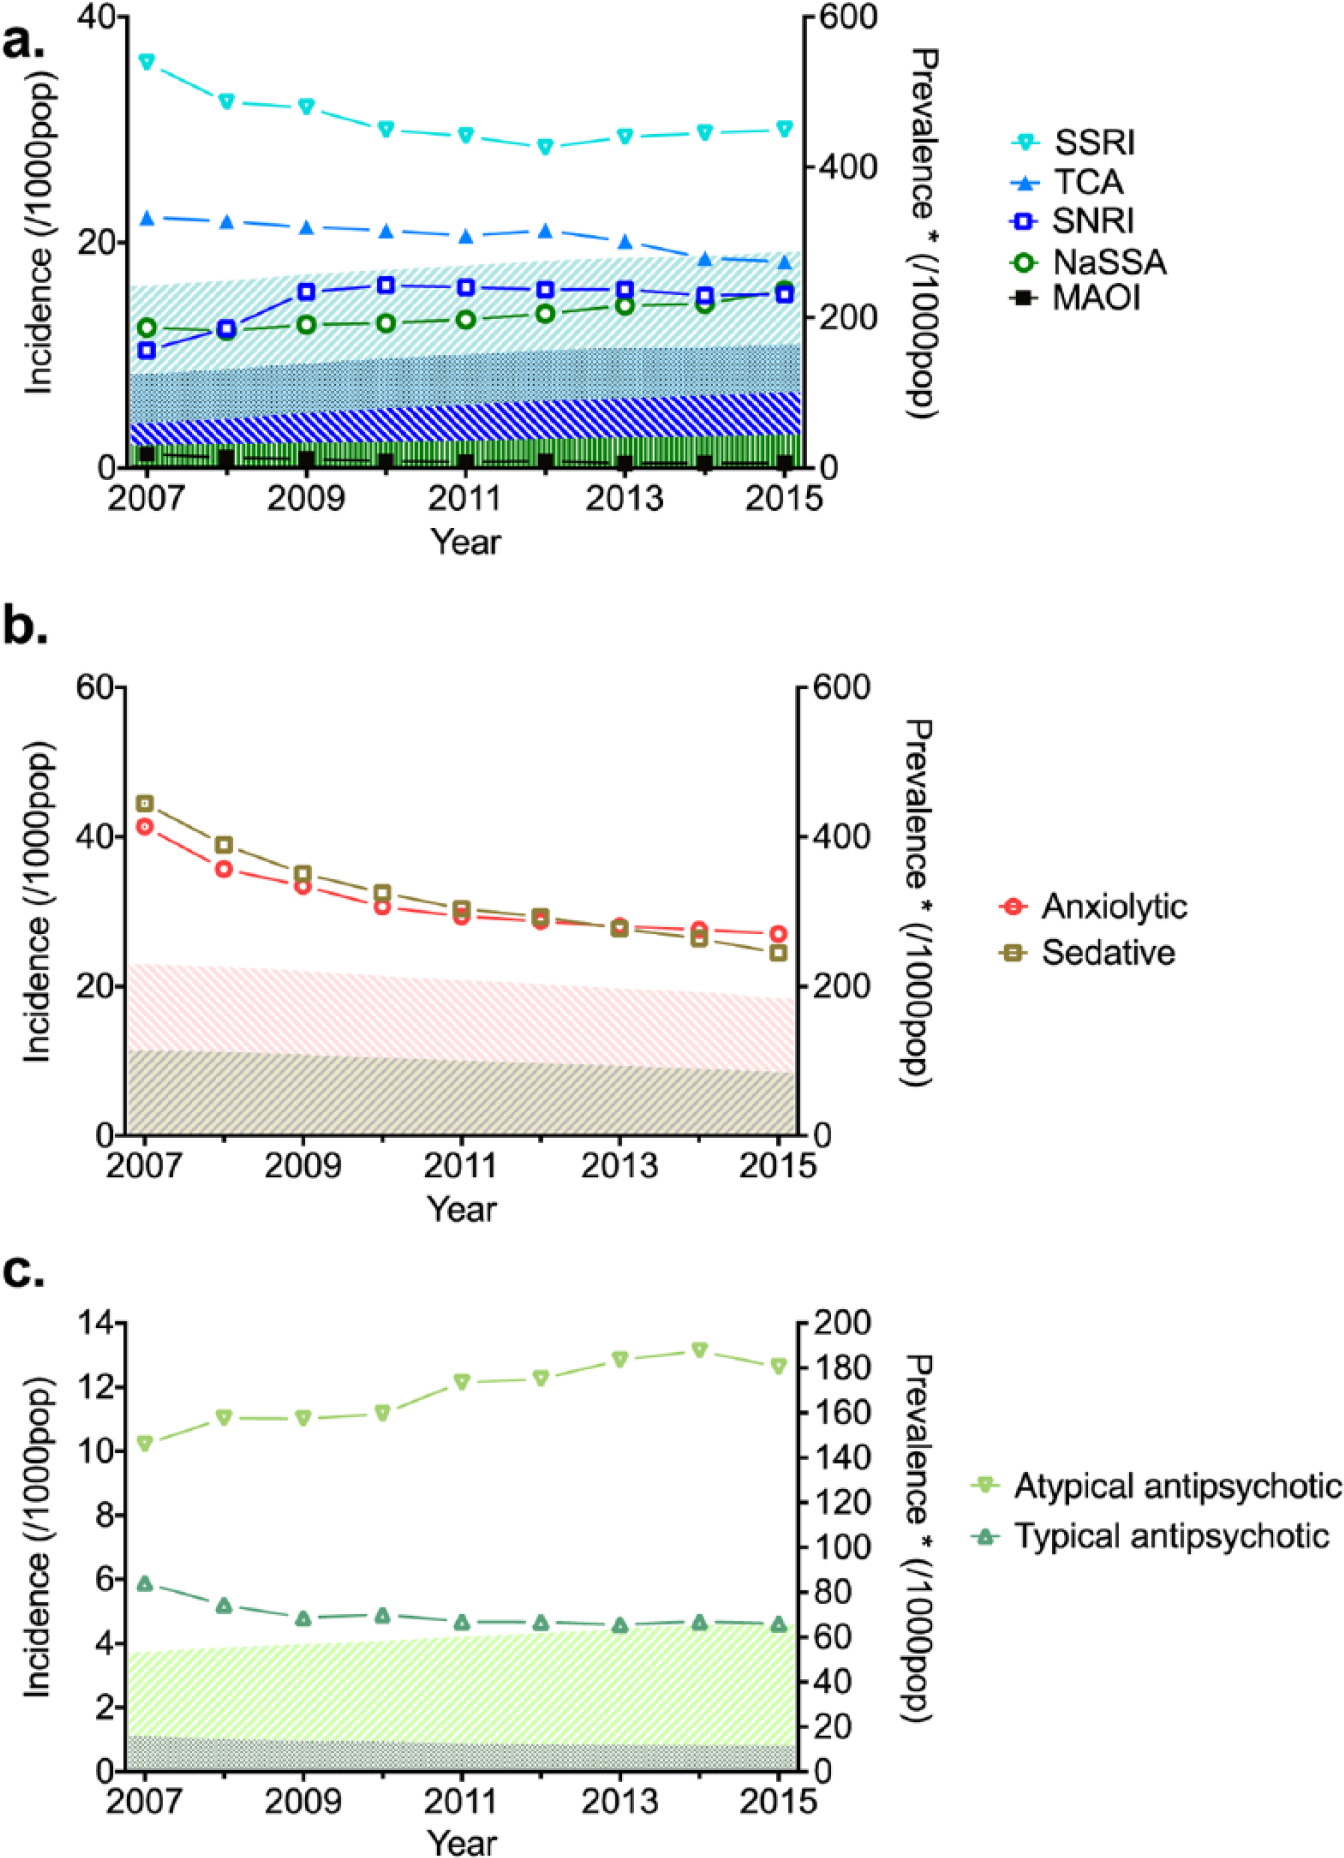
Between 2007 and 2015, the annual incidence of antidepressant use decreased by 11.6% (from 57.4 to 50.7/1000), the primary driver being fewer people initiating treatment with selective serotonin reuptake inhibitors (SSRIs) and tricyclic antidepressants (TCAs) (6.6% and 17.6%, respectively; Figure 2(a)). Conversely, prevalence increased by 16.8% (from 215.5 to 251.7/1000; Figure 2(a)) driven by increasing use of serotonin noradrenaline reuptake inhibitors and noradrenaline reuptake inhibitors (SNRIs/NRIs) and noradrenergic and specific serotonergic antidepressants (NaSSAs), where we observed relative increases of 92.5% and 61.0%, respectively (Figure 3(a)). By 2015, the incidence and prevalence of use were highest for the TCA amitriptyline, which accounted for 18.1% and 53.8% of incident and prevalent antidepressant use, respectively.
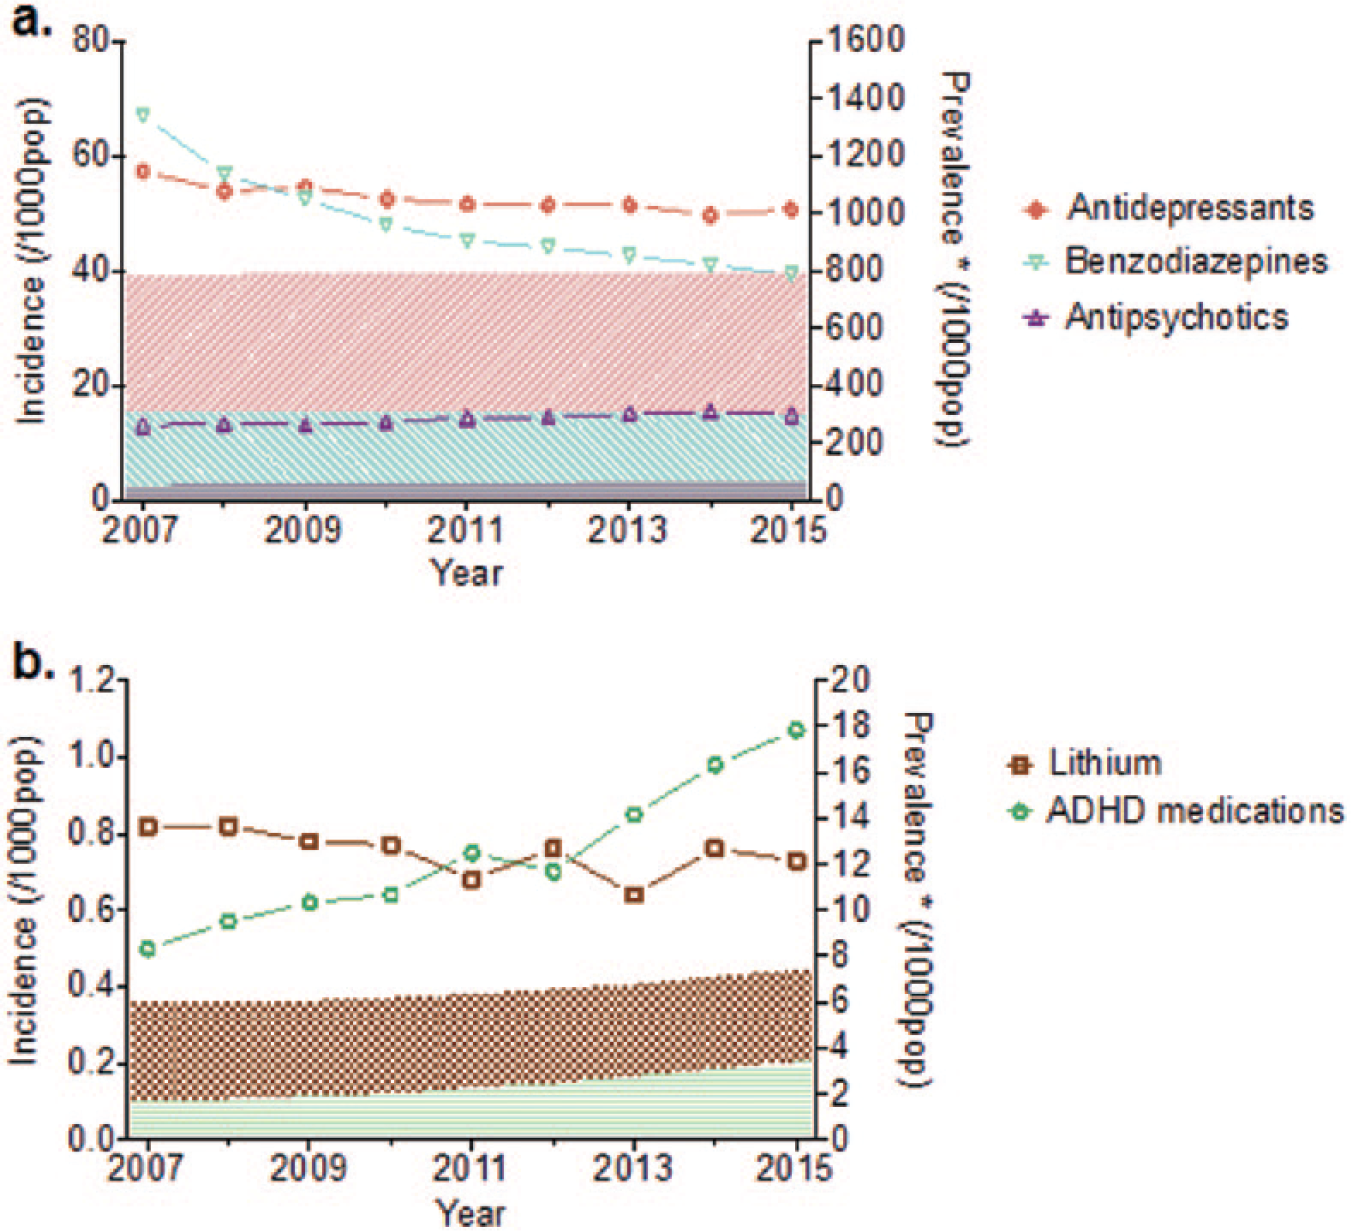
Incidence (line) and prevalence (shaded area) of psychotropic medication use by year. a) Antidepressants, benzodiazepines and antipsychotics and b) lithium and ADHD medications.
Incidence (line) and prevalence (shaded area) of psychotropic medication use by year. a) Antidepressants b) benzodiazepines c) antipsychotics.
Over the study period, there was a 7% relative increase in the median annual duration of exposure (from 242 to 260 days; Figure 4(a)). We observed little change in the proportion of individuals with single dispensings of antidepressants over the study period. In 2015, the proportion of individuals with a single dispensing was highest for TCAs (23.3%), predominantly single amitriptyline dispensings (26.5%). We also observed a 20% relative increase in median DDD/p/y for all antidepressants.
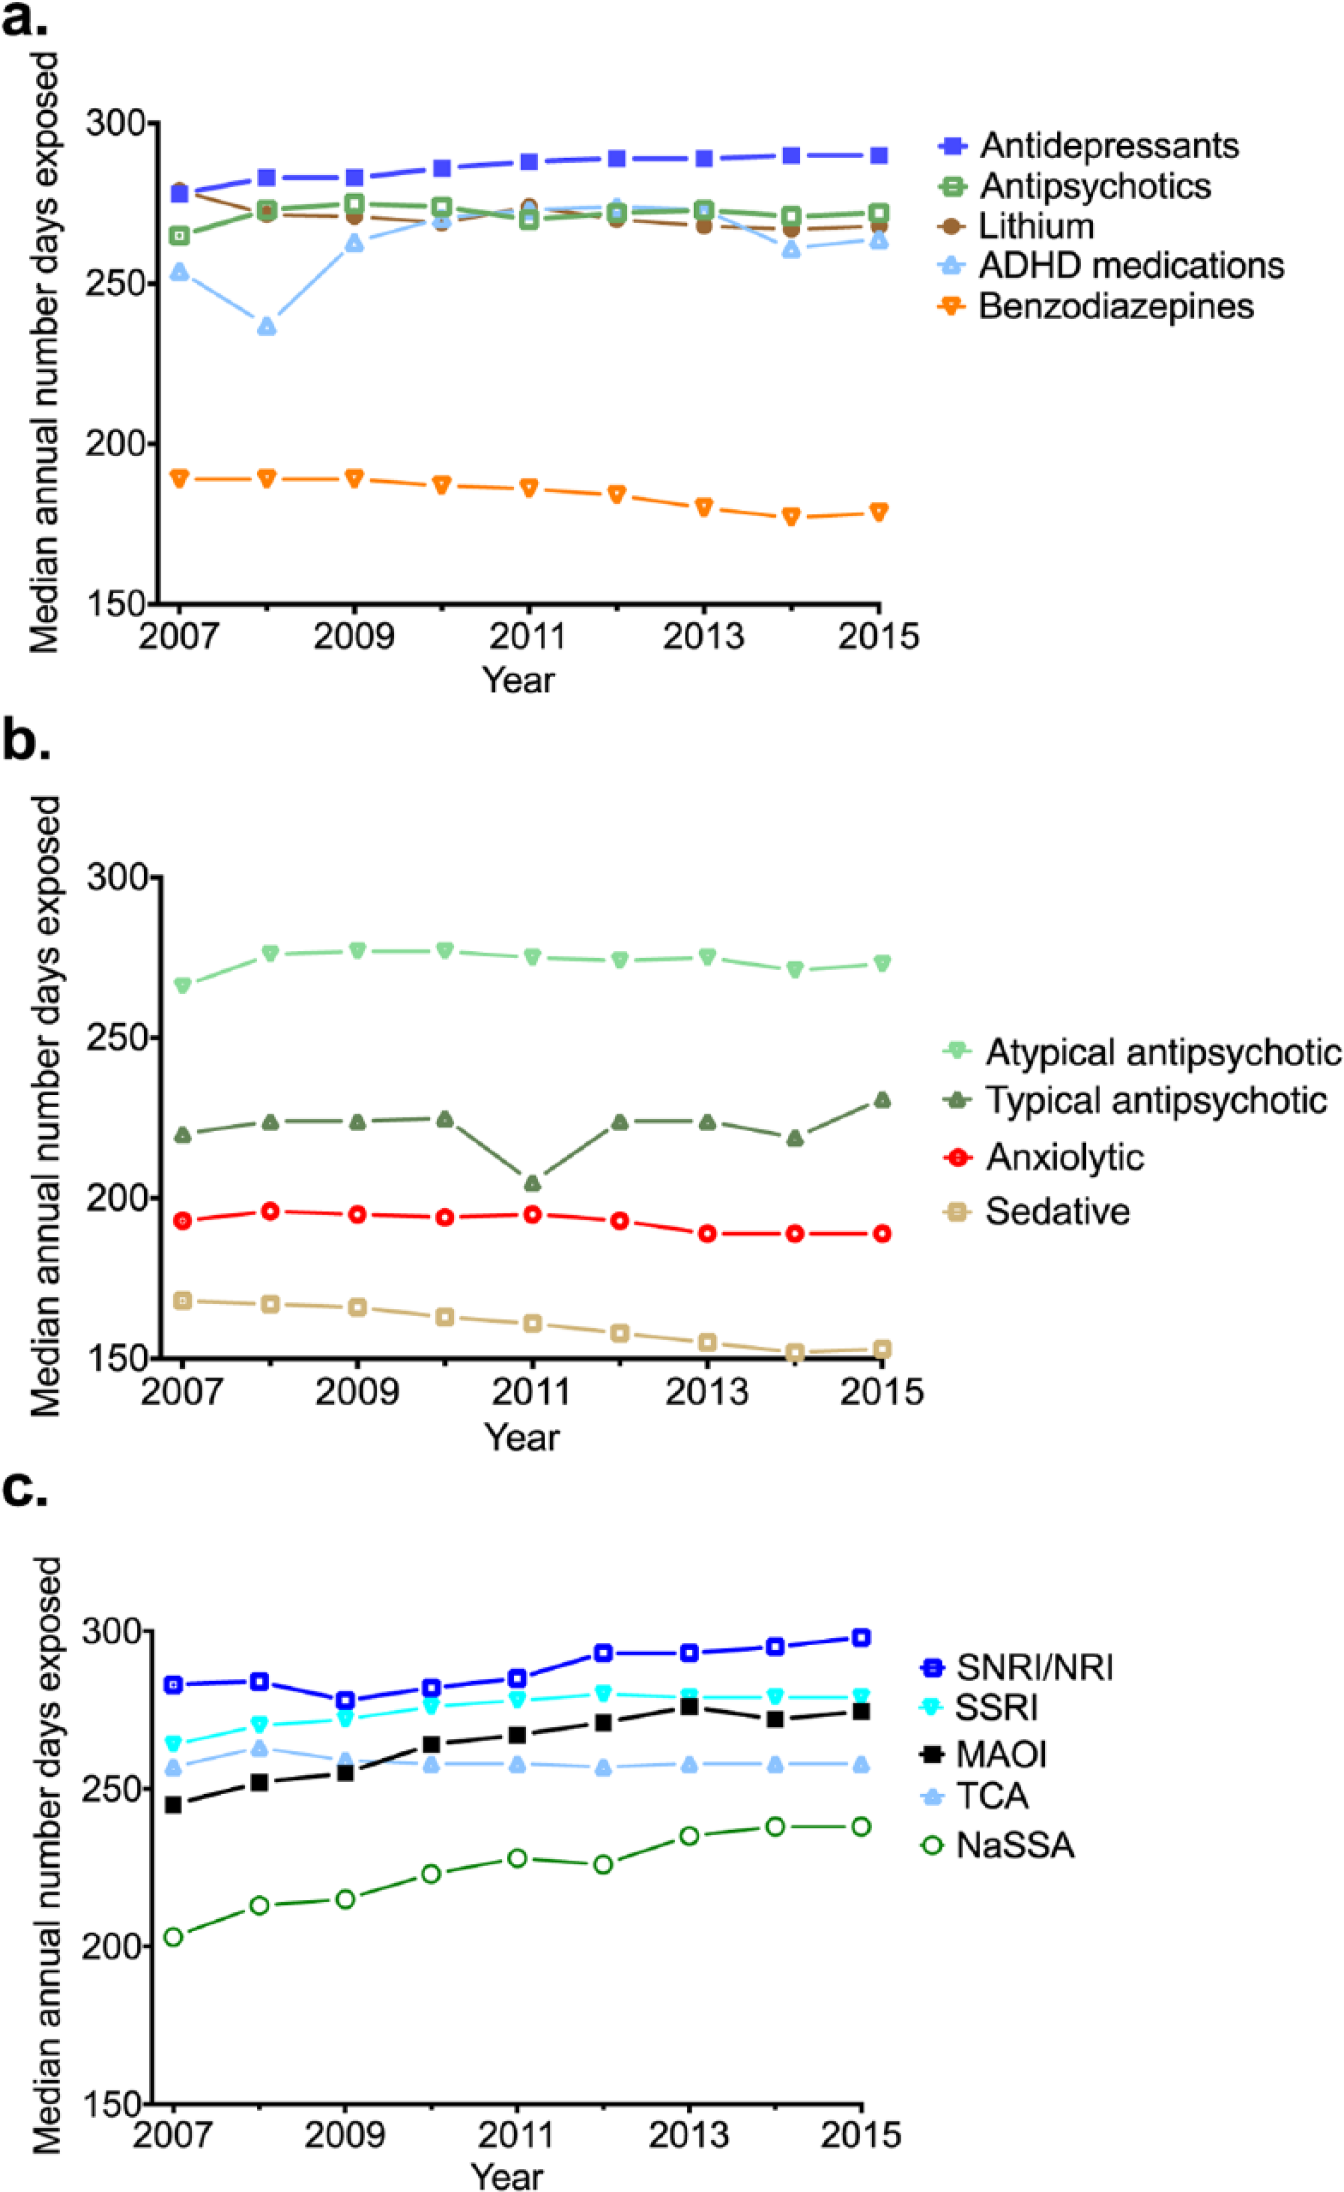
Median annual duration of exposure to psychotropic medications. a) By class b) antipsychotic and benzodiazepine subclasses c) antidepressant subclasses.
Benzodiazepines
Annual benzodiazepine incidence and prevalence decreased by 41.2% (from 67.1 to 39.4/1000) and 18.2% (from 202.7 to 165.7/1000), respectively, over the study period (Figure 2(a)).
Despite a decreasing incidence and prevalence of temazepam use over the study period (23.1% and 44.2%, respectively), this medicine still had the highest prevalence and incidence of all benzodiazepines by 2015.
From 2007 to 2015, there was a relative decrease of 9% in the annual duration of exposure (Figure 4(a)). Long-term use (i.e. the proportion of individuals with >240 exposed days) was present in 26.5% and 23.6% of those dispensed benzodiazepines in 2007 and 2015, respectively (Figure S1b). There was little change in the proportion of individuals with single dispensings of benzodiazepines over the study period. In 2015, 35.7% of individuals dispensed benzodiazepines had a single dispensing, the highest proportion of any psychotropic medicine class. Between 2007 and 2015, there was a 25% decrease in DDD/p/y for benzodiazepines overall.
Antipsychotics
Overall, we observed a 14.2% relative increase in incidence (13.2 to 15.0/1000) and a 26.8% relative increase in the annual prevalence of antipsychotics (from 48.7 to 61.3/1000; Figure 2(a)). For typical antipsychotics, there was a 21.6% relative decrease in incidence and a 27.4% relative decrease in prevalence, while atypical antipsychotics increased both in incidence (23.6%) and in prevalence (44.7%) (Figure 3(c)). Of the antipsychotic medications, quetiapine dispensings increased the most over the study period; incidence increased by 112.2% and prevalence increased by 172.6%; by 2015, quetiapine had the highest incidence and prevalence of all antipsychotics dispensed.
Over the study period, there was little change in the median annual duration of exposure for antipsychotics overall (Figure 4(a)). We observed a decline in median annual duration of exposure for typical antipsychotics in 2011, returning to 2010 levels in 2012 (Figure 4(b)). There was an increase in the proportion of individuals with single dispensings of atypical (23.4%) and typical (15.8%) antipsychotics over the study period. In 2015, single dispensings of typical antipsychotics were present in 31.7% of those dispensed such medicine, mainly attributable to single haloperidol dispensings (47.5%). Single dispensings of atypical antipsychotics were lower at 11.8%. There was little change in the median DDD/p/y over the study period for antipsychotics overall but a decrease of 13.6% for atypical antipsychotics.
ADHD medications
The relative increases in annual incidence and prevalence of ADHD medication use were 114.0% (from 0.1 to 1.1/1000) and 101.8% (from 1.7 to 3.4/1000), respectively (Figure 2(b)). In 2015, dexamphetamine was the most prevalent dispensed ADHD medication, while incident (new) use was highest for methylphenidate.
Over the study period, we observed a 9% increase in the median annual duration of exposure for ADHD medications, with a transient decline in 2008 (Figure 4(a)). In 2015, 12.1% of individuals had a single dispensing of an ADHD medication, rising from 11.0% in 2007. Over the study period, the median DDD/p/y increased relatively by 11%.
Lithium
We observed an 11.0% relative decrease in incidence (from 0.8 to 0.7/1000) and a 7.2% relative decrease in annual prevalence (from 4.3 to 4.0/1000) in lithium use over the study period (Figure 2(b)). There was also a relative decrease in median annual duration of exposure for lithium by 6.7%. In 2015, 16.4% of those dispensed lithium had a single dispensing, up from 14.7% in 2007. There was no change in DDD/p/y over the study period.
Sensitivity analysis
Finally, the results of our sensitivity analysis suggested that using P90 as the EPE instead of P75 made little difference to the proportion of individuals with only a single dispensing. However, the sensitivity of annual duration of exposure to EPE varied by medication class, with benzodiazepines being most sensitive to changes in EPE (Table S3).
Discussion
This study is the first to use contemporary longitudinal data to quantify individual-level changes in psychotropic medication use in the Australian adult population. Longer durations of treatment rather than new use appeared to contribute to increasing annual prevalence of antidepressant use, and on average, higher doses are being used. Single dispensings of haloperidol and amitriptyline may be related to off-label use for indications where evidence of risks and benefits is lacking, such as behavioural disturbances in dementia and insomnia. Of the antipsychotics, quetiapine use increased most over the study period, and by 2015, it had the highest incidence and prevalence of all antipsychotics. We observed a decrease in dispensing of benzodiazepines, which appears to be related to a decline in new use, rather than prevalent use, as well as a decrease in the median dose per person. However, around a quarter of individuals dispensed a benzodiazepine received long-term treatment, and we detected little change in this figure over the study period.
The observation that increasing durations of treatment rather than new use is likely to be driving increases in the prevalence of antidepressant use is consistent with previous studies (Mars et al., 2016). Increasing durations of therapy may be the result of improved patient adherence and increasing clinician awareness about the importance of long-term treatment. For antidepressants, treatment guidelines suggest 6–12 months of treatment for persons experiencing a single episode of depression, but long-term treatment (3–5 years) for recurrent episodes (Therapeutic Guidelines Limited, 2013). However, recent international studies indicate trends toward longer durations of treatment (average of 4–5 years) and suggest that some of this may represent overuse (Johnson et al., 2012; Kjosavik et al., 2015). Increases in the median annual dose used for antidepressants over the study period also warrant further investigation as there are concerns from within the medical community about antidepressant dose escalations for those who have failed to respond to standard doses despite a lack of supporting evidence (Jureidini and Tonkin, 2006).
Increases in the volume of use of amitriptyline over the past decade have been documented and have been found in other studies to primarily relate to increases in the use of the 10-mg formulation for chronic pain and insomnia (Mars et al., 2016; Stephenson et al., 2013; Wong et al., 2017). While guidelines support use in chronic pain (Faculty of Pain Medicine, Australia New Zealand College of Anaesthetists, 2015), evidence for use in insomnia is lacking.
In line with their position as the first-line recommended treatment for depressive and anxiety disorders (Therapeutic Guidelines Limited, 2013), SSRIs are still the most prevalent antidepressant subclass dispensed. However, new use declined during the study period. This is in contrast to increases in new and existing use of SNRIs, which are typically recommended as second-line treatments for depression and anxiety. This increase in new use corresponded to duloxetine and desvenlafaxine becoming PBS funded in 2008 and 2009, respectively (Table S4). The growth in SNRI use has been noted in other studies (Karanges et al., 2014) and warrants further investigation as it may reflect the increasing use of this subclass as first-line therapy for depression and anxiety, despite the superior safety profile of many SSRIs.
Decreases in benzodiazepine use described here are consistent with previous Australian studies (Hollingworth and Siskind, 2010; Stephenson et al., 2013), and greater decreases in incidence than prevalence imply a decrease in new over existing use. Indications that average dosages are decreasing are also reassuring, given the dose–response relationship observed for benzodiazepine-related adverse events such as hip fractures in the elderly (Zint et al., 2010). Treatment guidelines generally recommend that benzodiazepines are used only for short-term treatment (approximately 2 weeks, equating to one dispensing) due to the risk of physical dependence (Therapeutic Guidelines Limited, 2013). Despite guidelines advising against this practice, we found around a quarter of people dispensed a benzodiazepine had long-term use with little change over the study period. As such, an established population of people accessing benzodiazepines for long-term use may be impeding the appropriate use of this medicine.
The proportion of individuals receiving single dispensings of amitriptyline and haloperidol were notably higher than other medications. This may represent poor tolerance of these medications; however, short-term use of antidepressants (Sihvo et al., 2008) and antipsychotics (Hartung et al., 2008) has been associated with use for off-label indications that lack a firm evidence base such as insomnia (McKean and Monasterio, 2012; Sihvo et al., 2008). Further investigation into the prescribing indications for amitriptyline and haloperidol and correlation with the supporting evidence for these indications would assist in quantifying the extent of any poorly evidence-based prescribing practices.
The use of atypical antipsychotics, in particular quetiapine, increased considerably over the study period. Therapeutic Goods Administration (TGA) indications for extended-release quetiapine were expanded to include treatment-resistant depression and generalized anxiety disorder in 2010, and this may account for some of this increase. However, studies have demonstrated that of all the antipsychotics, quetiapine is the most frequently used off-label to treat conditions such as insomnia and post-traumatic stress disorder (McKean and Monasterio, 2012) and has been flagged as the most concerning in terms of lack of evidence to support these indications and potential to cause harm (Walton et al., 2008). Further investigation into the causes of this prescribing behaviour may help to improve the appropriate use of quetiapine.
The temporary decline in annual duration of exposure to typical antipsychotics in 2011 was likely caused by a reduction in the supply of zuclopenthixol, a long-acting depot formulation, related to the withdrawal of PBS subsidy (PBS, 2011).
We observed marked increases in new and prevalent use of ADHD medications among adults over the study years. This is consistent with previously described global (Karlstad et al., 2016) and Australian (Stephenson et al., 2013) trends. The temporary reduction in annual duration of exposure to ADHD medications in 2008 may have been the result of switching from dexamphetamine to methylphenidate as methylphenidate use was on the rise and dexamphetamine use was falling in 2008 according to publicly available volume metrics (PBS, 2016). Increases in the prevalence and incidence of these medications are in keeping with rising recognition that ADHD can persist or even emerge in adulthood (Agnew-Blais et al., 2016; Faraone et al., 2006). However, the prevalence of ADHD medication use in 2015 (0.34%) was still much lower than the estimated prevalence of adult ADHD in Australia (1.1% to 2.7%) (Ebejer et al., 2012) and other Western countries (3.6%) (Fayyad et al., 2016). The decrease in incidence, prevalence and annual duration of exposure to lithium may reflect an increasing preference for anticonvulsants and atypical antipsychotics over lithium for the long-term management of bipolar disorder.
Strengths and limitations
This study is one of the first in Australia to use current person-level data to explore how psychotropic use is changing over a 9-year period. The purpose of this paper was to provide an overview of psychotropic use to highlight areas of concern for further exploration. However, studies of this kind are subject to a number of limitations.
First, only subsidized medications are captured within this study. This may be an issue for benzodiazepines where unrecorded private prescribing accounts for up to 10% of all prescriptions (Hollingworth and Siskind, 2010). Similarly, benzodiazepine-like Z-drugs were not included in this analysis but only account for a small proportion of hypnotic dispensings (Stephenson et al., 2013). Change in medicines use related to switching to newly registered medicines that have not yet attracted a PBS subsidy would also not be captured within this study. This may be an issue for antidepressants and antipsychotics. While restricting the study cohort to concessional beneficiaries enabled us to follow people with complete PBS dispensing histories, it limits the generalizability of our findings to the entire Australian population as concessional beneficiaries tend to be a population comprising older people and people with disabilities and lower income. Second, we defined incident use based on a 1-year medication-free period for the medicine of interest. While a commonly applied method in pharmacoepidemiology, this relatively short time period might result in misclassification of previous use as new use which is more likely to be an issue for medications with intermittent dispensings such as benzodiazepines (Blanch et al., 2015; Gardarsdottir et al., 2006).
Third, the use of DDD as a proxy of psychotropic dose is limited because of significant variability in daily doses of psychotropics used that often deviate from their designated DDD (Islam et al., 2014). However, it was necessary to use a standardized measure in order to combine dose information at the levels of subclass, class and all psychotropics, and while the absolute value of median DDD/p/y may have little meaning, it remains an effective metric to measure changes in average dosage with time. Finally, due to data limitations, our medication exposure definitions were based on the EPE following a single dispensing, a population-based approximation of actual periods of exposure following a single dispensing of a medication. Annual durations of exposure are sensitive to changes in this value, but this should not affect any trends seen over time.
Conclusion
Our findings indicate that over the study period, the duration of use and dose of antidepressants being used have increased, some of which could represent inappropriate use. Intermittent use of amitriptyline and haloperidol was frequent, possibly suggesting off-label use for indications such as insomnia where the risks and benefits are unclear. Finally, despite reductions in new and existing use of benzodiazepines, there has been little change in long-term use. These findings warrant further investigation as they bring into question the quality of psychotropic medication use.
Footnotes
Acknowledgements
The authors thank the Department of Human Services for providing the data.
Declaration of Conflicting Interests
The author(s) declared no potential conflicts of interest with respect to the research, authorship and/or publication of this article.
Funding
This research was supported by the National Health and Medical Research Council (NHMRC) Centre for Research Excellence in Medicines and Ageing (CREMA) and funding from the University of Sydney BMRI SPARC Implementation Scheme (2015–2016). Jonathan Brett and Benjamin Daniels acknowledge funding support from the NHMRC Postgraduate award, and Emily Karanges is supported by a postdoctoral fellowship from CREMA.
References
Supplementary Material
Please find the following supplemental material available below.
For Open Access articles published under a Creative Commons License, all supplemental material carries the same license as the article it is associated with.
For non-Open Access articles published, all supplemental material carries a non-exclusive license, and permission requests for re-use of supplemental material or any part of supplemental material shall be sent directly to the copyright owner as specified in the copyright notice associated with the article.