
Abstract
Objective:
This study examined longitudinal trends in the dispensing of psychotropic medications in Australia from January 2000 to December 2011.
Method:
Dispensing data for the major classes of psychotropic medications (antidepressants, anxiolytics, sedatives, antipsychotics, mood stabilisers and attention-deficit hyperactivity disorder (ADHD) medications) were obtained from the Drug Utilisation Sub-Committee of the Australian Department of Health and Ageing. Results were expressed in terms of defined daily doses/1000 population/day (DDDs/1000/day).
Results:
There was a 58.2% increase in the dispensing of psychotropic drugs in Australia from 2000 to 2011, driven by major increases in antidepressants (95.3% increase in DDDs/1000/day), atypical antipsychotics (217.7% increase) and ADHD medications (72.9% increase). Dispensing of anxiolytics remained largely unchanged, while sedatives and typical antipsychotics decreased by 26.4% and 61.2%, respectively. Lithium dispensing remained static while valproate and lamotrigine increased markedly. In 2011, antidepressants accounted for 66.9% of total psychotropic DDDs/1000/day totals, far greater than anxiolytics (11.4%), antipsychotics (7.3%), mood stabilisers (5.8%), sedatives (5.5%), or ADHD medications (3.0%). Sertraline, olanzapine, valproate and methylphenidate were the most frequently dispensed antidepressant, antipsychotic, mood stabiliser and ADHD medication, respectively, while diazepam and temazepam were the most commonly dispensed anxiolytic and sedative.
Conclusions:
Psychotropic utilisation markedly increased in Australia between 2000 and 2011. Some potential concerns include: (1) the continuing high use of benzodiazepines, particularly alprazolam, despite their problematic effects; (2) the rapid increase in serotonin noradrenaline reuptake inhibitor (SNRI) use, given their more complex side-effect profile relative to selective serotonin reuptake inhibitors (SSRIs); and (3) the dramatic increase in antidepressant prescriptions despite questions about the efficacy of these drugs in mild to moderate depression. Finally, some limitations are identified regarding use of the DDDs/1000/day metric, which can distort estimates of utilisation of specific drugs when the defined daily dose is higher or lower than the formulation most commonly dispensed by pharmacies.
Introduction
Psychotropic medications are among the most widely prescribed drugs in Australia and worldwide (Britt et al., 2011). These drugs can be subdivided into six main categories: antidepressants, anxiolytics, sedatives, antipsychotics, mood stabilisers and attention-deficit hyperactivity disorder (ADHD) medications. The use of specific psychotropic drugs is usually justified by the outcomes of large-scale clinical trials leading to regulatory approval and governmental subsidy. However, questions have arisen in recent years about the efficacy and/or tolerability of many of these drugs (Karanges and McGregor, 2011; Lader et al., 2009; Mackin and Thomas, 2011).
Antidepressants are the most commonly prescribed psychotropic drugs, yet studies suggest that they may have only marginal benefit over placebo in mild to moderate depression (Fournier et al., 2010) and may have paradoxical psychiatric side effects, particularly in children and young adults (Karanges and McGregor, 2011). The benzodiazepines have dominated treatment of anxiety and insomnia for decades, yet their addictive properties are now well established (Lader et al., 2009). Commonly used atypical antipsychotics cause significant weight gain and metabolic syndrome in many users (Komossa et al., 2010). Large-scale studies have also shown little, if any, clinical superiority of the atypical antipsychotics relative to the earlier first-generation antipsychotics (Mackin and Thomas, 2011).
Despite these problems, the available array of medications has changed little in the last 10 years and is unlikely to change greatly in the near future. The recent exodus of the large pharmaceutical companies from central nervous system (CNS) drug development and the stalled pipeline in psychopharmacological drug discovery (Schoepp, 2011) reflects our relatively poor understanding of the underlying aetiology of psychiatric disorders and the resistance of these invariably complex disorders to pharmacological ‘quick fixes’. Over the past decade there have been few, if any, breakthroughs: only the antidepressant agomelatine stands out, and even then its efficacy is debatable (Hickie and Rogers, 2011; Smith, 2012). Other ostensibly ‘new’ drugs (e.g. paliperidone, desvenlafaxine) are active metabolites of existing psychotropics, allowing for low research and development costs at the expense of scientific innovation. Despite marketing claims to the contrary, the result is at best a marginal improvement in efficacy (Schoepp, 2011).
Against this backdrop one might expect a more cautious approach to psychotropic prescribing, particularly considering the increased interest in, and subsidy of, non-pharmacological interventions for depression and anxiety (e.g. cognitive behaviour therapy, exercise and dietary manipulations). Surprisingly then, it appears that psychotropic drug use is escalating dramatically in many countries of the world. The prescription of psychotropics in the UK increased by 6.8% each year between 1998 and 2010, with antidepressant prescriptions alone increasing by 10% per year (Ilyas and Moncrieff, 2012). In the USA, antidepressant use doubled from 1996 to 2005 (Olfson and Marcus, 2009); antipsychotic treatment visits nearly tripled (Alexander et al., 2011); and the proportion of children in the population on ADHD medication increased from 2.4% to 3.5% (Zuvekas and Vitiello, 2012).
These increases in psychotropic prescribing may, at least in part, arise from evolving clinical guidelines and the creation of new diagnostic categories. Selective serotonin reuptake inhibitor (SSRI) antidepressants rather than benzodiazepines have become first-line in the treatment of generalised anxiety disorders, panic attacks, agoraphobia and post-traumatic stress disorder (Bandelow et al., 2012). Widening use of atypical antipsychotics is linked to expanded regulatory approval for indications outside psychosis and increasing off-label use; these drugs are now commonly used for depression, bipolar disorder, ADHD, autism, dementia, and anxiety disorders (Alexander et al., 2011). Escalations in anticonvulsant use can be partially attributed to their increased utilisation in bipolar disorder (Greil et al., 2012), the diagnosis of which has increased in recent years (Moreno et al., 2007). Finally, polypharmacy with psychotropics is now more prevalent in both adults and children despite little systematic evidence supporting this practice (Comer et al., 2010; Mojtabai and Olfson, 2010).
To our knowledge, the last comprehensive analysis of longitudinal trends in psychotropic prescribing in the general Australian population was conducted in 1987 (Mant et al., 1987). Hollingworth and colleagues have subsequently published a series of papers examining the dispensing of various individual classes of psychotropic drugs in Australia between 2002 and 2007. Across this interval, antidepressant dispensing increased by 41% (Hollingworth et al., 2010a), atypical antipsychotics by 16% (Hollingworth et al., 2010b), anxiolytics/sedatives by 1.47% (Hollingworth and Siskind, 2010) and ADHD medications by 87% (the latter between 2002 and 2009) (Hollingworth et al., 2011). The current study extends on these findings by considering trends (a) over a wider time interval including the last 4 years; (b) in all classes of psychotropics, including mood stabilisers, within a single snapshot; and (c) in subclasses of antidepressants (SSRI versus serotonin noradrenaline reuptake inhibitor (SNRI) versus tricyclic etc.) and antipsychotics (atypical versus typical).
Methods
Data and data analysis
This study utilised the dispensing database maintained by the Drug Utilisation Sub-Committee (DUSC) to examine changing trends in psychotropic use over a 12-year period (January 2000 – December 2011). The DUSC database combines data on prescriptions subsidised under the Pharmaceutical Benefits Scheme (PBS) and Repatriation PBS (RPBS) with estimates of non-subsidised prescriptions from a survey of 370 community pharmacies in Australia. Thus, the DUSC dispensing database has a number of advantages over the database provided online by the PBS, capturing (a) prescriptions for which the averaged dispensed price is below the patient co-payment threshold (as occurs with many of the older and cheaper psychotropics); (b) drugs that are not subsidised by the PBS (including lamotrigine, zolpidem, lorazepam, triazolam, clobazam, chloral hydrate and trimipramine); and (c) prescriptions dispensed privately in the Australian community. One limitation, however, is that the DUSC database does not capture inpatient prescriptions in public hospitals.
Data for the quantity of each drug dispensed was standardised using the defined daily dose per 1000 of population per day metric (DDDs/1000/day) using Australian Bureau of Statistics population data. The defined daily dose (DDD) was established by the World Health Organization (WHO) Collaborating Centre for Drug Statistics Methodology (World Health Organization, 2011) and corresponds to an estimated mean daily dose of the drug when used for its main indication in adults. It allows for simple comparisons of drug use across countries and across different formulations of the drug (these are shown for each drug in Table 1). The DDD was obtained for all psychotropic drugs with an anatomical therapeutic chemical (ATC) code in the following groups: antidepressants, anxiolytics, sedatives, antipsychotics, mood stabilisers and ADHD medications.
Defined daily doses (DDD) for each of the psychotropic medications (with corresponding anatomical therapeutic chemical (ATC) code) considered in the study.
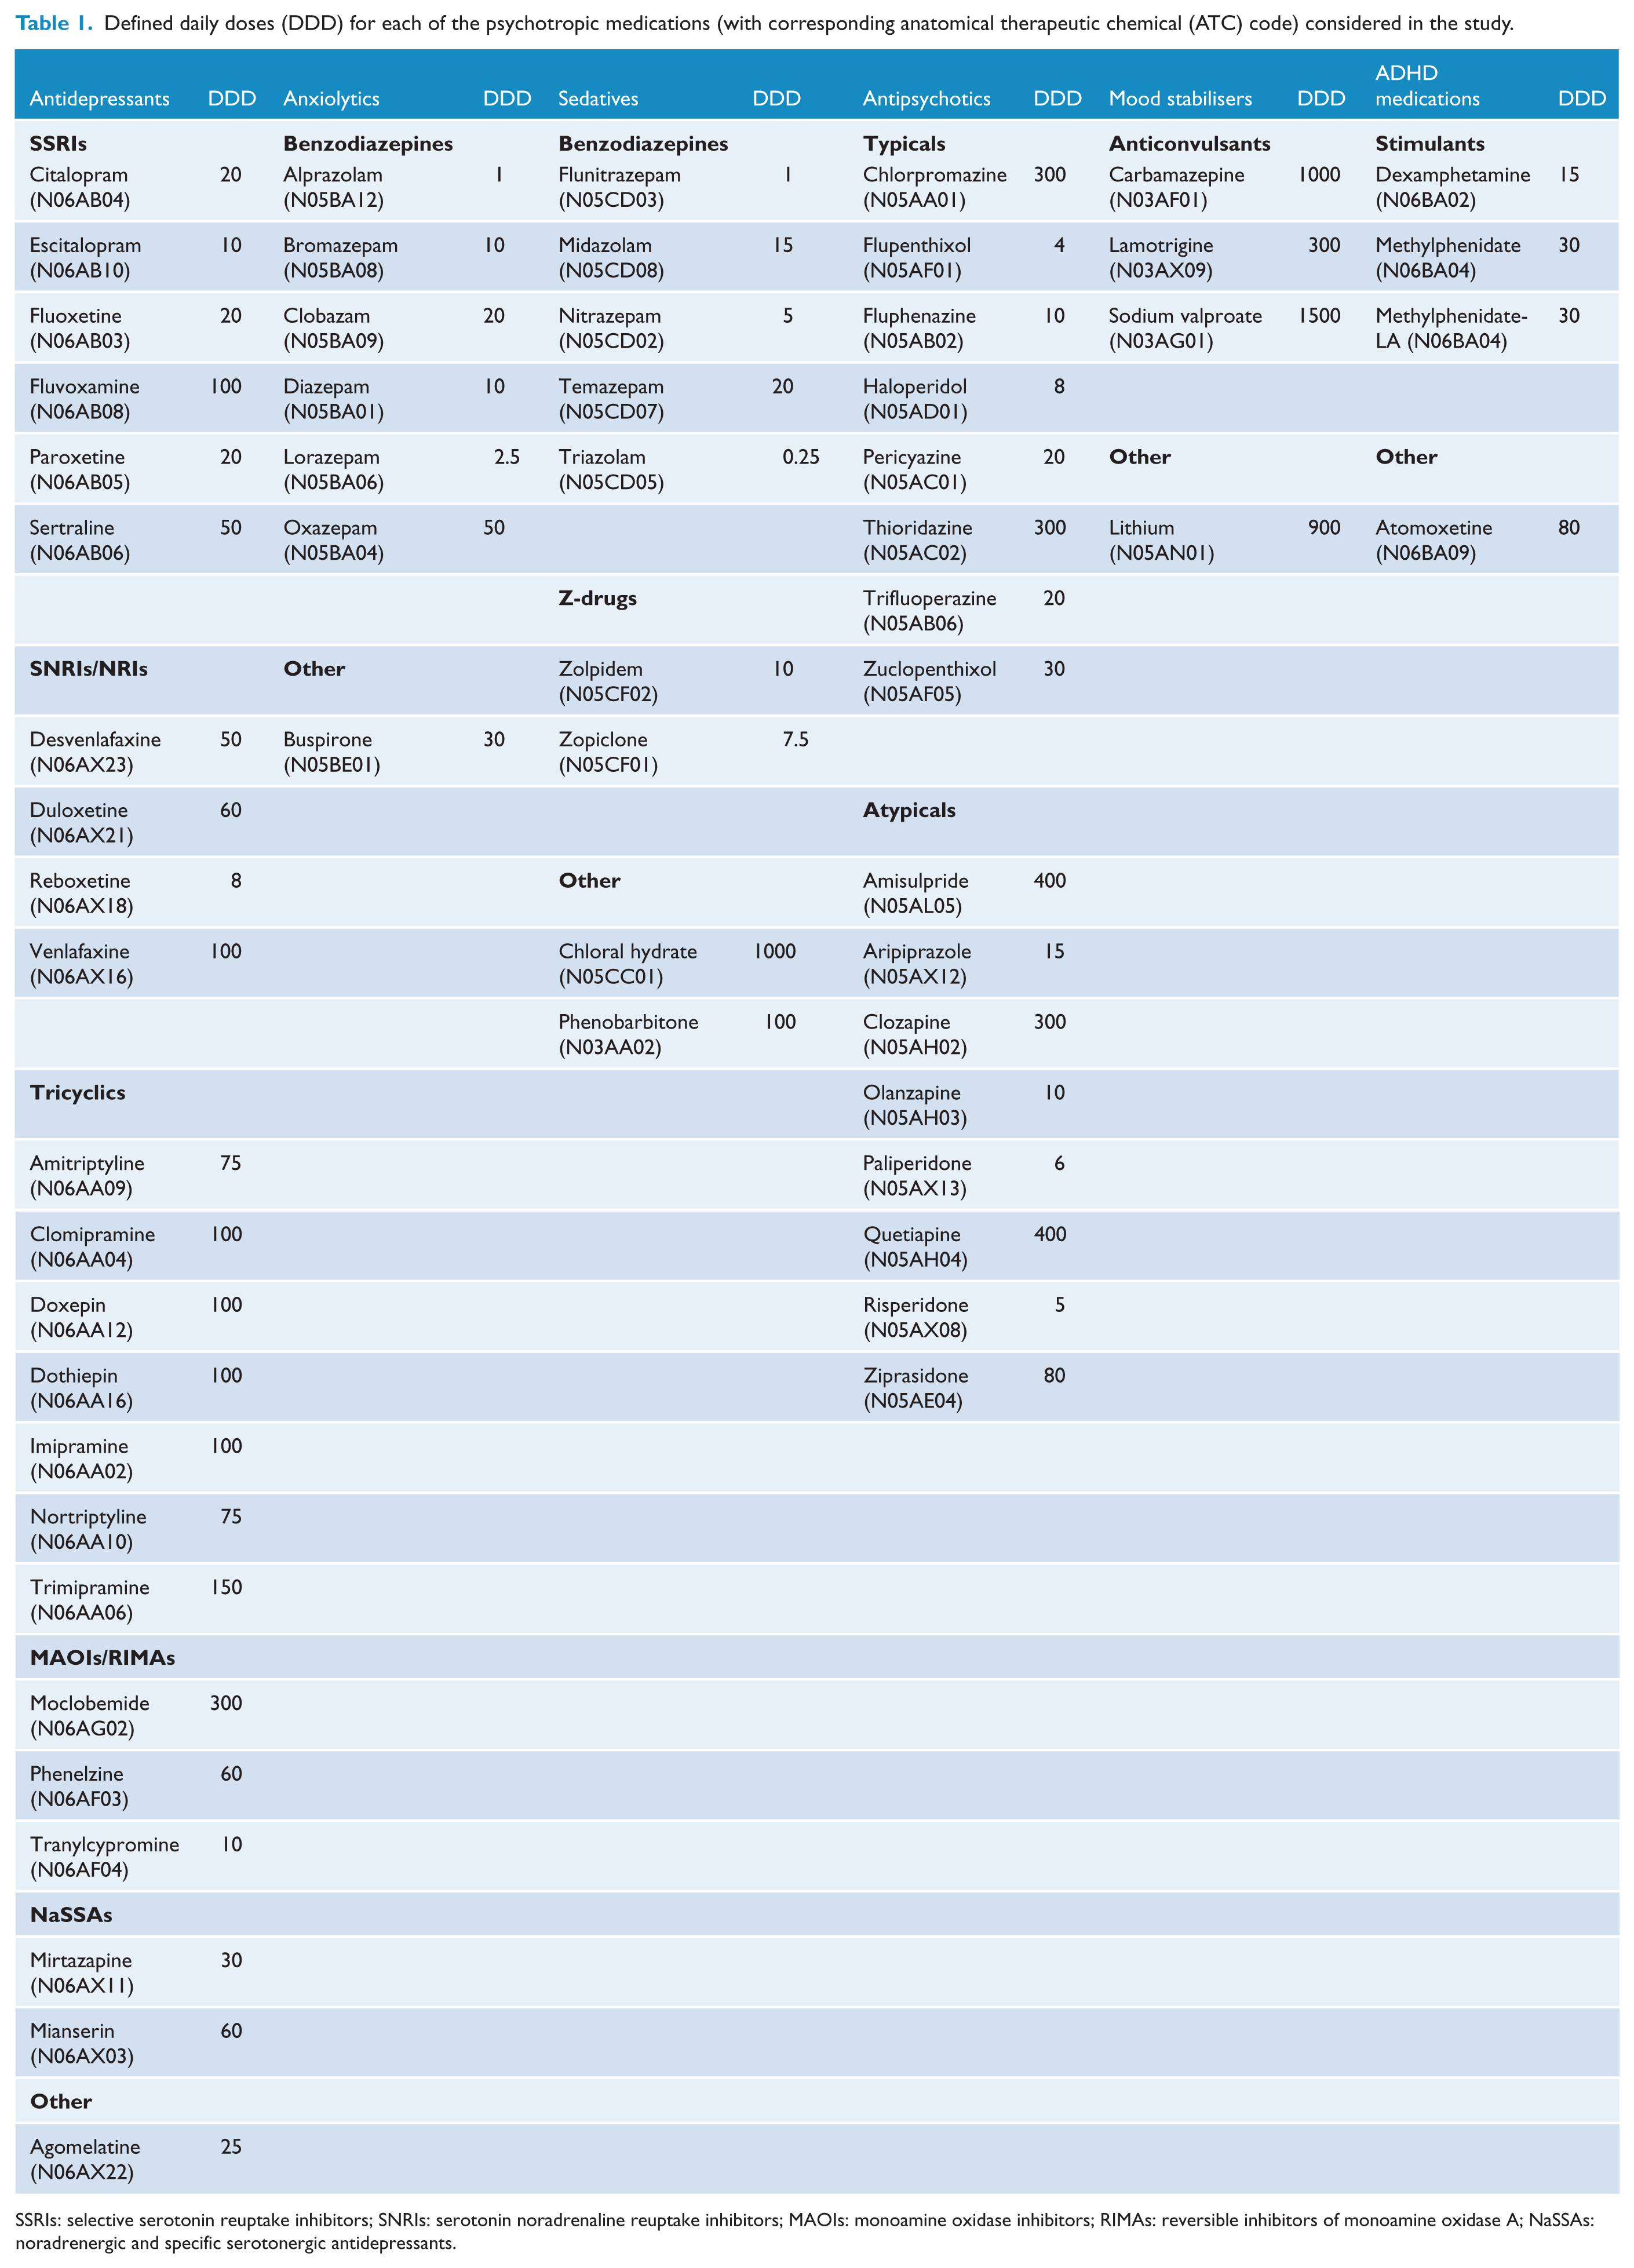
SSRIs: selective serotonin reuptake inhibitors; SNRIs: serotonin noradrenaline reuptake inhibitors; MAOIs: monoamine oxidase inhibitors; RIMAs: reversible inhibitors of monoamine oxidase A; NaSSAs: noradrenergic and specific serotonergic antidepressants.
Unfortunately, it was not possible to disambiguate the use of various drugs in treating mental illness from their use in other syndromes (e.g. neuropathic pain or epilepsy). So, for example, the data presented here for the anticonvulsants valproate, carbamazepine and lamotrigine includes their use in epilepsy and therefore does not accurately portray their actual use in mood disorders. However, as lamotrigine is not subsidised by the PBS for psychiatric indications, the approximate usage of this medication in bipolar disorder can be estimated from private prescription data.
All calculations were completed using Microsoft Office Excel 2010 and graphs were generated using GraphPad Prism 5.0c. The size of the resultant data set is such to render nearly all differences statistically significant; thus, no formal statistical tests were undertaken (Sterne et al., 2001).
Results
The results are reported in Figures 1–8. To enhance clarity, drugs that were only minimally dispensed are not presented in the figures, but are noted in the legends and in Table 1.
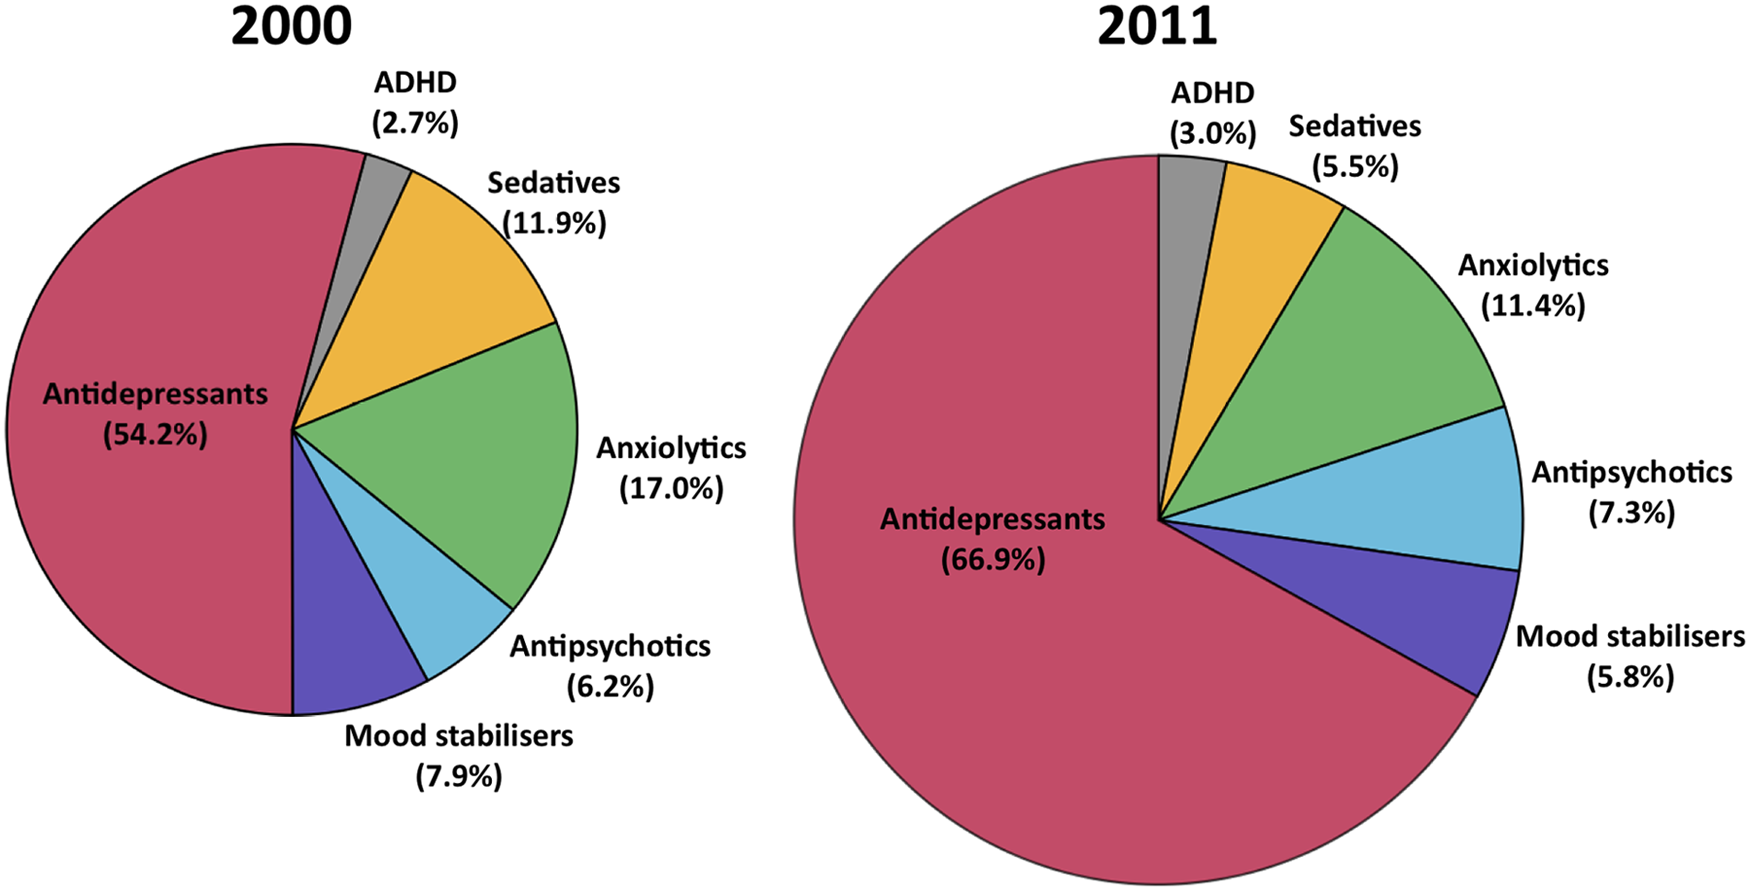
Pie charts showing the share of the market (in terms of DDD/1000 population/day) for each psychotropic class in 2000 and 2011. Note the 2011 figure is 58% larger in area to graphically represent the growth in the psychotropic drug market as a whole.

Overall dispensing for the six main classes of psychotropic drugs, yearly, from 2000 to 2011, represented in terms of (A) defined daily doses per 1000 population per day, and (B) number of prescriptions dispensed.

Antidepressants: (A) dispensing data for the six major antidepressant drug classes; (B) dispensing of various tricyclic antidepressants (note: trimipramine and nortriptyline were omitted due to low use); (C) dispensing data for individual selective serotonin reuptake inhibitor (SSRI) medications; and (D) dispensing data for individual serotonin-noradrenaline reuptake inhibitor (SNRI), noradrenergic and specific serotonergic antidepressant (NaSSA; mirtazapine) and noradrenaline reuptake inhibitor (NRI; reboxetine) medications. Note: different scales used in (A) and (B) relative to (C) and (D).

Anxiolytics and sedatives: dispensing data for (A) The top four anxiolytic benzodiazepines (note: bromazepam, clobazam and buspirone were omitted due to low use) and (B) The top five major sedatives including benzodiazepines and Z-drugs (note: triazolam, chloral hydrate and phenobarbitone were omitted due to low use).
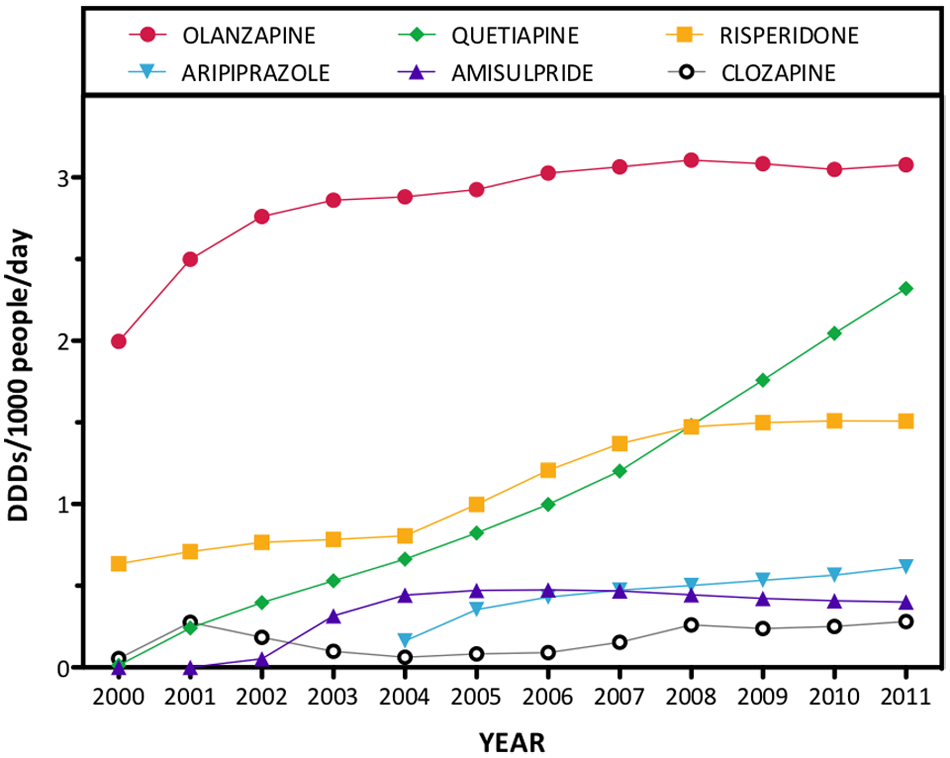
Atypical antipsychotics: dispensing data for the six leading atypical antipsychotics from 2000 to 2011 (note: ziprasidone and paliperidone were omitted due to low use).
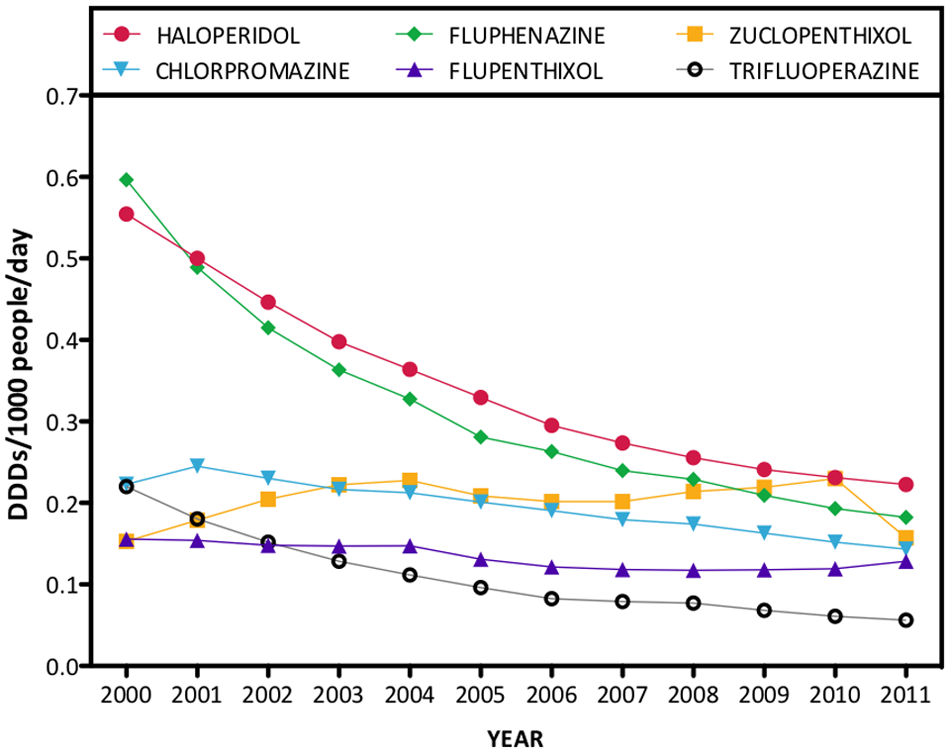
Typical antipsychotics: dispensing data for the six leading typical antipsychotic drugs, including both oral and depot forms from 2000 to 2011 (note: thioridazine was removed from the Australian market in 2008 and pericyazine is omitted due to low use).
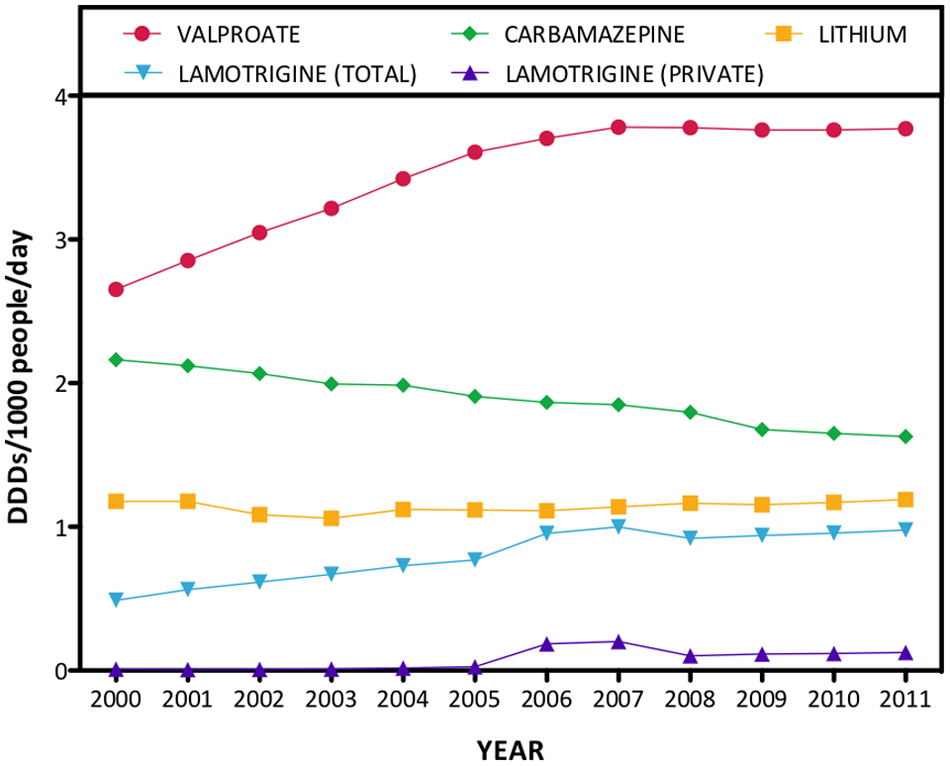
Mood stabilisers: dispensing data for lithium and the three anticonvulsants commonly used as mood-stabilising agents from 2000 to 2011.
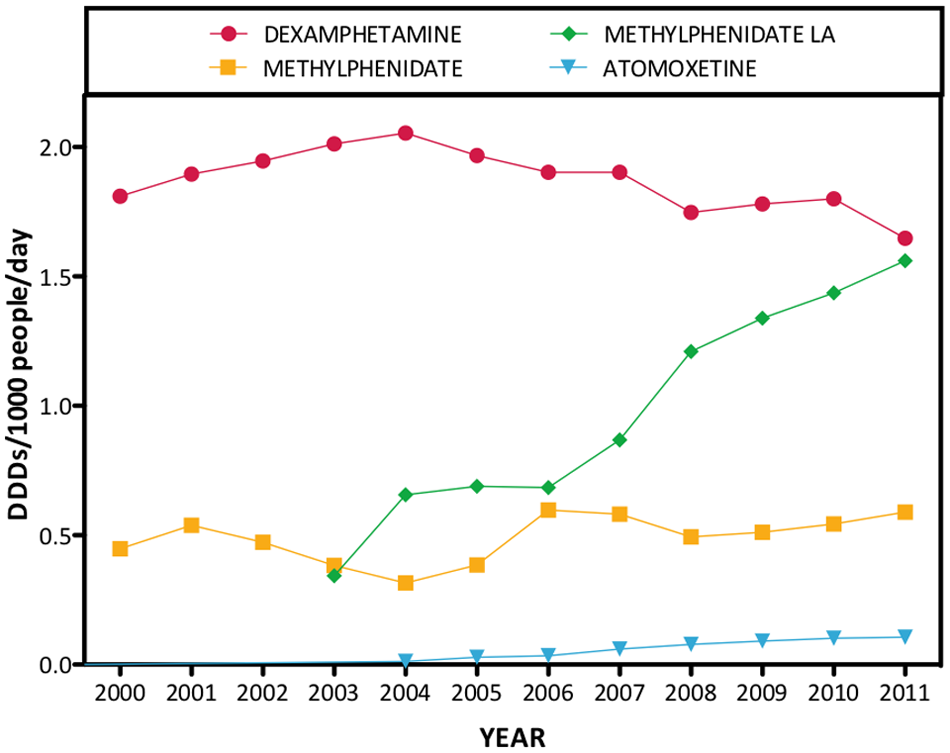
Attention-deficit hyperactivity disorder (ADHD) medications: dispensing data for dexamphetamine, methylphenidate, methylphenidate long-acting/sustained release, and atomoxetine from 2000 to 2011.
Overall trends
When all psychotropic drug classes were considered, the combined DDDs/1000/day was 82.4 in 2000 and 130.4 in 2011, equating to a 58.2% increase in dispensing over this interval. Figure 1 shows the contribution of each psychotropic drug class to total psychotropic dispensing in 2000 and 2011.
As shown in Figure 2A, antidepressants were largely responsible for the major increase in dispensing across the study period, with DDDs/1000/day increasing at an average rate of 5.7% (cumulative) per year (95.3% over the study period). By 2011, antidepressants were the most commonly dispensed class, representing 66.9% of total psychotropic DDDs/1000/day and 57.9% of psychotropic prescriptions dispensed (Figure 2B).
Anxiolytics, the next most commonly used psychotropic class, constituted 11.4% of psychotropic DDDs/1000/day (11.6% of psychotropic prescriptions) in 2011. However, there was little change in anxiolytic dispensing over the study period: the DDDs/1000/day increased from 14.0 to 14.9 from 2000 to 2011. Sedative dispensing decreased by 26.4% (from 9.8 to 7.2 DDDs/1000/day) from 2000 to 2011, a trend that was particularly evident over the last 4 years of study (2008–2011).
Conversely, antipsychotic dispensing increased by 85.2% from 2000 to 2011 (from 5.1 to 9.5 DDDs/1000/day), overtaking sedatives in 2008 as the third most commonly dispensed type of psychotropic medication. Dispensing of mood stabilisers also increased (16.8%; 6.5 to 7.6 DDDs/1000/day) over the study period.
ADHD medications were the least dispensed class, comprising 3.0% of drugs dispensed in 2011. Dispensing increased 72.9%, from 2.3 to 3.9 DDDs/1000/day, from 2000 to 2011.
Antidepressants
As shown in Figure 3A, the SSRIs were the dominant category of antidepressant dispensed, and their use doubled between 2000 and 2011. Utilisation of SNRIs, the second most prevalent category of antidepressant dispensed in 2011, and noradrenergic and specific serotonergic antidepressants (NaSSAs) also increased markedly. Conversely, dispensing of tricyclic antidepressants, reversible inhibitors of monoamine oxidase A (RIMAs; moclobemide) and monoamine oxidase inhibitors (MAOIs) declined. In 2011, the majority of antidepressants dispensed were SSRIs (59.2%) or SNRIs (25.0%), relative to tricyclics (7.3%), NaSSAs (7.2%), RIMAs (0.9%) and MAOIs (0.3%).
Figure 3B demonstrates the waning popularity of tricyclics as a group, with the exception of amitriptyline, the use of which increased by 33.4%. Analysis of the different formulations of the drug demonstrated that the 10 mg tablets used for their analgesic and sedative effects showed a 190.4% increase in use, whilst the 50 mg tablets used predominately for depression showed a lesser increase of 65.3%.
Figures 3C and 3D show changes over the study period in the prevalence of different SSRIs (Figure 3C) and SNRIs/NRIs/NaSSAs (Figure 3D). The enduring popularity of sertraline over the entire 12 years and the emerging popularity of escitalopram are the most striking features. There was a threefold increase in dispensing of venlafaxine over the study period. In 2011, the highest dispensing figures came from sertraline (21.4% of total antidepressant DDDs/1000/day), escitalopram (14.7%), venlafaxine (13.9%), citalopram (8.4%) and fluoxetine (7.1%). The other 17 antidepressants represented 34.5% of the total dispensed.
Utilisation data for different formulations of the leading antidepressants are shown in Table 2. In 2011, the most dispensed formulations of sertraline, escitalopram and venlafaxine were the 100 mg tablet, 20 mg tablet and 150 mg capsule respectively, all of which are greater than the corresponding DDD figure (50 mg, 10 mg and 100 mg respectively).
Selected utilisation data for commonly used formulations of leading antidepressants and anxiolytics. Note the apparent discrepancies between the WHO defined daily dose (DDD) and most utilised drug formulations.
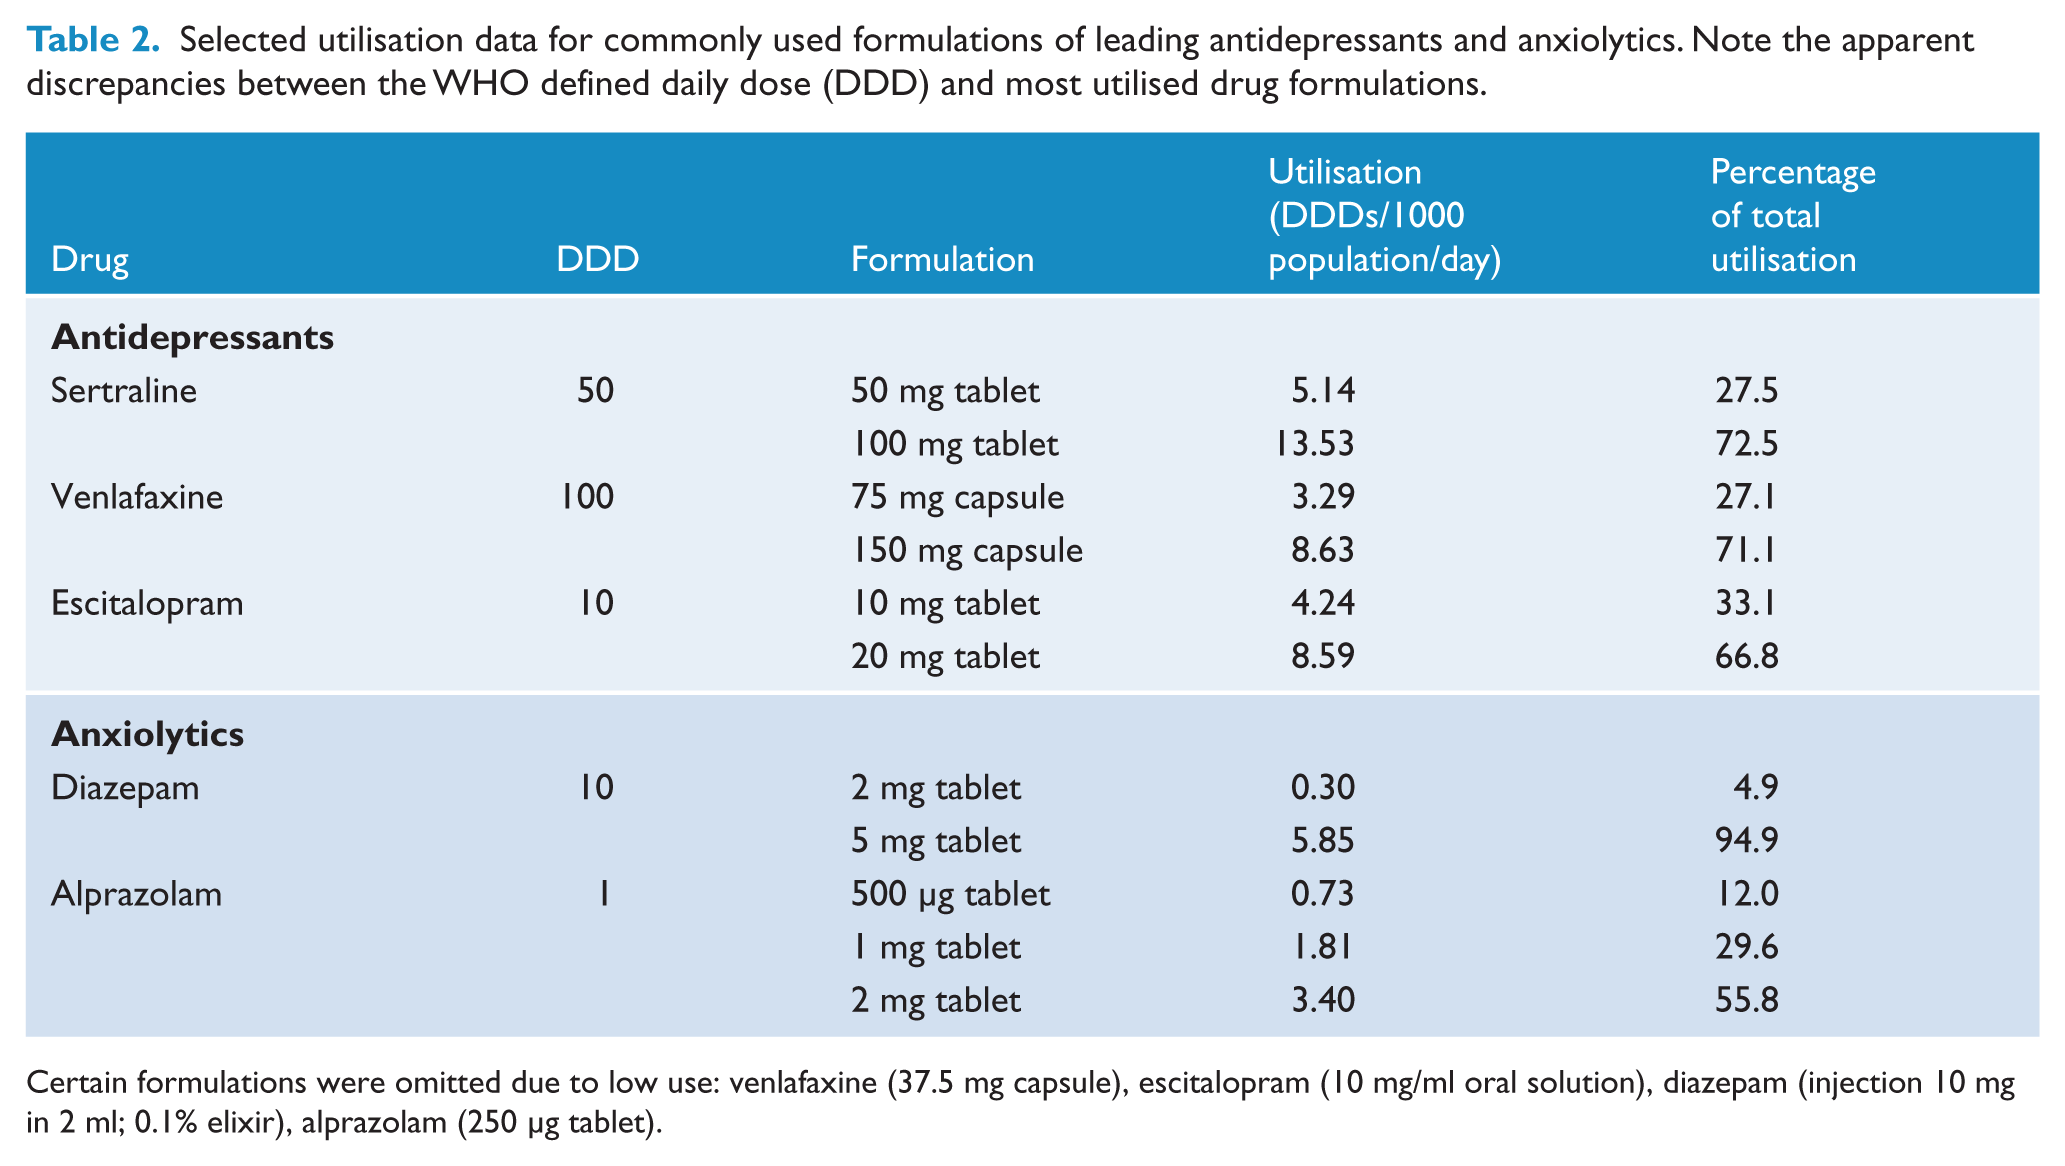
Certain formulations were omitted due to low use: venlafaxine (37.5 mg capsule), escitalopram (10 mg/ml oral solution), diazepam (injection 10 mg in 2 ml; 0.1% elixir), alprazolam (250 μg tablet).
Anxiolytics
Diazepam was the most popular anxiolytic dispensed in 2011, comprising 41.5% of total anxiolytic dispensing, and its use from 2000 to 2011 remained remarkably stable (Figure 4A). The most striking longitudinal feature is the rise of alprazolam with a near doubling of its DDDs/1000/day such that by 2011 it is almost equivalent to diazepam in dispensing (41.0% of the total, with a 87.2% increase from 2000 to 2011). Use of oxazepam (13.5%) and lorazepam (2.6%) declined over the study period by 42.4% and 21.7% respectively, resulting in a relatively low market share in 2011. The most dispensed formulations of diazepam and alprazolam were the 5 mg and 2 mg tablet respectively (Table 2).
Sedatives
There was an overall decline in the dispensing of sedatives between 2000 and 2011 (Figure 4B). The most dispensed sedatives in 2011 were temazepam (54.1% of total DDDs/1000/day for sedatives) followed by nitrazepam (21.5%) and zolpidem (10.7%). However, use of both temazepam and nitrazepam diminished in a linear fashion over the study interval. In contrast, zolpidem prescriptions rose steeply following its release in 2001, before decreasing markedly after 2007 with the introduction of black box warnings by the Therapeutic Goods Administration (TGA) concerning bizarre sleep-related behaviours in those taking zolpidem (Therapeutic Goods Administration, 2008). Conversely, zopiclone dispensing increased steadily over the study period, albeit at relatively low levels. Flunitrazepam dispensing increased until 2002 then gradually decreased when it was reclassified from S4 to S8 due to concerns over abuse liability and use in date rapes.
Antipsychotics
Dispensing trends for atypical and typical/‘first-generation’ antipsychotics are shown in Figure 5 and 6, respectively (note the very different scales used in these two figures). There was a 217.7% increase in total atypical antipsychotic dispensing between 2000 and 2011, a trend reflected to some extent in every drug of this class. The drugs showing the largest increases were quetiapine (from 0.01 to 2.3 DDDs/1000/day) and risperidone (from 0.6 to 1.5 DDDs/1000/day). In 2011, olanzapine was the most popular atypical at 35.9% of dispensing, followed by quetiapine (27.1%), risperidone (17.6%), aripiprazole (7.2%) and amisulpride (4.7%).
In contrast, Figure 6 illustrates a 61.2% decrease in the dispensing of the typical antipsychotics, overall, with zuclopenthixol the only member increasing in popularity over much of the study period. In 2011, the five most popular typical antipsychotics were haloperidol (23.5% of total typical antipsychotic DDDs/1000/day), fluphenazine (19.2%), zuclopenthixol (16.6%), chlorpromazine (15.1%) and flupenthixol (13.5%). However, the overall DDDs/1000/day figure for each of these medications ranged from 0.06 to 0.22 in 2011, far below the figures for leading atypicals such as olanzapine (3.08) and quetiapine (2.32).
Analysis of 2011 antipsychotic utilisation by formulation type reveals that the majority of typical antipsychotics (57.6%) and a small proportion of atypical antipsychotics (5.8%) were dispensed in injectable or depot forms.
Mood stabilisers
Dispensing of mood stabilisers from 2000 to 2011 is shown in Figure 7. It was not possible to disambiguate the use of anticonvulsants in epilepsy, neuropathic pain and bipolar disorder in the DUSC dataset; hence, the data for sodium valproate, carbamazepine and lamotrigine represent dispensing for all of these indications (see ‘Discussion’ for further analysis). Figure 7 indicates an upward trend in valproate (42.1% increase) and lamotrigine (100.2% increase) dispensing, a 23.7% decrease for carbamazepine, and static dispensing of lithium. In 2011, 49.8% of dispensing for these four drugs was attributable to valproate, followed by carbamazepine (21.9%), lithium (15.7%) and lamotrigine (12.9%). Private dispensing of lamotrigine, which reflects most of its use in bipolar disorder, peaked in 2007 at 0.2 DDD/1000/day before halving in 2008. The last 4 years have seen a 22.9% increase in lamotrigine dispensed through private sources. Private dispensing comprised 12.9% of total lamotrigine dispensed in 2011.
ADHD medications
ADHD medications were the least dispensed class of psychotropics, reflecting their predominant use in children. Figure 8 shows the dominance of dexamphetamine over the 12 years of study and the relative static volume of prescriptions over that time. Long-acting methylphenidate rose rapidly to become the second most popular ADHD drug after its release in 2002. Use of immediate release methylphenidate oscillated somewhat across the study interval, increasing when it became available on the PBS in 2006. Atomoxetine, released in 2004, showed a significant increase over time. However, it was dispensed at a rate of only 0.107 DDDs/1000/day in 2011, reflecting its use as a second-line treatment for those who fail to respond to, or abuse stimulant medication (Schubiner, 2005).
In 2011, the majority of ADHD medications dispensed were stimulants, led by methylphenidate/methylphenidate LA (55.1% of total) and dexamphetamine (42.2%), while the NRI atomoxetine comprised only 2.7%.
Discussion
To the best of our knowledge, the last comprehensive overview of psychotropic prescribing in Australia occurred in 1987 and surveyed PBS data for the 12 most commonly prescribed psychotropics from 1977 to 1984. These results showed a dominant position at that time for benzodiazepines (constituting 59% of surveyed prescriptions) and tricyclic antidepressants (34%). Phenothiazines (typical antipsychotics) constituted the remaining 7% of surveyed prescriptions (Mant et al., 1987).
The current results indicate a profound shift in psychotropic medication use patterns. In 2011, the antidepressants were by far the most commonly dispensed psychotropic medication (66.9% of all psychotropic DDDs/1000/day benzodiazepine and Z-drug dispensing declined to 16.9%; and antipsychotic dispensing was largely unchanged (7.3%). Furthermore, there was a striking 58.2% increase in psychotropic dispensing from 2000 to 2011, suggesting a rapidly growing utilisation of medications to tackle mental health problems.
Antidepressants
The observed increases in total psychotropic DDDs/1000/day over the study period were largely driven by rises in SSRI, SNRI and NaSSA antidepressant dispensing. These trends are consistent with a recent Australian analysis suggesting a 41% increase in antidepressant prescribing between 2002 and 2007 (Hollingworth et al., 2010a). Similar trends are evident in other countries: a recent UK study reported an average 10% per annum increase in antidepressant prescribing from 1998 to 2010 (Ilyas and Moncrieff, 2012), while USA data indicate that 10% of all Americans were taking an antidepressant in 2005 versus 5.8% in 1996 (Olfson and Marcus, 2009).
This increase in antidepressant dispensing likely results from a number of factors including increased recognition and public awareness of depression (Partridge et al., 2012), improved side-effect and safety profiles of the newer SSRI, SNRI and NaSSA medications relative to the older tricyclics and MAOIs (Westenberg and Sandner, 2006), and increased use of antidepressants as the first-line treatment for anxiety disorders (Bandelow et al., 2012). Despite such rational explanations, increases in antidepressant use have been flagged as a cause for concern given ongoing controversies about poor or inflated claims to efficacy (Smith, 2012) and overdiagnosis of depression (Parker, 2007).
Antidepressant prescriptions (Figure 3) were dominated by SSRIs and SNRIs, with sertraline, escitalopram and venlafaxine as the most dispensed medications. This ranking agrees with some analyses of relative efficacy, although data can be difficult to analyse accurately due to well-documented publication bias within the antidepressant clinical trial literature (Turner et al., 2008). Escitalopram appears in efficacy and tolerability superior to most other SSRIs and SNRIs; sertraline has arguably the greatest tolerability, possibly explaining its overall popularity; and venlafaxine appears more efficacious than all SSRIs except escitalopram, although with a greater propensity to cause adverse effects (Cipriani et al., 2009). A notable drop in the dispensing of the SSRI paroxetine (Figure 3C) most likely reflects a growing awareness of troubling discontinuation effects and ongoing concerns about teratogenicity (Westenberg and Sandner, 2006).
A caveat concerning interpretation of the antidepressant dispensing data is the increasing use of tricyclic and SNRI antidepressants in the treatment of pain. Analysis of amitriptyline use over the study period revealed more pronounced increases in dispensing of the 10 mg formulation used for neuropathic and chronic pain than in the 50 mg formulation used predominantly in depression. Similarly, duloxetine was the best-selling pain medication in the US in 2010 (Melnikova, 2010).
Benzodiazepines
Dispensing of benzodiazepines, with the exception of alprazolam, remained static or decreased over the study interval. These findings agree with those of a similar Australian analysis from 2002 to 2007 (Hollingworth and Siskind, 2010) and a recent UK study (Ilyas and Moncrieff, 2012). Increasing practitioner and consumer awareness of benzodiazepine addiction, dependence and withdrawal largely underlies the declining popularity of these drugs. Furthermore, benzodiazepines impair balance and coordination, cognitive function and driving ability (Lader et al., 2009). The newer non-benzodiazepine hypnotics zolpidem and zopiclone can also be problematic, although these drugs likely carry a lower risk of dependence (Terzano et al., 2003). Zolpidem has also been associated with bizarre sleep-related disturbances, leading to the introduction of a black box warning in 2008 (Therapeutic Goods Administration, 2008). This warning, combined with the lack of PBS subsidy, may be responsible for the declining popularity of zolpidem (Figure 4B).
The increased dispensing of alprazolam (87.2%) between 2000 and 2011 was a result of some concern. An explanation for this trend is difficult: the drug is off patent; appears to have similar efficacy to other sedatives (Moylan et al., 2012); and its addictive potential is subject to warning from Australian medical authorities (Monheit, 2010). Its increasing popularity may instead reflect its strong abuse potential as well as its increasing use in the treatment of panic disorder (Moylan et al., 2012).
Antipsychotics
The data reported here show that dispensing of atypical antipsychotics has increased in the last decade, in agreement with recent US (Medco, 2011), UK (Ilyas and Moncrieff, 2012) and Australian (Hollingworth et al., 2010b) studies. Given the static prevalence of psychotic disorders over this period (Kirkbride et al., 2012), these increases in antipsychotic dispensing likely result from escalating off-label use and expanded regulatory approval for indications other than schizophrenia and related psychoses (Alexander et al., 2011).
The approval and subsidy of antipsychotics for maintenance treatment of bipolar disorder, in particular, has produced significant increases in antipsychotic prescription rates and an overall shift in treatment patterns for this disorder. Indeed, recent US data suggest a third of all atypical antipsychotic users have a primary diagnosis of bipolar disorder (Alexander et al., 2011), reflecting recent studies showing utility of these drugs for mania, bipolar depression, and more contentiously as a monotherapy treatment for bipolar disorder (Goodwin, 2009). Increased use of antipsychotics among specific age groups has also been observed: antipsychotics are increasingly used in children and for the control of aggression and behavioural problems in elderly patients with dementia (Burke and Tariot, 2009; Hollingworth et al., 2010b). Indeed, antipsychotic prescription to US children more than doubled between 2001 and 2010 (Medco, 2011), potentially resulting from increases in diagnosis of childhood bipolar disorder and the DSM-IV-TR (Diagnostic and Statistical Manual of Mental Disorders, Fourth Edition, Text Revision) temper dysregulation disorder (Vitiello et al., 2009). Despite such increases, these practices remain controversial given the uncertain risk–benefit profile of many atypical antipsychotics in these populations (Burke and Tariot, 2009; Vitiello et al., 2009).
The ongoing popularity of olanzapine as the leading atypical antipsychotic is notable. While some large-scale studies suggest that olanzapine may be a more efficacious first-line treatment for psychosis than other atypicals, the clinical significance of these benefits has been questioned (Komossa et al., 2010). Olanzapine also carries a higher risk of adverse metabolic effects than most other atypicals (Komossa et al., 2010). Clozapine, an atypical with similar metabolic risks, showed a slight decrease in use over the decade and remains the most effective antipsychotic for treatment-resistant schizophrenia (Mackin and Thomas, 2011).
In contrast to observed trends in the use of atypical antipsychotics, there was a decrease in the dispensing of all typical antipsychotics except for zuclopenthixol. Typical antipsychotics have declined in popularity due to a perceived higher risk of extrapyramidal side effects with these agents (not always confirmed), and the risk of tardive dyskinesia with long-term use. However, they still feature prominently as depot medications.
Mood stabilisers
Mood stabiliser use in Australia increased slightly over the period of investigation, with valproate the most commonly dispensed mood stabiliser over the entirety of the study period. Mood stabilisers possess clinical utility for a range of indications including bipolar disorder and other mood disorders, epilepsy, neuropathic pain, migraine and fibromyalgia (Mackey, 2010). As the DUSC dispensing database does not allow distinctions to be made between anticonvulsant use for different indications, these data necessarily overestimate the use of valproate, carbamazepine and lamotrigine in psychiatric disorders.
A recent analysis of drug sales in the US showed that approximately 50% of valproate prescriptions and 55% of lamotrigine prescriptions are used for the treatment of bipolar disorder (Mackey, 2010). In Australia, psychiatrists prescribe about 10% of valproate and 2% of lamotrigine (Hollingworth and Eadie, 2010), although GPs may manage repeat prescriptions in bipolar disorder. Indeed, the current private prescription data suggest that approximately 13% of lamotrigine was used for bipolar disorder in 2011.
Recent data on trends in anticonvulsant use as a function of diagnosis are scarce and restricted to individual countries. In the UK, valproate use in bipolar disorder increased by 22.7% from 1995 to 2009, and lithium use increased by 6.8% (Hayes et al., 2011). Nationwide studies from Denmark and Norway have reported relatively stable or declining use of anticonvulsants in epilepsy, but increased use in pain and psychiatric diagnoses (Landmark et al., 2009; Tsiropoulos et al., 2006). In Europe, use of lamotrigine for psychiatric disorders has increased dramatically in recent years, with little change observed in its use for alternative diagnoses (Greil et al., 2012; Landmark et al., 2009). Similarly, the comparison of private versus total dispensing data in Figure 7 suggests that the observed increases in lamotrigine dispensing are most likely driven by psychiatric uses of this drug.
Carbamazepine was the only mood stabiliser to decrease in use over the study period. Carbamazepine has proven utility in mania, depressive and mixed bipolar episodes and carries a lower risk of weight gain than its comparators; however, problems with p450 drug interactions, loss of coordination, vertigo, somnolence and skin rashes may have contributed to its decline in popularity (Goodwin, 2009).
ADHD medications
Dispensing of ADHD medications increased by 72.9% over the 12-year study period, agreeing with a recent Australian analysis covering 2002–2009 (Hollingworth et al., 2011). Ongoing increases in the use of ADHD medications have also been observed globally, especially in the USA (Scheffler et al., 2007). Interestingly, the current data suggest an average annual growth rate of 4.7% in Australia, exceeding estimated rates in the USA by 1–2% (Castle et al., 2007; Zuvekas and Vitiello, 2012). This widespread increase in the use of ADHD medication may reflect a greater public awareness of ADHD, changes in societal pressures on children demanding more prolonged attention, an increase in studies showing efficacy of stimulant medications (Faraone and Glatt, 2010) and the influence of pharmaceutical companies on doctor prescribing (Smith, 2012). However, these trends have generated considerable controversy and public concern, especially given the high use of ADHD medications in children and adolescents, and their potential for overuse and abuse (Partridge et al., 2012; Setlik et al., 2009). The efficacy of these medications in improving long-term outcomes in ADHD is also open to question (Government of Western Australia, Department of Health, 2010).
Limitations
The DUSC dispensing database, while incorporating and extending upon the publicly available PBS data source, does have certain limitations. The data from 370 cooperating pharmacies represents less than a tenth of known pharmacies in Australia. Pharmacies that participate are likely to be different from the average pharmacy, frequently associated with teaching hospitals. Another limitation with this study was the lack of data on dispensing to different age groups and their drug-use patterns. Trends in psychotropic drug use in the elderly and young differ markedly from those in the general population and are prone to rapid fluctuation (Hollingworth and Siskind, 2010; Hollingworth et al., 2011), making a similar analysis in these age groups of particular importance.
The DUSC database also does not permit an analysis of polypharmacy in psychotropic drug dispensing. Polypharmacy is a growing trend in the treatment of schizophrenia, bipolar disorder and depression (Greil et al., 2012; Mojtabai and Olfson, 2010). Indeed, an analysis from 2006 found 59.8% of private American psychiatric patients are on two or more psychotropic agents (Mojtabai and Olfson, 2010). Given the prevalence of polypharmacy, use of the current results to extrapolate the number of Australians currently taking psychotropic medications is likely to result in an overestimation of actual prevalence. Thus, while the overall psychotropic DDDs/1000/day figure of 130.4 in 2011 superficially suggests that 13% of Australians may be taking a psychotropic on any given day, a study of South Australian psychotropic use indicated that only 10.6% of adults in that state are current users of a prescription psychotropic drug (Goldney and Bain, 2006).
Another legitimate concern is that the DDDs/1000/day metric used in the current study may be inaccurate for some highly prevalent drugs. In particular, the DDD provided by the WHO (Table 1) for some antidepressants does not reflect the most commonly dispensed formulations in the Australian community. For example, the DDD for sertraline (50 mg), venlafaxine (100 mg) and escitalopram (10 mg) appear rather conservative. Analysis of dispensing data by drug formulation (Table 2) shows that 72.5% of sertraline scripts were for the larger 100 mg tablet, with the 50 mg (DDD) formulation comprising only 27.5% of scripts dispensed. Similar discrepancies are apparent for venlafaxine and escitalopram (Table 2). The mismatch between WHO sanctioned DDDs for antidepressants and de facto prescribing practice in the community means that the current results may overestimate the predominance of antidepressant prescribing in Australia and the pre-eminent positions of sertraline, escitalopram and venlafaxine.
Conversely, the DDD for some benzodiazepines may be an underestimate. As Table 2 shows, the DDD for the most common anxiolytic diazepam is 10 mg, while the 5 mg tablet comprises 95% of prescribing in Australia. Assuming once a day use, this mismatch would lead the current dispensing data to underestimate the actual use of diazepam in the Australian community by approximately 50%. This would be offset somewhat in the overall statistics for anxiolytics by the fact that the DDD for alprazolam (1 mg) is lower that the most commonly prescribed formulation in Australia (2 mg).
An alternative assessment of psychotropic utilisation in Australia comes from the BEACH study, which tracks the prescribing habits of approximately 1000 Australian GPs over a 12-month period. Recent results from BEACH suggest that 10% of all prescriptions written by GPs are for psychotropic medications, with antidepressants constituting 4.6% of all drugs prescribed, anxiolytics/sedatives 3.9%, and antipsychotics 1.4% (Britt et al., 2011). This contrasts with the data presented here which suggests a dispensing ratio of antidepressants to anxiolytics/sedatives of almost 4:1, and with other recent Australian DDD-based data suggesting a ratio of above 3:1 (Hollingworth and Siskind, 2010; Hollingworth et al., 2010a). Analysis of PBS data alone (not shown) suggests a ratio closer to 2:1.
Overall, this reinforces the idea that the DDD-based approach used in the current paper may lead to substantial overestimation of antidepressant use, and underestimation of benzodiazepine use, and that a more fine-grained analysis may be required that balances PBS statistics, DDD and dispensing statistics, and the prescribing behaviour of GPs and psychiatrists. Accordingly, when some of the current results are reanalysed as number of drugs dispensed, rather than by DDDs/1000/day, the gap between antidepressant and anxiolytic/sedative prevalence becomes narrower (Figure 2).
Conclusions
In conclusion, this study is the most recent looking at general and class-specific psychotropic dispensing in Australia. Psychotropic dispensing in Australia markedly increased from 2000 to 2011, similar to other countries such as the UK and USA, with particular increases observed in antidepressant, antipsychotic and ADHD medication use. The increasing reliance on psychotropic medications for the treatment of mental health disorders has generated considerable controversy, especially given current concerns about the influence of the pharmaceutical industry on treatment practices (Boyce and Malhi, 2012) and the absence of any improvement in the mental health of Australians (Jorm and Reavley, 2012). Accordingly, these trends have been attributed to various causes including increasing public recognition and awareness of mental illness, broadening diagnostic criteria for mental health disorders, increased acceptance of psychotropic drug use, expanding regulatory approval and off-label use of psychotropic drugs, and increasingly effective drug marketing strategies.
Footnotes
Acknowledgements
Chris P Stephenson and Emily Karanges contributed equally to this work. The authors acknowledge Vanna Mabbott and the DUSC for providing the data for this study
Funding
This research received no specific grant from any funding agency in the public, commercial, or not-for-profit sectors.
Declaration of interest
The authors report no conflicts of interest. The authors alone are responsible for the content and writing of the paper.