
Abstract
Objective:
Ventricular enlargement is common in established schizophrenia; however, data from ultra high-risk for psychosis and first-episode psychosis studies are inconclusive. This study aims to investigate ventricular volumes at different stages of psychosis.
Methods:
Ventricular volumes were measured using a semi-automated and highly reliable method, for 89 established schizophrenia, 162 first-episode psychosis, 135 ultra high-risk for psychosis and 87 healthy controls using 1.5T magnetic resonance images. Clinical outcome diagnoses for ultra high-risk for psychosis were evaluated at long-term follow-up (mean: 7.5 years).
Results:
Compared to controls, we identified significant ventricular enlargement of 36.2% in established schizophrenia (p < 0.001). Ventricular enlargement was not significant in first-episode psychosis (6%) or ultra high-risk for psychosis (−3%). Examination across stages of schizophrenia-spectrum diagnoses subgroups revealed a significant linear trend (p = 0.006; established schizophrenia = 36.2%, first-episode psychosis schizophrenia = 18.5%, first-episode psychosis schizophreniform = −4.2% and ultra high-risk for psychosis-schizophrenia converters = −18.5%).
Conclusion:
Ventricular enlargement is apparent in patients with established schizophrenia but is not a feature at the earliest stages of illness (ultra high-risk for psychosis and first-episode psychosis). Further research is needed to fully characterize the nature and timing of ventricular volume changes early in the course of illness and how these changes impact outcomes.
Introduction
Ventricular enlargement (VE) is one of the most reproducible and recognizable structural abnormalities in established schizophrenia (Est-SZ; Pantelis et al., 2005; Kempton et al., 2010), and is associated with poorer clinical outcomes, more negative symptoms and cognitive decline (Cahn et al., 2006). Cross-sectional meta-analyses involving substantial numbers of drug-naïve patients (Haijma et al., 2012; Van Erp et al., 2016; Wright et al., 2000) provide robust evidence for VE. Recently, three systematic reviews of longitudinal brain imaging studies confirmed significant progressive VE in Est-SZ (Fusar-Poli et al., 2013; Kempton et al., 2010; Olabi et al., 2011), at roughly two to four times that seen in normal brain development (Olabi et al., 2011). However, our understanding of when and how these changes occur is limited. Meta-analytic results for first-episode schizophrenia and other psychotic disorders point toward VE also being present early on in the illness (De Peri et al., 2012; Steen et al., 2006; Vita et al., 2006), although some studies, including a meta-analysis and several longitudinal studies, have conversely found no significant difference in ventricular volumes (VVs) of FEP patients compared with controls (Ayesa-Arriola et al., 2013; Boonstra et al., 2011; Chakos et al., 1994; Kempton et al., 2010).
Studies investigating VE in pre-psychotic individuals are scarce. Those that have focused on genetic high-risk populations have mainly failed to find significant differences when compared to healthy controls (HCs; Cannon et al., 1998; Lawrie et al., 1999, 2001, 2002). Only one study in adolescents with one or both parents diagnosed with schizophrenia found significant VE in comparison to HC, with more pronounced enlargements for those with greater genetic risk (Cannon et al., 1993). An alternative high-risk strategy is to identify a help-seeking group using the ‘ultra high-risk’ (UHR) approach (Yung et al., 2004), representing a clinical sample with a high conversion rate to psychosis of about 20–30% over 12–24 months (Fusar-Poli et al., 2012). This approach integrates three subgroups: an attenuated symptoms group, a group with brief self-limiting psychotic episodes (BLIPS) and a genetic liability group experiencing functional decline (Nelson et al., 2013; Yung et al., 2004). Because UHR individuals are clinically unwell and in need of treatment, they theoretically sit in between the genetic high-risk (or at-risk/mildly unwell) and FEP stage, according to the clinical staging model (McGorry et al., 2007). To our knowledge, only two research groups have used this UHR approach to examine VE in emerging psychosis (Cannon et al., 2015; Ziermans et al., 2009, 2012), and both have failed to find cross-sectional group differences in mean VVs at study entry, not only between the UHR group and controls but also between controls, UHR converters (UHR-P, those who go on to develop a psychotic disorder) and non-converters (UHR-NP).
In the current cross-sectional study, we investigated VV in large groups of individuals who were in different stages of psychotic illness, including UHR, first-episode psychosis (FEP) and Est-SZ. We predicted that VE between groups would increase by illness stage, and that greater duration of illness (DOI) would be associated with greater VE.
Method
Participants
Participants were scanned between 8 July 1994 and 4 May 2001, representing the same cohort examined in an earlier study of hippocampal and amygdala volume (Velakoulis et al., 2006). Given the sample characteristics and ascertainment strategy have been described previously in detail, we will only briefly outline the methodology here. Exclusion criteria were a history of substantial head injury, seizures, neurological diseases, impaired thyroid function, corticosteroid use or The Diagnostic and Statistical Manual of Mental Disorders, Third Edition–Revised (DSM-III-R) criteria of alcohol or substance abuse or dependence. HCs with a personal or family history of psychiatric illness were excluded. The local research and ethics committees approved the study and the collation of data collected from across several studies. Written informed consent was obtained from all subjects; for minors, consent was also obtained from a parent/guardian.
A total of 510 subjects were initially recruited, of which 37 were subsequently excluded due to findings of an unsuspected brain lesion (incidental finding, n = 12), diagnosis revision (n = 12) or insufficient data (n = 13). Table 1 shows the sex, age and height of the remaining 473 participants included in the final analysis.
Demographic and structural volumetric data for the 473 study participants.
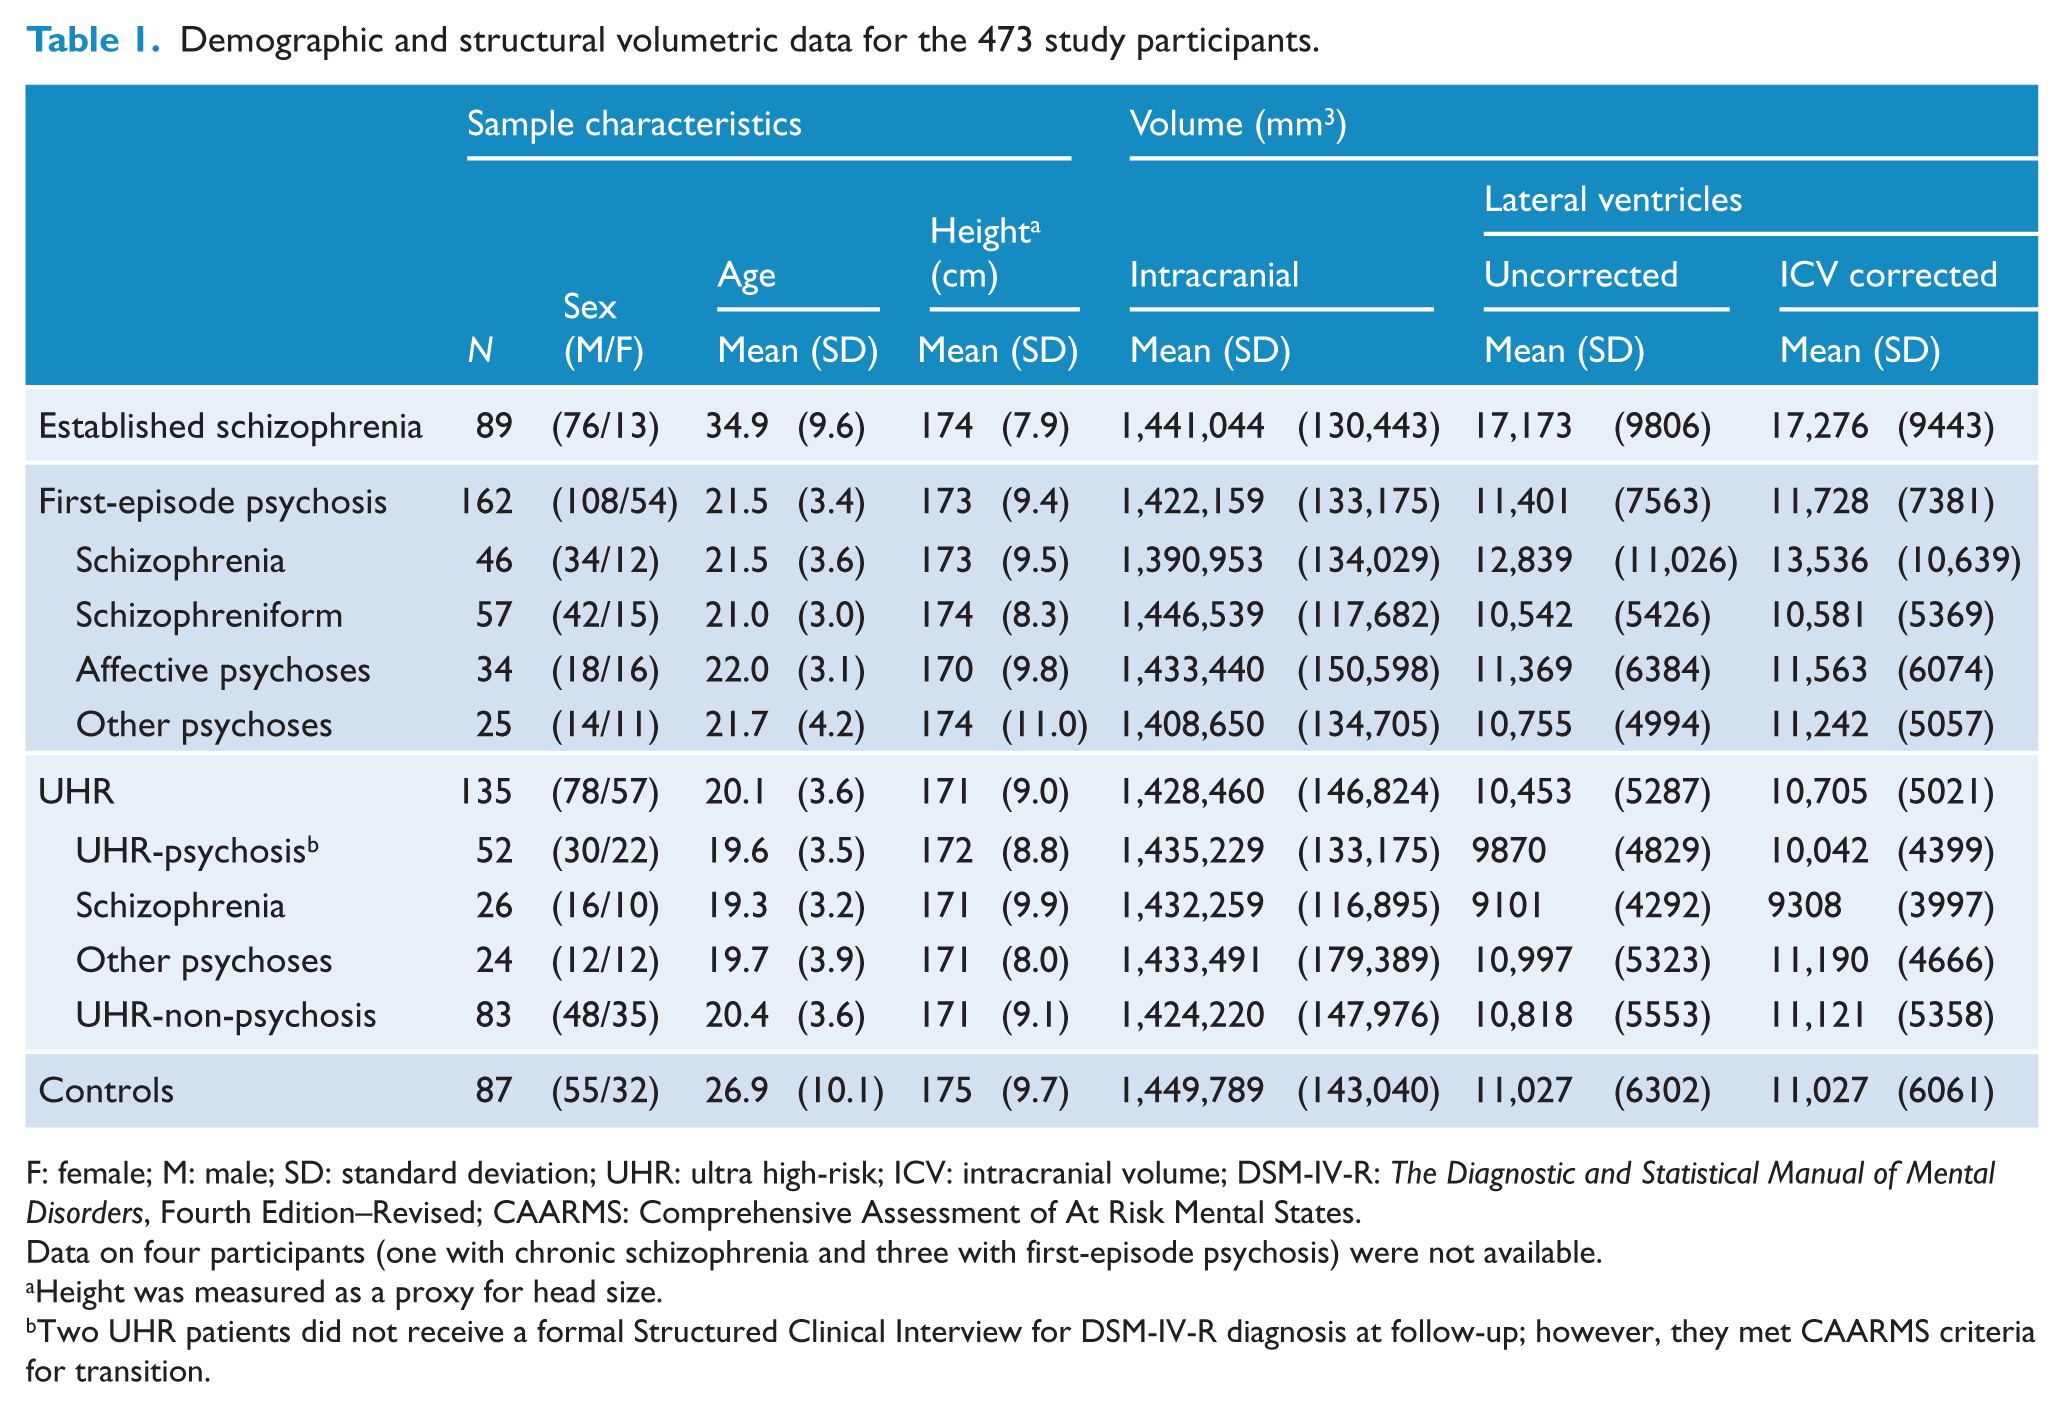
F: female; M: male; SD: standard deviation; UHR: ultra high-risk; ICV: intracranial volume; DSM-IV-R: The Diagnostic and Statistical Manual of Mental Disorders, Fourth Edition–Revised; CAARMS: Comprehensive Assessment of At Risk Mental States.
Data on four participants (one with chronic schizophrenia and three with first-episode psychosis) were not available.
Height was measured as a proxy for head size.
Two UHR patients did not receive a formal Structured Clinical Interview for DSM-IV-R diagnosis at follow-up; however, they met CAARMS criteria for transition.
Totally, 89 Est-SZ patients (76 males, 13 females; mean age: 34.9 ± 9.6 years) were recruited from the Adult Mental Health Rehabilitation services of the North Western Mental Health Program. Est-SZ was defined as those who had more than 18 months of continuous illness. The median illness duration was 12 years (range: 2–46 years).
A total of 162 FEP patients (108 males, 54 females; mean age: 21.5 ± 3.4 years) were recruited from the Early Psychosis Prevention and Intervention Centre (EPPIC), Orygen Youth Health, Melbourne, Australia, and as such met EPPIC intake criteria (McGorry et al., 1996). The inclusion criteria for FEP to this study were (a) age 15–30 years and (b) currently psychotic as determined by the presence of at least one of the following symptoms: hallucinations, delusions, disorder of thinking or speech, or disorganized, bizarre or markedly inappropriate behavior (Velakoulis et al., 1999). FEP participants were divided into four subgroups: (a) first-episode schizophrenia (FE-SZ; n = 46, including first-episode schizoaffective disorder);(b) first-episode schizophreniform psychoses (FE-SZform; n = 57); (c) affective psychoses (n = 34, including bipolar and major depressive disorders with psychotic features); and (d) other psychoses (n = 25).
In total, 135 UHR subjects (78 males, 57 females; mean age: 20.1 ± 3.6 years) who had not experienced a previous psychotic episode and were aged 14–30 years were recruited from the Personal Assessment and Crisis Evaluation (PACE) Clinic, Orygen Youth Health, Melbourne (Phillips et al., 2002; Yung et al., 1996). All UHR participants were required to meet Comprehensive Assessment of At Risk Mental States (CAARMS) criteria (Yung et al., 2005). Of note, there were minor changes to the UHR criteria from 1993 to 1995, when UHR group 3 (trait plus state risk factors) omitted the second-degree relative criterion and operationalized the required decline in functioning. Furthermore, from 1993 to 1999, while the concurrent validity of the CAARMS was being established, psychosis threshold was determined using both the Brief Psychiatric Rating Scale (BPRS)/Comprehensive Assessment of Symptoms and History and the CAARMS (for further details, see Nelson et al., 2013). As part of the current research protocol, all UHR participants were monitored for the onset of psychotic symptoms for at least 12 months. All UHR individuals were again assessed on average 7.5 years later (standard deviation [SD]: 3.2; range: 2.4–14.9 years after presentation to the clinic) as part of a larger study (Nelson et al., 2013). UHR converters were defined as those individuals who at any time during the follow-up period went on to develop a psychotic disorder (termed UHR-P), and non-converters were those who never experienced full-threshold psychosis during the follow-up period (termed UHR-NP). Based on CAARMS criteria for psychosis threshold, 52 UHR patients developed psychosis (UHR-P; 39 during the initial short-term follow-up and another 13 during the long-term follow-up), while 83 did not (UHR-NP). Two UHR participants were deemed to have transitioned based on the CAARMS; however, their psychotic diagnosis (based on DSM-IV) was unknown, thus they were excluded from analyses relatedto diagnostic subgroups. For certain analyses, the UHR-P group were further divided into UHR individuals who later converted and were given a diagnosis of schizophrenia (UHR-SZ) and UHR individuals who converted and were given a schizophrenia-spectrum diagnosis other than schizophrenia (UHR other psychosis).
A total of 87 HC (55 males, 32 females; mean age: 26.9 ± 10.1 years) from a similar demographic region (i.e. greater metropolitan area of Melbourne) as the patients were recruited through auxiliary hospital staff and advertisements.
Psychopathology in the Est-SZ and FEP participants was measured using the Positive and Negative Syndrome Scale (PANSS) (Kay et al., 1987), while the BPRS (Overall and Gorham, 1962) and the Scale for the Assessment of Negative Symptoms (SANS) (Andreasen, 1982) were used to assess psychopathology in the UHR participants. Other clinical information, including handedness, date of illness onset (where available), estimated premorbid IQ (where available) as assessed by the National Adult Reading Test (NART; Nelson and Willison, 1991) and medication data, was obtained from patient interview and detailed chart review.
Totally, 226 patients were treated with antipsychotic medication: 72 were treated with typical antipsychotic medication (31 Est-SZ [34.8%]; 41 FEP [25.3%]); 109 were treated with atypical antipsychotic medication other than clozapine (4 Est-SZ [4.5%]; 105 FEP [64.8%]); 32 patients were treated with clozapine (28 Est-SZ [31.5%]; 4 FEP [2.5%]); 4 patients were treated with typical and atypical antipsychotic medications concurrently (4 Est-SZ [4.5%]; 0 FEP); 9 patients were not prescribed any antipsychotic medication (2 SZ [2.9%]; 7 FEP [4.3%]); and 25 had no medical data available (20 Est-SZ; 5 FEP). Mean chlorpromazine equivalent dose for the Est-SZ and FEP groups were 845.7 mg/day (SD = 696.4) and 219.4 mg/day (SD = 133.6), respectively.
Magnetic resonance imaging acquisition
All Est-SZ, FEP and HC were scanned at the Royal Melbourne Hospital with the same instrument (1.5T Signa; General Electric Medical Systems, Milwaukee, WI). The UHR participants underwent magnetic resonance imaging (MRI) at two separate locations (52 participants at the Royal Melbourne Hospital and 83 at the Royal Children’s Hospital, Melbourne) using identical scanners (1.5T Signa). All participants were scanned with identical sequences (a three-dimensional volumetric spoiled-gradient recalled echo [3D-SPGR]). Comparison of intracranial volumes (ICVs) for scans at the two sites for the UHR sample did not show a significant effect of MRI site (F(1, 133) = 0.03; p = 0.86). Similarly, there was no significant difference in ICV-corrected VV (cVV; see the ‘Statistical analysis’ section for correction method) between the two UHR subgroups who were scanned at different sites (F(1, 133) = 1.65; p = 0.20). Note that, age and sex were not used as covariates as there were no significant differences between the two UHR subgroups (p = 0.30 and 0.28, respectively). (See Supplementary Material for graphical description of cVV distributions of UHR participants by scan-site.)
Each scanner was calibrated fortnightly using the same proprietary phantom to ensure stability and accuracy of measurements over the period of data collection. Calibration was in accordance with the respective hospitals’ and manufacturer’s operating procedures. A 3D-SPGR in the steady-state sequence generated 124 contiguous, 1.5 mm coronal sections. Imaging parameters were as follows: echo time (TE) = 3.3 ms, repetition time (TR) = 14.3 ms, flip angle = 30°, matrix size = 256 × 256, field of view (FOV) = 24 × 24 cm2 matrix and voxel dimensions = 0.938 × 0.938 × 1.5 mm3. ANALYZE 7.5 (Mayo) and MRICRO (www.mccauslandcenter.sc.edu/mricro/) were used to estimate volumes.
ICV
ICV was estimated from a sagittal reformat of the original 3D dataset (Eritaia et al., 2000). The major anatomical boundary was the dura mater. The cerebral contour was traced where the dura mater was not visible. Other landmarks were the undersurfaces of the frontal lobe, the dorsum sellae, the clivus and at the craniovertebral junction, the attachment of the dura to the anterior cutting across to the posterior arch of the C1 vertebra. Inter- and intra-rater intra-class correlation coefficient (ICC) measurements were both 0.99 for 10 randomly selected volumes.
VVs
The volumes of lateral ventricles included the cornu frontale, the pars centralis, the cornu occipitale and the cornu temporale (without the third and fourth ventricles) and were estimated using a semi-automated method, using MRICRO. A seed was first placed at one spot within the ventricle and the intensity threshold was adjusted to grow the seed so that it filled the ventricle maximally. Further seeds were placed in other parts of the ventricle as required to fill the entire ventricle. The extracted voxels were saved as a binary object and then quantified using ANALYZE. Inter- and intra-rater reliabilities were assessed using ICCs and were 0.9740 and 0.9634, respectively.
Statistical analysis
Demographic data between HC, UHR, FEP and Est-SZ were compared using chi-square analyses for sex, one-way analysis of variance (ANOVA) for age, height (a proxy for head size) and NART predicted premorbid IQ (using the Tukey test for post hoc comparisons) and univariate analysis of co-variance (ANCOVA), co-varying for age and sex (using the Sidak test for post hoc comparisons).
ICV was compared between groups using a univariate ANCOVA, with height as a covariate. VVs were log-transformed to obtain a normal distribution and corrected for ICV using a previously described formula (Free et al., 1995): cVV = measured VV − k (measured ICV − mean ICV of control group), where k is the gradient of the regression line between ventricular volume and ICV in control participants. These corrected values were then used for the analyses (described below), which all included sex and age as covariates.
Four sets of univariate ANCOVAs were performed to investigate our hypotheses (within each analysis, patient groups were compared with HC): Analysis 1: comparison of Est-SZ, FEP, UHR; Analysis 2: Comparison of FEP subgroups (first-episode schizophrenia [FE-SZ], schizophreniform disorder [FEP-SZform], affective disorder, other psychoses); Analysis 3: comparison of FEP (all), UHR-P, UHR-NP; and Analysis 4: UHR who developed schizophrenia (UHR-SZ) versus UHR who developed other psychotic disorders.
For univariate ANCOVAs that revealed significant group effects, these analyses were re-run with pairwise comparisons, based on estimated marginal means with Bonferroni correction, which served as post hoc contrasts (Partial Eta squared effect sizes are reported, plus 95% confidence intervals [CIs]). In addition, based on the pattern of results from the above-mentioned analyses, a post hoc cross-sectional linear trend analysis comparing across illness stages, using a univariate ANCOVA with pairwise comparisons, was performed for the schizophrenia diagnoses subgroups (i.e. Est-SZ, FE-SZ, FEP-SZform, UHR-SZ, and 95% CIs of the log cVV will also be reported for these pairwise comparisons).
Antipsychotic medication
A univariate ANCOVA was conducted with sex and age as covariates to compare (log-transformed) cVV among different classes of medication (typical, atypical, clozapine, nil) for the Est-SZ and FEP groups combined, in comparison to HCs. The four participants who were taking a combination of both typical and atypical antipsychotic medications were excluded from this analysis. Furthermore, while comparison of cVV between Est-SZ and FEP participants by medication class is difficult given the uneven and in some instances small numbers in each subgroup, we nonetheless ran a univariate ANCOVA to examine whether the relationship between medication class and cVV differed between these two patient groups.
To explore possible effects of antipsychotic medication dosage, we conducted partial correlations using cVV and CPZ-Eq (controlling for illness duration) for the Est-SZ and FEP groups separately.
Because no UHR participant was prescribed antipsychotic medication at the time of MRI scanning, this group was not included in this comparison.
Correlational analysis
Partial correlations, controlling for age and sex, were used to determine the relationship between (log-transformed) cVV and DOI for Est-SZ and FEP participants.
Results
Sample characteristics
Investigation of demographic variables revealed significant group differences for age (F(3, 469) = 109.627; p < 0.001; mean age in years: Est-SZ 34.9, HC 26.9, FEP 21.5 and UHR 20.1), sex (chi-square = 19.4; p < 0.001; percentage of males: SZ 85.4%, FEP 66.7%, HC 63.2% and UHR 57.8%) and height (F(3, 458) = 4.223; p = 0.006; HC > Est-SZ > FEP > UHR) (see Table 1). NART predicted premorbid IQ was also significantly different between groups (F(3, 368) = 7.18, p < 0.001; HC > UHR > FEP > SZ), which was significant for the Est-SZ (p < 0.001) and FEP (p = 0.004) groups when compared to controls. There was no significant ICV difference found between Est-SZ, FEP, UHR and HC groups (p = 0.103). Levels of overall psychopathology were the following for each patient group, respectively: UHR (N = 97; BPRS: M = 18.59, SD = 7.09; SANS: M = 23.37, SD = 15.74), FEP (N = 131; PANSS: M = 85.43, SD = 17.73) and Est-SZ (N = 47; PANSS: M = 91.06, SD = 24.59). T-test showed no significant difference in total PANSS score between the FEP and Est-SZ groups (t(176) = 1.68, p = 0.095).
Analysis of VVs
Comparison of cVVs between the three main groups revealed a significant group effect (Analysis 1: F(3, 467) = 7.165; p < 0.001; Table 2; Figure 1). Post hoc pairwise comparisons found 36.2% larger cVVs in Est-SZ compared to HC (p < 0.001). In contrast, there were no statistically significant group differences in cVV for the FEP (6.0% difference; p = 0.687) or UHR group (−3.0% difference; p > 0.99) when compared to HC participants.
Log-transformed ventricular volumes of healthy controls and patients.
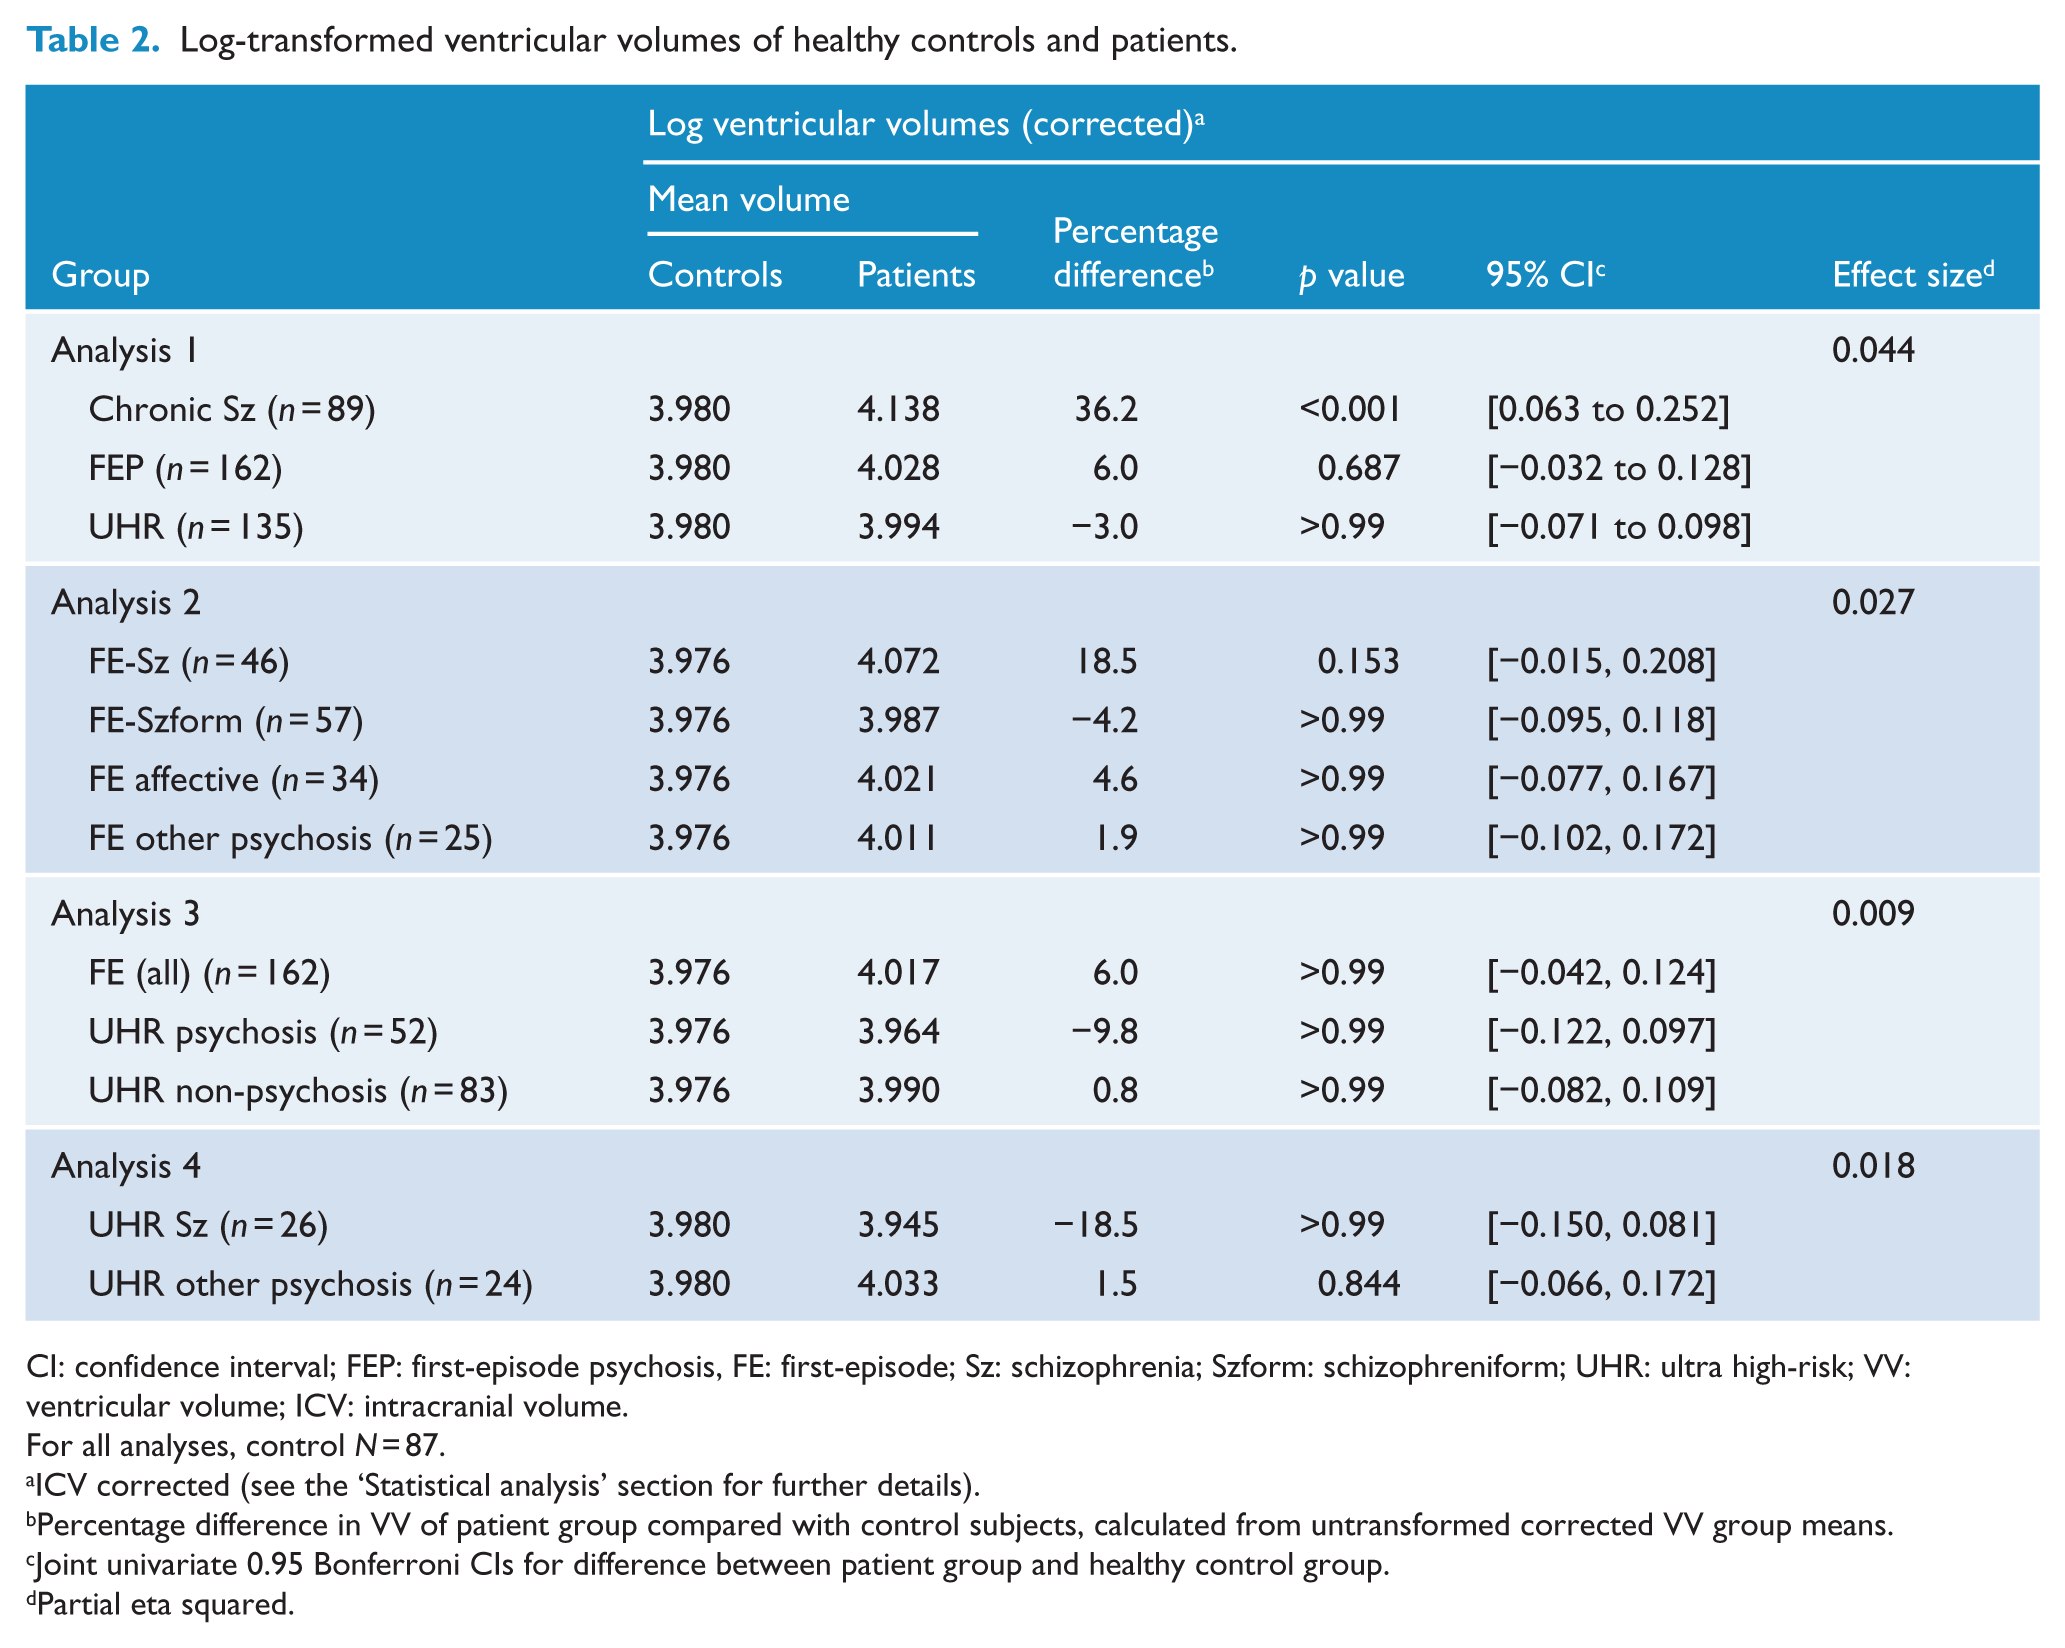
CI: confidence interval; FEP: first-episode psychosis, FE: first-episode; Sz: schizophrenia; Szform: schizophreniform; UHR: ultra high-risk; VV: ventricular volume; ICV: intracranial volume.
For all analyses, control N = 87.
ICV corrected (see the ‘Statistical analysis’ section for further details).
Percentage difference in VV of patient group compared with control subjects, calculated from untransformed corrected VV group means.
Joint univariate 0.95 Bonferroni CIs for difference between patient group and healthy control group.
Partial eta squared.
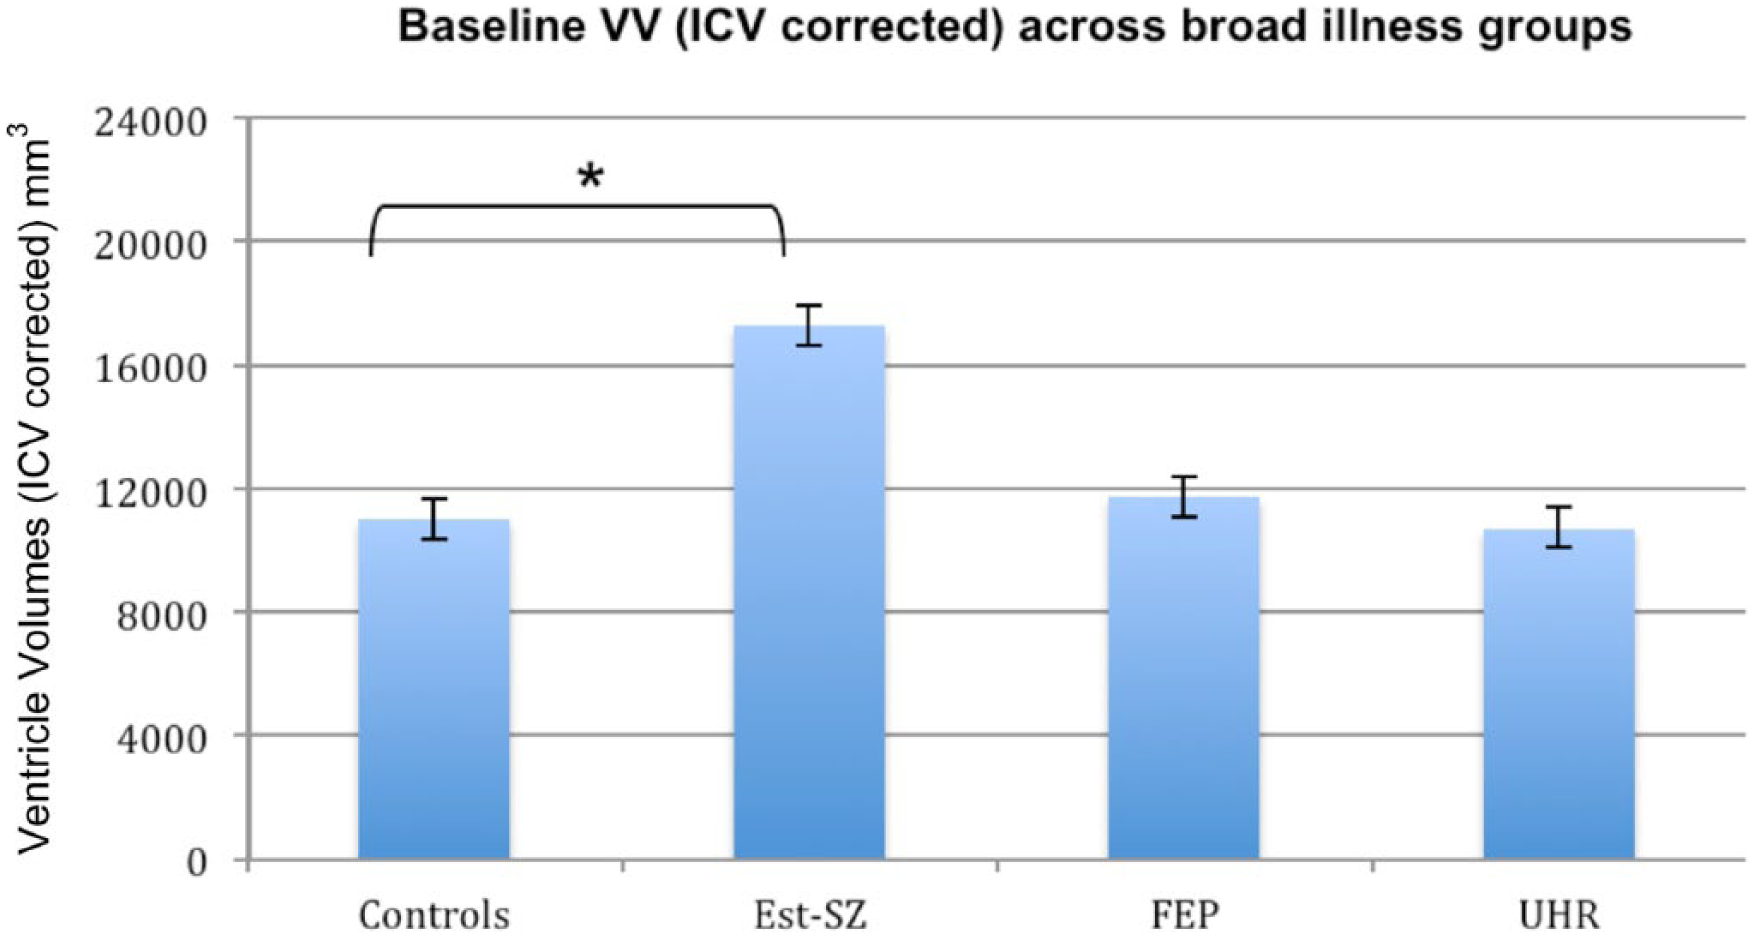
ICV-corrected mean ventricular volumes (mm3) and mean standard error for the main illness groups (Analysis 1). Cross-sectional univariate ANCOVA showed a significant group effect (p < 0.001). Pairwise comparisons with Bonferroni correction found that the Chronic SZ group had significantly larger lateral ventricles than healthy control participants (*p < 0.001).
Comparison of cVVs within FEP diagnostic subgroups revealed no significant group effect (Analysis 2: F(4, 242) = 1.710; p = 0.148), although the FE-SZ group displayed cVVs that were 18.5% larger than controls. The percentage difference in cVVs for each of the patient groups in comparison to HC is shown in Table 2 and Figure 2. In summary, compared with HC, lateral cVVs were significantly enlarged in the Est-SZ group, but not in FE-SZ, FE-SZform disorder, other first-episode psychosis, UHR-P or UHR-NP groups.
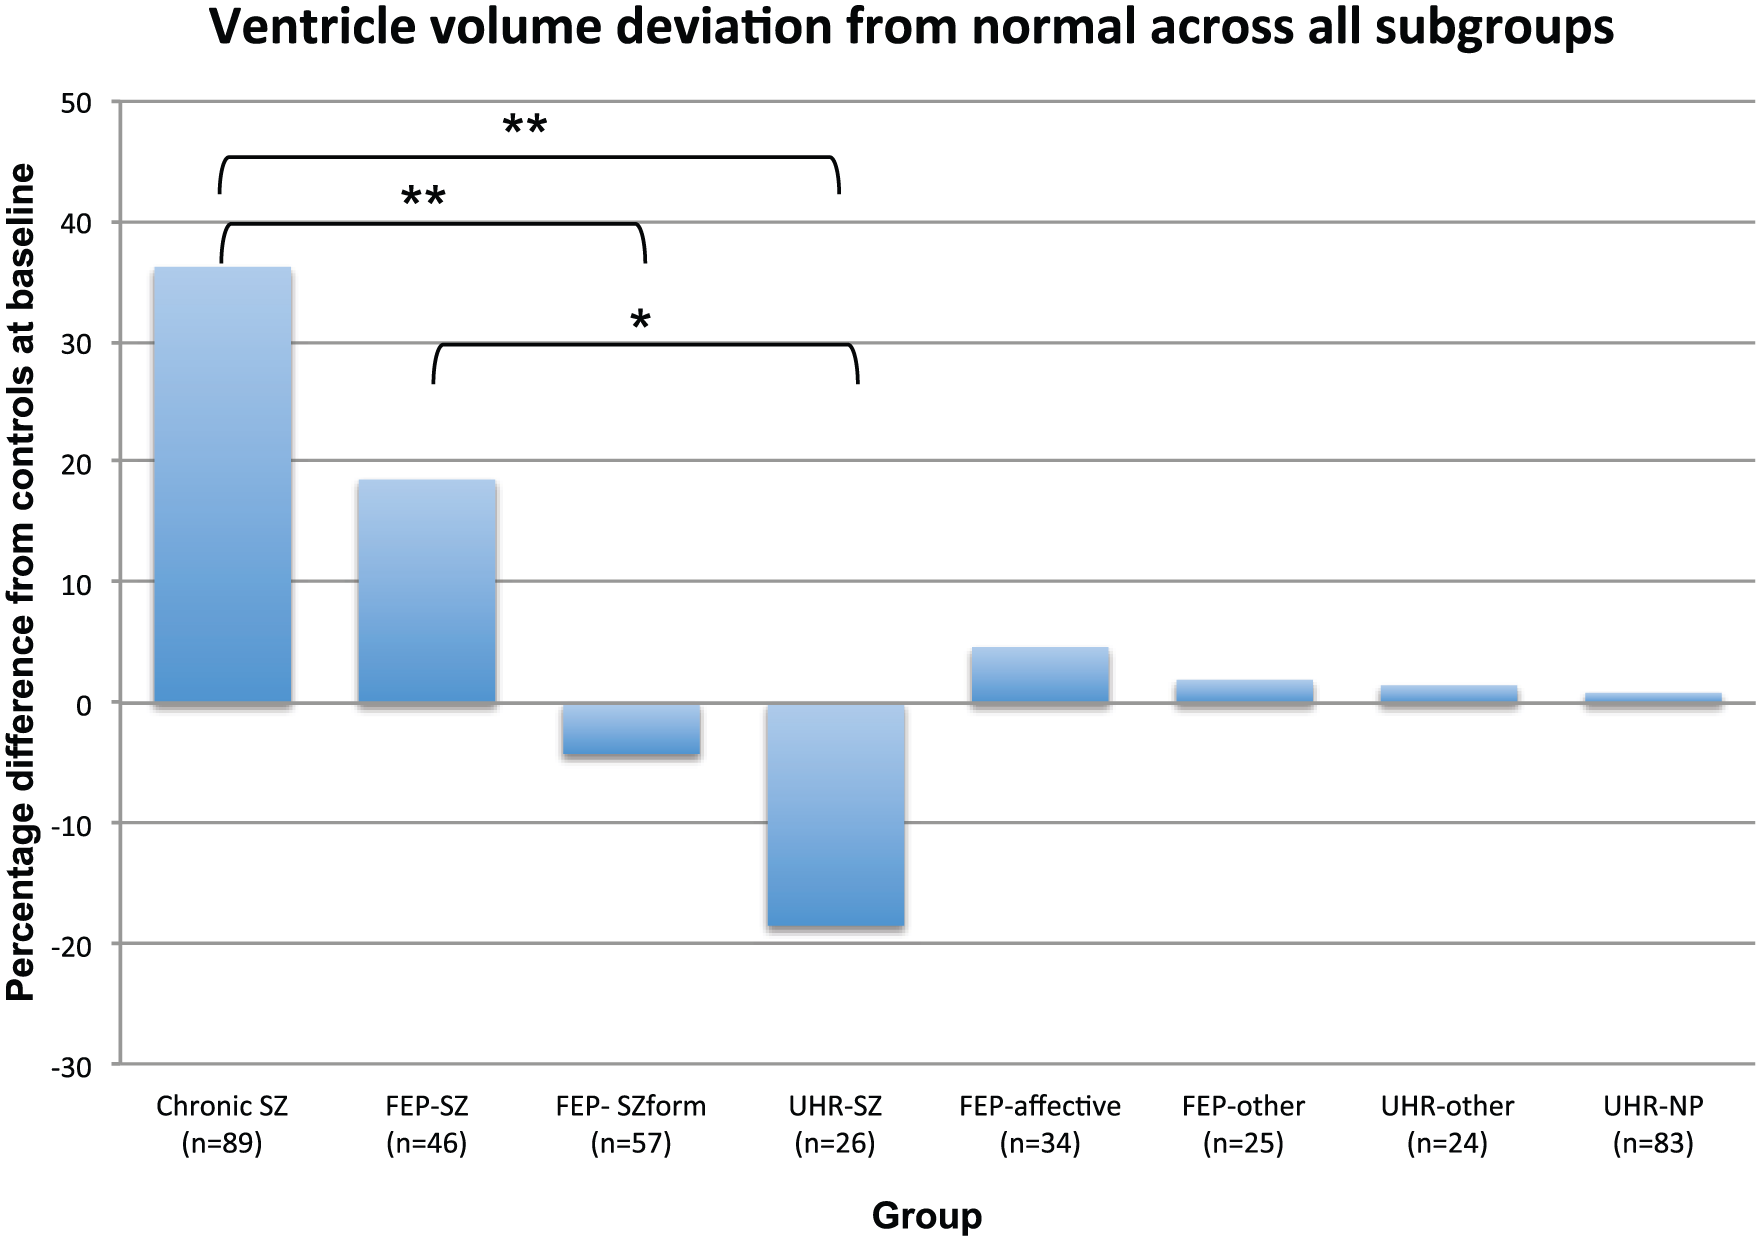
Percentage of ventricular volume difference relative to healthy controls for each subgroup. Cross-sectional analysis of schizophrenia-spectrum diagnoses subgroups revealed a significant linear trend from UHR to chronic schizophrenia (p < 0.01), whereby log-transformed ventricular volumes (ICV corrected) increased with each schizophrenia illness stage (note: percentage difference relative to controls is shown for interpretation purposes; see Supplementary Material for graphical depiction of ICV-corrected VV [mm3] means and mean standard error for all subgroups). *p < 0.05, **p < 0.01 for post hoc pairwise comparisons with Bonferroni correction.
Comparison of cVVs between HC, FEP, UHR-P and UHR-NP revealed no significant group effect (Analysis 3: F(3, 378) = 1.109; p = 0.345; see Table 2). Direct comparison of cVVs between UHR who were later diagnosed with schizophrenia and UHR who were later diagnosed with another psychotic disorder did not reveal any significant group effect (Analysis 4: F(2, 132) = 1.109; p = 0.307; see Table 2).
Trend analysis of schizophrenia subgroups
Examination of cVV for the schizophrenia subgroups across stages of illness (i.e. Est-SZ, FE-SZ, FEP-SZform, UHR-SZ) revealed a significant linear trend from UHR to chronic schizophrenia, whereby cVVs increased with each schizophrenia illness stage (F(3, 212) = 4.26; p = 0.006; see Table 2 and Figure 2). Pairwise comparisons showed that the Est-SZ group displayed significantly larger cVV in comparison to FEP-SZform (p = 0.006; CIs = [0.040, 0.233]) and UHR-SZ (p = 0.003; CIs = [0.062, 0.301]). Furthermore, the FE-SZ group displayed significant VE relative to UHR-SZ subgroup (p = 0.018; CIs = [0.023, 0.236]), and VE approached significance in comparison to the FEP-SZform subgroup (p = 0.053; CIs = [−0.001, 0.170]).
Effects of class of antipsychotic medication
Overall, the univariate ANCOVA revealed a significant effect of class of medication on cVV (F(4, 302) = 5.535; p < 0.001). Post hoc pairwise comparisons showed that psychotic patients (both Est-SZ and FEP pooled) prescribed typical antipsychotics (p = 0.005) or clozapine (p = 0.001) had significantly larger cVVs than the HC group. In addition, the clozapine-treated participants displayed VE in comparison to participants prescribed other atypical antipsychotic medications (p = 0.035). Univariate ANCOVA comparing cVV of Est-Sz and FEP patients showed that there was no group by medication class interaction (p = 0.489). Partial correlations between cVV and CPZ-Eq did not reveal any significant relationship for either the Est-SZ (p = 0.095) or the FEP (p = 0.922) group.
Correlational analysis
DOI
DOI was not correlated with cVV for either the Est-SZ (degrees of freedom [df] = 84, p = 0.343) or the FEP (df = 156, p = 0.583) group.
Discussion
This study confirms that patients with Est-SZ have significantly enlarged ventricles (36.2%) compared to HCs. We found no statistically significant differences in cVVs between HCs and the FEP or UHR patients (irrespective of transition status), or any of the diagnostic subgroups. However, our linear trend analysis showed that for those individuals with a schizophrenia presentation (i.e. schizophreniform or schizophrenia disorder), there was an increase in cVVs between groups, which corresponded to advancing stages of the illness (i.e. UHR-SZ < FEP-SZform < FE-SZ < Est-SZ). Furthermore, this analysis showed that patients with chronic schizophrenia and patients with FE-SZ had significant VE compared with UHR who subsequently developed schizophrenia. The chronic schizophrenia group also displayed VE in comparison to FE-SZform disorder. Thus, our study provides evidence that no marked VE is present during the earliest illness stages (i.e. UHR and FEP), but that the onset of psychosis may be the time point where the ventricles begin to enlarge and progress for those who go on to develop schizophrenia specifically, although the timing of VE cannot be clarified from our data.
As expected, Est-SZ participants had cVVs that were significantly larger than HCs, which is consistent with the literature in this area (Kempton et al., 2010; Pantelis et al., 2005). However, we unexpectedly found that cVVs in the FEP group did not differ significantly from HCs, despite our large sample size (N = 162). Worth noting, our FEP subgroup that met criteria for schizophrenia (N = 46) had a mean VE of 18.5% relative to HCs (Cohen’s d = −0.443), which, though non-significant (p = 0.153), is in line with two recent meta-analyses of VVs in FE-SZ (Steen et al., 2006; Vita et al., 2006). Thus, we may have been underpowered to detect significant differences in this specific subgroup (post hoc power analysis suggests that we had 80% power to detect a medium effect size [i.e. f = 0.245] when comparing the FEP-SZ group to the HC group; G*Power v3.1.3). These meta-analyses, which found small to moderate effects (e.g. composite d ranged from −0.323 to −0.608 (Vita et al., 2006)) with large samples (N = 200+ patients) and comprised primarily of FEP individuals with schizophrenia-spectrum disorders, are further supported by our linear trend findings and implicates VE as being specific to an outcome diagnosis of schizophrenia. An alternative explanation for the lack of VE in our FEP sample may be related to the characteristics of the sample differing to those of previous studies. In particular, our FEP patients were help-seeking and enrolled in a specialized early psychosis service and it is possible they were higher functioning than other previous FEP sample populations. However, as implied by the mean PANSS psychopathology scores of our FEP group (M = 85.43, SD = 17.73), which is considered to be in the ‘markedly to severely ill’ range (Leucht et al., 2005), and which was not statistically different to our Est-SZ group, severity of overall symptomatology is less likely an explanatory factor. Future research should examine the direct and indirect relationships between symptom severity, general functioning and VVs across illness stages.
Our finding that the UHR group, irrespective of transition status, displayed no VE is in line with the majority of previous research conducted in genetic and clinical high-risk populations (Cannon et al., 1998; Lawrie et al., 1999, 2001, 2002; Ziermans et al., 2009). The mean percentage difference in cVV for our UHR groups is intriguing, in particular for our UHR-SZ group (−18.5%), as cVVs tended to be reduced relative to HCs (see Figure 2). While this was a non-significant numerical difference, there appeared to be a small effect (Cohen’s d = 0.330). We assume that we were underpowered with an N of only 26 in this UHR subgroup. Nonetheless, a speculative explanation of reduced VV could be that during the schizophrenia prodrome, cells and tissue of the periventricular area undergo subtle swelling (Von Hohenberg et al., 2014), which may potentially be the result of an active neurochemical or immunological process, such as neuroinflammation and/or neurotoxicity (Cropley et al., 2013; Cropley and Pantelis, 2014; Pantelis et al., 2005). To speculate further, a putative inflammatory or immune response may be illness stage-specific, as there was no trend for reduced VVs in our FEP sample. We have recently theorized that swelling may be an initial response to an acute stressor during the prodromal phase, a phase associated with hyperdopaminergic and hyperglutamatergic state (Schobel et al., 2013), which may subsequently lead to excessive cortical gray matter loss following transition to psychosis. Furthermore, a recent study of increased niacin sensitivity in adolescents at UHR for psychosis is suggestive that the UHR state may be associated with a ‘pro-inflammatory state’, whereas most niacin studies in Est-SZ present with impaired niacin sensitivity (Berger et al., 2016). Further research with a larger sample is needed to determine whether dynamic changes in brain volume (including swelling) are associated with changes in VVs in the context of psychosis onset and/or exacerbation (Cropley et al., 2013; Cropley and Pantelis, 2014).
An alternative explanation for the lack of significant group differences for our (and other) UHR samples may relate to the heterogeneity of this population. It is well known that there is great variability in terms of illness course in UHR, with a significant proportion of individuals never developing a psychotic illness (about two-thirds) and/or going on to have poor outcomes in general. In terms of VVs, the SD from the mean was large in our UHR groups (although comparable to previous UHR research (Ziermans et al., 2009)), further suggestive of within-group diversity. It may be that VE is associated with only a sub-type within the schizophrenia-spectrum population, which may be dependent on the presence of one or several unknown genetic, neurobiological and/or environmental factors, and it may be that these factors were more prevalent in our Est-SZ group. However, given that within-group variation of cVV in our UHR (and FEP) groups was not larger relative to our Est-SZ group (which in turn is comparable to previous research in Est-SZ (Nopoulos et al., 1997)), the overall evidence suggests VE is more likely a consequence of illness progression than a pre-existing condition for a subgroup of individuals. Longitudinal research is needed to not only identify the precipitators, mediators/moderators and underlying mechanisms that drive VV changes, but to elucidate the timing of VV change. In the initial cross-sectional comparison study by Ziermans et al. (2009), mean VVs between converters and non-converters did not differ, but over a subsequent 2-year follow-up, those who progressed to a first psychotic episode (UHR-P) showed a small but significant VE that was not seen in the group that did not convert to psychosis (UHR-NP; Ziermans et al., 2012). Cannon et al. (2015) similarly found no baseline group differences in VV; however, over the 1-year follow-up, the UHR-P group showed significantly greater expansion of the third ventricle than the UHR-NP and control groups.
Limitations of this study relate to the effects of medication and the impact of DOI. The analyses in our study are consistent with the notion of a somewhat differential effect of typical versus atypical antipsychotics on brain structure over time (Ansell et al., 2014; Lieberman et al., 2005), although our analyses are confounded by differences in DOI across these medication types, i.e., patients with chronic schizophrenia were more likely to be on typical antipsychotics or to have been treated with such drugs over a long period (such data were not available for the analysis). As with our main analyses, we may have been underpowered to detect significant effects of atypical antipsychotics on VV, as the debate regarding the putative protective versus damaging effects of these second generation antipsychotics on the brain, especially over long time periods, is very much ongoing (Ho et al., 2011; Lesh et al., 2015; Lieberman et al., 2005). Contrary to our expectation, we did not find a relationship between DOI and cVV for either the FEP or Est-SZ groups. This suggests that VV change may not be associated with time as an independent factor (i.e. it does not accelerate at a constant rate), but potentially with time as a function of illness progression, implying that VV changes may be illness stage-specific where volume loss progression occurs in unison with diagnostic/behavioral illness progression (Bartholomeusz et al., 2016; McGorry et al., 2014). Notwithstanding this, it is also possible that this result was confounded due to high colinearity between DOI and our covariate age, which were strongly and significantly correlated (Pearson’s r = 0.82, p < 0.001). Furthermore, information on duration of untreated psychosis was not available, which may be relevant to VE, as suggested by others (Keshavan et al., 1998). Furthermore, while we included sex (and age) as covariates in our analyses, males were overrepresented in our Est-SZ sample, and evidence suggests that VE may be more pronounced in this demographic group (Nopoulos et al., 1997).
We also did not examine the impact of comorbid illnesses, which may have confounded our VV findings given that comorbidity, especially depression and anxiety disorders, tend to be highly prevalent in emerging psychosis (Cotton et al., 2012; Sonmez et al., 2014), including in this UHR sample (Lin et al., 2015). Indeed, meta-analysis shows that individuals with major depressive disorder or bipolar affective disorder display significant VE in comparison to HCs (Kempton et al., 2011). Despite this, an earlier meta-analysis that directly compared individuals with bipolar disorder (considered by some researchers to be analogous to psychotic illness) to schizophrenia patients suggested that VE is significantly more pronounced in Est-SZ (Arnone et al., 2009). Thus, further research into the specificity of VE is needed (for discussion, see Bartholomeusz and Pantelis, in press).
This was a cross-sectional study, which did not allow for consideration of confounding factors (e.g. pharmacological treatments/psychosocial interventions) that may have impacted illness outcomes, in particular, transition status of our UHR sample post baseline assessment. As mentioned above, longitudinal designs, with multiple scan time-points and which are initiated from the earliest possible pre-illness-onset stage, are needed (Bartholomeusz et al., 2016). Finally, while we found no site-specific difference in ICV, and potential scanner-related variability across groups was expected to be similar (given participants from all groups were recruited and assessed over the whole period of data collection, including the control participants), there are possible scanner-related variations that were unaccounted for.
Concluding remarks
The findings in this study suggest that VE is not a feature of the earliest stages of psychosis and schizophrenia (immediately preceding and immediately after psychosis onset), rather it is most apparent in patients with Est-SZ. In light of the Royal Australian and New Zealand College of Psychiatrists adopting a clinical staging framework for recommending guidelines in clinical practice (Galletly et al., 2016), it is possible that the discovery of stage-specific neurobiological anomalies may aid in guiding treatment in the future. This would be particularly useful for the UHR syndromes and FEP stage of illness, where diagnosis and prognosis can be more difficult to determine clinically. Future work in this area should concentrate on long-term outcomes, the impact of episodes of illness exacerbation and remission (Cropley et al., 2013; Cropley and Pantelis, 2014), and examining the role of inflammatory markers (Berger et al., 2016) and the potential effects of neuroprotective agents (Berger et al., 2007, 2012).
Footnotes
Acknowledgements
G.E.B. and C.F.B. are joint first authors and contributed equally to the writing of the manuscript. Neuroimaging analysis was facilitated by the Neuropsychiatry Imaging Laboratory managed by Ms Bridget Soulsby at the Melbourne Neuropsychiatry Centre and supported by Neurosciences Victoria.
Declaration of Conflicting Interests
G.E.B. was supported by a Young Investigator award from the Swiss National Science Foundation (University of Basel, Switzerland) and a research fellowship from the M & W Lichtenstein Foundation. C.F.B. was supported by a NHMRC Clinical Research Fellowship (567042) and a University of Melbourne Department of Psychiatry John and Betty Lynch Fellowship. A.L. was supported by a NHMRC Early Career Fellowship (1072593). S.K.W. was supported by a NHMRC Clinical Career Developmental Award (359223) and a NARSAD Young Investigator Award. B.N. was supported by a NHMRC Career Development Fellowship (1027532) and NARSAD Independent Investigator Award. A.R.Y. was supported by a NHMRC Senior Research Fellowship (566593). W.J.B. was supported by a NHMRC Career Development Fellowship (454792). P.D.M. and C.P. were each supported by NHMRC Senior Principal Research Fellowships (P.D.M.: 1060996; C.P.: 628386 and 1105825) and NARSAD Distinguished Investigator Awards.
Funding
This study was supported by National Health and Medical Research Council of Australia (NHMRC) Project (209062) and Program Grants (350241, 566529), and by the Colonial Foundation.
References
Supplementary Material
Please find the following supplemental material available below.
For Open Access articles published under a Creative Commons License, all supplemental material carries the same license as the article it is associated with.
For non-Open Access articles published, all supplemental material carries a non-exclusive license, and permission requests for re-use of supplemental material or any part of supplemental material shall be sent directly to the copyright owner as specified in the copyright notice associated with the article.