
Abstract
Objective:
Socioeconomic status as a determinant of mental health problems has received scant attention in Japan, which has long been considered an egalitarian society. This study examined the association between socioeconomic status and psychological distress and its trends over 6 years among Japanese adolescents.
Methods:
We used data from a nationally representative sample of 9491 adolescents aged 12–18 years who participated in three repeated cross-sectional surveys between 2007 and 2013. The K6 scale was used to assess psychological distress. Socioeconomic status indicators included household income, parental education, parental working status and household structure.
Results:
Psychological distress prevalence decreased significantly from 2007 (10.7%) to 2013 (7.6%). However, the socioeconomic status patterns of psychological distress were consistent through the study period. Adolescents living in both lower (odds ratio = 1.61; 95% confidence interval = [1.27, 2.05]) and higher income households (odds ratio = 1.30; 95% confidence interval = [1.03, 1.62]) were more likely to report psychological distress than their middle-income counterparts. Adolescents with low household income were more likely to feel stress from interpersonal relationships and less likely to have help-seeking behaviors, while those with high household income were more likely to feel stress about school achievement. Psychological distress was also associated with parental poor education and single parenthood.
Conclusions:
Socioeconomic status disparities in adolescent psychological distress were evident and consistent during the 6-year period. There is a unique U-shaped relationship between household income and psychological distress among adolescents in Japan, unlike those from other countries. However, the underlying mechanisms may differ by income status. Future prevention efforts should consider socioeconomic status as a determinant of adolescent mental health problems.
Introduction
Adolescent mental health problems are a major challenge for public health worldwide (World Health Organization [WHO], 2012) because they lead to significant impairments in psychosocial and school functioning (Wille et al., 2008). They also often lead to future psychopathology and associated suicides (Copeland et al., 2009). Reviews have estimated that about one adolescent in five has a mental disorder (Roberts et al., 1998). However, no previous population-based epidemiological study in Japan has examined the prevalence of mental disorders among adolescents, although suicide is the leading cause of death among the 15–19 age group in this country (Ministry of Health, Labour and Welfare, 2015). Kessler et al. (2005) reported that the onset of three-fourths of all lifetime cases of mental disorders is by age 24. Thus, preventive strategies need to focus on adolescents to reduce lifetime risk of mental disorders.
Low family socioeconomic status (SES) is recognized as a risk factor for adolescent mental health problems throughout high-income countries (Amone-P’Olak et al., 2011; Demir et al., 2011; Holstein et al., 2009; McLaughlin et al., 2012). A recent systematic review of 55 cross-sectional and longitudinal studies published between 1990 and 2011 showed that 52 studies indicated an inverse relationship between SES and mental health problems in children and adolescents (Reiss, 2013). This review also showed that low household income and poor parental education were stronger predictors of offspring’s mental health problems than other SES indicators such as parental unemployment and low occupational status (Reiss, 2013).
In Japan, only recently have SES health disparities been addressed in public health research (Kagamimori et al., 2009) because Japan has long been considered an egalitarian society (Marmot and Smith, 1989). However, a growing body of evidence suggests widening socioeconomic disparities and their adverse health impacts (Kachi et al., 2013). Thus far, studies of adult health disparities dominate the evidence. Limited studies of adolescent health disparities were conducted and, in addition, focused only on physical health such as obesity (Kachi et al., 2015), that is, we know of no studies regarding adolescents’ mental health in Japan.
This study examined (1) SES disparities in the prevalence of psychological distress (PD) and (2) 6-year trends of such disparities among a nationally representative sample of Japanese adolescents aged 12–18 years. We hypothesized that (1) PD would be more prevalent among socioeconomically disadvantaged adolescents and (2) such disparities widened along with the widening income gap. We used a range of SES indicators, but focused on household income since it may be most strongly associated with PD (Reiss, 2013).
We additionally examined the association between household income and stress-related factors such as interpersonal problems with family and/or friends and bullying. This was an attempt to explain the income differences in PD based on neuroimaging and epidemiological studies suggesting that adolescents at lower SES levels experience more stressful life events and use less positive coping strategies (e.g., help-seeking and relaxation). Stressful life events and coping strategies mediate the association between SES and mental health problems (Amone-P’Olak et al., 2009; Glasscock et al., 2013; Luby et al., 2013).
Methods
Subjects and data collection
We used pooled data from the 2007, 2010 and 2013 Comprehensive Survey of Living Conditions conducted by the Ministry of Health, Labour and Welfare (2009–2015). Every 3 years since 1986, this nationally representative survey of households in Japan has collected detailed information on household demographics, health status, income and assets. A question about PD has been included in the survey since 2007; therefore, 2007, 2010 and 2013 data were used for this study. Eligible respondents include all members (aged 0 or older) of households within census tracts that were randomly selected from prefectures and designated cities with populations over 500,000 people. The survey is completed on household demographics and health status across approximately 5500 census tracts (5440 in 2007, 5510 in 2010, 5530 in 2013) that include approximately 300,000 households (287,807 in 2007; 289,363 in 2010; 295,367 in 2013), from which it randomly selects and further surveys roughly 40,000 households (36,285 in 2007; 35,971 in 2010; 36,419 in 2013) on income and assets. Trained personnel collect data through a combination of interviews and self-administered questionnaires. Response rates for the household demographics and health status survey were 79.9%, 79.1% and 79.4% in the 2007, 2010 and 2013 surveys, respectively. Those for the income and assets survey were 64.8%, 72.6% and 72.5% in the 2007, 2010 and 2013 surveys, respectively.
We restricted our analyses to 12,206 adolescents aged 12–18 years whose households were surveyed on income and assets. Of these, we excluded 2715 adolescents with missing variables of interest. A total of 9491 adolescents (n = 2849 for 2007; n = 3224 for 2010; n = 3418 for 2013) were included in this study. Compared to the final sample (n = 9491), the excluded sample (n = 2715) was younger, more likely to be female and more likely to live in lower income households (all p < 0.05). We obtained permission from the Ministry of Health, Labour and Welfare to use data from the survey (approved 27 July 2015; approval number 0727-3). Ethical approval was not required as the research involved retrospective analysis of a national survey dataset that was free of personally identifiable information.
PD
PD was measured by adolescent reports using the Japanese version of the K6, a self-rated six-item scale that screens for any Diagnostic and Statistical Manual of Mental Disorders–Fourth Edition mood or anxiety disorders (Furukawa et al., 2008; Kessler et al., 2002). The scale asks how often respondents have experienced symptoms of nonspecific PD during the past 30 days (e.g., ‘Did you feel nervous?’). Each item was scored on a 5-point Likert scale (0 = none of the time; 4 = all of the time). The total scores ranged from 0 to 24, with higher scores indicating greater PD. On the basis of a previous validation study (Furukawa et al., 2008), we used a cut-off point of ⩾9 to define PD. Those with PD accounted for approximately 10% of the sample.
The scale has adequate reliability and validity for use with adolescents (Green et al., 2010; Peiper et al., 2015). In our sample, the factor analysis confirmed its unidimensional structure (total variance explained by initial eigenvalue = 66% for 2007; 68% for 2010; 67% for 2013). It also showed high internal consistency (Cronbach’s alpha = 0.90 for 2007; 0.90 for 2010 data; 0.90 for 2013).
SES
SES indicators, such as household income, parental educational attainment, parental working status and household structure, were assessed via parent reports on the self-administered questionnaires. Each SES indicator was chosen and categorized consistent with previous Japanese studies (Kagamimori et al., 2009; Ueda et al., 2014). Although household structure is not strictly an SES indicator, it was included because it has been associated with income level (Kachi et al., 2014).
Household income was adjusted for household size by summing the annual income—after taxes, social security premiums and social transfers—of all household members and then dividing this sum by the square root of the household size. We divided the subjects equally into quintiles of household income in each survey. Parental educational attainment was categorized into six groups: (1) primary or junior high school, (2) high school, (3) vocational school, (4) 2-year college, (5) 4-year college/graduate degree and (6) unknown (not living with father or mother). Parental working status was categorized into five groups: (1) employed permanently (full-time permanent employees), (2) employed precariously (part-time, dispatched, contract or other employees), (3) self-employed, (4) economically inactive (the majority are female homemakers) and (5) unknown (not living with father or mother). Employment status was divided into permanent or precarious because precarious employment is more associated with low income level than permanent employment (Kachi et al., 2014). Household structure was classified into four categories: (1) couple parents, (2) single parent, (3) three-generation (comprising one or more children, one or two parents and one or two grandparents) and (4) other multi-person.
Stress-related factors
Perceived stress was assessed with the question ‘Do you feel stress in your daily life: yes or no?’ If respondents answered ‘yes’, they were further asked about the stressors with 19 response options (multiple answers possible). We selected five response options regarding possible stressors for adolescence: (1) interpersonal relationships with family members, (2) interpersonal relationships with persons outside the family, (3) school achievement, (4) bullying and (5) household financial situation. The ‘yes’ respondents were also asked about help-seeking behaviors with 11 response options (multiple answers possible). We selected five response options: (1) consulting with family members, (2) friends or (3) teachers; (4) having no one to consult; and (5) does not know where to consult.
Statistical methods
We first described the PD distribution by demographic and SES indicators for each survey year. Next, a multilevel logistic regression model was applied to pooled data from the three surveys to examine the associations between each SES indicator and PD because of the hierarchical data structure with adolescents (level 1) nested within households (level 2). Observations were correlated among adolescents from the same household because they shared similar household characteristics. The multilevel method accounts for this non-independence of observations within groups (Snijders and Bokser, 2012). Because SES indicators are associated with each other (i.e. lower educational attainment leads to lower labor market position, which results in lower income level; Galobardes et al., 2006), separate models were constructed for each SES indicator to avoid over-adjustment. The models were adjusted for age, gender, number of siblings and survey year. We included the number of siblings as a potential confounder in the models because the presence of siblings may positively affect mental health through some supportive or socializing benefit (Lawson and Mace, 2010). Interactions of the survey year with each SES indicator were included separately in the adjusted model to determine whether the SES patterns of PD changed significantly over the study period. Finally, we estimated the percentages of perceived stress, stressors and help-seeking behaviors among household income groups to explain the income differences in PD using a multilevel logistic regression model. Data of male and female adolescents were pooled because there was no strong evidence for gender-specific associations (Reiss, 2013) and no interactions between gender and any SES indicator in our data (p > 0.05). All statistical tests were two-sided with a 5% significance level. All analyses were conducted using SAS Version 9.3 for Windows (SAS, Inc., Cary, NC, USA).
Results
Prevalence of PD
The overall prevalence of PD among adolescents decreased gradually over the 6-year period (10.7% in 2007, 9.7% in 2010 and 7.6% in 2013). The distribution of PD by demographic and socioeconomic characteristics was similar between survey years (Table 1). The prevalence of PD increased with age (range 5.0%–15.3% in 2007, 5.6%–13.2% in 2010, 3.9%–11.1% in 2013), was higher in female than male adolescents (11.6% vs 9.8% in 2007, 11.0% vs 8.7% in 2010, 8.4% vs 7.1% in 2013) and was lowest among those with one sibling (10.0% in 2007, 8.7% in 2010, 7.1% in 2012).
Characteristics of adolescents aged 12–18 years by survey year: CLSC 2007–2013, Japan.
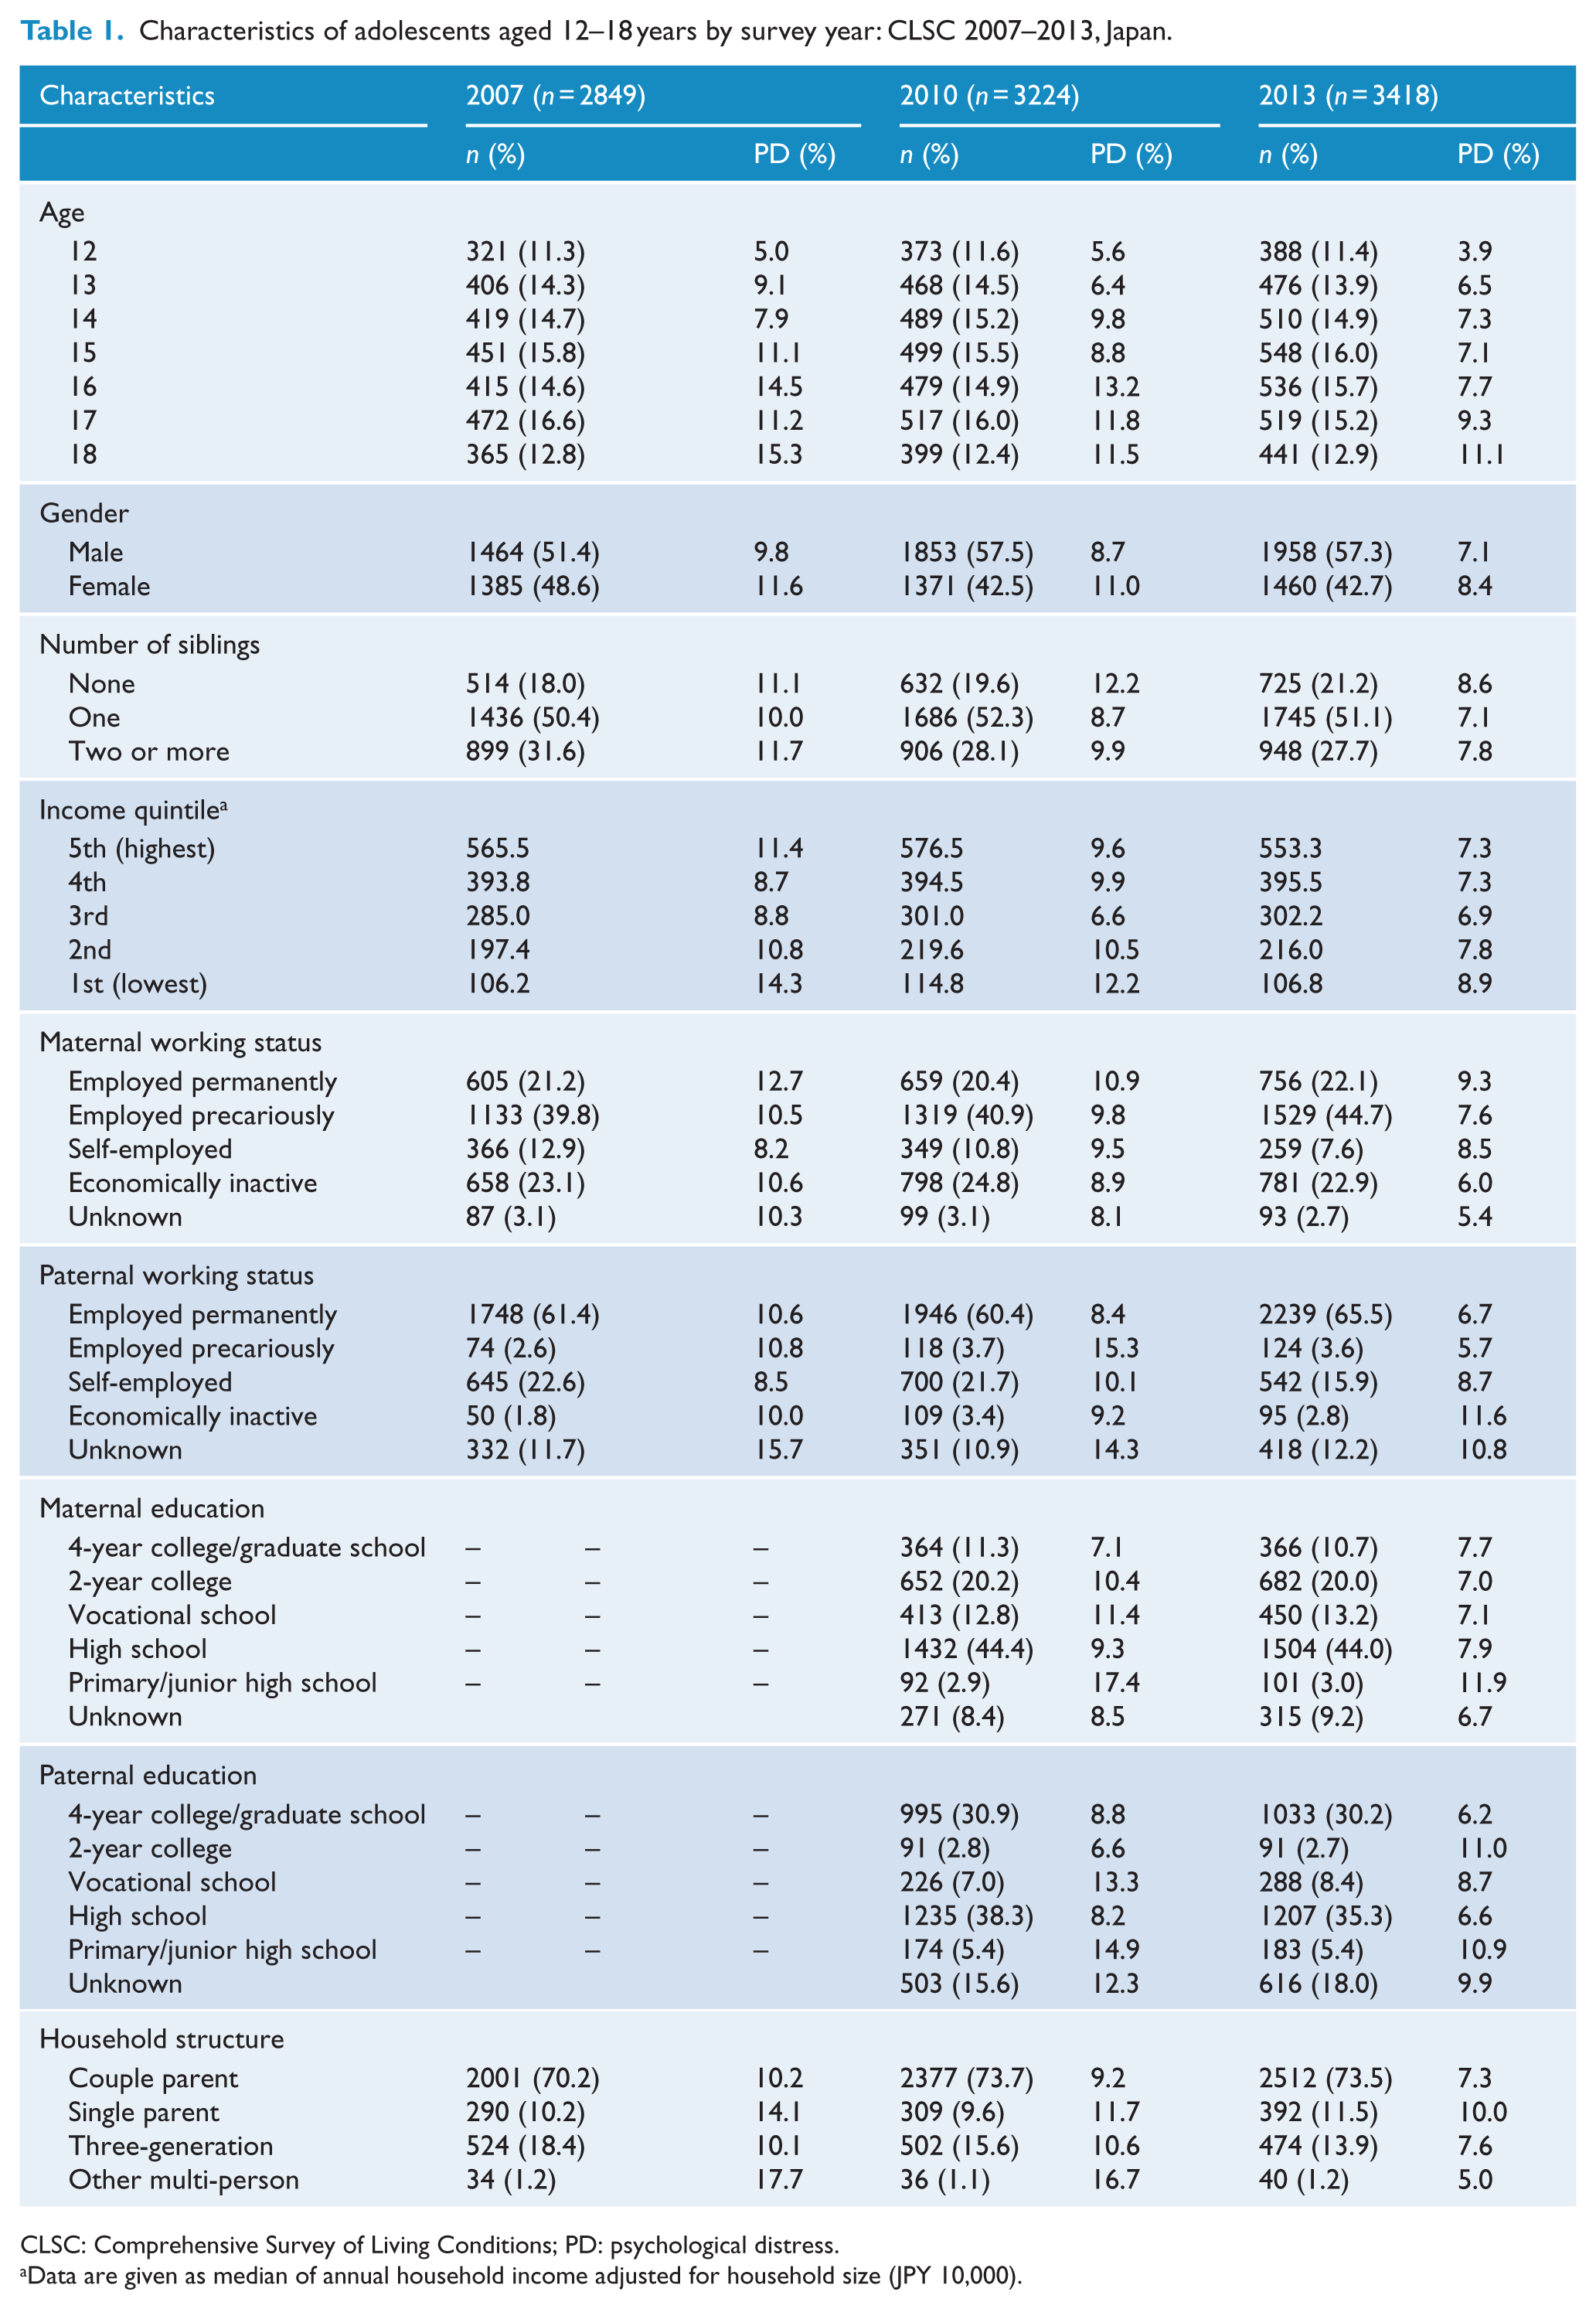
CLSC: Comprehensive Survey of Living Conditions; PD: psychological distress.
Data are given as median of annual household income adjusted for household size (JPY 10,000).
SES indicators and PD
Table 2 shows the odds ratios (ORs) and 95% confidence intervals (CIs) of PD, as computed using a multilevel logistic regression analysis. PD prevalence decreased significantly from 2007 to 2013 (OR = 0.69; 95% CI = [0.57, 0.82]). However, the SES patterns of PD remained unchanged over the study period in interaction tests; p values for interactions were above 0.05 for all SES indicators.
Associations of SES indicators with PD: CLSC 2007–2013, Japan.
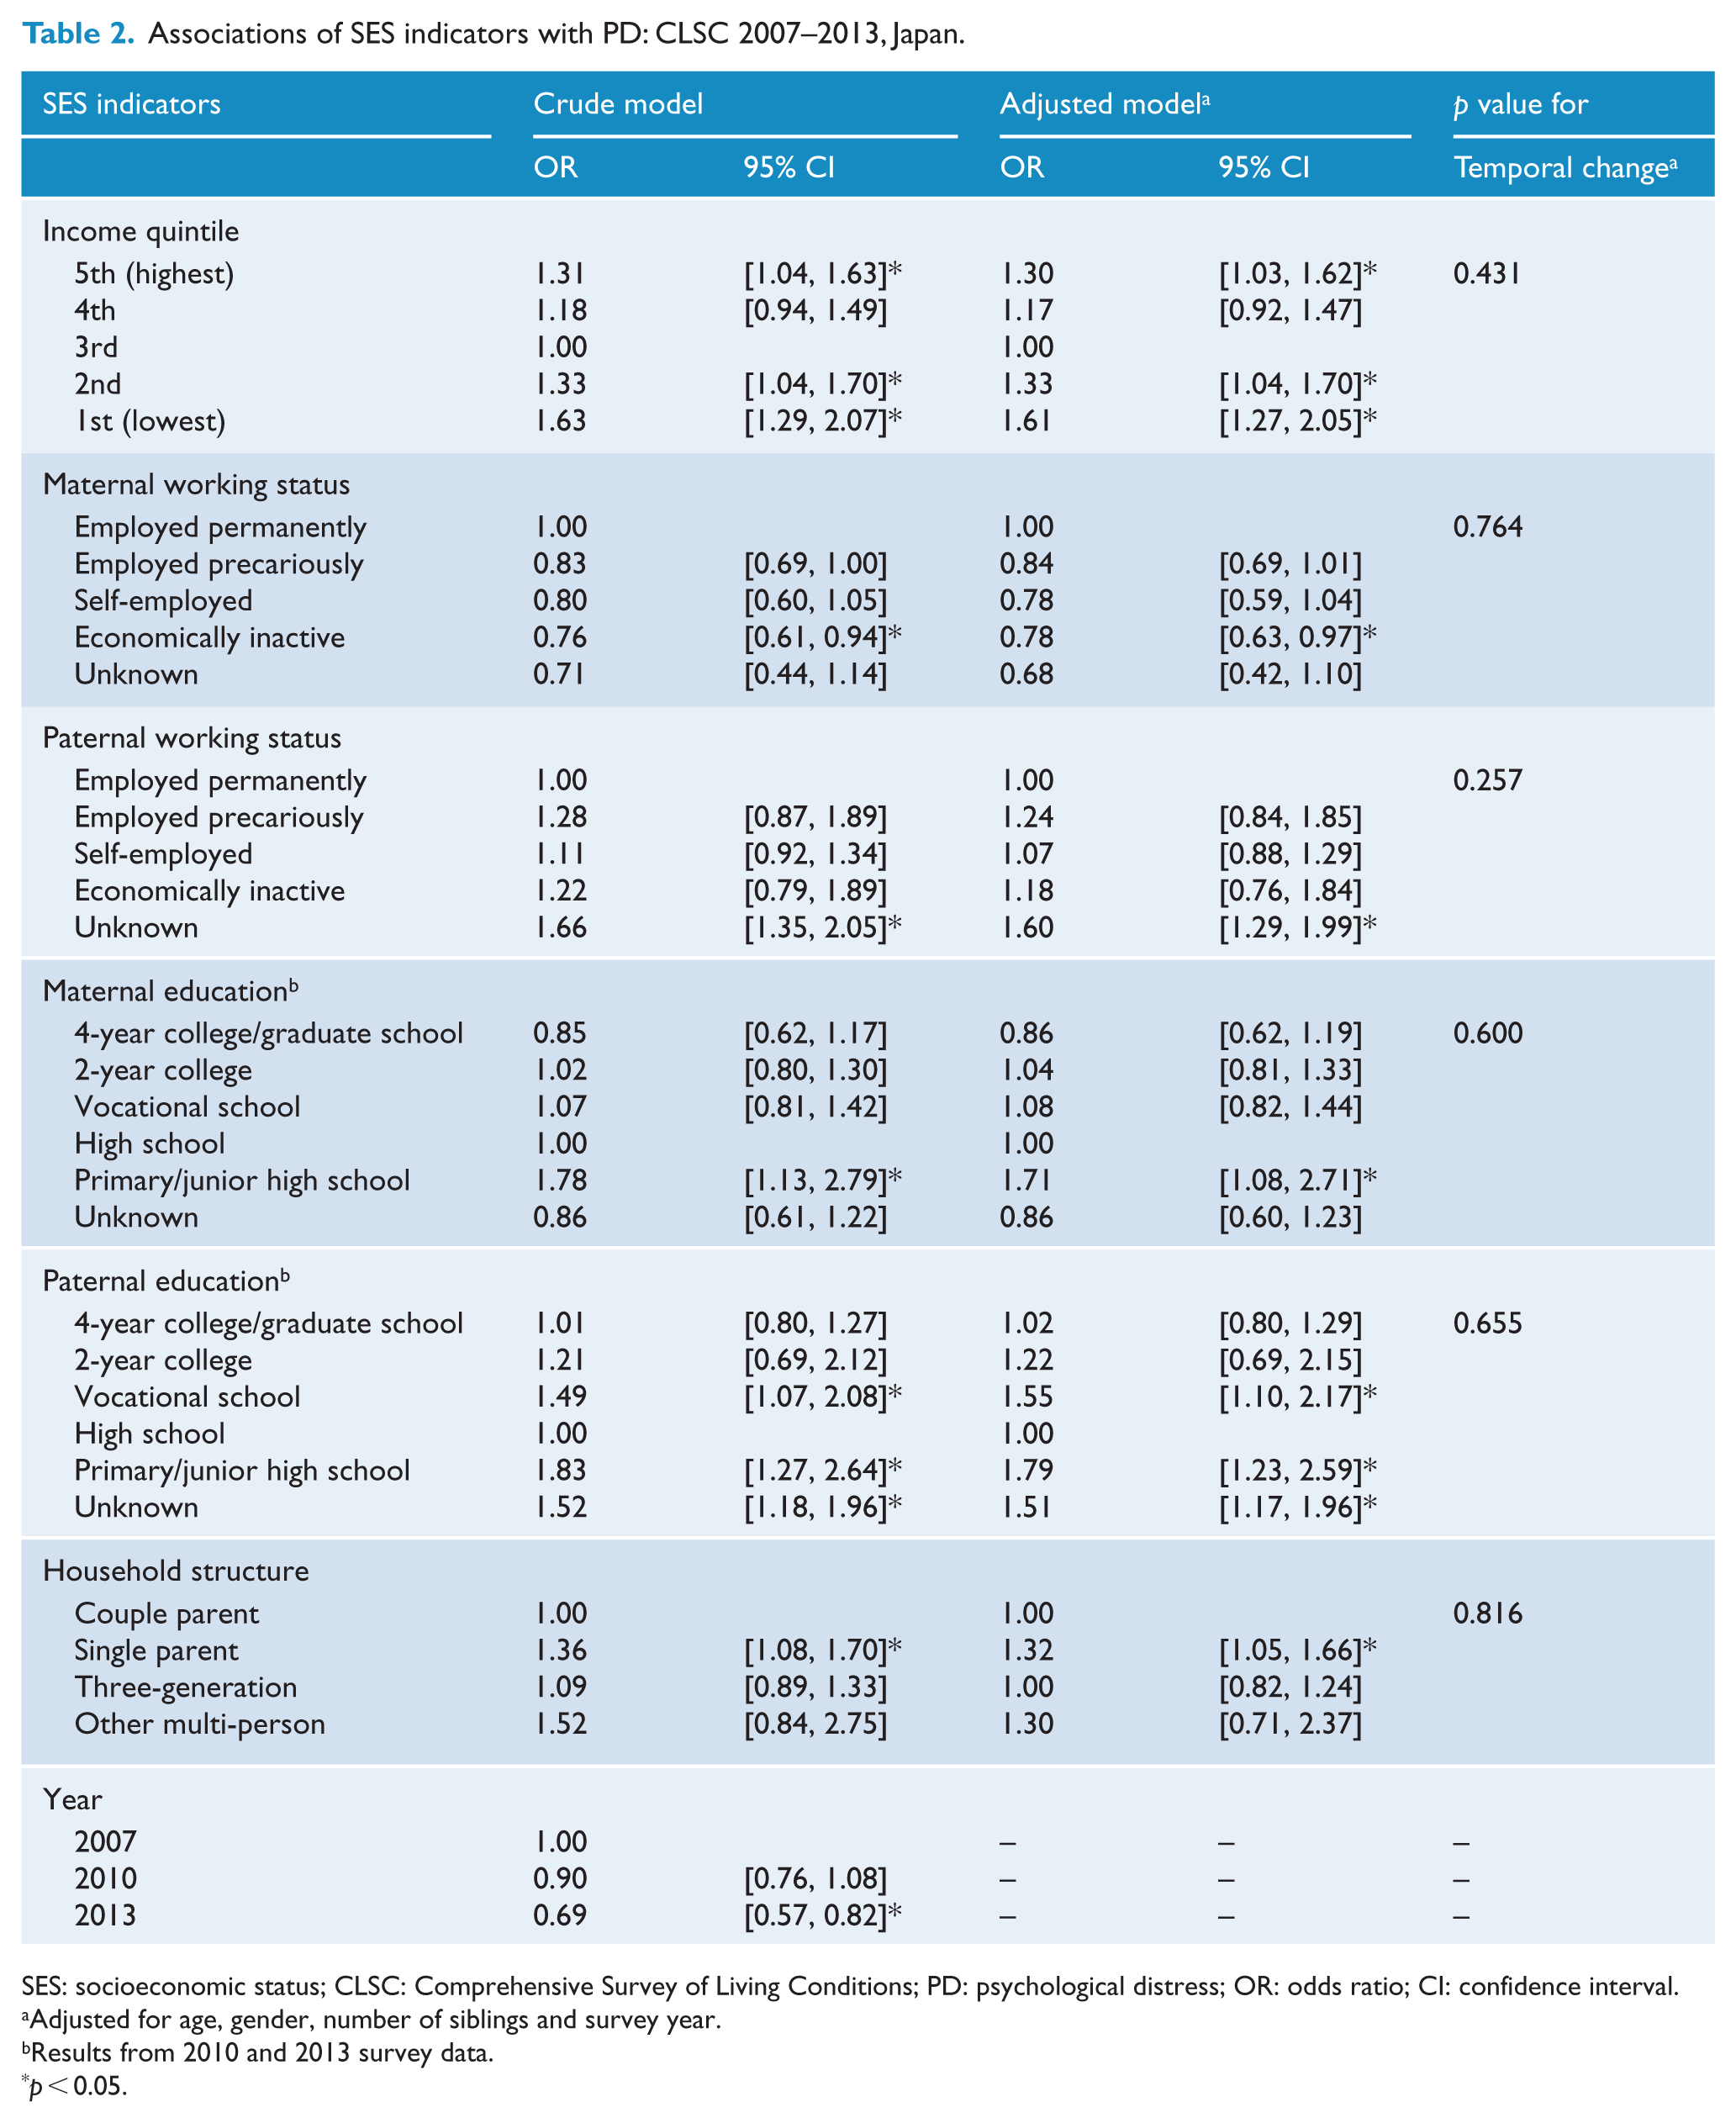
SES: socioeconomic status; CLSC: Comprehensive Survey of Living Conditions; PD: psychological distress; OR: odds ratio; CI: confidence interval.
Adjusted for age, gender, number of siblings and survey year.
Results from 2010 and 2013 survey data.
p < 0.05.
Adolescents living in both lower and higher income households were more likely to have PD compared with those living in middle-income households. Adjusted ORs (95% CIs) were as follows: first—1.61 (1.27, 2.05); second—1.33 (1.04, 1.70); fourth—1.17 (0.92, 1.47); and fifth—1.30 (1.03, 1.62).
PD was also associated with other SES indicators. In the adjusted model, adolescents with economically inactive mothers (OR = 0.78; 95% CI = [0.63, 0.97]) were less likely to have PD than those with mothers employed permanently. However, no significant associations were found between paternal working status and PD. Adolescents whose mothers had primary or junior high school educations (OR = 1.71; 95% CI = [1.08, 2.71]) were more likely to have PD than those whose mothers had high school educations. Similarly, adolescents whose fathers had primary or junior high school educations (OR = 1.79; 95% CI = [1.23, 2.59]) and vocational school educations (OR = 1.55; 95% CI = [1.10, 2.17]) were also more likely to have PD than those whose fathers had high school educations. Furthermore, adolescents living in single-parent households (OR = 1.32; 95% CI = [1.05, 1.66]) were more likely to have PD than those living in couple parents households.
Household income and stress-related factors
To explain the PD disparities by household income, we estimated the percentage of perceived stress, stressors and help-seeking behaviors by household income groups. Overall, 40.7% of adolescents perceived some stress. Adolescents who perceived stress were more likely to have PD than those who did not (18% vs 3%; p < 0.001). Adolescents living in both lower and higher income households were more likely to perceive some stress than those living in middle-income households (44% and 41%, respectively, vs 38%), although we observed statistical significance only for the first quintile of household income (p = 0.004).
Stressors were different between household income groups (Figure 1; also see Supplemental Table S1). Compared with adolescents living in middle-income households, those living in lowest income households (i.e., the first quintile) were more likely to suffer from relationship problems with family or persons outside the family and household financial situations, but were less likely to worry about school achievement. Those living in higher income households tended to suffer doubts about school achievement. We could not observe any difference in the prevalence of bullying between household income groups.
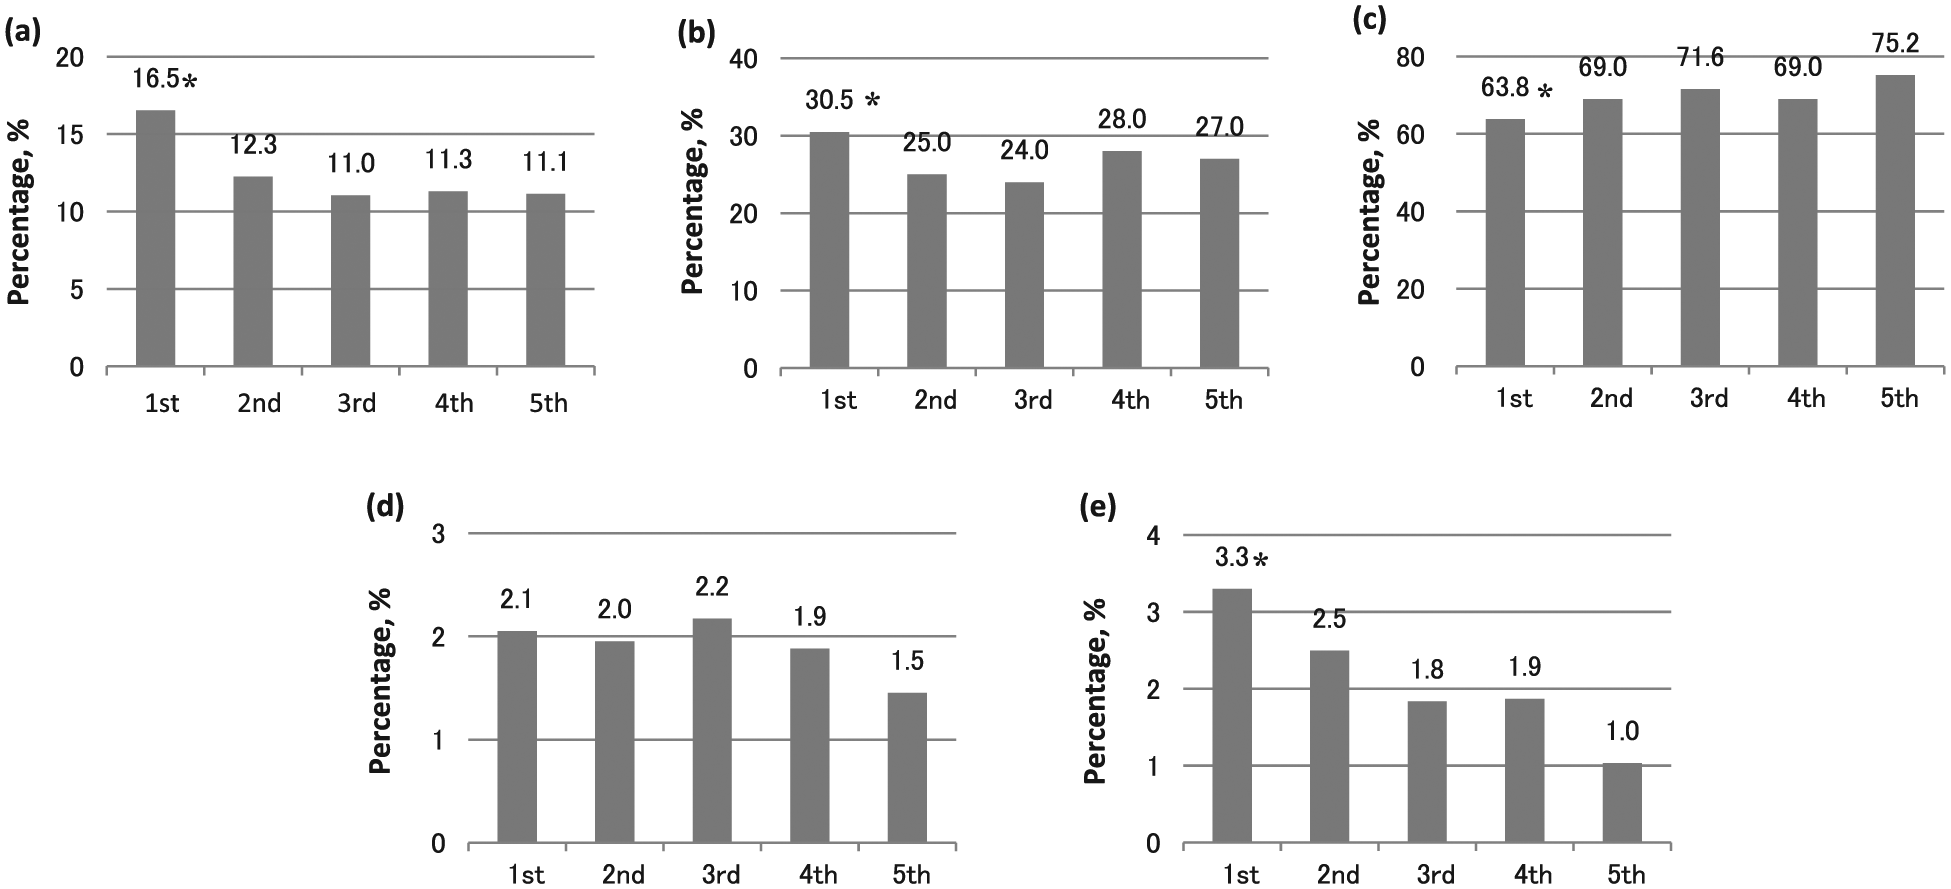
Percentage of stressors by income quintiles. Each percentage was estimated adjusting for age, gender, number of siblings and survey year using a multilevel logistic regression model: (a) interpersonal relationships with family members, (b) interpersonal relationship with persons outside the family, (c) school achievement, (d) bullying and (e) household financial situation.
Regarding help-seeking behaviors, we did not observe any significant difference between household income groups using the third quintile of household income as a reference (Supplemental Figure S1 and Table S2). Because household income seemed to be positively associated with help-seeking behaviors, we examined the association using the fifth quintile as a reference. As a result, those living in the lowest income households were less likely to consult with friends or have people to consult.
Discussion
Using nationally representative data, this study demonstrated that PD was more prevalent among socioeconomically disadvantaged adolescents. Although this result was generally consistent with our hypothesis and previous studies in high-income countries (Reiss, 2013), a result unique to Japan was also observed. We found a U-shaped relationship between household income and PD, with both low and high income being associated with PD. This study also demonstrated that, despite the widening income gap, such SES disparities in PD did not increase but remained unchanged during the 6-year period, which was inconsistent with our hypothesis.
Consistent with reports of a systematic review, our study found that low household income and poor paternal education were significantly associated with adolescent mental health problems (Reiss, 2013). However, no significant association was observed between parental working status and adolescent health problems except for maternal economically inactive status (the majority are homemakers). Previous studies showed that homemakers have become more concentrated in high-income households during the past two decades (Kachi et al., 2013). Thus, adolescents with a non-working mother may be less likely to have mental health problems. No significant association between paternal working status and adolescent mental health problems was an unexpected result because paternal unemployment and precarious employment are intimately related to low household income (Galobardes et al., 2006); this is especially true in Japan where most fathers are the primary earners (Ministry of Health, Labour and Welfare, 2012a). Although further study would be needed to clarify this association, the insignificance may be attributed to the smaller number of non-working or precariously employed fathers.
As previous studies have shown (Tobias et al., 2010), single-parent households were significantly associated with adolescent mental health problems. Most single-parent households are headed by women and are in the lower income group (Ministry of Health, Labour and Welfare, 2012b). The Japanese poverty rate (the percentage of people living on less than half of the median income) in single-parent households headed by working mothers is the highest (58%) among Organisation for Economic Co-operation and Development (OECD) countries (OECD, 2008). In addition, single parents tend to have lower education levels than married parents (Ministry of Health, Labour and Welfare, 2012b; Raymo et al., 2004). Because such disadvantages are concentrated in single-parent households, adolescents living in them would be an important target for future policies aimed at reducing their mental health problems.
The mechanisms underlying the association between SES and mental health problems among adolescents have yet to be established. However, previous evidence suggests that low family SES can adversely affect adolescent mental health through disadvantaged life conditions such as material hardship (e.g., inadequate food, housing or clothing), family dysfunction, ineffective parenting and parental psychopathology (Beiser et al., 2002; Evans, 2004; Kwon and Wickrama, 2014). Our findings also suggest that adolescents with low household income are more likely to feel stress from interpersonal relationships and less likely to have help-seeking behaviors, which may be associated with their mental health problems.
In our study, not only low-income status but also high-income status was associated with adolescents’ PD. A similar association was observed in a previous Japanese study that showed the association between high childhood SES and the lifetime onset of mental disorders among adults (Ochi et al., 2014). However, the underlying mechanisms for high-income status may be different from those for low-income status. Our findings indicate that adolescents with high household income are more likely to feel stress about school achievement, which may be associated with their PD. Asian parents, particularly those with high SES, tend to have high expectations for their children’s educational attainment (Yamamoto and Holloway, 2010) and invest considerable material and time resources in their children (Ministry of Education, Culture, Sports, Science and Technology, 2010.). Such high expectations and educational investment may sometimes become stressors for adolescents in addition to enabling access to higher education.
This study’s strengths include its large nationally representative sample, a high response rate and the presentation of the first evidence that SES disparities in mental health problems exist among Japanese adolescents. However, it also has some limitations. First, its repeated cross-sectional nature does not allow us to make causal inferences about SES-mental health associations, although the possibility of reverse causality—that is, adolescent’s mental health problems led to low family SES—was unlikely. Similarly, we were not able to determine the temporality of the associations among SES, stress-related factors and mental health. Second, our results, which are based on pooled data from three cross-sectional surveys, may be biased by differences in changes in the demographic characteristics over time, although we adjusted for age, gender and number of siblings. Third, we focused only on PD that refers to malaise associated with mood or anxiety disorders and could not assess other aspects of mental health problems among adolescents, such as conduct, attention and somatic problems. Thus, our findings need to be validated by future studies using a more comprehensive measure of mental health such as the Child Behavior Checklist (Achenbach and Edelbrock, 1991) or the Strengths and Difficulties Questionnaire (Goodman, 1997). Fourth, the validity and reliability of the scale used in this study have not been adequately verified for Japanese adolescents, although this mental health scale is well established worldwide, is widely used in epidemiological studies and showed some satisfactory psychometric properties in our sample. Fifth, mental health was assessed through self-reports by adolescents. Because previous studies suggest that SES is more strongly associated with parent and teacher reports than adolescent reports of their own mental health problems (Collishaw et al., 2009), our use of adolescent reports may have led to underestimation of the SES-mental health associations. Finally, unmeasured confounders may have affected our results. Common examples of confounders include tobacco and alcohol use (Green et al., 2013), although such adolescent health-risk behaviors are rarely measured in Japanese national surveys for ethical reasons.
In conclusion, this nationwide repeated cross-sectional study indicates that SES disparities in mental health among adolescents exist in Japan, which has long been considered an egalitarian society. Despite the widening income gap, we did not observe widening SES disparities in mental health during the relatively short time period. Future research should examine why SES disparities in mental health remained unchanged and continue to monitor their trends. Prospective studies should be conducted to establish a causal link between SES and adolescent mental health problems. Future prevention efforts should consider SES as a determinant of adolescent mental health problems.
Footnotes
Declaration of Conflicting Interests
The author(s) declared no potential conflicts of interest with respect to the research, authorship and/or publication of this article.
Funding
The author(s) disclosed receipt of the following financial support for the research, authorship, and/or publication of this article: This study was funded by a Grant-in-Aid for Scientific Research (C) from the Japan Society for the Promotion of Science (grant number: 15K08573).