
Abstract
Background:
The profile of grey matter abnormalities and related white-matter pathology in schizoaffective disorder has only been studied to a limited extent. The aim of this study was to identify grey- and white-matter abnormalities in patients with schizoaffective disorder using complementary structural imaging techniques.
Methods:
Forty-five patients meeting Diagnostic and Statistical Manual of Mental Disorders–Fourth Edition criteria and Research Diagnostic Criteria for schizoaffective disorder and 45 matched healthy controls underwent structural-T1 and diffusion magnetic resonance imaging to enable surface-based brain morphometry and diffusion tensor imaging analyses. Analyses were conducted to determine group differences in cortical volume, cortical thickness and surface area, as well as in fractional anisotropy and mean diffusivity.
Results:
At a threshold of p = 0.05 corrected, all measures revealed significant differences between patients and controls at the group level. Spatial overlap of abnormalities was observed across the various structural neuroimaging measures. In grey matter, patients with schizoaffective disorder showed abnormalities in the frontal and temporal lobes, striatum, fusiform, cuneus, precuneus, lingual and limbic regions. White-matter abnormalities were identified in tracts connecting these areas, including the corpus callosum, superior and inferior longitudinal fasciculi, anterior thalamic radiation, uncinate fasciculus and cingulum bundle.
Conclusion:
The spatial overlap of abnormalities across the different imaging techniques suggests widespread and consistent brain pathology in schizoaffective disorder. The abnormalities were mainly detected in areas that have commonly been reported to be abnormal in schizophrenia, and to some extent in bipolar disorder, which may explain the clinical and aetiological overlap in these disorders.
Keywords
Introduction
Schizoaffective disorder is a severe mental health disorder characterized by both psychotic and mood symptoms, either concurrently or at different time points during the illness. In the initial stages of defining the new Diagnostic and Statistical Manual of Mental Disorders–Fifth Edition (DSM-5), the removal of schizoaffective disorder as a separate diagnostic category was considered, with mood symptoms instead being added as a dimension to schizophrenia and schizophreniform disorder. The disorder was, however, ultimately maintained as an independent diagnostic category as it was felt that there was insufficient neurobiological data to support this substantial change (Cosgrove and Suppes, 2013). Therefore, recent neuroimaging studies have focused on improving the understanding of brain abnormalities in patients with schizoaffective disorder, with the view to better characterizing this disorder at the neurobiological level. Three voxel-based morphometry (VBM) neuroimaging studies comparing healthy controls with well-defined groups of patients with schizoaffective disorder have been reported to date. Results from these studies suggest that extensive neocortical grey matter volume reductions are present in patients with this disorder. The main abnormalities were located in fronto-temporal, parietal, cingulate and insular cortices (Amann et al., 2015; Ivleva et al., 2012, 2013).
Additional structural brain imaging techniques enabling the mapping of brain alterations without a priori assumptions, such as surface-based morphometry, may offer further potential in increasing our understanding of schizoaffective disorder. In contrast to VBM, which identifies regional differences in volume, surface-based morphometry allows independent measurement of cortical thickness (CT) and cortical surface area (SA). CT and SA have independent genetic aetiologies and result from different ontogenic stages during corticogenesis (Pontious et al., 2008). Because cortical volume (CV) is a product of CT and SA, a reduction in CV may reflect reduced thickness, reduced area or both. Thus, the individual examination of these measures provides an opportunity to determine the extent to which these divergent neurobiological processes are compromised in the disorder. To date, five neuroimaging studies using surface-based morphometry have investigated patients with schizoaffective disorder. Four of those studies combined them with patients with other mental health disorders (e.g. schizophrenia, bipolar disorder) and did not carry out separate analyses focusing on patients with schizoaffective disorder only (Goldman et al., 2009; Haukvik et al., 2014; Rimol et al., 2010, 2012). A more recent study examined surface-based measures in a large sample of well-defined patients with schizoaffective disorder (Padmanabhan et al., 2015). However, this study focused on within-group correlations between symptom dimensions of psychosis and regional surface-based morphometry measures and did not directly investigate differences in CV, CT and SA between patients with schizoaffective disorder and healthy controls.
Of relevance to the present study, the investigation of cortical grey matter measures can be supplemented with the investigation of micro-structural alterations in white matter using diffusion tensor imaging (DTI). This approach ascertains several measures of molecular diffusion, including (1) fractional anisotropy (FA), a measure sensitive to alterations in fibre density, orientational coherence, axonal diameter and myelination of white matter and (2) mean diffusivity (MD), an index sensitive to alterations in tissue water content in white and grey matter due to ischaemic lesions, oedema, neuroinflammation, cell proliferation or necrosis (Alexander et al., 2007). To date, evidence of white-matter alterations in patients with schizoaffective disorder is scarce and, similar to cortical neuroimaging studies, only indirect conclusions can be drawn from previous studies using mixed samples of patients with psychotic spectrum disorders (Antonius et al., 2011; Hatton et al., 2014).
Aims of the study and hypothesis
In this study, we aimed to investigate for the first time grey- and white-matter abnormalities in a well-characterized sample of patients with schizoaffective disorder in relation to healthy matched controls. In order to improve the characterization of abnormalities in both tissues, a combination of advanced surface-based morphometry and DTI techniques were employed. We predicted (1) that individuals with schizoaffective disorder would show consistent cortical grey- and white-matter abnormalities compared to matched healthy controls, evidenced by spatial overlap of between group differences across different neuroimaging outcome measures; (2) that local abnormalities in CV would be differentially influenced by abnormalities in CT and SA and these would affect the underlying diffusion properties and (3) that individuals with schizoaffective disorder would show widespread abnormalities in regions linked to the emergence of clinical symptoms in the disorder, including the frontal cortex, insula, cingulated, temporal lobes and the primary white-matter tracts connecting these regions.
Methods
Subjects
A total of 46 patients with a diagnosis of schizoaffective disorder, bipolar type, were recruited for this study from the inpatient and outpatient departments of two community hospitals and one University hospital from the Barcelona area. Patients were diagnosed using Diagnostic and Statistical Manual of Mental Disorders–Fourth Edition (DSM-IV) criteria and the somewhat stricter Research Diagnostic Criteria (RDC) (Heckers, 2012). Diagnoses were made based on a detailed clinical interview and review of case-notes (B.L.A.). Patients also received a follow-up of at least 6 months to longitudinally confirm the diagnosis. Of the 46 patients recruited, 45 were included in the final analyses as one patient was excluded due to a change of diagnosis. At the time of diagnosis and magnetic resonance imaging (MRI) session, 15 patients showed only minor clinical symptoms. The remaining 30 were experiencing psychotic symptoms, and of these, 15 were in the manic phase and 15 were in the depressive phase of their illness. All patients were taking medication either as monotherapy or as a combination of two or three medication classes. Patients were prescribed anticonvulsants (n = 20), lithium (n = 10) or typical or atypical neuroleptics (mean daily dose in chlorpromazine equivalents: 709.01 mg, standard deviation [SD] = 599.11 mg, range 106.70–3303.24 mg).
Exclusion criteria for all participants included left-handedness, age <18 years or >65 years, history of neurological disease or brain injury and/or alcohol/substance abuse in the 12 months prior to participation. All participants were required to have a premorbid IQ in the normal range, as estimated using the Word Accentuation Test (Test de Acentuación de Palabras, TAP) (Gomar et al., 2011), which requires pronunciation of Spanish words which have had the accents removed.
The control sample consisted of 45 healthy subjects selected to be individually matched to the patients with schizoaffective disorder for age, sex and premorbid IQ and met the same exclusion criteria described above. Healthy controls were nonmedical staff working in the hospital, their acquaintances or individuals from the community. Healthy controls were interviewed and excluded if they reported a history of mental illness or treatment with psychotropic medication.
All patients with schizoaffective disorder and healthy controls underwent structural and diffusion MRI scanning in a single session, using the same 1.5 T GE Sigma scanner (General Electric Medical Systems, Milwaukee, WI, USA), at the Sant Joan de Déu Hospital in Barcelona (Spain). Only images that passed a set of quality-control measures (see image processing steps below) were included. Following quality control, structural MRI data were available for 44 patients and 45 controls and diffusion MRI data were available for 38 patients and 37 matched controls.
The study was carried out in accordance with the latest version of the Declaration of Helsinki. The study design was reviewed by the ethical committee ‘Comité Ético de Investigación Clínica de las Hermanas Hospitalarias’ (Barcelona, Spain) and written informed consent of the participants was obtained after the nature of the procedures had been fully explained. All participants were also informed that non-participation would have no direct or indirect influence or consequence on their usual treatment.
MRI data acquisition
High-resolution structural-T1 MRI data were acquired with the following acquisition parameters: matrix size 512 × 512; 180 contiguous axial slices; voxel resolution 0.47 × 0.47 × 1 mm3; echo (TE), repetition (TR) and inversion (TI) times, (TE/TR/TI) = 3.93 ms/2000 ms/710 ms, respectively; flip angle 15°.
Diffusion-weighted images were recorded using a spin-echo echo-planar pulse sequence along 25 gradient directions using three different b-values (500, 750 and 1000 s/mm2) together with three unweighted T2-b0 (b = 0) images, for a total of 78 volumes per subject. For each image, the following parameters were used: field of view = 289 × 289 mm2, matrix size 128 × 128; number of slices 28, voxel resolution 1.13 × 1.13 × 5 mm3, TE = 107 ms, TR = 8000 ms and flip angle = 90°.
Surface-based morphometry
Structural MRI data were analysed with the FreeSurfer image analysis suite, (http://surfer.nmr.mgh.harvard.edu/). Briefly, the pre-processing included motion correction, removal of non-brain tissue, automated Talairach transformation, tessellation of the grey- and white-matter boundaries and surface deformation (Fischl et al., 2002). A number of deformation procedures were performed in the data analysis pipeline, including surface inflation and registration to a spherical atlas. This method uses both intensity and continuity information from the entire three dimensional images in the segmentation and deformation procedures to produce vertex-wise representations of CT, SA and CV, calculated as the element-wise multiplication of CT and SA in each vertex across the cortical mantle, that is, CV = CT × SA. The resultant maps are sensitive to sub-millimetre differences between groups, and have been validated against histological data (Rosas et al., 2002).
Prior to the statistical analyses, the individual CT, SA and CV maps were smoothed using a Gaussian filter with full width at half maximum (FWHM) of 15 mm. Finally, vertex-wise general linear models were applied to the individual maps. Intracranial volume was included as a covariate in the models (Palaniyappan and Liddle, 2012). Statistical inference was carried out with FreeSurfer tools based on non-parametric permutation testing, using a cluster-wise correction method for multiple comparisons with initial cluster-forming threshold of p < 0.001 and 10,000 iterations applied. In these analyses, only those clusters with a corrected value of p < 0.05 were considered significant. Anatomical locations of the significant clusters were determined with reference to the surface-based atlas included in FreeSurfer.
DTI analysis
An automatic quality-control workflow was implemented to correct possible acquisition artefacts in diffusion MRI images. The normalized correlation between successive slices was applied to detect slice-wise intensity-related abnormalities, with diffusion volumes containing one or more artefact excluded. Next, eddy-current and head motion correction was performed using FSL tools (the FMRIB Software Library, Oxford, UK) (Smith et al., 2004). FA and MD images were obtained from the resulting diffusion tensors, which were computed from the corrected images using the ‘dtifit’ programme implemented in FSL. After skull removal, images were normalized with the Symmetric Normalization (SyN) algorithm, a high-resolution diffeomorphic nonlinear registration method (Avants et al., 2008). In this algorithm both FA and MD images were simultaneously used for co-registration, producing multimodal study-specific templates that were used for the final normalization. While the analysis of MD images included both grey- and white-matter tissues, the analysis of FA images was restricted to the centre of all white-matter tracts, using the Tract-Based Spatial Statistics (TBSS) technique included in FSL (Smith et al., 2006). MD images were spatially filtered with a Gaussian kernel of σ = 2 mm.
Finally, the group comparison between patients and controls was carried out using a voxel-wise general linear model using non-parametric permutation tests. MD images from both groups were compared using the ‘randomise’ tool in FSL. A cluster-wise correction method for multiple comparisons was employed with an initial cluster-forming threshold of T < 3.0 and 10,000 iterations. In this analysis, only those clusters with a corrected value of p < 0.05 were considered significant. FA images were compared using the standard TBSS analysis and corrected for multiple comparisons using the Threshold-Free Cluster Enhancement (TFCE) algorithm with 2D optimization. Likewise, a threshold of p < 0.05 corrected for multiple comparisons for statistical significance was used for these analyses.
Anatomical locations of the significant grey matter regions were determined with reference to the Anatomical Automatic Labelling atlas (Tzourio-Mazoyer et al., 2002) included in the MRIcron software. Significant regions in white matter were reported with reference to the Johns Hopkins University (JHU) white-matter atlas (Wakana et al., 2007).
Integration of findings from different imaging modalities
Findings from different neuroimaging outcome measures were integrated by using two complementary approaches. First, the common sites of pathology detected in the disorder across imaging modalities were identified. These regions were located by computing the spatial overlap between the significant regions detected (at the group level) by each individual imaging modality. Second, a region-of-interest (ROI) correlation analysis was conducted to obtain information about the relationships between the different neuroimaging measures in these common sites of pathology. This was carried out by computing the mean value of each measure in these regions to yield an average ROI value for each subject. Pearson’s linear correlation coefficients between the resulting values across individual subjects were calculated together with their p-values using a Student’s t distribution.
Results
Demographic and clinical data
Demographic data for the full sample of patients with schizoaffective disorder and healthy control subjects are listed in Table 1. The groups were matched for age, sex and estimated premorbid IQ (TAP score). No significant differences were observed in age, sex and TAP score between the groups in the DTI subsample (38 patients with schizoaffective disorder and 37 healthy controls).
Demographic characteristics of patients with schizoaffective disorder and healthy controls.
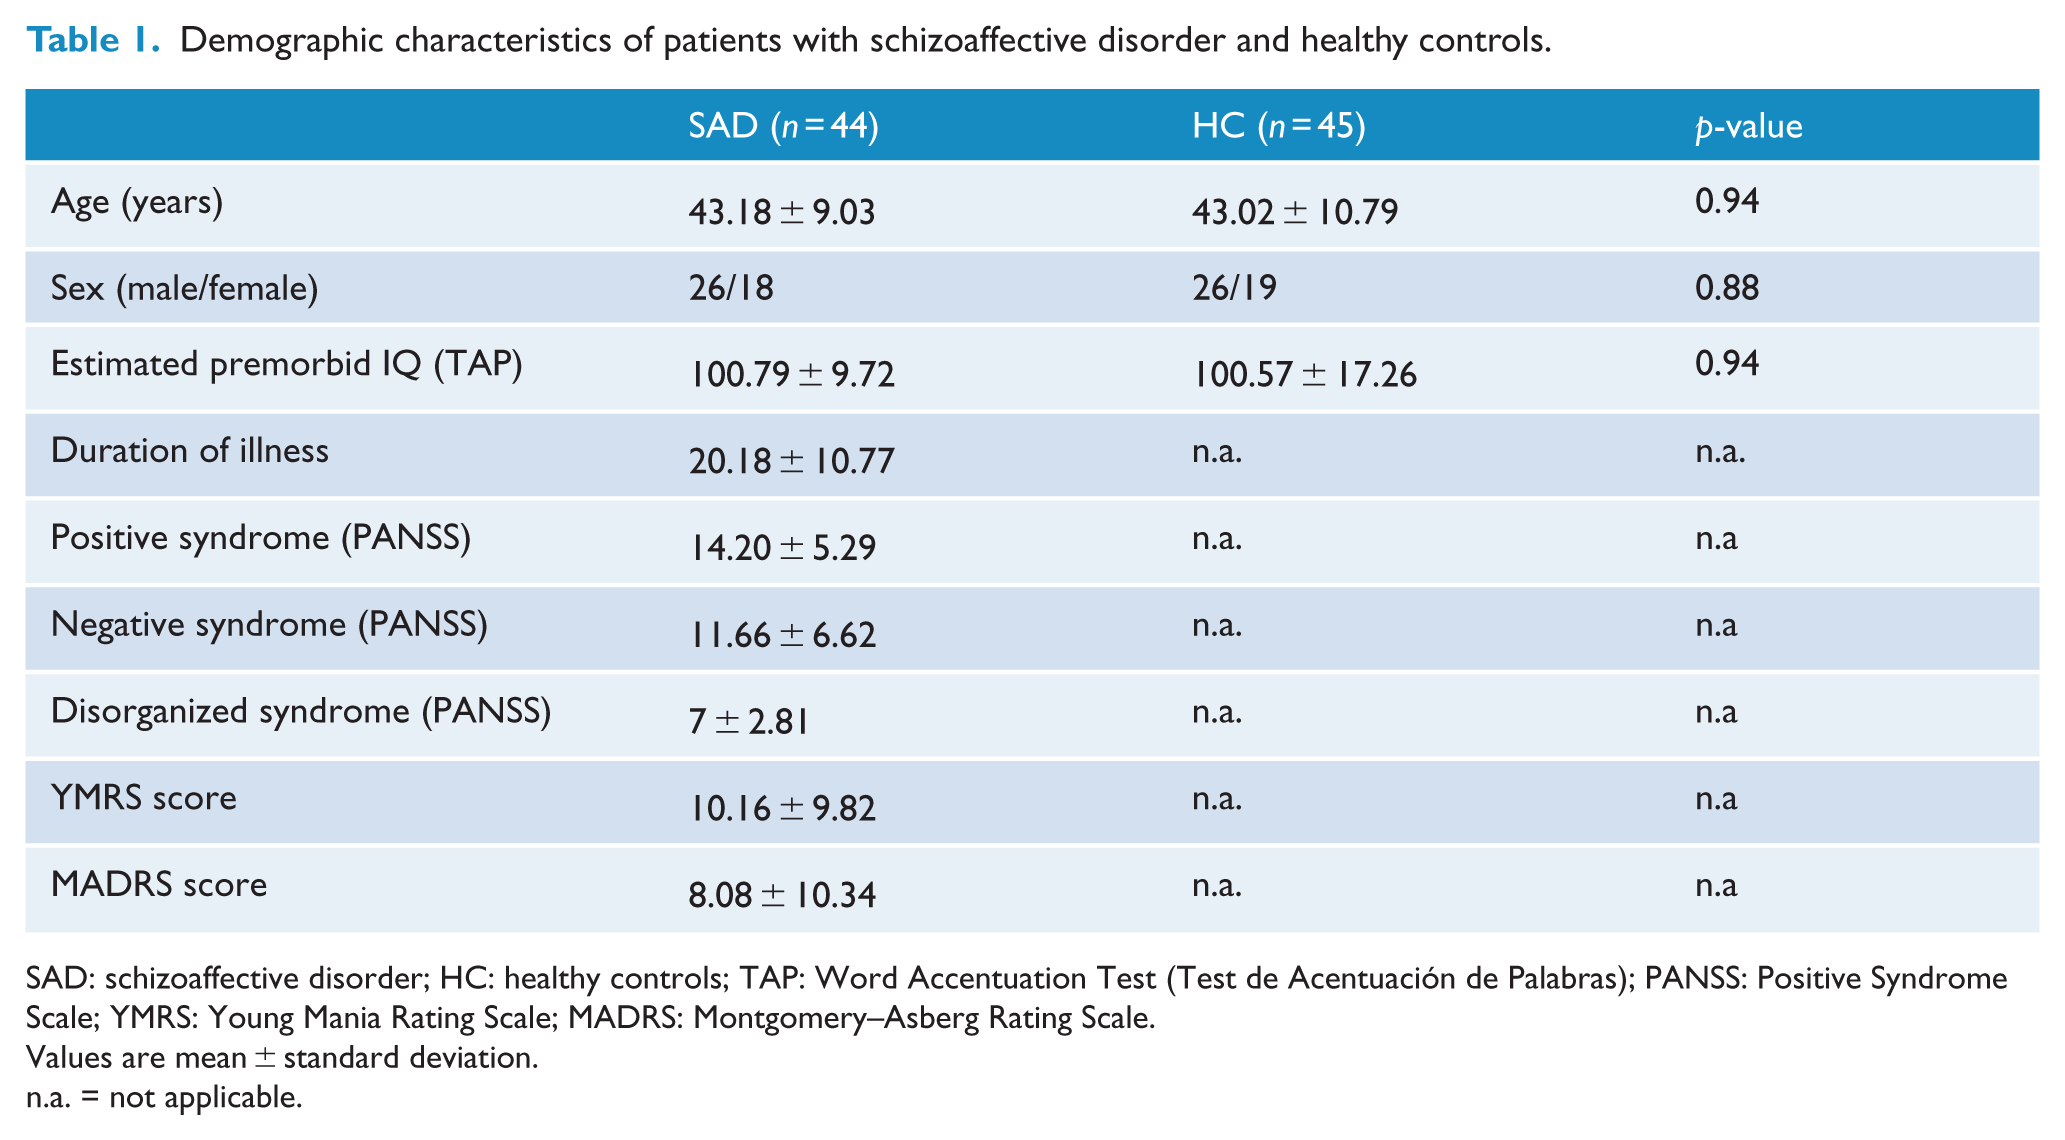
SAD: schizoaffective disorder; HC: healthy controls; TAP: Word Accentuation Test (Test de Acentuación de Palabras); PANSS: Positive Syndrome Scale; YMRS: Young Mania Rating Scale; MADRS: Montgomery–Asberg Rating Scale.
Values are mean ± standard deviation.
n.a. = not applicable.
Imaging results: surface-based morphometry
The findings obtained from the whole-brain vertex-wise statistical analyses performed for each contrast (CT, SA and CV) separately are reported in Table 2 and Figure 1. Briefly, no significant increase in CT was found in patients with schizoaffective disorder relative to controls but a widespread bilateral pattern of CT reduction was observed. Specifically, the analysis revealed seven and eight clusters of CT decrease located in the right and left hemispheres of the brain, respectively. These spanned bilaterally from the rostral and superior frontal regions extending to the bilateral insulae and the precentral cortices, the temporal lobes, posterior cingulate cortex and precuneus, as well as the fusiform. No significant regions with increased SA were obtained in our patient group, whereas decreased SA was observed in one cluster located in the left fusiform. Finally, a widespread pattern of reduced CV, similar (although more restricted) to that observed in the CT analysis, was present. Specifically, seven and six significant clusters located in the right and left hemispheres of the brain, respectively, were detected. The main areas affected included the superior-, middle- and orbito-frontal structures, together with the bilateral temporal lobes and left parietal and fusiform cortices.
Regional brain differences in cortical thickness, surface area and cortical volume between healthy controls and patients with schizoaffective disorder at p < 0.05, corrected for multiple comparisons.
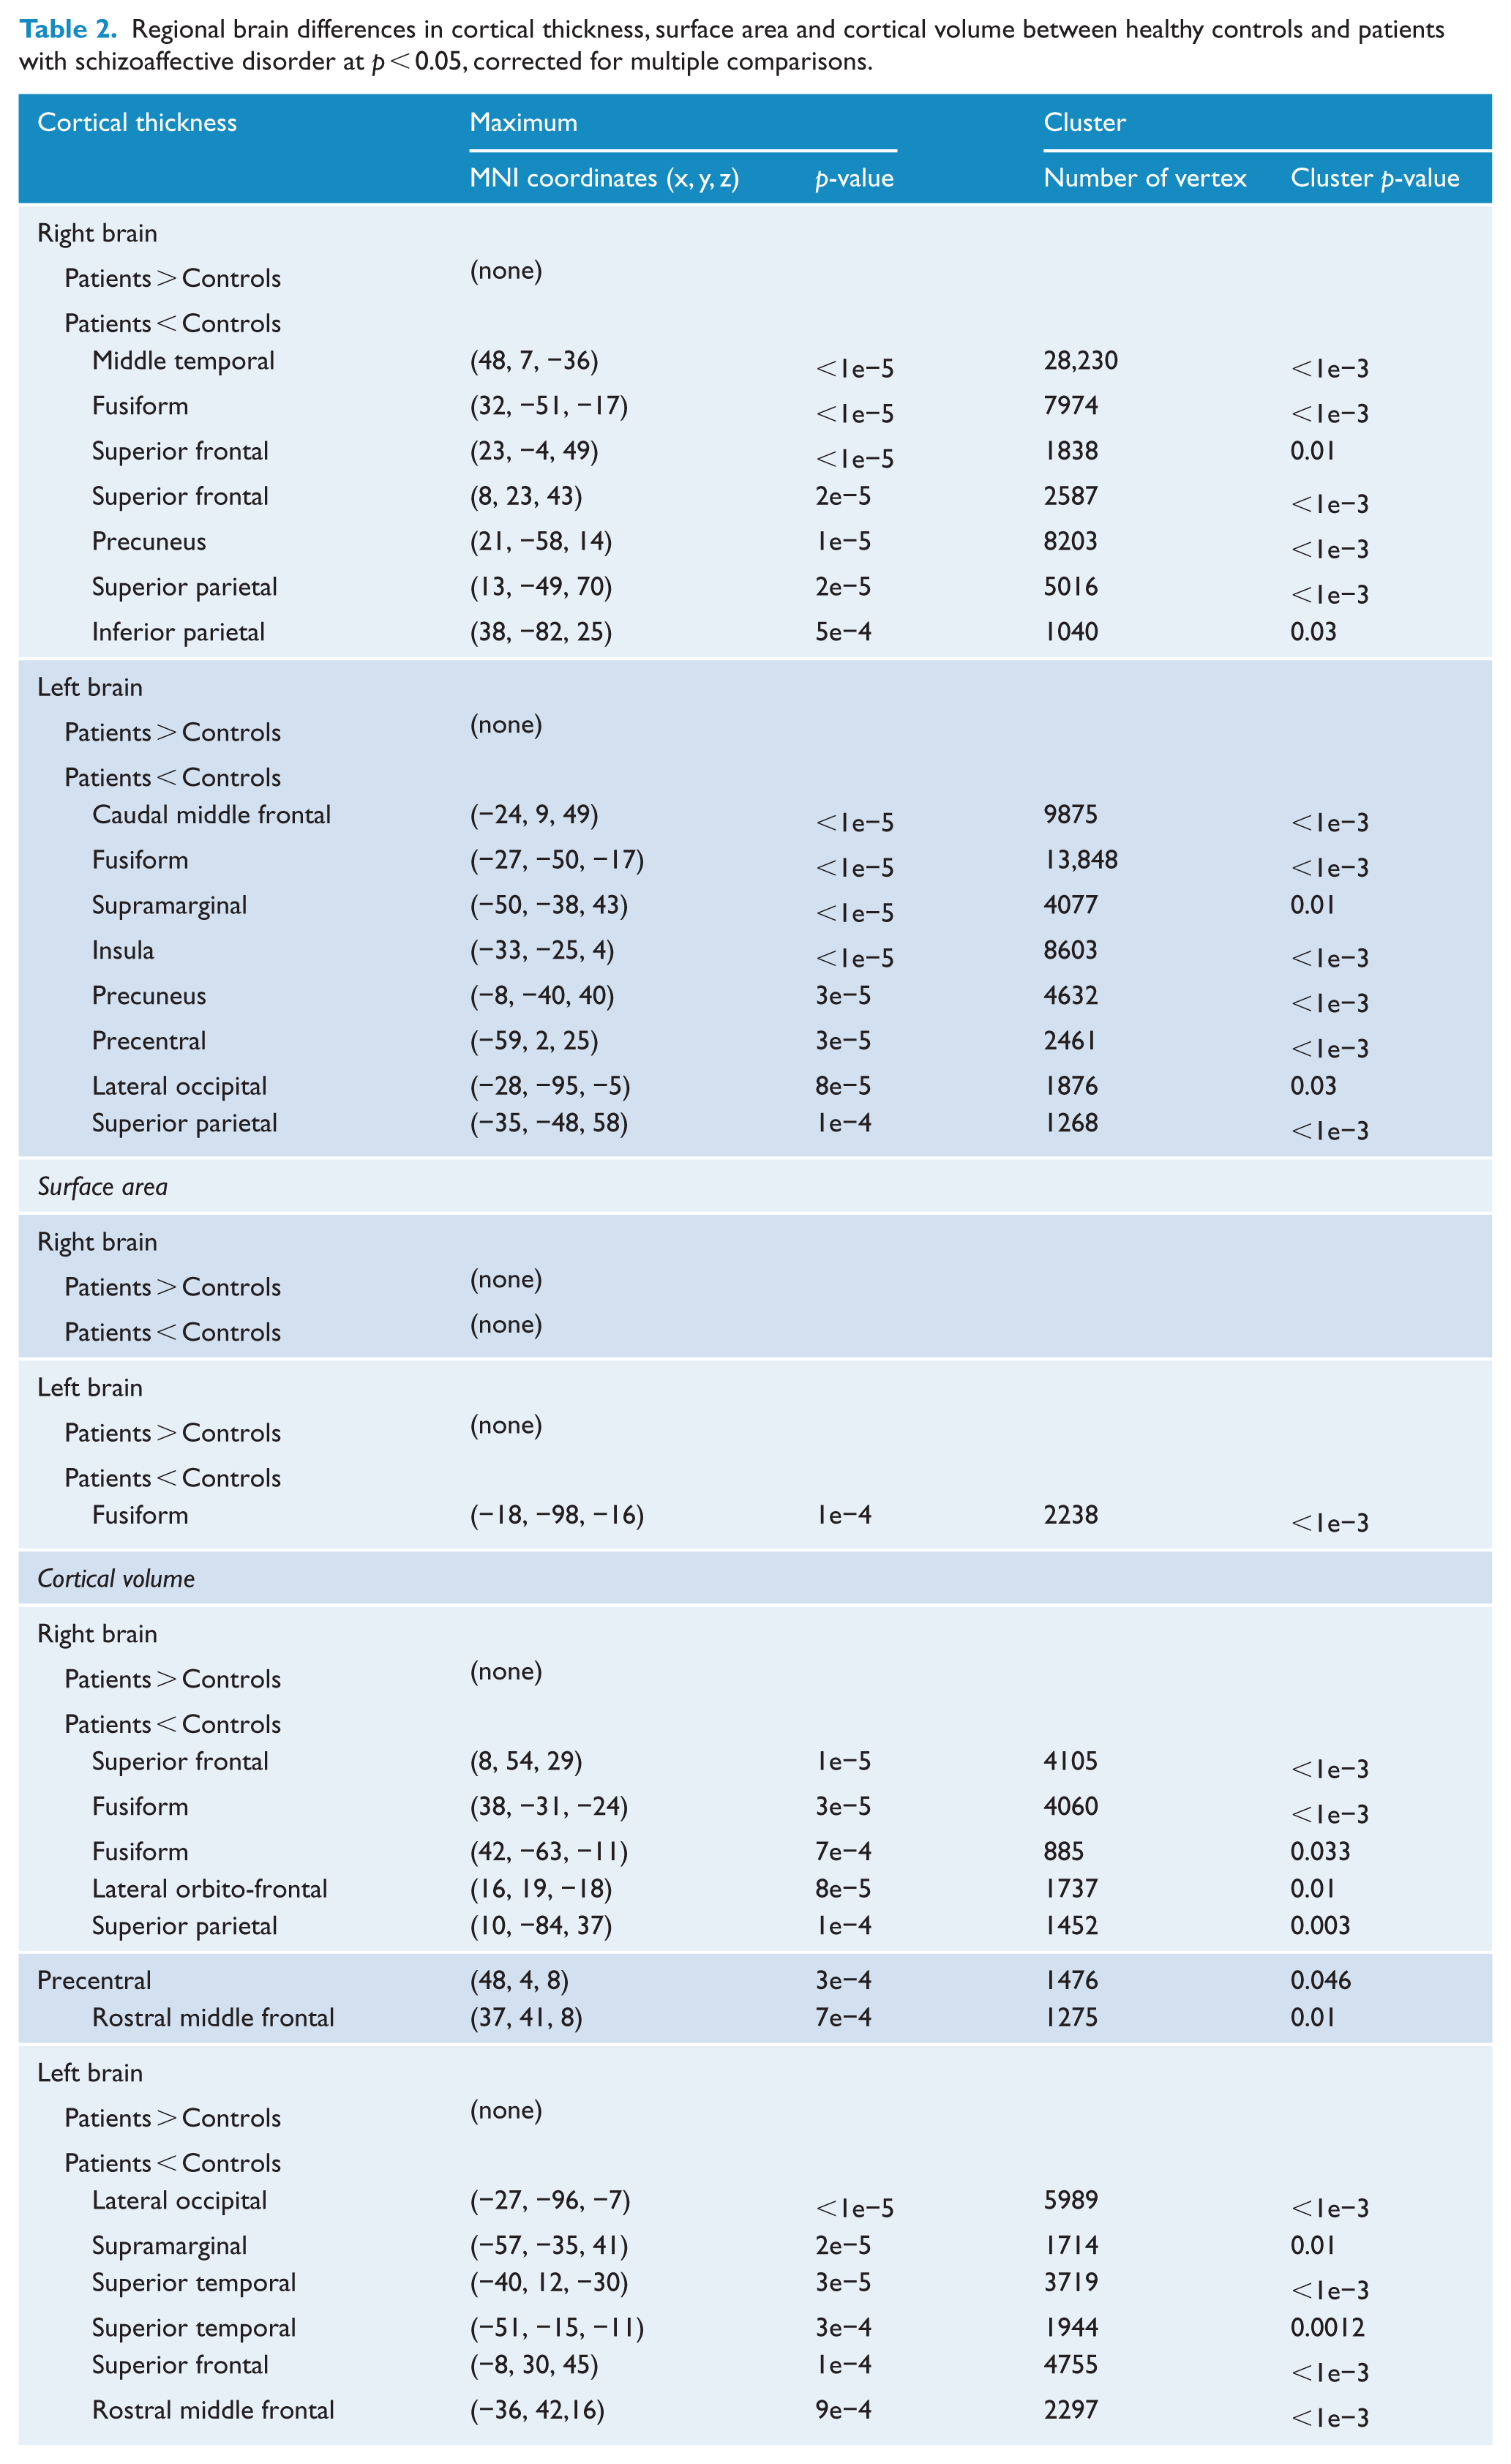
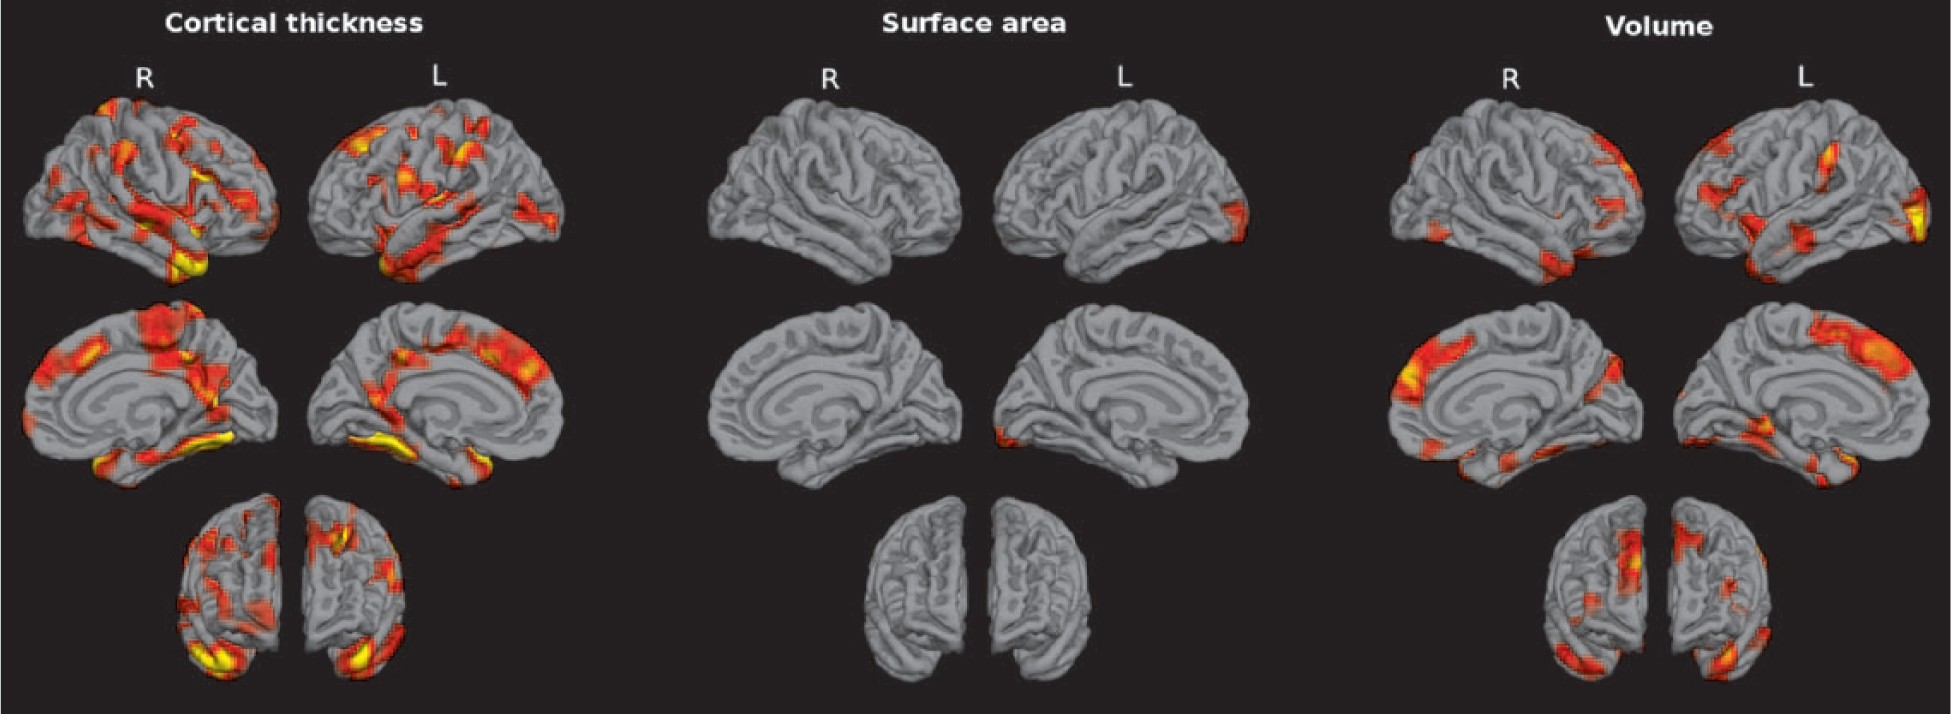
Brain regions showing significant statistical differences between patients with schizoaffective disorder and healthy control subjects at p = 0.05, corrected for multiple comparisons across space. Left, middle and right panels depict cortical thickness (CT), surface area (SA) and cortical volume (CV) findings, respectively. CV is the interaction between CT and SA, computed as the element-wise multiplication of these metrics (i.e. CV = CT × SA) in each vertex across the cortical mantle.
Imaging results: DTI analysis
TBSS analyses in the white matter revealed significant FA reduction in patients relative to controls (Table 2, Figure 2(A)). These observed widespread abnormalities were mainly present in the corpus callosum (splenium, body and genu), extending into the anterior limb of the internal capsule bilaterally, the left superior longitudinal fasciculus, and tracts adjacent to grey matter temporal structures, together with the right thalamus and the left lingual gyrus.
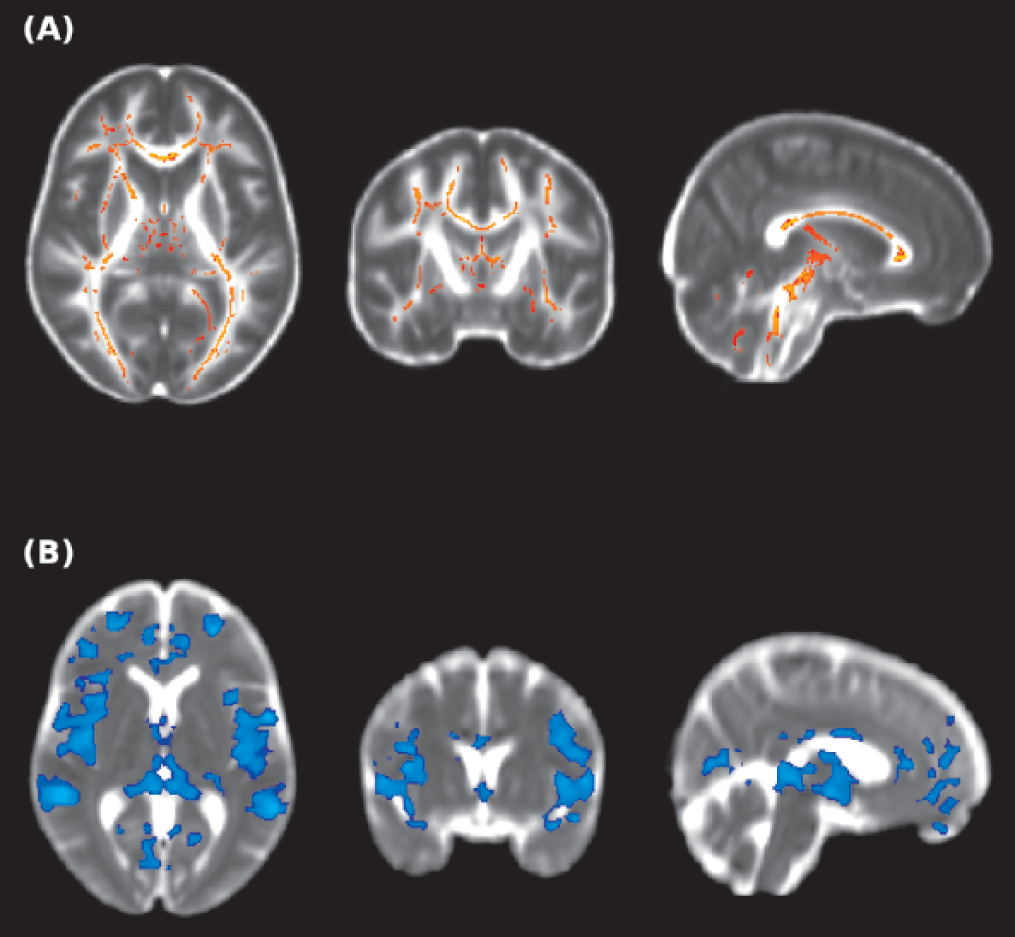
Brain regions showing significant statistical differences between patients with schizoaffective disorder and healthy controls at p = 0.05, corrected for multiple comparisons across space. (A) Fractional anisotropy findings in white matter are shown in yellow-red. (B) Mean diffusivity findings are shown in blue. The background images on each panel are the study-specific templates in MNI space. The right side of the images represents the left side of the brain.
The whole-brain voxel-based comparison of MD images showed significant increases in MD in our patient group (Table 3, Figure 2B), which were observed in 10 clusters in both grey- and white-matter regions. Specifically, the main affected areas in grey matter included the middle, inferior- and orbito-frontal structures; temporal lobes; left parahippocampal gyrus; right rectus; left fusiform; and bilateral thalamic nuclei. In the white matter, increased MD in patients was mainly observed in the body of corpus callosum and the corona radiata.
Regional brain differences in fractional anisotropy and mean diffusivity between healthy controls and patients with schizoaffective disorder at p < 0.05, corrected for multiple comparisons.
GM: grey matter; WM: white matter.
Imaging results: integration of findings from different imaging modalities
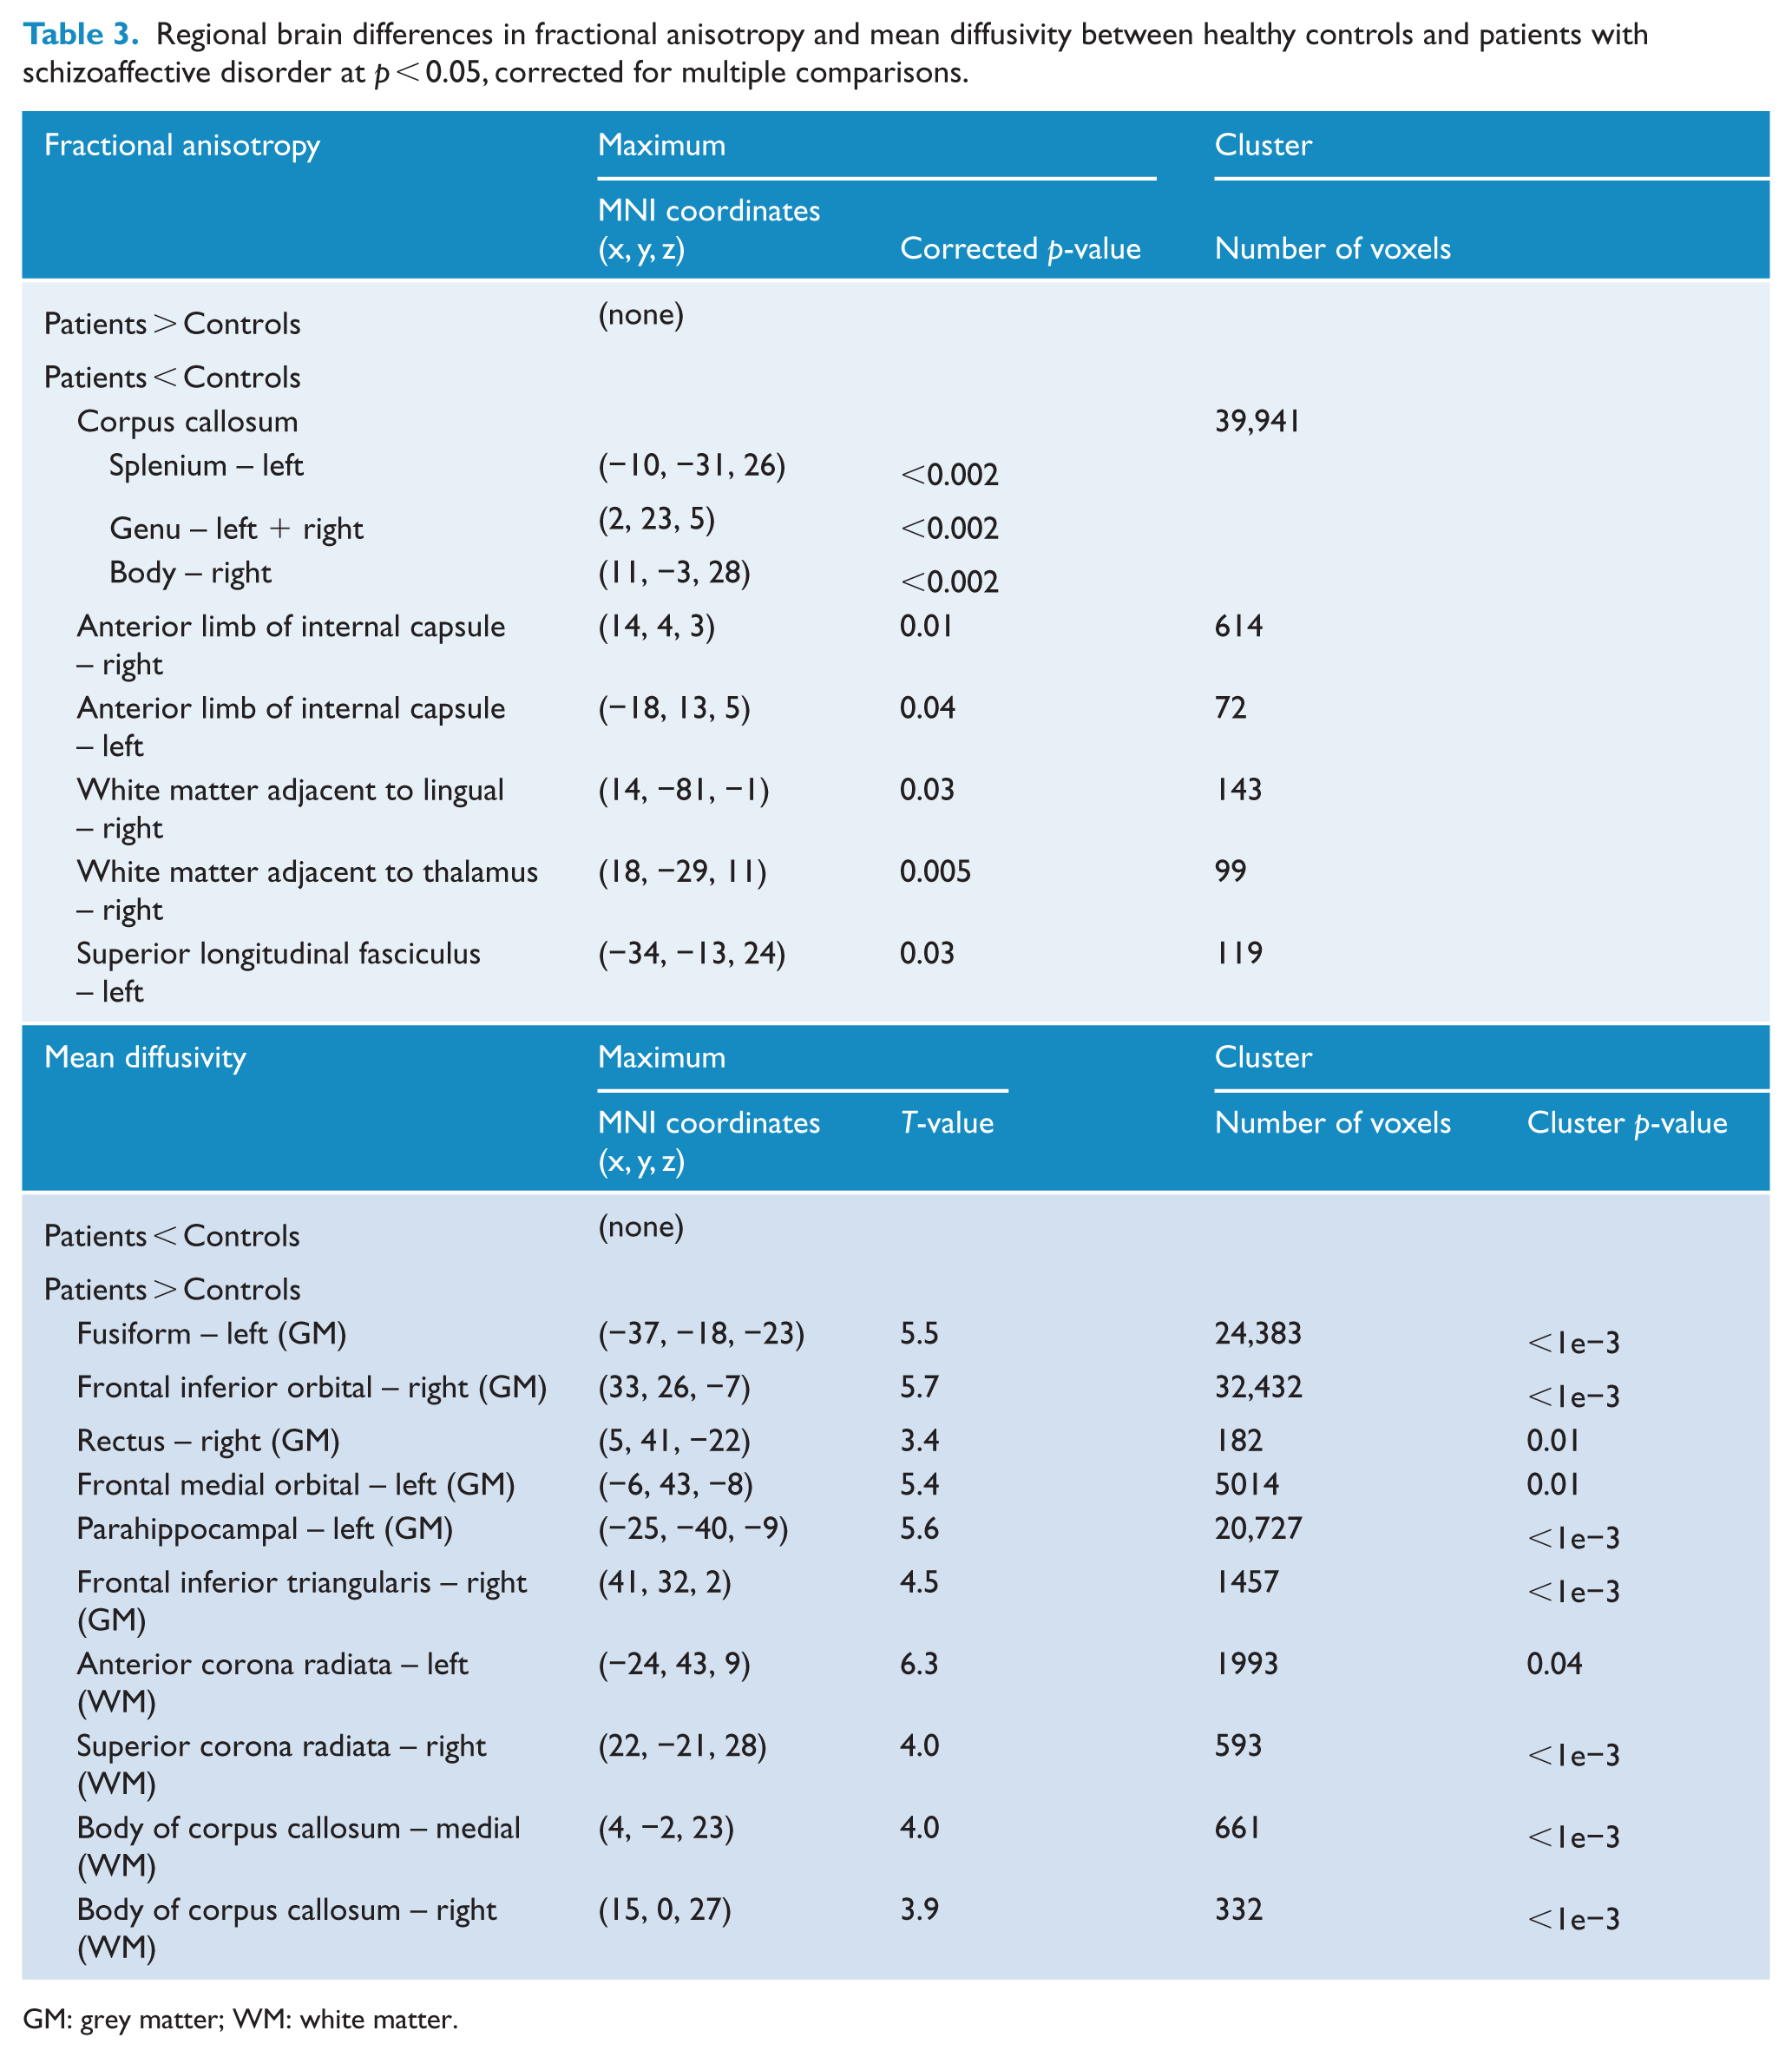
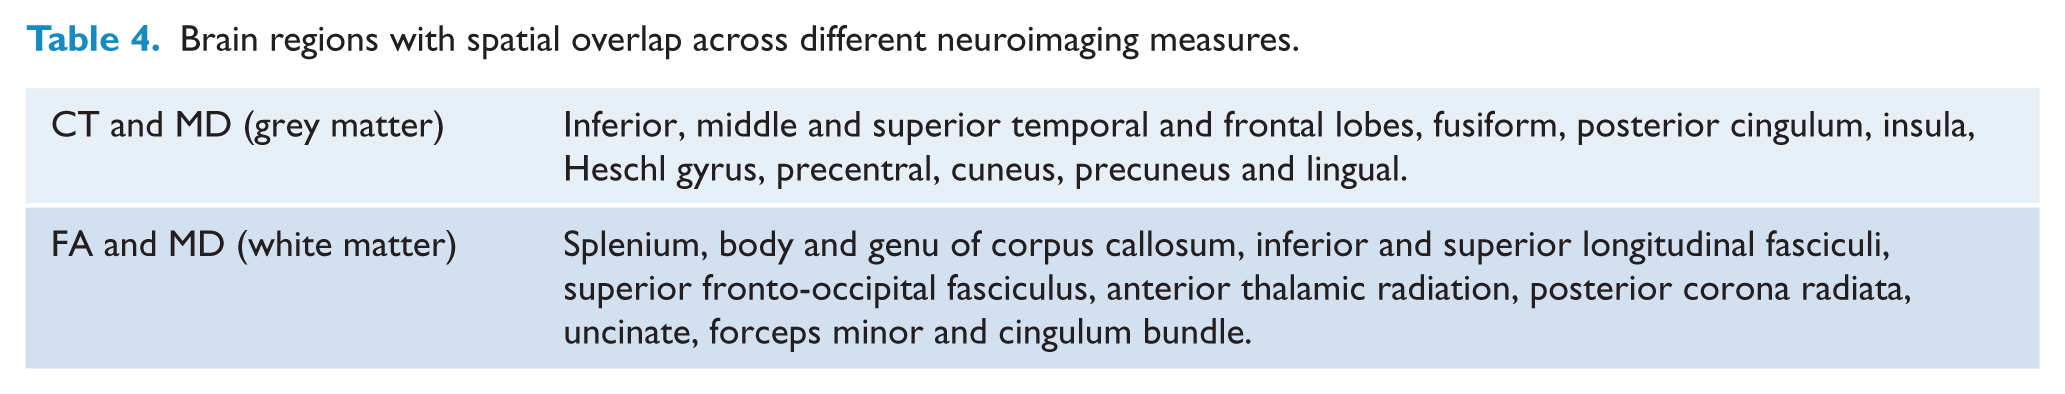
Spatial overlap of significant differences was observed across modalities at the group level. As shown in Figure 3(A), FA abnormalities partially encompassed clusters which were also significant in the MD and CT analyses; the two last measures also depicted spatial overlap in cortical areas. In order to highlight regions of convergence between different imaging modalities, the spatial overlap in white matter between FA and MD and in grey matter between CT and MD is shown in Figure 3(B). A detailed list of regions of convergent abnormalities using these measures is reported in Table 4. The relationship among MD, FA and CT values in these regions at the subject level is depicted in Figure 3(C). Notably, in these regions of abnormality, the increase in MD was statistically significant associated with lower FA (correlation = −0.78, p < 2 × 10⁻¹⁶) and CT (correlation = −0.67, p < 5 × 10⁻¹¹) in a large number of subjects.
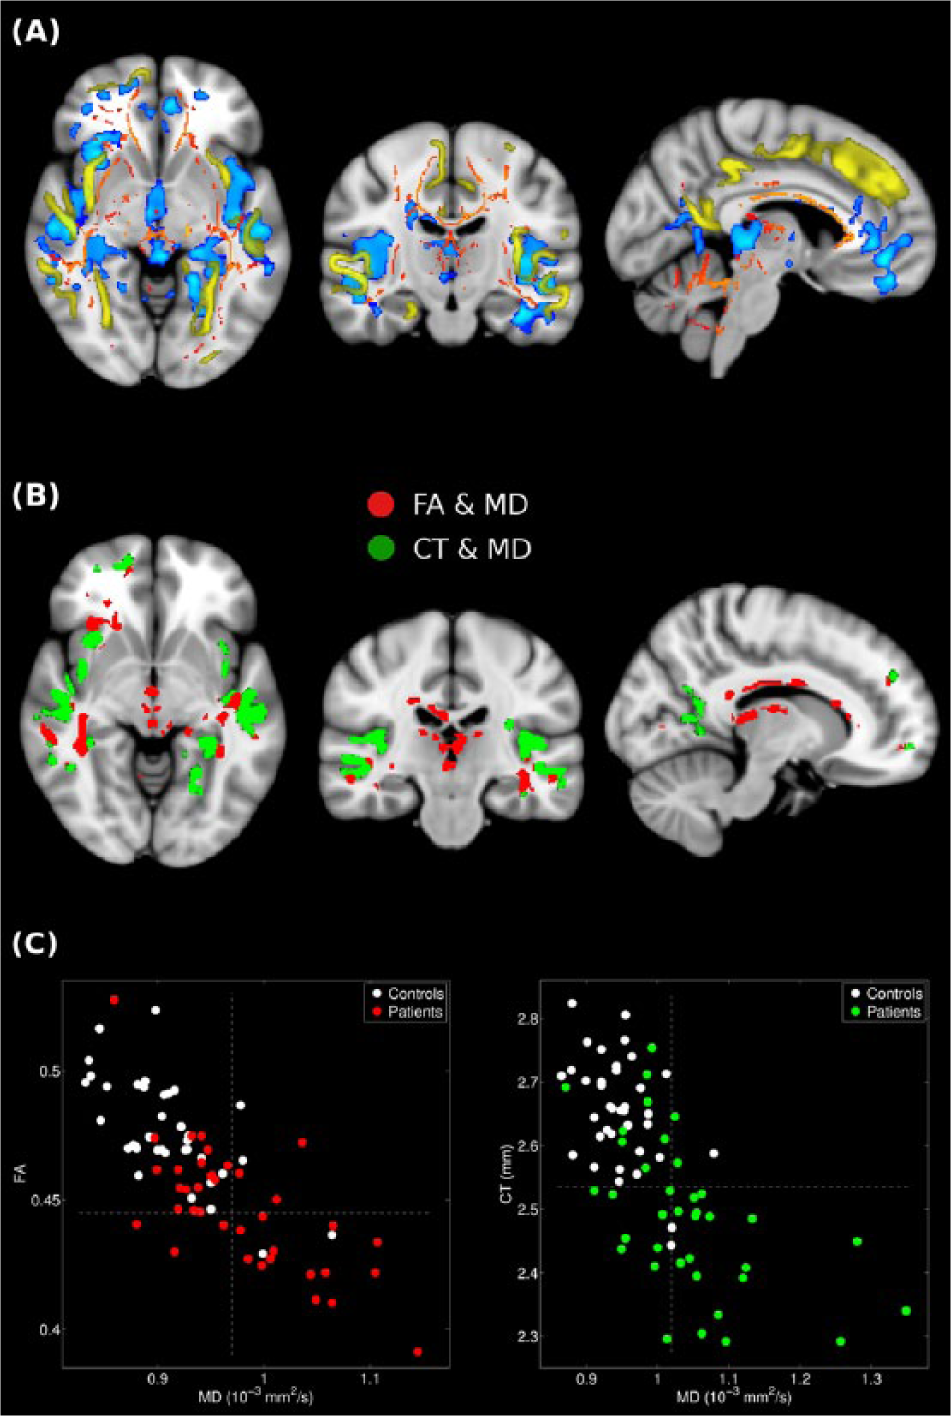
Combined view from different results evidencing spatial overlap across modalities. (A) Results from fractional anisotropy (FA) in white matter (in red-yellow), mean diffusivity (MD, in blue) and cortical thickness (CT) projected from the standard surface-based representation to the volume space (in yellow). (B) Regions showing significant statistical differences in white matter in both FA and MD contrasts (in red), and in grey matter in both CT and MD contrasts (in green). The background image is the standard structural brain template in MNI space. The right side of the images represents the right side of the brain. (C) Scatter plots showing the correlation (at the subject level) of the mean values for the regions depicted in panel (B) between FA and MD (left panel; correlation = −0.78, p < 2 × 10⁻¹⁶) and CT and MD (right panel; correlation = −0.67, p < 5 × 10⁻¹¹) in corresponding colours.
Brain regions with spatial overlap across different neuroimaging measures.
Discussion
Our findings revealed widespread abnormalities in both grey- and white-matter regions in patients with schizoaffective disorder when compared to matched healthy controls. Specifically, our patient group showed bilateral widespread volume reductions spanning from bilateral rostral and superior frontal cortices and left insula to the bilateral temporal lobes, posterior cingulate cortex, precuneus and the fusiform cortex. These volume reductions were primarily due to cortical thinning, although we also observed a region of decreased SA in the left fusiform. No regions of significant increase in CV, CT or SA were observed in our patient cohort. Moreover, the patients showed widespread decrease in FA in the corpus callosum, internal capsule, superior longitudinal fasciculus and white-matter tracts adjacent to affected grey-matter tissues, including the thalamus and the lingual gyrus. Finally, we found widespread increase in MD involving fronto-temporal and subcortical grey-matter regions, as well as more localized increase in white-matter regions in the corpus callosum and the corona radiata.
The widespread bilateral CV reduction observed in our patient group is consistent with previous VBM studies (Amann et al., 2015; Ivleva et al., 2012, 2013), which reported grey-matter volume reductions in the anterior and posterior cingulate cortex, insula, frontal, temporal, parietal and occipital regions as well as in subcortical structures, including the basal ganglia and thalamus. Of note, these studies found that patterns of grey matter volume reduction in schizoaffective disorder resembled the structural abnormalities typically seen in schizophrenia (Ellison-Wright and Bullmore, 2010). Importantly, our methodological approach enabled us to analyse CT and SA separately – the two different factors that constitute CV. Our findings demonstrated that in patients with schizoaffective disorder, reductions in CV are largely due to cortical thinning rather than local reduction in SA. Interestingly, widespread cortical thinning has also been reported in both schizophrenia (Goldman et al., 2009) and bipolar disorder (Foland-Ross et al., 2011). One previous study attempted to examine abnormalities in CV and in its constituent parts in patients with psychotic spectrum disorders (Rimol et al., 2012). They found SA reduction in patients with schizophrenia but not with bipolar I disorder. A direct comparison with our findings is not possible, as the previous study did not directly compare patients with schizoaffective disorder with healthy controls. In addition, the previous study did not include intracranial volume as a covariate in the statistical model; therefore, these regional alterations in SA may have been in part influenced by a more pronounced total brain volume reduction in patients with schizophrenia, rather than by specific regional alterations in corresponding areas. This is of importance as previous evidence suggests that unlike CT, SA is highly correlated with total brain volume (Winkler et al., 2010). In our analyses, which controlled for intracranial volume, patients with schizoaffective disorder showed a cluster of significantly reduced SA in the left fusiform only. The comparatively lower contribution of SA compared to CT in patients with schizoaffective disorder is consistent with the observation that SA reduction and cortical thinning are independent processes (Panizzon et al., 2009). It is possible, however, that both SA and CT are developmental in origin. Future longitudinal studies in childhood, adult and ageing populations are necessary to clarify the timing and mechanisms underlying SA alterations during development, and how this pathology relates to the emergence of symptoms in patients with schizoaffective disorder.
Importantly, our DTI findings provide the first evidence of white-matter abnormalities in patients with schizoaffective disorder. Previous DTI studies and one meta-analysis (Ellison-Wright and Bullmore, 2009) in schizophrenia, bipolar disorder and mixed schizophrenia spectrum samples have reported white-matter disruption in these disorders (for a review, see Wheeler and Voineskos, 2014). The most consistent findings in schizophrenia suggest alterations in the tracts connecting the frontal, occipital, parietal and temporal lobes (Ellison-Wright and Bullmore, 2009), which are in agreement with our results. Interestingly, widespread patterns of white-matter pathology have been reported in chronic psychotic patients in regions that closely align with the areas that we identified here (Antonius et al., 2011). Studies using mixed samples of patients with schizoaffective disorder and first episode schizophrenia have also reported FA reductions in fronto-temporo-parietal fibres (Hatton et al., 2014). On the contrary, DTI studies in bipolar disorder have shown gross inconsistencies in the location and extent of FA alterations in white matter (Benedetti et al., 2011; Chen et al., 2012). A recent study in patients with bipolar disorder using both FA and MD metrics, as well as additional indices of molecular diffusion from high angular resolution diffusion imaging data (Canales-Rodriguez et al., 2014), revealed alterations in a number of white-matter tracts including the corpus callosum, cingulum bundle, corona radiata and superior fronto-occipital fasciculus, and in cortical grey matter areas including the medial frontal cortex, insula and Heschl’s gyrus. Notably, our diffusion results also showed abnormalities in these regions, which lend support to the idea that schizoaffective disorder unifies white-matter abnormalities previously reported in both schizophrenia and bipolar disorder.
To integrate results from different imaging modalities, we performed an additional analysis at the subject level, which revealed the variations across the different measures were correlated in those areas of abnormalities with spatial overlap at the group level. Notably, the increase of MD was highly associated with a reduction of CT and FA. Thus, MD abnormalities in the cerebral cortex may be related to higher extracellular liquid content due to lower tissue volume. In non-cortical brain areas, diffusion results may reflect alterations in micro-structural properties, such as altered membrane permeability and neuroinflammation (Canales-Rodriguez et al., 2014). Further examination of these alterations is therefore warranted.
Our findings may provide further insight into the neurobiological underpinnings of clinical manifestations of patients with schizoaffective disorder. As stated above, we found both overlapping and adjacent grey–white-matter abnormalities which were predominantly located in the frontal cortex, striatum, limbic and temporal regions, as well as in tracts connecting these areas (for more details, see Table 4 and Figure 3). These regions have also been consistently reported to be abnormal in schizophrenia (Bora et al., 2011). Moreover, some of these regions have been implicated in both primary and secondary mood disorders (Sheline, 2003). Specifically, the insula is particularly relevant for the mapping of visceral states associated with the emotional experience (Damasio et al., 2013). The cingulate has also been implicated in aspects of mood as well as attention, error detection and decision-making (Devinsky et al., 1995). Interestingly, many of these regions are part of the Default Mode Network, an interconnected and anatomically defined brain system which, among others, includes the medial temporal lobe, the medial prefrontal cortex and the posterior cingulate cortex (Buckner et al., 2008). This brain network has been proposed to underlie the experience and maintenance of one’s sense of self, including aspects of perspective-taking, retrieving autobiographical memories and envisioning the future (Buckner et al., 2008). Default mode network dysfunction is a well-established finding in schizophrenia (Pomarol-Clotet et al., 2010; Salgado-Pineda et al., 2011) and has also been found in affective disorders (Allin et al., 2010; Pomarol-Clotet et al., 2012). Recent studies also demonstrated that this functional network is affected in a well-defined cohort of patients with schizoaffective disorder (Madre et al., 2013, 2014). How these alterations in brain structure underpin the hallmark features of schizoaffective disorder remains to be fully elucidated. Our findings, however, suggest that these structural abnormalities likely contribute to disturbances of mood and one’s sense of self, an area that will be key for future studies to address.
Finally, our findings may also help to understand how schizoaffective disorder fits within the schizophrenia – bipolar disorder nosological framework. As stated earlier, in schizophrenia, volumetric and VBM imaging studies report grey matter volume reductions in the temporal and frontal lobes, together with increased lateral ventricle volumes (Ellison-Wright and Bullmore, 2010). In contrast, in bipolar disorder, grey matter reductions are mainly restricted to paralimbic regions such as the anterior cingulate cortex and bilateral insulae (Bora et al., 2010; Ellison-Wright and Bullmore, 2010). In terms of DTI studies, a vast number of investigations have consistently reported decreased FA in individuals with schizophrenia in the white matter of the frontal, temporal and parietal lobes, and abnormalities in the long association tracts that connect these regions (Ellison-Wright and Bullmore, 2009; Wheeler and Voineskos, 2014). Our findings are consistent with both findings in schizophrenia and bipolar disorder. Thus, it seems plausible that like the clinical manifestation, structural and functional abnormalities in schizoaffective disorder fit on a continuum between schizophrenia and bipolar disorder. While this proposition is currently somewhat contentious, it is only through careful characterization of homogenous schizoaffective disorder cohorts that the neurobiological basis of this disorder can be well defined, in turn enabling the simultaneous refinement of the nosology of these clinical disorders.
Strengths of the study
The majority of neuroimaging studies in patients with schizoaffective disorder have included patients in heterogeneous samples of individuals with psychotic disorders such as schizophrenia and/or broad psychosis spectrum disorder. In our study, we used both the DSM-IV and RDC criteria for schizoaffective disorder, with the latter being widely regarded for its rigorous and detailed diagnostic guidelines. To the best of our knowledge, ours is the first neuroimaging study employing multiple MRI modalities to evaluate both grey- and white-matter structural abnormalities in this disorder compared with matched healthy controls. These analyses were performed using a whole-brain voxel-based approach, and hence the results are not biased by the selection of a priori ROIs. Furthermore, most existing DTI studies have routinely relied on the FA index only and have limited DTI analyses to white matter. Such an approach does not adequately describe diffusion in areas of kissing, branching and crossing fibres and thus cannot fully explain all possible morphological abnormalities in complex brain regions (Tuch et al., 2002). In contrast, the methodology used here allows for the detection of abnormalities in both grey- and white-matter tissues and thus is a strength of the current results.
Limitations
We examined groups of patients with schizoaffective disorder, bipolar type, with mixed, that is, manic, depressed presentations, both with psychotic symptoms, and also in clinical remission. This heterogeneity of current symptoms or clinical remission may have influenced our results. The sample of patients included in this study consisted of individuals with schizoaffective disorder, bipolar type, and thus our findings may not be representative of patients with schizoaffective disorder, unipolar type, an area which will be of interest for future studies to pursue. As is typical in neuroimaging studies of psychosis, our patients were all medicated at the time of assessment. Both antipsychotics (Navari and Dazzan, 2009) and lithium (Lyoo et al., 2010) have the potential to influence brain volume. While lithium treatment has been related to increased grey matter volume in bipolar disorder (Lyoo et al., 2010), antipsychotic treatment has been associated with decreased brain volume in schizophrenia (Fusar-Poli et al., 2013; Ho et al., 2011). In contrast, in the context of surface-based morphometry, previous studies have failed to find any significant effect of medication or symptom severity on CT or SA measures (Rimol et al., 2012). Future studies should be conducted to probe the medication effects on CT and on the water content of both cortical and subcortical structures. Furthermore, we did not use a structured diagnostic interview. Importantly, however, we confirmed the diagnosis over time by following up all patients prospectively (for at least 6 months). Finally, the statistical analyses performed in this study are based on the individual analysis of images from different modalities. New studies based on a fully multimodal data fusion approach may be considered (e.g. Linked Independent Component Analysis; Groves et al., 2011), to enable the investigation of interrelated components across multiple modalities. Unlike univariate methods, which can only examine voxel-by-voxel relationships, the multivariate approaches also have the potential to identify covariance patterns of abnormalities across brain regions. Thus, their results can be more easily interpreted in terms of brain networks. Such multivariate approaches could also result in greater statistical power and improved reproducibility.
Conclusion
In summary, our findings show that structural abnormalities in patients with schizoaffective disorder are widespread across various brain areas. The overlap of findings across different imaging techniques suggests consistent white- and grey-matter pathology in this disorder. Local reductions in CV are largely due to cortical thinning which affects the molecular diffusion process. Notably, the structural abnormalities were mainly detected in areas that are commonly reported to be altered in schizophrenia, and to some extent in bipolar disorder, which may explain the clinical overlap between schizoaffective disorder and these two related but distinct conditions.
Footnotes
Declaration of Conflicting Interests
The author(s) declared no potential conflicts of interest with respect to the research, authorship and/or publication of this article.
Funding
This work was supported by the Catalonian Government (2014-SGR-1573 to the Research Unit of FIDMAG) and several grants from the Plan Nacional de I+D+i and co-funded by the Instituto de Salud Carlos III-Subdirección General de Evaluación y Fomento de la Investigación, Plan Nacional 2008–2011 and 2013–2016, and the European Regional Development Fund (FEDER): a Stabilization Contract grant (CES 12/024) and grants (PI07/1278, PI10/02622 and PI/15/02242) to B. L. Amann and a grant (PI10/01058) and a Miguel Servet Research Contract grants (CP10/00596) to E. Pomarol-Clotet. We acknowledge also the generous support by the Centro de Investigación Biomédica en Red de Salud Mental (CIBERSAM), Madrid, Spain.