
Abstract
Objective:
Whether tea consumption decreases the risk of depression remains controversial. We performed a meta-analysis of findings from observational studies to evaluate the association between tea consumption and depression risk.
Method:
Embase, PubMed, and Chinese National Knowledge Infrastructure databases were searched from their inception through August 2014 for observational studies that had reported the association between tea consumption and depression risk. We used a fixed effects model when heterogeneity was negligible and a random effect model when heterogeneity was significant to calculate the summary relative risk estimates (RRs) and 95% confidence intervals (CIs).
Results:
Eleven studies with 13 reports were eligible for inclusion in the meta-analysis (22,817 participants with 4,743 cases of depression). Compared to individuals with lower tea consumption, those with higher tea consumption had a pooled RR of depression risk at 0.69 (95% CI: 0.63–0.75). Eight reports were included in the dose–response analysis of tea consumption and depression risk (10,600 participants with 2,107 cases). There was a linear association between tea consumption and the risk of depression, with an increment of 3 cups/day in tea consumption associated with a decrease in the risk of depression of 37% (RR = 0.63, 95% CI: 0.55–0.71).
Conclusion:
Tea consumption is associated with a decreased risk of depression.
Introduction
Depression is an important public health issue, with a prevalence rate of approximately 15% among adults in high-income countries (Bromet et al., 2011), and affecting more than 350 million people of all ages worldwide (World Health Organization, 2012). Moreover, the incidence of depression is growing, and is projected to rank third among disorders contributing to the global burden of disease by 2030 (Mathers and Loncar, 2006). Depression is estimated to cause 1 million people to commit suicide each year, and it leads to increased risk of morbidity and mortality (Ng et al., 2007).
Although antidepressants have been clinically available for several decades, their effectiveness is not assured. Only 33% of depressed people respond to the first antidepressant medication trialed (Trivedi et al., 2006), and many experience serious adverse effects. Thus, it is very important to prevent and treat depression with new perspectives. For example, research suggests that lifestyles, such as smoking (Paperwalla et al., 2004), alcohol drinking (Wang et al., 2012), and pattern of food consumption (Mikolajczyk et al., 2009), may be associated with depressive symptoms. In this context, interest in the effect of tea consumption on the risk of depression has been growing.
Tea is the second most consumed beverage in the world, after water (Cheng, 2006). Given its popularity, even small health benefits from tea could have considerable public health impact. It has been suggested that the neuroprotective biological activities of tea might be beneficial in neurodegenerative diseases, where depression is a common symptom (Pan et al., 2003). Animal studies have shown that tea extract has an antidepressant effect (Unno et al., 2011; Zhu et al., 2012). Moreover, Sun (2003) suggested that daily intake of morning/evening menopausal formula, which included tea extract, could relieve anxiety and depression among healthy post-menopausal women.
However, the association between tea drinking and depression in the general population remains unclear. Several population-based studies (Chen et al., 2010; Feng et al., 2012; Feng et al., 2013; Hintikka et al., 2005; Kuriyama et al., 2006; Niu et al., 2009; Pham et al., 2013; Ruusunen et al., 2010; Tsai et al., 2011; Tsai et al., 2013; Wang, 2012) have recently investigated the association, but the findings are inconsistent. Therefore, we conducted a meta-analysis of observational studies to compare the depression risk in higher tea consuming populations with that in lower tea consuming populations, and to evaluate the dose–response association between tea consumption and depression risk.
Method
We designed and reported the systematic review and meta-analysis according to established guidelines (Stroup et al., 2000).
Search strategy
We performed a systematic search for publications in Embase, PubMed, and Chinese National Knowledge Infrastructure from their inception through August 2014 without language restrictions. The search terms were ‘tea’ or ‘camelia sinensis’ or ‘catechin’ or ‘polyphenols’ or ‘theanine’ or ‘flavonoids’ combined with ‘depression’ or ‘depressive disorder’ or ‘depressive symptom’. Furthermore, we reviewed the reference lists of the obtained articles to search for additional studies. We did not contact authors of the previous studies for additional data.
Study selection
Studies were eligible for inclusion if they met the following criteria: (i) the study was conducted in humans and the study design was observational, (ii) the exposure of interest was tea consumption, (iii) the outcome of interest was depression, (iv) the frequency or dose of tea consumption were provided, and (v) the study reported a risk estimate (relative risk (RR), odds ratio (OR), or hazard ratio (HR)) with 95% confidence intervals (CI) or sufficient information to allow their calculation. If data were duplicated in more than one study, the most recent and comprehensive study was included in the meta-analysis. Letters, editorials, news, replies, commentaries, reviews without original data and case reports were excluded from the meta-analysis.
Data extraction
Data were extracted independently by two investigators (XD and SC) using a predefined data collection form, with disagreements being resolved by consensus. The following information from the studies was extracted: first author’s last name, publication year, study design, setting, type of tea, sample size (number of participants and cases), participants’ age, outcome assessment, category of tea consumption, relative risk estimates with 95% CIs for each category of tea consumption, and variables adjusted for in the analysis. When studies had several adjusted models, those that reflected the maximal extent of adjustment for potentially confounding variables were extracted. Clinical depression was diagnosed according to the International Classification of Diseases (ICD) criteria and confirmed by psychiatrist interview (Ruusunen et al., 2010), while depressive symptom was assessed by validated depression severity scales, such as the Geriatric Depression Scale (GDS) (Brink et al., 1982), the Beck Depression Inventory (BDI) (Beck et al., 1961), and the Center for Epidemiological Studies Depression Scale (CES-D) (Radloff, 1977).
Assessment of study quality
The Newcastle-Ottawa quality assessment scale (Wells et al., 2011) was applied to evaluate the quality of cohort and case-control studies with respect to selection of participants, comparability of groups, and exposure/outcome ascertainment. This scale awards a maximum of 9 points to each type of study. Studies scoring 8–9 points, 6–7 points, and 0–5 points were identified as high, moderate, and low quality of studies, respectively. The cross-sectional study quality assessment scale of the Agency for Healthcare Research and Quality (US) (Rostom et al., 2004) was used to evaluate the quality of cross-sectional studies. This scale includes 11 items and awards a maximum of 11 points. Studies scoring 9–11 points, 6–8 points, and 0–5 points were identified as high, moderate, and low quality of studies, respectively. Only studies of moderate or high quality were included in our meta-analysis.
Statistical analysis
In the meta-analysis, OR and HR were deemed equivalent to RR (Greenland, 1987; Zhang and Yu, 1998), the RRs and 95% CIs were considered as the effect size for all studies. When RRs were not available in the original studies, they were computed using Woolf’s formula.
The association analysis of higher level of tea consumption (higher vs. low) with depression risk was carried out based on all eligible studies. For the studies that reported RRs with 95% CIs for at least three quantitative categories of tea consumption, we combined the results of the higher level categories and calculated a common RR for the association analysis of higher level of tea consumption with depression risk using a fixed effects model.
Dose–response analysis was conducted to evaluate the effect of an increment of 3 cups/day in tea consumption on depression risk. In the dose–response analysis, we assigned exposure values, in cups per day, to the tea consumption categories in the original studies as follows. The various measures of tea consumption (cups, grams, milliliters, and times) were transformed to a common measure of cups per day (1 cup = 100 ml = 2 g dry tea leaves, 3 cups at a time) (Tang et al., 2009; Peters et al., 2001). We used the method proposed by Greenland and Longnecker (1992) and Orsini et al. (2006) to calculate the trend from the correlated estimates for the log relative risk across categories of tea consumption, assigning to each class the dose corresponding to the midpoint of upper and lower boundaries. If the highest category was open-ended and included no more than 20% of the study subjects, we assigned the category a value equal to 1.2 times its lower boundary; otherwise, we assigned 1.4 times its lower boundary for the expected right skewed distribution (Peters et al., 2001). If the lowest category was open-ended, we set the lower boundary to zero. In addition, because the method of dose–response analysis requires the risk estimates with their variance estimates for three or more quantitative exposure categories (Orsini et al., 2006; Peters et al., 2001), the studies with only two categories were excluded in the dose–response analysis.
Statistical heterogeneity was tested by Q statistic with a significance level at p < .10 and I2 statistics (Higgins et al., 2003). For the I2 metric, we considered minimal, moderate, and substantial I2 values to be 25%, 50%, and 75%, respectively (Higgins, 2008; Higgins et al., 2003). We used a fixed effects model (Mantel-Haenszel method) when heterogeneity was negligible, and a random effects model (DerSimonian and Laird method) when heterogeneity was significant (Lau et al., 1997) to calculate the summary RR estimates and 95% CIs. The Begg rank correlation test (Begg and Mazumdar, 1994), the Egger linear regression test (Egger et al., 1997), and funnel plots were used to assess the publication bias.
To explore potential sources of heterogeneity, subgroup analyses were carried out by study design, type of tea, number of cases and participants, study location, study quality, and whether other diet variables or lifestyle factors (such as physical exercise, alcohol consumption, and smoking) were controlled for in the models. To test the robustness of the results, sensitivity analyses, by excluding each study in turn and recalculating the pooled estimates on the remaining studies, were conducted to investigate whether the overall risk estimate was affected significantly by an individual study. All analyses were performed with Stata software, version 11.0 (Stata Corp LP, College Station, Texas, USA), and all statistical tests were two-sided with a significance level of .05, except where otherwise specified.
Results
Study selection
After removing duplicates, we identified 1,697 unique references for screening of titles, abstracts, and keywords (Figure 1). Of these, we retrieved 37 in full and rated 10 articles as eligible for the review. In addition, we searched the reference lists of relevant original papers and review articles, and identified one additional article (Hintikka et al., 2005) that met the inclusion criteria. The article by Tsai et al. (2013) reported the risk estimate of a prospective cohort study and a cross-sectional study respectively, and it was treated as two separate reports. In addition, the article by Wang (2012) reported the risk estimate of the city and the rural respectively, and it was also treated as two separate reports. In total, the meta-analysis of higher level of tea consumption with depression risk included 11 articles with 13 independent reports. But in the dose–response analysis, three articles (Ruusunen et al., 2010; Tsai et al., 2013; Wang, 2012) with five reports were excluded for fewer than three categories of tea computation, and, therefore, eight independent reports were left in the dose–response analysis.
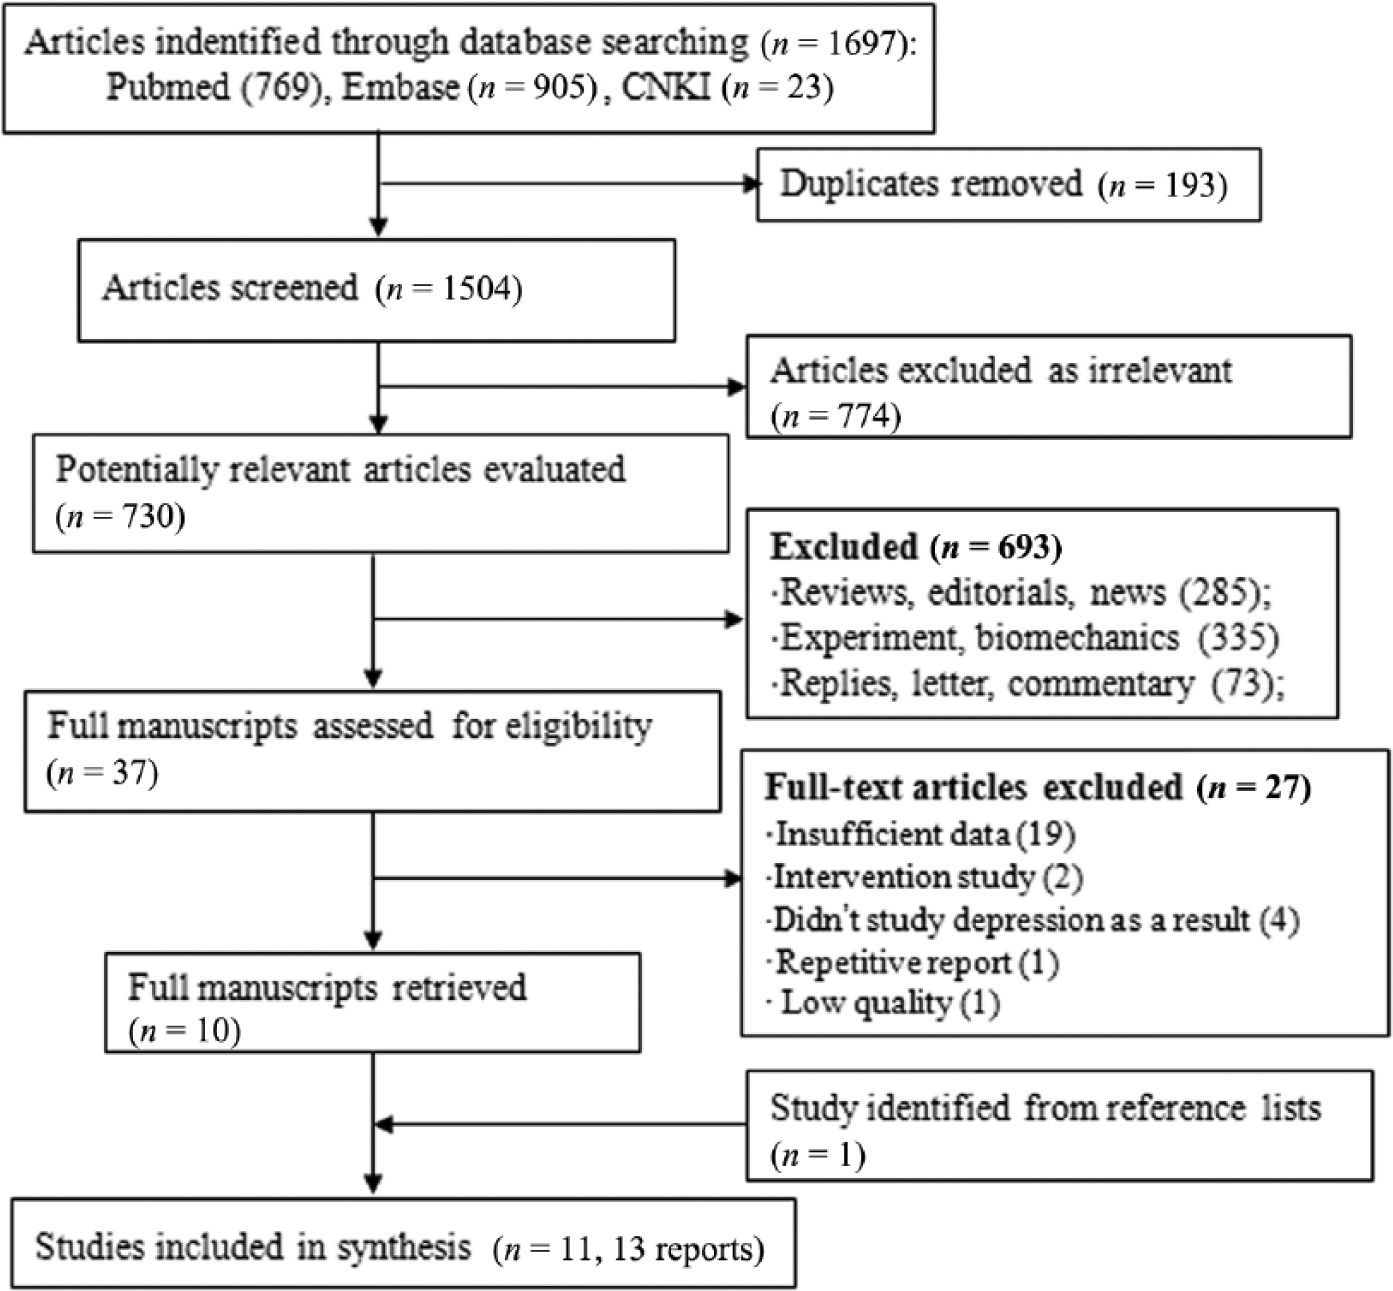
Flowchart indicating the results of the systematic review with inclusions and exclusions.
Study characteristics
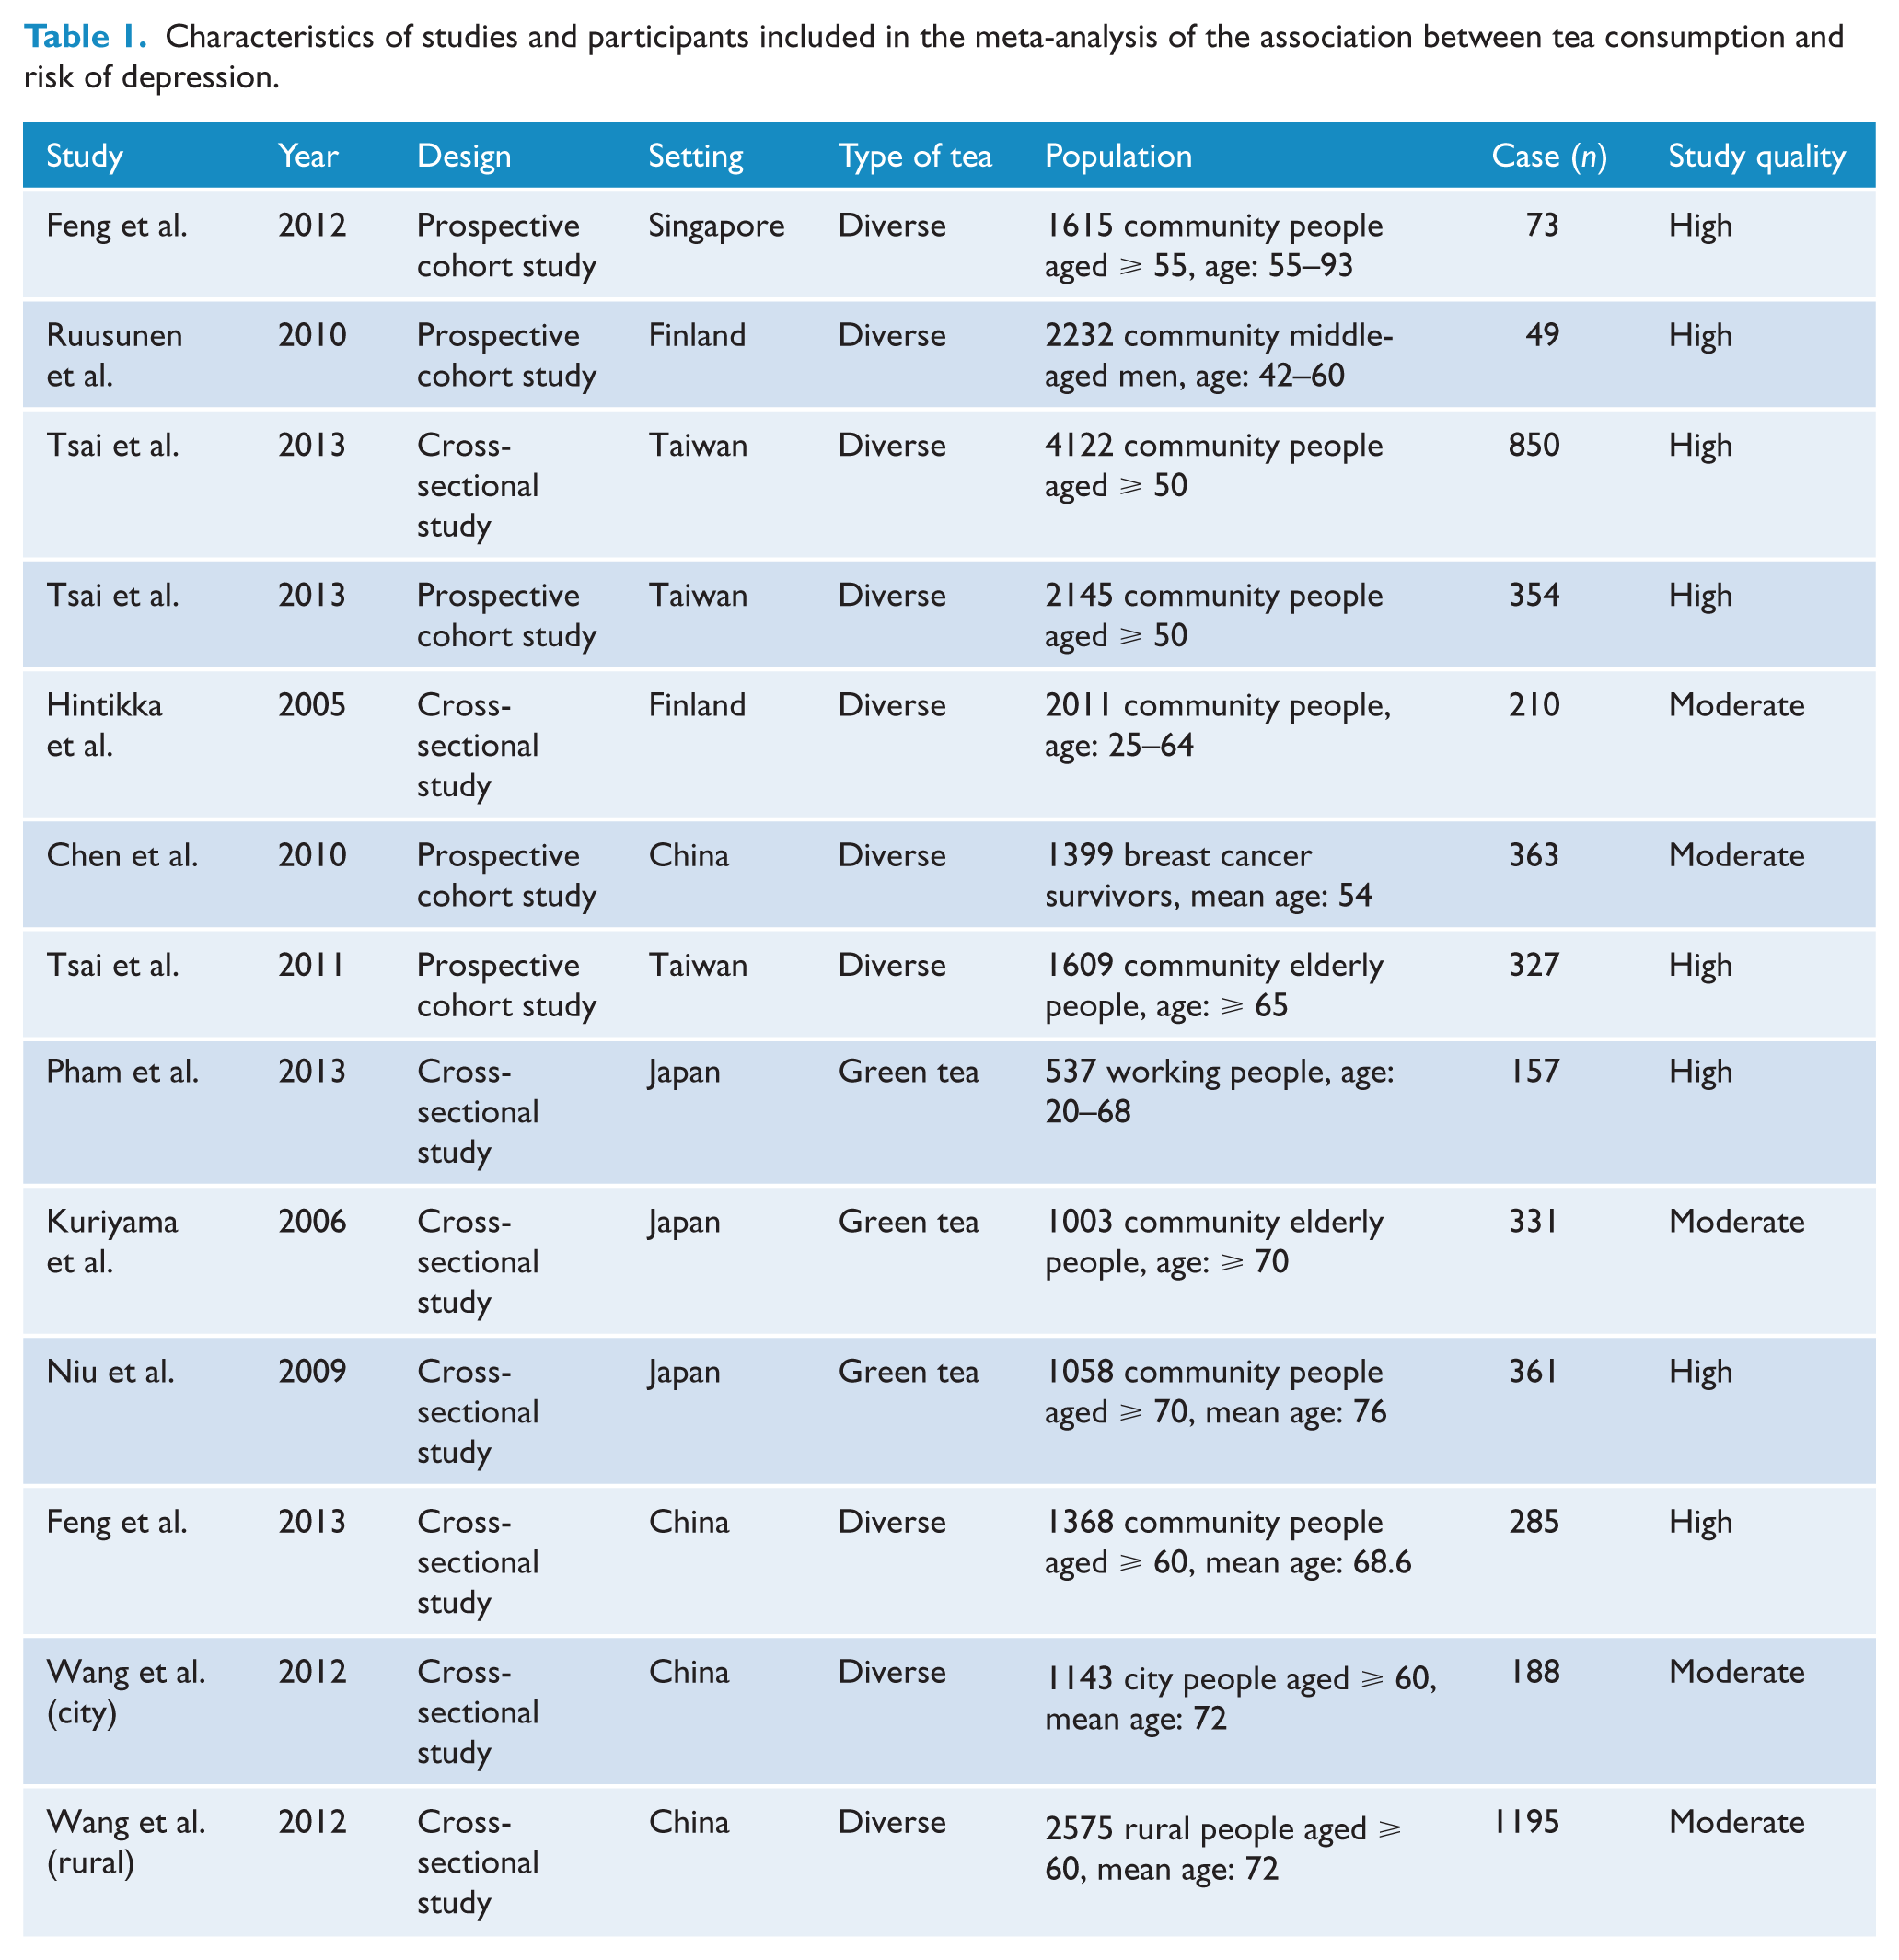
Table 1 and Table 2 show the information extracted from all included studies. There were five cohort reports, and the results of quality assessment (score 0–9) yielded a score of 7 or above for all cohort reports, with an average score of 8. There were eight cross-sectional reports, the results of quality assessment (score 0–11) yielded a score of 7 or above for all cross-sectional reports, with an average score of 8.6. Among these reports, 11 were from Asia (Singapore, Taiwan, China, and Japan) and two were from Finland. One study used ICD criteria and the psychiatrist diagnosis to assess clinical depression, and the other studies used validated depression severity scales to assess depressive symptoms. The meta-analysis of higher level of tea consumption with depression risk consisted of 22,817 participants with 4,743 cases of depression, while the dose–response analysis consisted of 10,600 participants with 2,107 cases.
Characteristics of studies and participants included in the meta-analysis of the association between tea consumption and risk of depression.
Outcomes and reanalysis of included studies of tea consumption in relation to risk of depression.
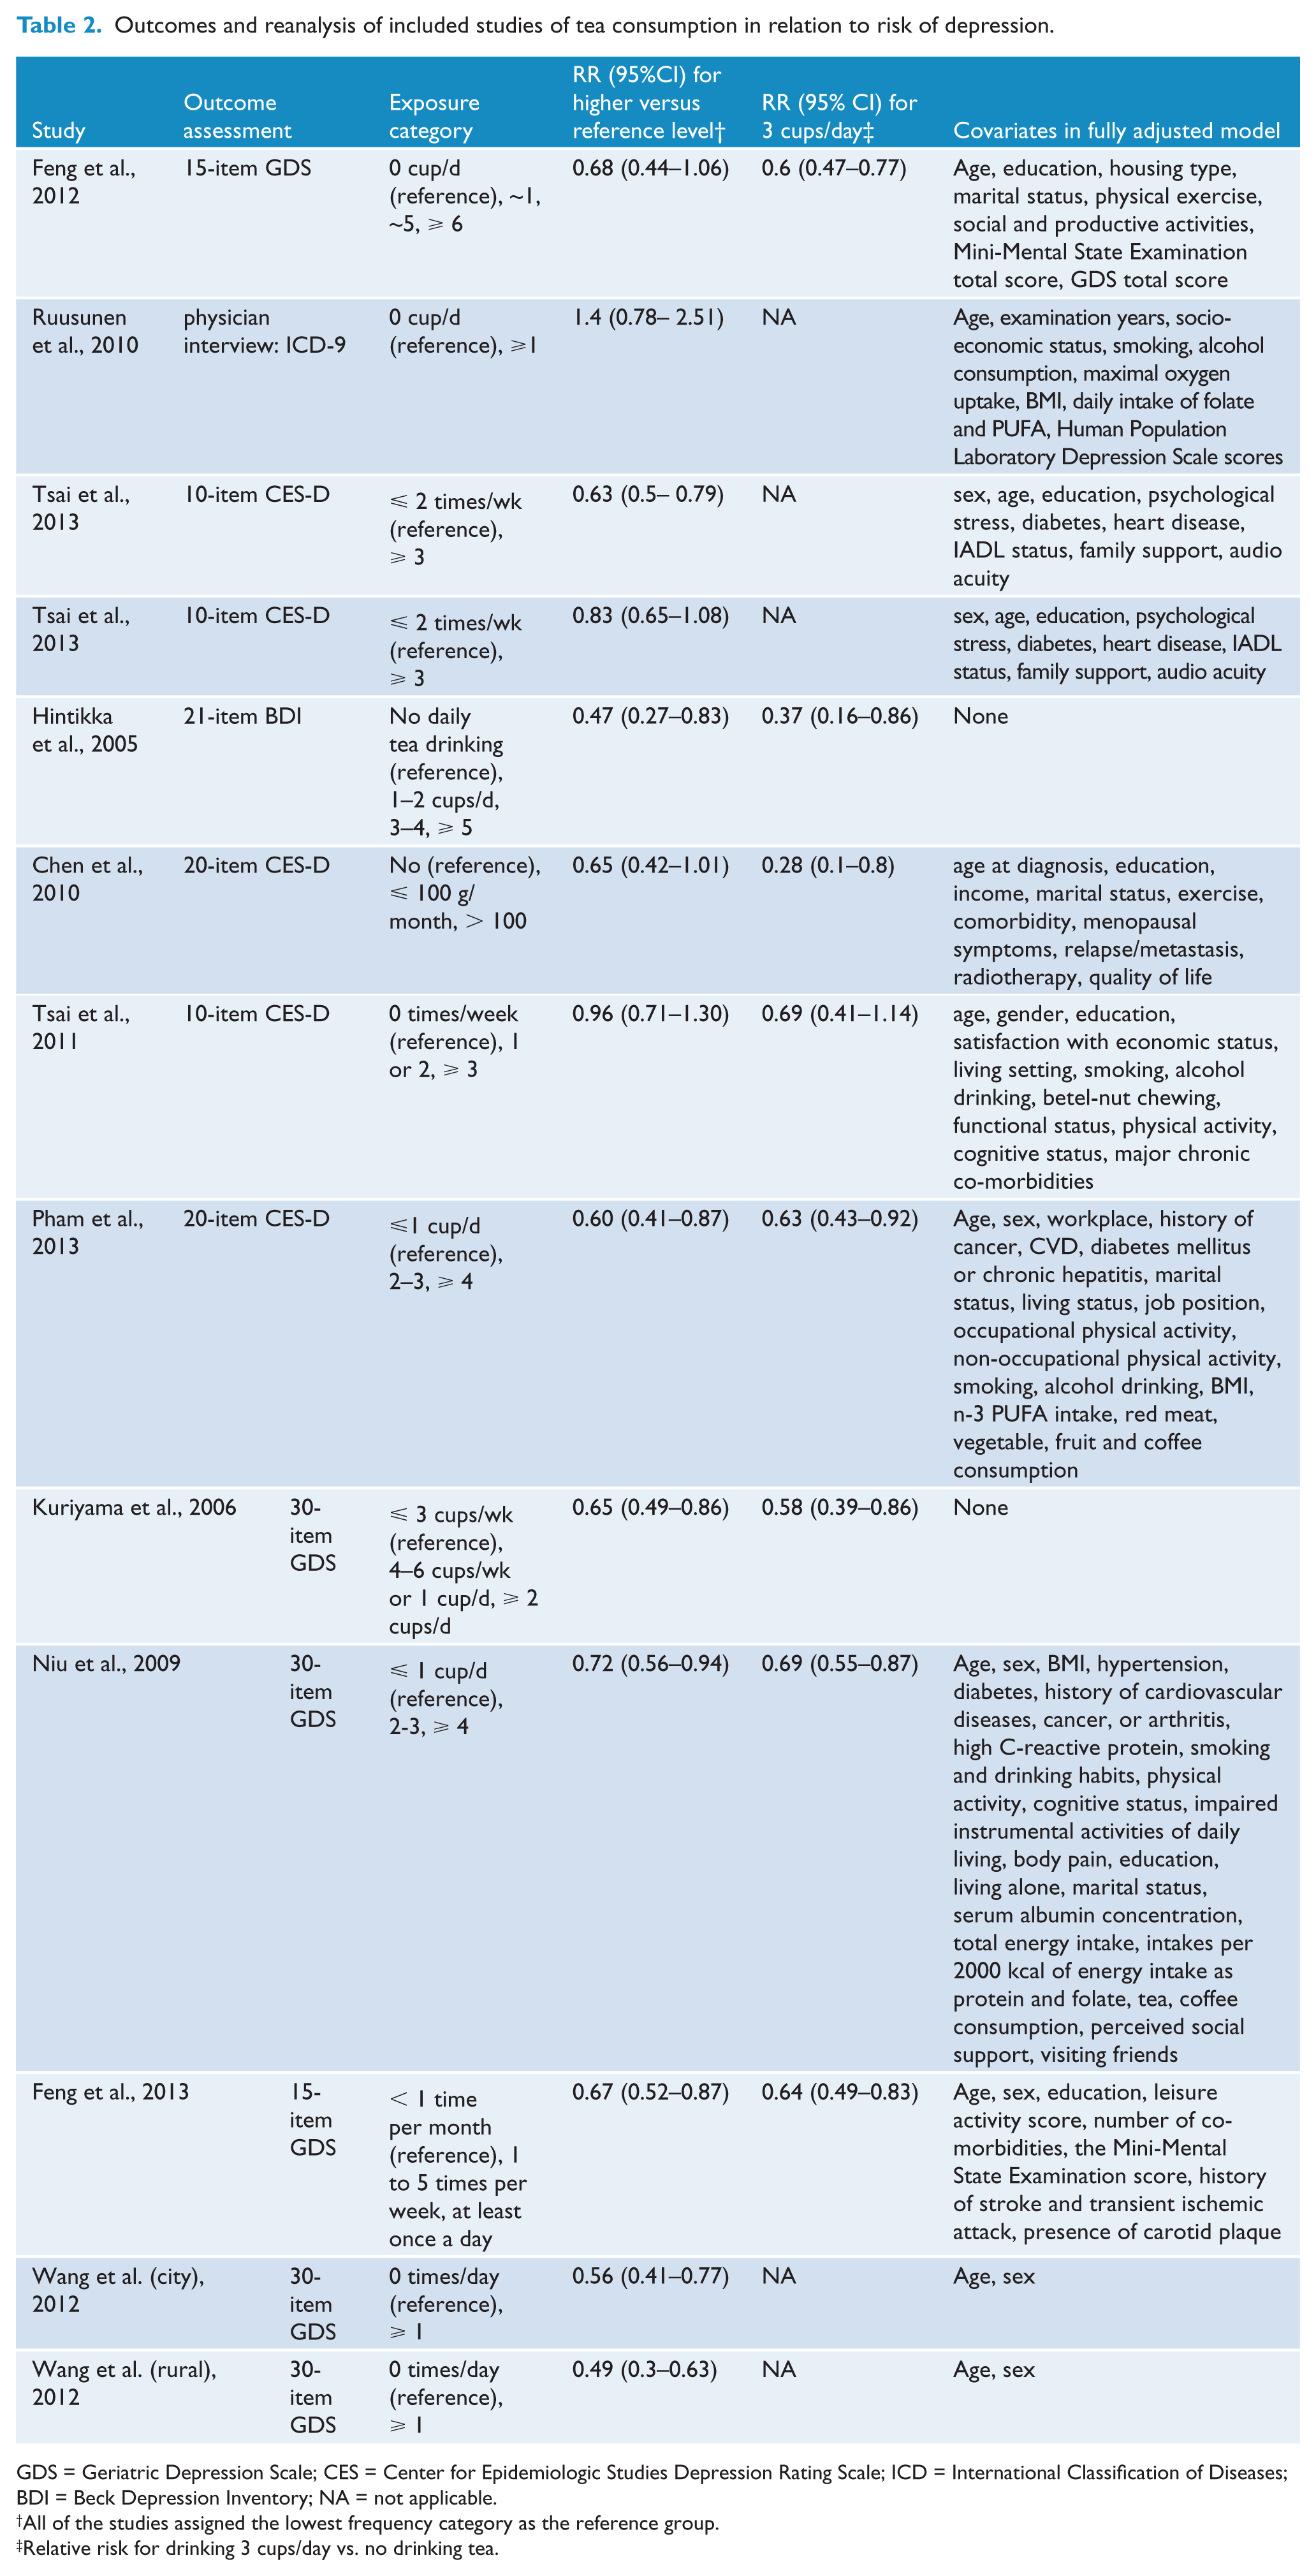
GDS = Geriatric Depression Scale; CES = Center for Epidemiologic Studies Depression Rating Scale; ICD = International Classification of Diseases; BDI = Beck Depression Inventory; NA = not applicable.
All of the studies assigned the lowest frequency category as the reference group.
Relative risk for drinking 3 cups/day vs. no drinking tea.
Association of higher level of tea consumption (higher vs. low) with depression risk
Eleven articles with 13 reports were included in the meta-analysis of higher level of tea consumption and depression risk. RRs with 95% CIs of depression risk for higher tea consumption compared with low (reference) tea consumption for individual reports are shown in Table 2, and the pooled results of the 13 reports are shown in Figure 2. A significant 31% decrease in the risk of developing depression was observed for higher tea consumption compared with low tea consumption (RR = 0.69, 95% CI: 0.63–0.75). The Begg rank correlation test and the Egger linear regression test indicated no evidence of publication bias among these reports (Begg’s test: Z = 0.06, p = .951; Egger’s test: t = -0.1, p = .925). Visual inspection of the funnel plot also failed to identify substantial asymmetry (Supplementary Figure 1 in the Supplementary Material). There was moderate heterogeneity among the reports (p = .056, I2 = 41.9%).
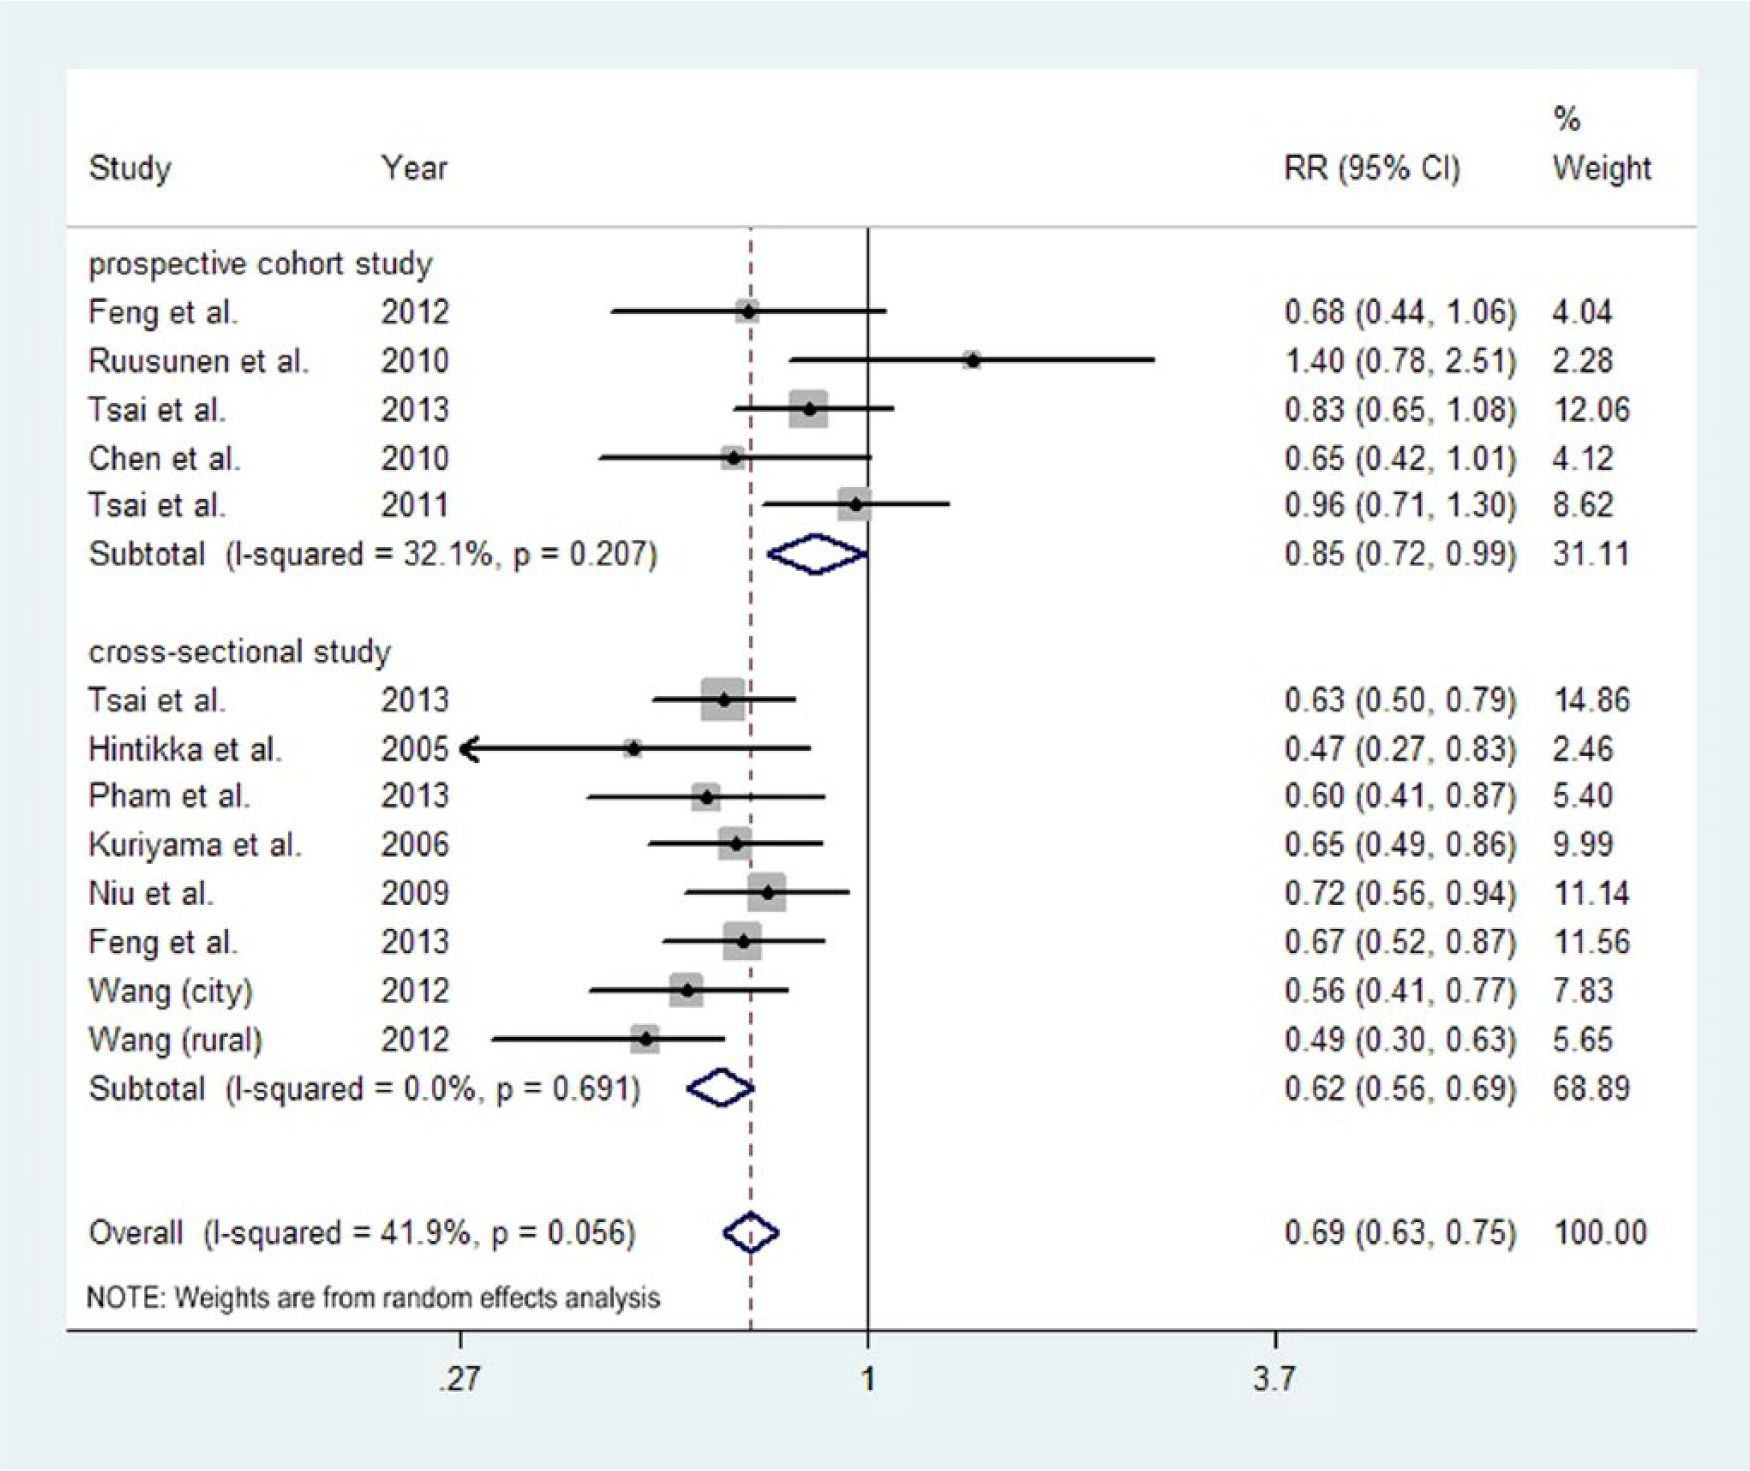
Summary relative risks (RRs) of depression for higher versus low level of tea consumption.
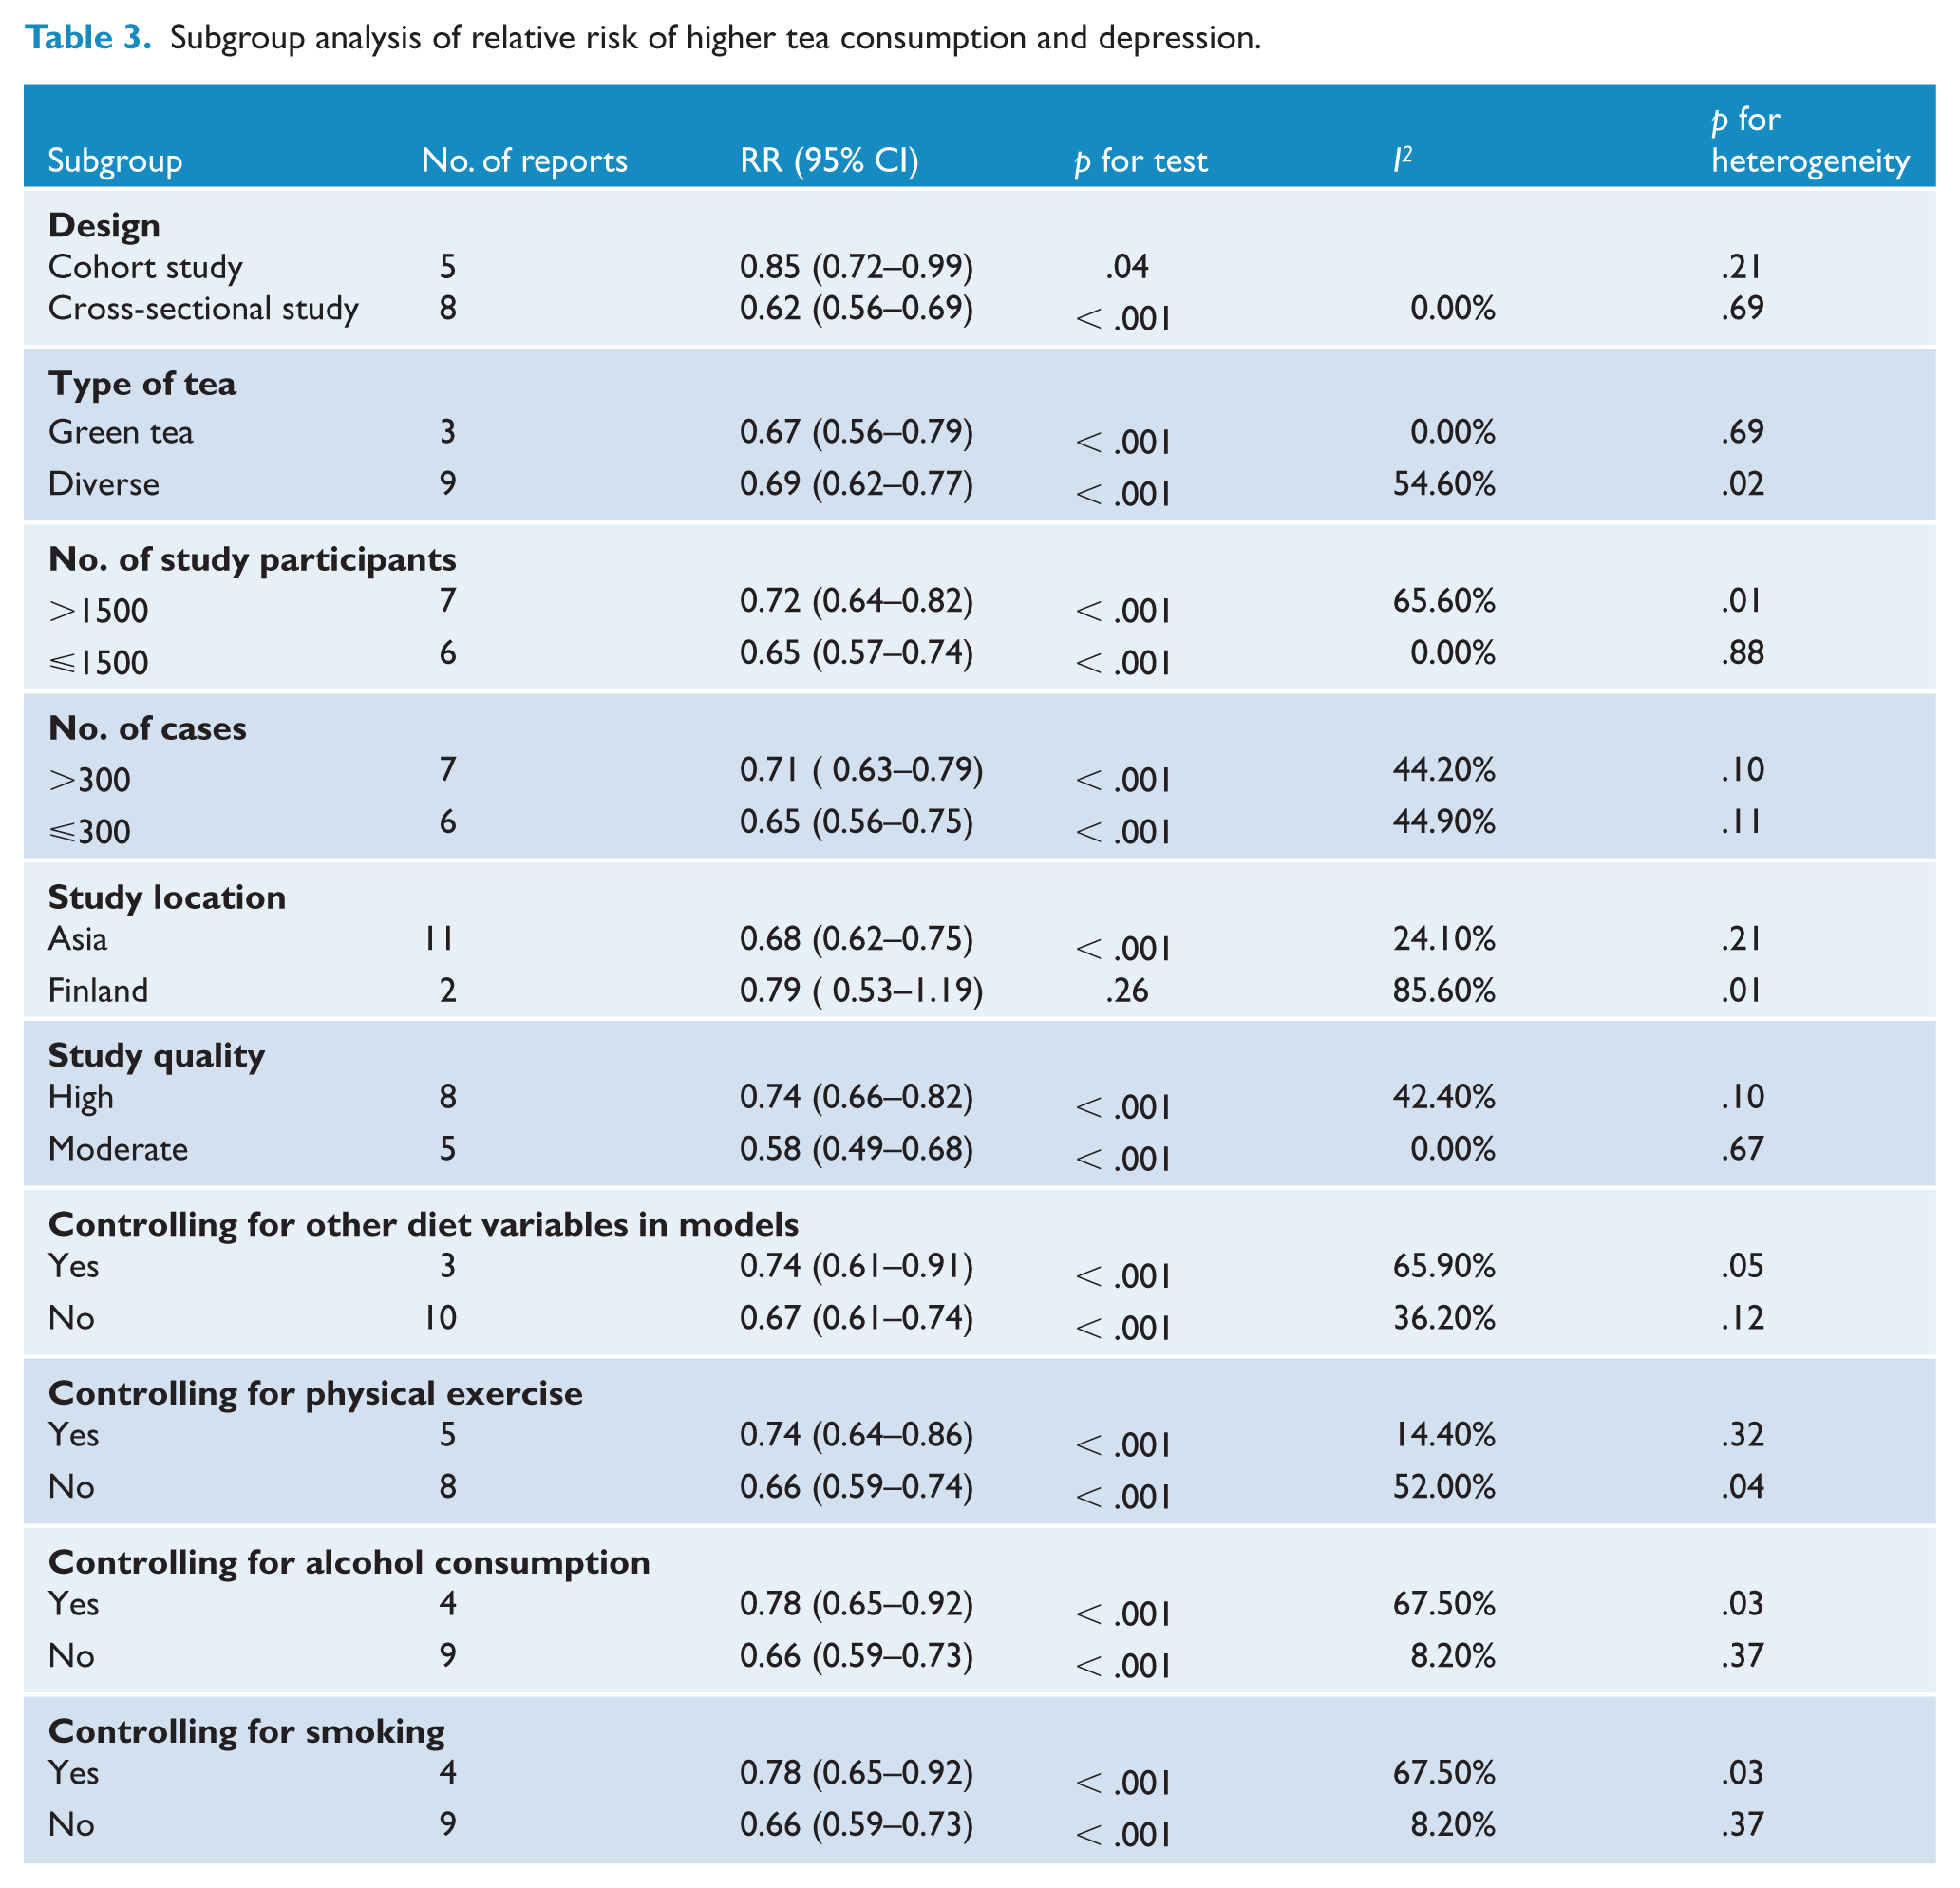
Subgroup analyses were conducted to examine the stability of the primary results (Table 3). Overall, higher tea consumption had a protective effect against depression in all subgroups except for study location. Significant reduced risk was observed in Asia populations (RR = 0.68, 95% CI: 0.62–0.75), while no significant result was observed in Finland populations (RR = 0.79, 95% CI: 0.53–1.19). But there was substantial heterogeneity between the reports from Finland (p = .01, I2 = 85.6%). In the sensitivity analyses, we excluded each report in turn and pooled the results of the remaining reports. The overall combined RRs did not change substantially, with a range from 0.67 (95% CI: 0.62–0.74) to 0.70 (95% CI: 0.64–0.77).
Subgroup analysis of relative risk of higher tea consumption and depression.
Dose–response relationship of an increment of 3 cups/day in tea consumption with depression risk
Eight reports were included in the dose–response analysis of tea consumption and depression risk. We found there was a linear association between tea consumption and risk of depression (p < .05 for linearity; Figure 3). The RRs with 95% CIs of depression for an increase of 3 cups/day in tea consumption for the individual reports are shown in Table 2, and the pooled results of the eight reports are shown in Figure 4. The pooled RR of depression for every 3 cups/day increment in tea consumption was 0.63 (95% CI: 0.55–0.71). There was no evidence of heterogeneity across reports (p = .670, I2 = 0.00%).
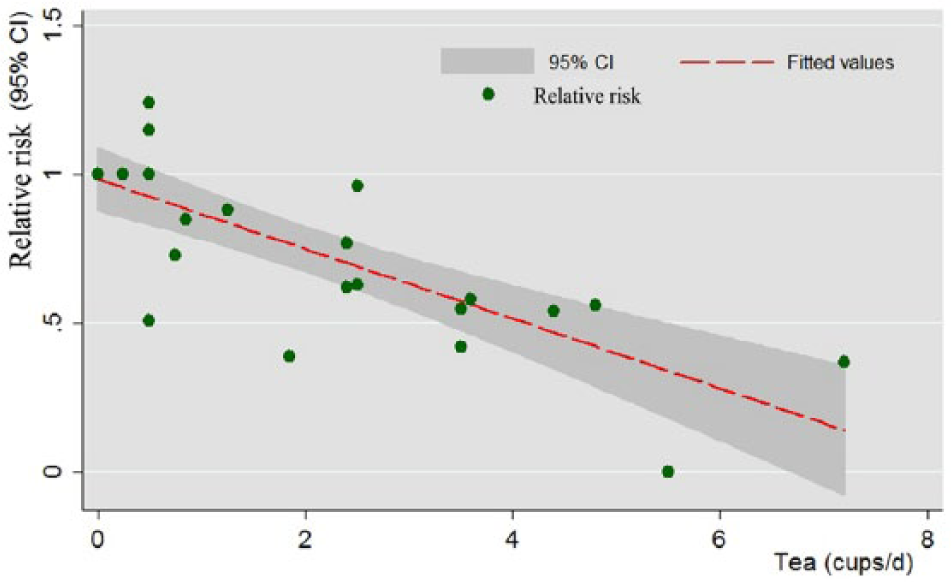
Dose–response analyses of tea consumption and risk of depression.
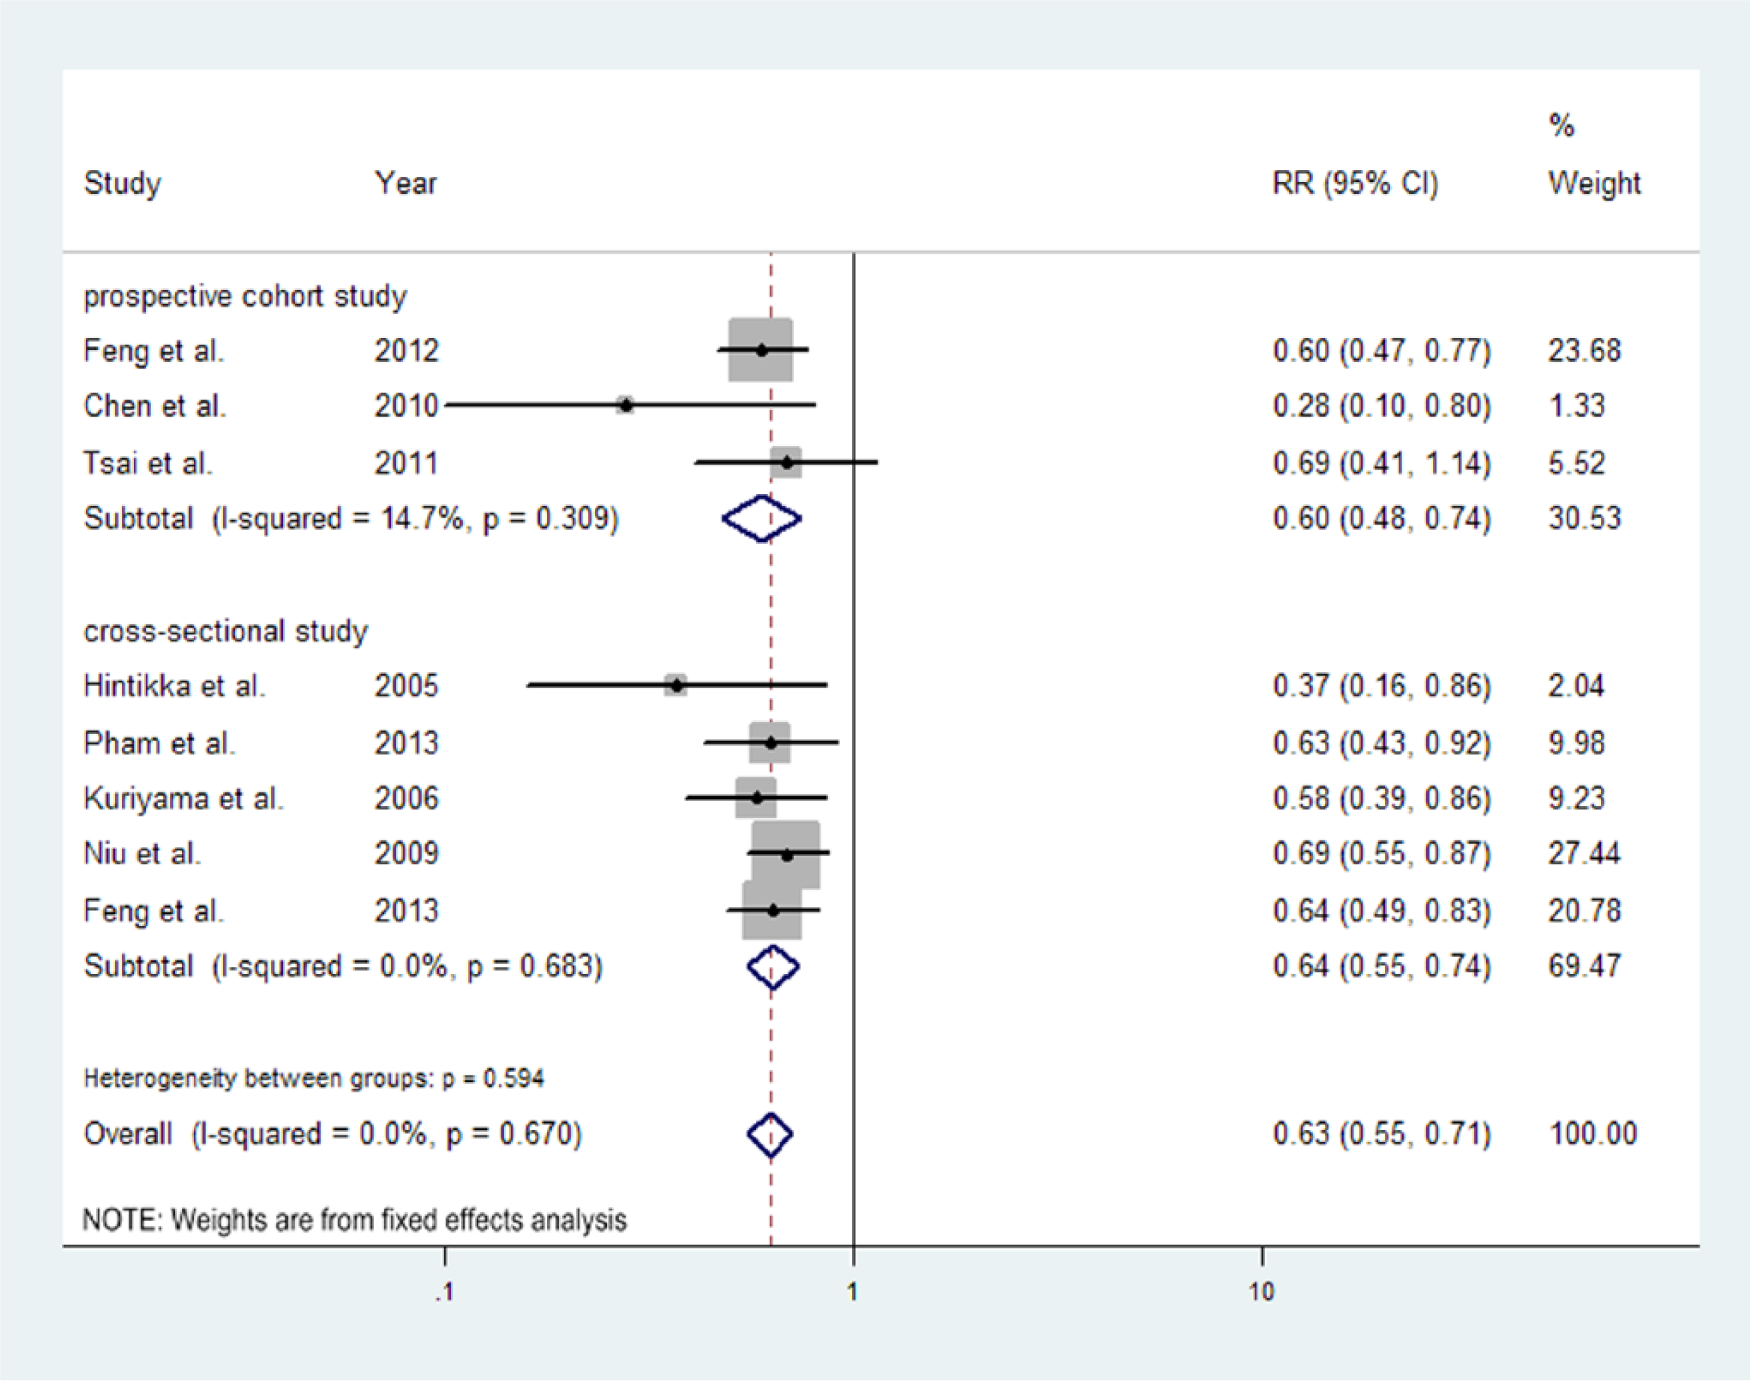
Summary relative risks (RRs) of depression for an increment of 3 cups/d in tea consumption.
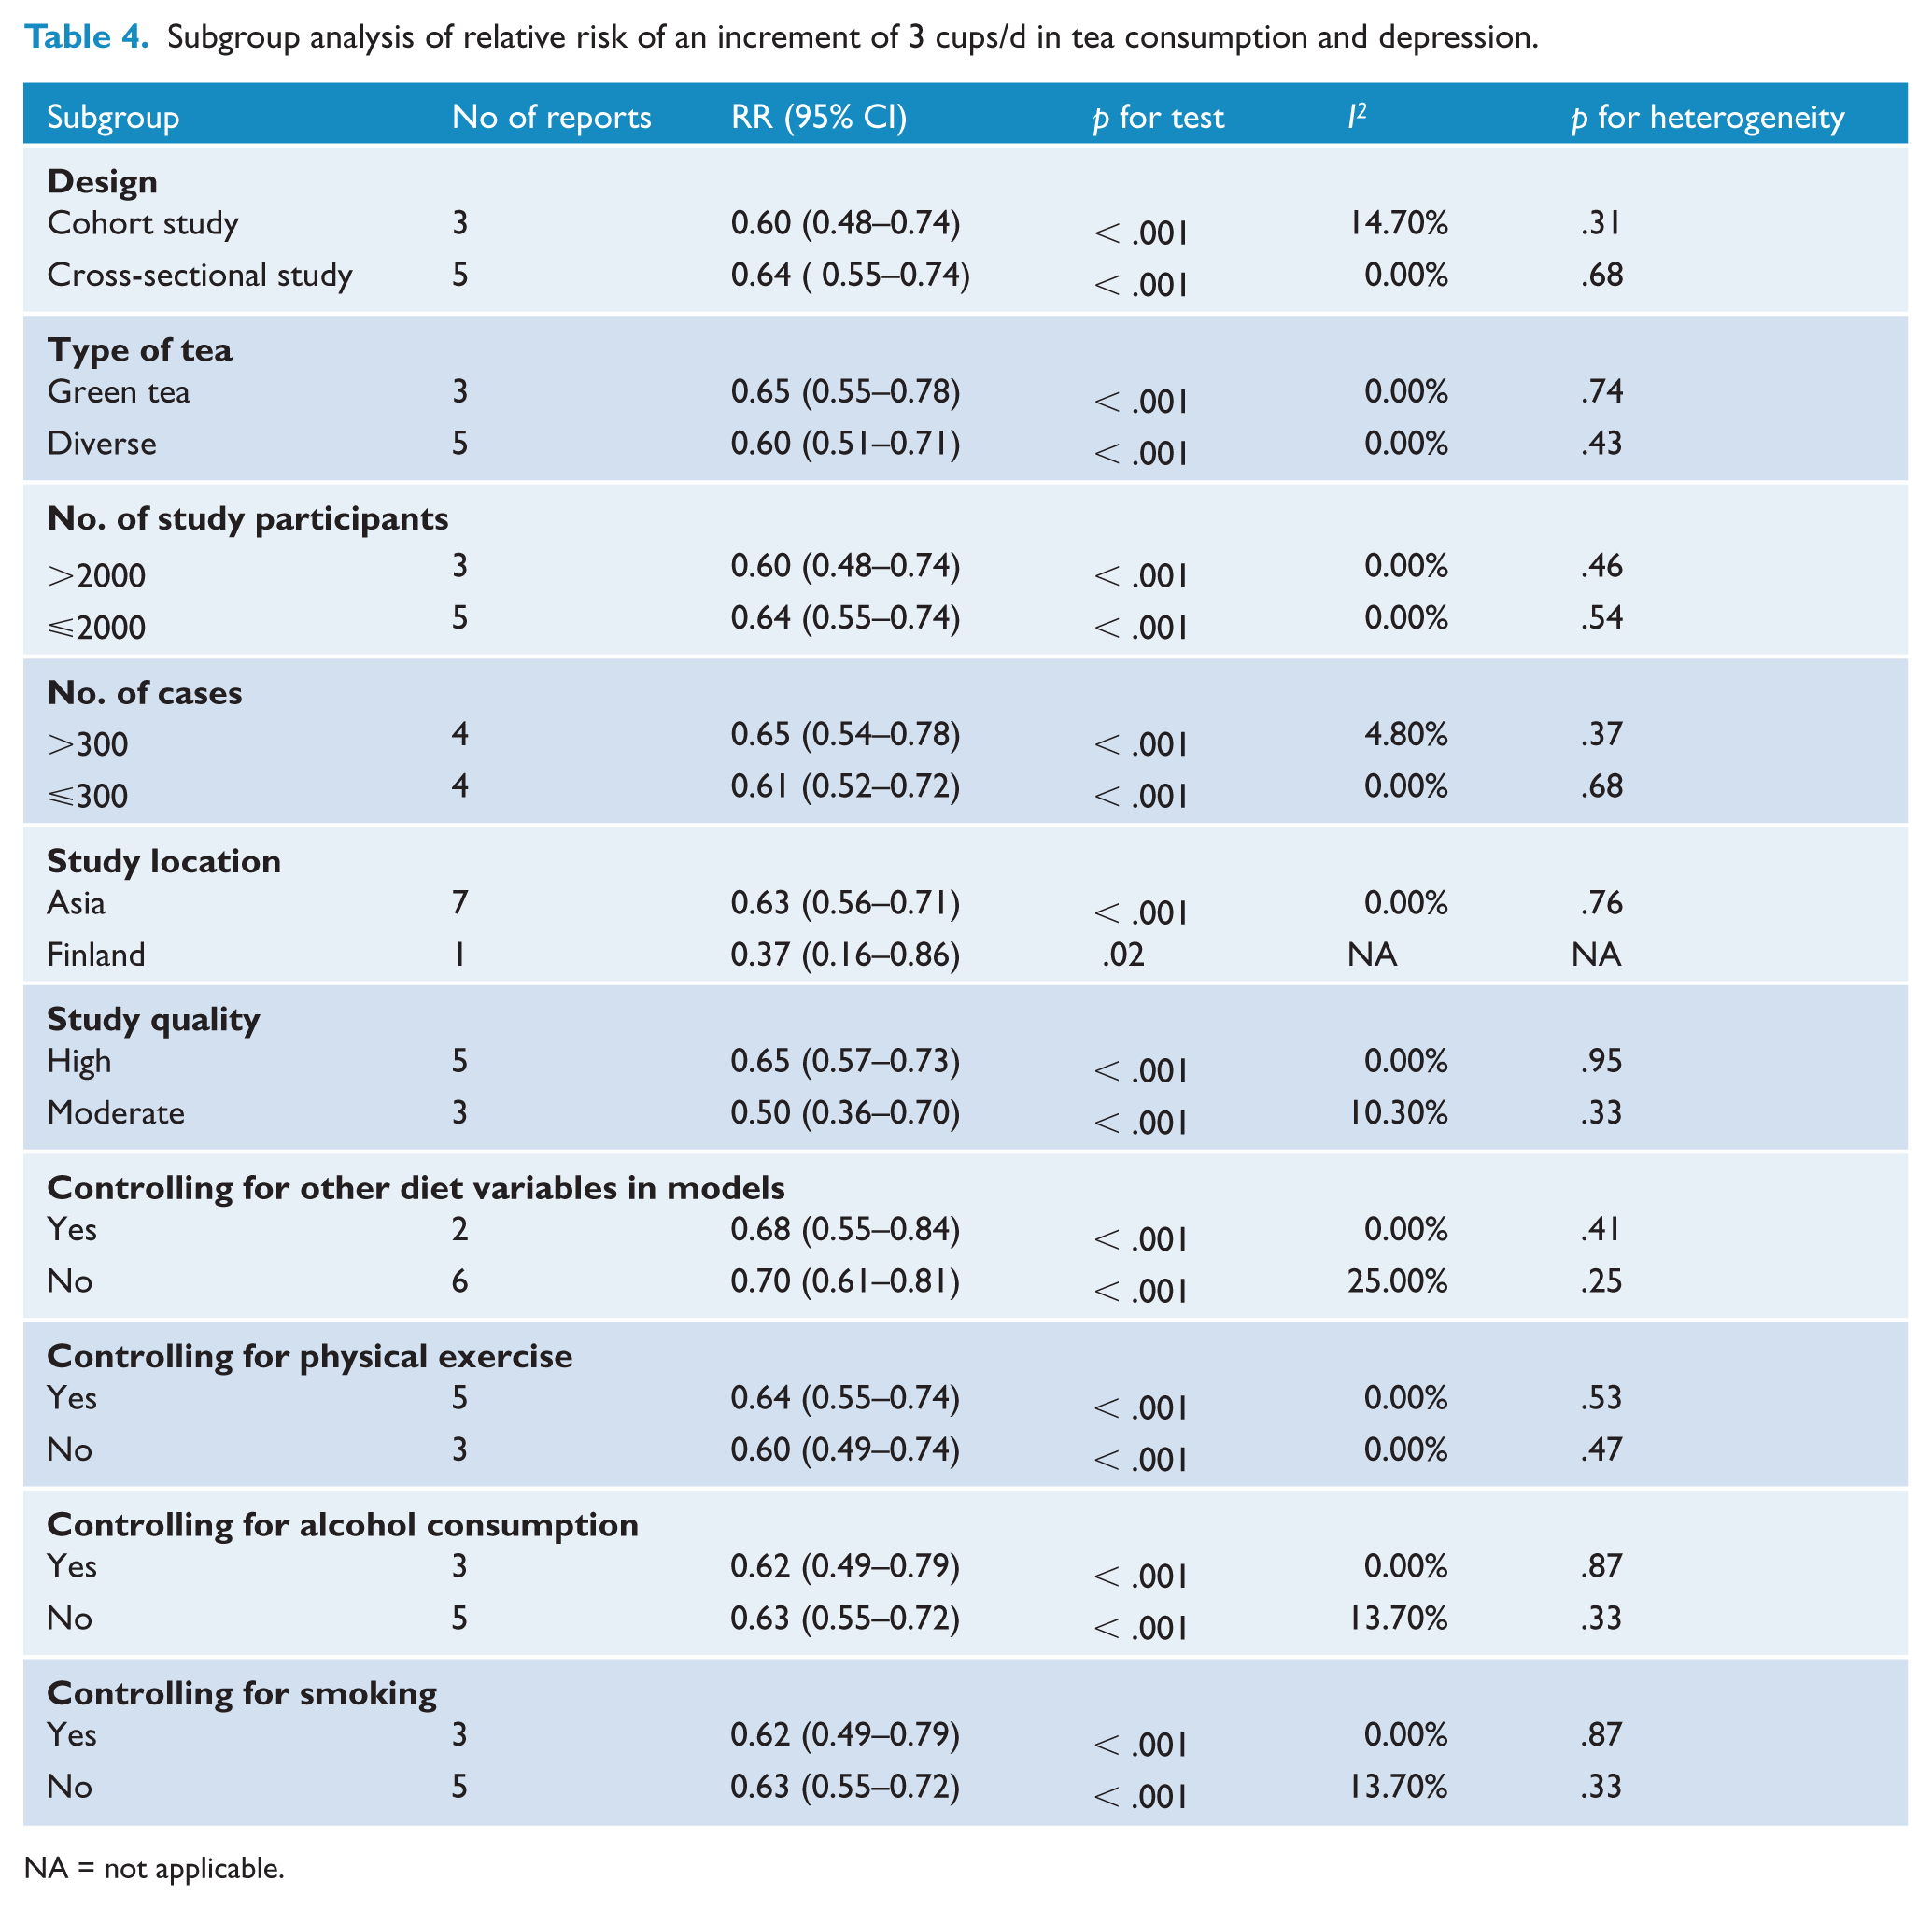
In the subgroup analyses (Table 4), the associations between tea consumption and risk of depression were similar, regardless of study design, type of tea, number of cases or participants, study location, study quality, and whether other diet variables or physical exercise or alcohol consumption or smoking were controlled for in models. An increment of 3 cups of tea consumption per day could significantly reduce the risk of depression in any of the categories. We also did sensitivity analyses by excluding each report in turn and pooled the results of the remaining reports. The pooled RRs did not change substantially, with a range from 0.60 (95% CI: 0.52–0.69) to 0.64 (95% CI: 0.56–0.74).
Subgroup analysis of relative risk of an increment of 3 cups/d in tea consumption and depression.
NA = not applicable.
Discussion
In this meta-analysis, we found that higher consumption of tea was associated with lower risk of depression. The dose–response analysis identified a linear association between tea consumption and the risk of depression, with every 3 cups/day increment in tea consumption associated with a 37% decrease in the risk of depression.
In the analysis of association between higher level of tea consumption and depression risk, similar results were obtained in all subgroups except for the Finland subgroup. But the results of Finland should be interpreted with caution, because this subgroup finding was only based on two reports (Hintikka et al., 2005; Ruusunen et al., 2010), and there was substantial heterogeneity between them. The participants enrolled in the report of Ruusunen et al. (2010) were all Finnish men, where no association between tea drinking and depression risk was observed. In contrast, the report of Hintikka et al. (2005) analyzed data from 2011 Finnish adults (men and women) and found that daily tea drinking was associated with lower risk of depression. The different results suggest that perhaps the effect of tea drinking varies according to gender. But only Ruusunen et al. (2010) separately reported the effect of tea drinking in men. Further studies on the association between tea consumption and the risk of depression should be conducted to examine the role of gender. Most studies included in our meta-analysis did not report the types of tea in relation to depression, except for three studies which reported the association between green tea and depression risk. Though the results of the subgroup analysis based on the types of tea (green tea and diverse tea) were consistent, we should also consider whether different types of tea have different effects on depression, because different types of tea may contain different kinds or quantity of active ingredients. For example, dry leaves of green tea comprise 30%–42% catechins, while dried black tea leaves, which undergo oxidation during manufacturing, contain 3%–10% catechins (Graham, 1992). Thus, the effect of the types of tea consumed on depression needs to be addressed in future studies. Considering other dietary components and lifestyle factors (such as physical exercise, alcohol consumption, and smoking) may be potential confounders influencing the relationship between tea consumption and depression risk, we also conducted subgroup analyses of whether these factors were controlled for in the models. However, similar results were obtained in these subgroup analyses.
There are several possible explanations for the inverse association between tea consumption and depression risk. Tea polyphenols, mainly catechins, which can enter the brain in significant quantities (Nakagawa and Miyazawa, 1997), are posited to play a major protective role in depression development (Belmaker and Agam, 2008).
Studies have suggested (Serafini et al., 1996; Zhu et al., 2012) that tea polyphenols displayed antioxidant activity in vivo and exerted antidepressant-like effects in mice models of depression. In addition, oral administration of epigalloca-techin-3-gallate (one of the major tea catechins) in mouse models has been shown to prevent the reduction in brain dopamine concentration (Levites et al., 2001), a key neurotransmitter in the neurochemistry of depression. Other than tea polyphenols, theanine, which accounts for about 50% of the amino acid content in tea, can increase brain dopamine (Yokogoshi et al., 1998) as well as serotonin in animal models, whose dysfunction is considered a credible etiological candidate for depression (Delgado, 2000). Research has also shown that theanine intake improved behavioral depression induced by chronic stress in mice (Unno et al., 2011). Theanine was also found to exert an antidepressant effect in human participants (Kimura et al., 2007). In addition, folate, another tea component, has also been shown to protect against depression (Gilbody et al., 2007).
Strengths and limitations
The present meta-analysis is the first quantitative systematic analysis of the association between tea consumption and the risk of depression. We not only analyzed the association of higher tea consumption with depression risk based on all related primary studies, but also investigated a dose–response relationship between tea consumption and depression risk. In addition, we used models adjusting for most established risk factors and did stratified analyses to explore whether some confounding factors could have affected the results. Furthermore, the consistent results from sensitivity analysis and the absence of heterogeneity among included reports indicated that our findings were reliable and robust. Moreover, publication bias was unlikely to account for our findings, as identified by visual inspection of a funnel plot.
Several limitations of our study should also be acknowledged. First, because of the observational design, we cannot completely exclude the possibility that the observed associations were due to residual confounders such as quality of life, family support, and social support. Second, the methods of measuring tea consumption differed across studies (e.g. grams, cups, times), even though in the dose–response analysis, we tried to rescale tea consumption to a unified standard (cups/day). The included studies also varied with respect to depression assessment methods. In these studies, validated cutoff scores were used to define levels of depressive affect. The sensitivity and specificity of these measures proved to be acceptable (Mulrow et al., 1995). Third, all the studies in our analysis assessed tea consumption using questionnaires, and errors in the self-reported amounts were unavoidable, which may influence the synthesized results to some extent. Fourth, primary reports included in our meta-analysis were mostly cross-sectional studies (8/13), which likely introduced more confounding factors and biases than cohort studies. However, in our subgroup analysis based on study design, the results of the two subgroups were similar. Finally, most reports included in our meta-analysis were conducted in Asia, which may limit the generalizability of the results to other populations.
Conclusions
In summary, our findings suggest that tea consumption may act as an independent protective factor for depression. Given that tea is widely consumed, has few documented adverse effects, and is relatively inexpensive, its potential in treating and preventing depression should be recognized.
Footnotes
Acknowledgements
We would like to thank Fujian Song, Professor, Norwich Medical School, Faculty of Medicine and Health Science, University of East Anglia, for helpful comments and edits.
Funding
This research received no specific grant from any funding agency in the public, commercial, or not-for-profit sectors.
Declaration of interest
The authors report no conflicts of interest. The authors alone are responsible for the content and writing of the paper.