
Abstract
Background:
To inform decisions about mental health resource allocation, planners require reliable estimates of people who report service demand (i.e. people who use or want mental health services) according to their level of possible need.
Methods:
Using data on 6915 adults aged 16–64 years in Australia’s 2007 National Survey of Mental Health and Wellbeing, we examined past-year service demand among respondents grouped into four levels of possible need: (a) 12-month mental disorder; (b) lifetime but no 12-month mental disorder; (c) any other indicator of possible need (12-month symptoms or reaction to stressful event, or lifetime hospitalisation); (d) no indicator of possible need. Multivariate logistic regression analyses examined correlates of service demand, separately for respondents in each of levels 1–3.
Results:
Sixteen per cent of Australian adults reported service demand, of whom one-third did not meet criteria for a 12-month mental disorder (equivalent to 5.7% of the adult population). Treatment patterns tended to follow a gradient defined by level of possible need. For example, service users with a 12-month disorder received, on average, 1.6–3.9 times more consultations than their counterparts in other levels of possible need, and had 1.9–2.2 times higher rates of psychologist consultation. Service users with a lifetime but not 12-month disorder or any other indicator of need consumed a similar average number of services to people with mild 12-month mental disorders, but received relatively fewer services involving the mental health sector. Service demand was associated with increased suicidality and psychological distress in all levels of possible need examined, and with poorer clinical and functional status for those with 12-month or lifetime disorders.
Conclusions:
Many Australians reporting service demand do not meet criteria for a current mental disorder, but may require services to maintain recovery following a past episode or because they are experiencing symptoms and significant psychological distress.
Introduction
Mental health policy-makers and planners require reliable information about the population who use or want mental health services, in order to allocate scarce resources in the most efficient and equitable way possible. In Australia, mental and substance use disorders affect 20% of adults each year (Slade et al., 2009) and account for 13% of total disease burden. Only cancer, musculoskeletal disorders, and cardiovascular and circulatory diseases each account for more burden (Institute for Health Metrics and Evaluation, 2013). Despite the availability of efficacious therapies, treatment coverage and quality for mental and substance use disorders are poor compared to similarly disabling physical disorders (Andrews and Titov, 2007). Data from Australia’s second National Survey of Mental Health and Wellbeing (NSMHWB) showed that, in 2007, approximately 12% of adults had used services for mental health problems in the past year, but people with 12-month (i.e. current) affective, anxiety and substance use disorders comprised only 59% of this group (Burgess et al., 2009). A further 5.8% of the population wanted but did not use services, comprising 5.2% with a current disorder and 0.6% without (Meadows and Burgess, 2009). A challenge for policy-makers and planners is how to reconcile the apparent misalignment between estimates of the population with a current disorder, and the populations who use or want mental health services.
Recent studies have used epidemiological data to shed light on this problem, and two consistent findings have emerged. Firstly, studies from the USA, Canada and Europe show that approximately half of those using mental health services in a given year do not meet diagnostic criteria for a current mental disorder, but may have other indicators of possible need for which treatment may be beneficial. These indicators include: a lifetime, but not current, mental disorder; sub-threshold levels of symptoms in the past 12 months; significant disability or distress; and a history of traumatic life events or psychiatric hospitalisation (Alonso et al., 2007; Druss et al., 2007; Judd et al., 1997; Sareen et al., 2005a, 2012). These previous studies suggest that presence of a current mental disorder alone is unlikely to be a good approximation of possible need, and other criteria are necessary (Aoun et al., 2004; Mechanic, 2003).
Secondly, even among those with a 12-month disorder, not all will use services or want services (Druss et al., 2007; Sareen et al., 2005a, 2005b), that is, not all will report service demand. In Australia in 2007, only 35% of individuals with a current disorder accessed services for mental health problems in the previous year, although a further 10% wanted them (Meadows and Burgess, 2009). This low rate of service use may be a function of illness characteristics. Some people may experience only mild or transient symptoms that, arguably, may not warrant treatment. Indeed, studies show that as many as 50% of previously untreated individuals who meet criteria for mental disorders may remit without treatment in a 12-month period (Sareen et al., 2012; Whiteford et al., 2013). Some people experience discordance between diagnosis and disability, and do not find their symptoms troubling (Aoun et al., 2004). Others, regardless of their level of symptoms, do not want treatment (Kessler et al., 2001; Mojtabai et al., 2002; Ojeda and Bergstresser, 2008), most commonly because they prefer to manage their problems themselves (Harris et al., 2011; van Beljouw et al., 2010). Reporting a desire for services has been consistently associated with greater levels of symptoms, distress and disability (Codony et al., 2009; Meadows et al., 2002), and this has been interpreted as indicating that most people can adequately judge whether or not they require care (van Beljouw et al., 2010).
When resources are scarce it is reasonable to design services for those who are likely to use them. Thus, mental health service system planning requires reliable estimates of service demand in the population, an understanding of the services received by those who used them, and the services desired by those who want but have not used them. While various studies provide elements of the estimates required, none have comprehensively profiled service demand in Australia. The current study used data from the 2007 NSMHWB (Australian Bureau of Statistics, 2009) to examine service demand for 12-month mental health services among adults aged 16 to 64 years, using a classification of level of possible need adapted from previous work in the USA (Druss et al., 2007). Specifically, it investigated the following questions:
What proportion of adults report service demand, and did this vary according to their level of possible need?
Among adults who consulted a health professional for mental health problems, how many consultations did they receive, and did this vary according to their level of possible need?
Among adults who consulted a health professional for mental health problems, which professionals did they consult, and did this vary according to their level of possible need?
Among adults reporting service demand, what types of interventions did they use or want, and did this vary according to their level of possible need?
Among individuals in each level of possible need, did those reporting service demand have higher levels of symptoms and impairment than those without?
Methods
Survey and sample
The 2007 NSMHWB was a nationally representative household survey of Australians aged 16 to 85 years conducted by the Australian Bureau of Statistics (ABS) in late 2007 (Australian Bureau of Statistics, 2009; Slade et al., 2009). Respondents were identified from a stratified multistage probability sample of private dwellings across Australia. Data were collected via face-to-face interviews, of 90 minutes average duration, conducted in English by trained lay interviewers. Interviews were conducted with 8841 respondents from 14,805 eligible households, a 60% response rate. Being a household survey, the NSMHWB is likely to have undercounted the prevalence of mental disorders in older people because it excluded elderly people in hospitals and aged care residential facilities. Hence, the analyses reported here focus on the 6936 respondents aged 16 to 64 years, representing an estimated 13,609,860 Australian residents in 2007.
Measures
Diagnostic assessment
A modified World Mental Health Composite International Diagnostic Interview (WMH-CIDI 3.0) (Kessler and Üstün, 2004) was used to assess the prevalence of lifetime affective (depression, dysthymia and bipolar affective disorder), anxiety (panic disorder, agoraphobia, social phobia, generalised anxiety disorder, obsessive-compulsive disorder and post-traumatic stress disorder) and substance use (harmful use and dependence syndrome for each of: alcohol, opioids, cannabinoids, sedatives and stimulants) disorders according to International Classification of Diseases (ICD-10) criteria (World Health Organization, 1992). The presence of 12-month disorders was established by combining information about lifetime disorders with questions about symptoms experienced during the 12 months prior to interview. Severity (none, mild, moderate or severe) was determined for each individual via an algorithm incorporating disorder-specific role impairment and other clinical information (Slade et al., 2009).
Possible need for treatment
Information regarding lifetime symptoms of mental disorders and service utilisation was used to classify respondents into categories defining a possible need for treatment, adapted from a US study by Druss and colleagues (Druss et al., 2007) and used previously by our group (Harris et al., 2011). There were four mutually exclusive categories: (a) any 12-month ICD-10 mental disorder; (b) a lifetime but no ICD-10 12-month mental disorder; (c) any other indicator of possible need (one or more of: 12-month symptoms but no lifetime diagnosis; a reaction to a traumatic event in the past 12 months; or lifetime hospitalisation for a mental health problem); and (d) no indicator of possible need.
12-month service utilisation, services wanted and service demand
Respondents were asked whether, and how many times, they had consulted any of the following professionals for mental health problems in the past 12 months: general practitioners (GPs); psychiatrists; psychologists; mental health nurses; other mental health specialists (including social workers, occupational therapists and counsellors); other specialist doctors or surgeons; other professionals providing general services, and complementary/alternative therapists. Number of consultations for mental health problems for each type of professional was totalled and provided in categorical form (1, 2–4, 5–9, 10–19, 20–49, and 50+ consultations). Because data on total number of consultations for mental health problems was provided in categories, an average for each person was deemed by substituting each category with its mid-point (the 50+ consultations category was substituted with the value 64.5, being the distance between the mid-point and upper value of the previous category, 20–49 consultations). The same approach was used to deem a lower and upper estimate of the average, but using the lower and upper limits of each category.
The Perceived Need for Care Questionnaire (PNCQ) (Meadows et al., 2000) asked respondents about the interventions received by those who had used services in the past 12 months, and the interventions needed by those who had not, according to five intervention types: (a) information; (b) medicine or tablets; (c) counselling or talking therapy; (d) social interventions; and (e) skills training. Due to the small numbers of respondents endorsing categories (d) and (e), these were combined for analysis into a single ‘practical help’ category because conceptually they are both forms of practical help.
For the purposes of this analysis, service demand was defined as having either used services for a mental health problem in the past 12 months or wanting but not having used services for a mental health problem in the past 12 months (the latter assessed by the PNCQ).
Other measures
Several other clinical measures were included in the survey: psychological distress in the past 30 days, assessed with the Kessler Psychological Distress Scale (K10) (Kessler and Mroczek, 1994); ‘days out of role’, a measure of the number of days in the past 30 the respondent was unable to perform, or had to cut down on, their normal activities because of health problems; 12-month suicidality, based on questions about the presence of any suicidal thought, plans or attempts in the past 12 months; and number of 12-month chronic physical conditions (back or neck pain/problems, gout, rheumatism or arthritis, heart or circulatory condition, asthma, bronchitis, hay fever, sinusitis, diabetes or high sugar levels, cancer, stroke, emphysema, anaemia, epilepsy, fluid problems, hernias, kidney problems, migraine, psoriasis, gastrointestinal ulcer, thyroid problems, and tuberculosis), assessed via a self-report checklist.
The survey gathered information about respondents’ gender, age, marital status, employment status, post-school qualification, area of residence (major urban centre vs. other), relative socioeconomic disadvantage (based on the Index of Relative Socioeconomic Disadvantage (Australian Bureau of Statistics, 2008), a measure of the comparative disadvantage of geographical areas based on census data), and social support (having three or more family or friends who can be relied on for serious problems).
Data analysis
Data from the 2007 NSMHWB Basic Confidentialised Unit Record File (CURF; April 2009 version) data were analysed using Stata version 11 (StataCorp, 2009) procedures that take account of the complex survey design. Rates and patterns of service demand for mental health, consultations for mental health problems, and interventions received or wanted were explored descriptively. For respondents in each of levels 1–3, a series of multiple logistic regression analyses were conducted to investigate the association between service demand and various measures of clinical, functional and treatment status. Separate analyses were conducted for each measure, adjusted for socio-demographic factors. A critical p-value of 0.05 was used to indicate statistical significance, based on the Wald chi-squared test of association. Exclusion of 21 cases (0.3%) from analyses due to missing data on one or more of the key service demand or sector variables yielded a dataset of 6915 respondents.
Results
Service demand
The left-hand panel of Table 1 shows the population prevalence for each level of possible need for adults aged 16–64 years. Overall, while one-fifth (22%) of adults experienced a 12-month mental disorder, a further one-third (31%) had another indicator of possible need, most commonly a lifetime but no 12-month mental disorder, and almost half (47%) had no indicator of possible need.
Mental health service demand in the past 12 months among adults aged 16–64 years in each level of possible need.
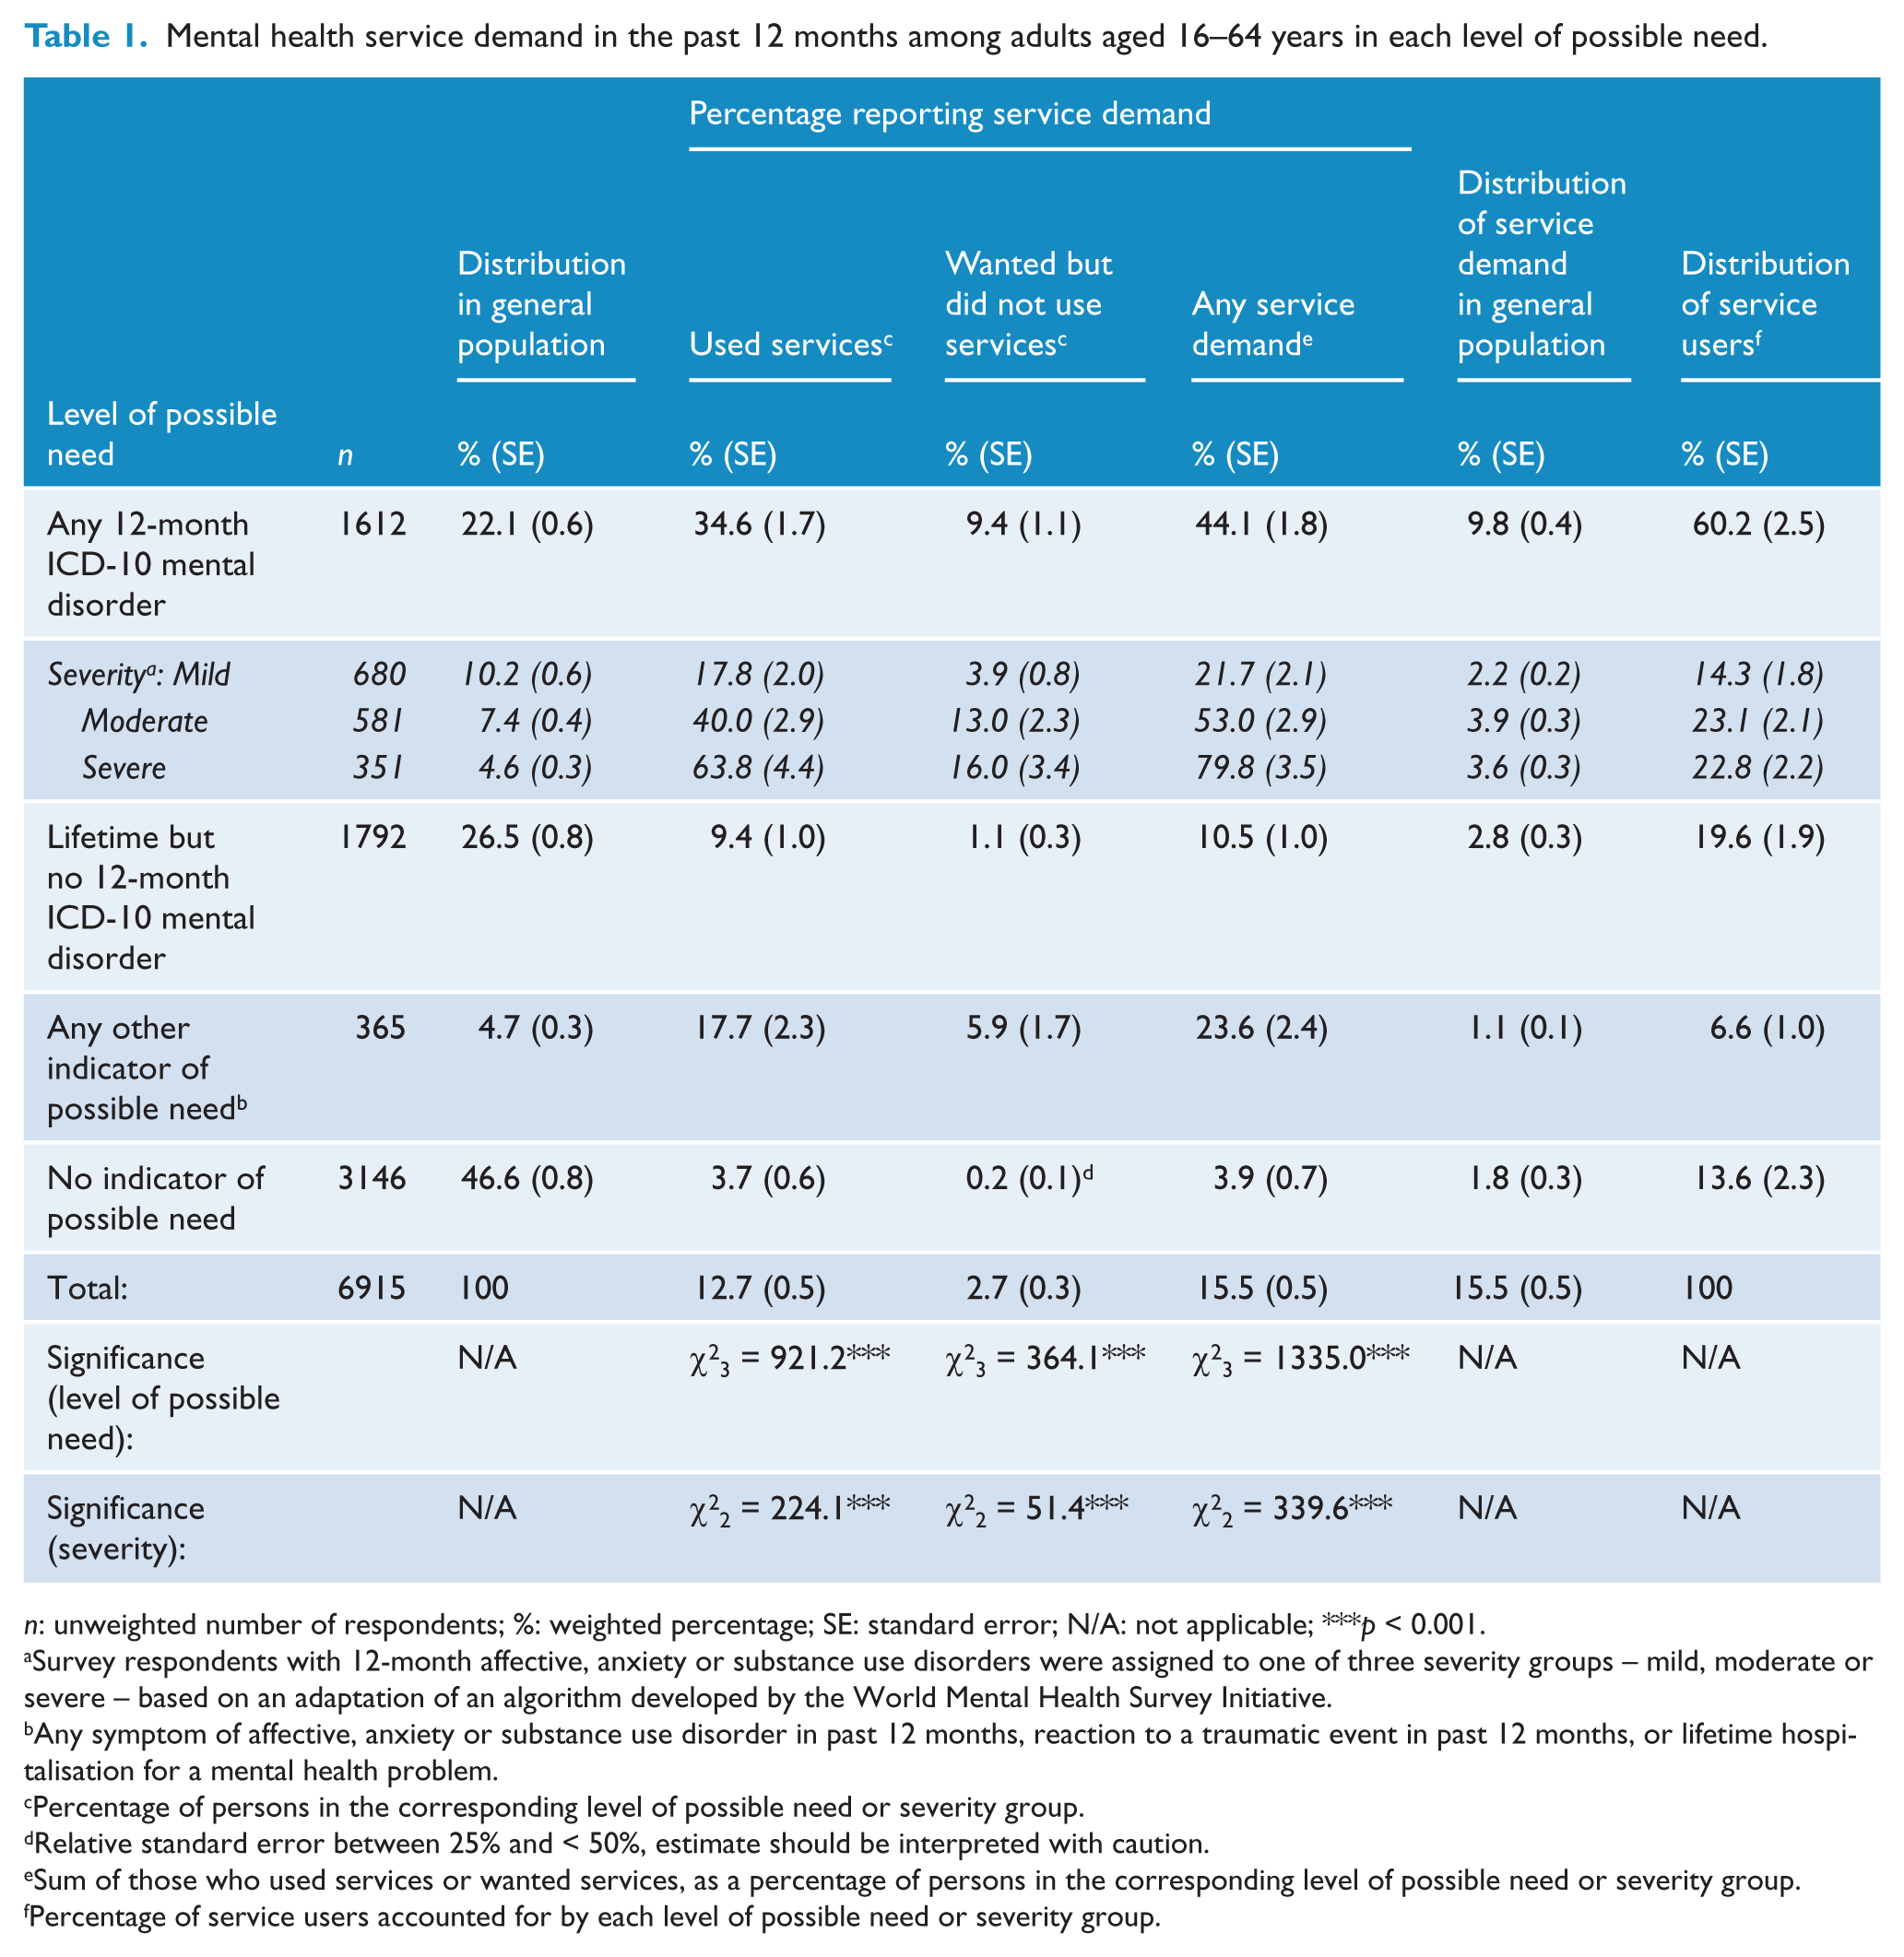
n: unweighted number of respondents; %: weighted percentage; SE: standard error; N/A: not applicable; ***p < 0.001.
Survey respondents with 12-month affective, anxiety or substance use disorders were assigned to one of three severity groups – mild, moderate or severe – based on an adaptation of an algorithm developed by the World Mental Health Survey Initiative.
Any symptom of affective, anxiety or substance use disorder in past 12 months, reaction to a traumatic event in past 12 months, or lifetime hospitalisation for a mental health problem.
Percentage of persons in the corresponding level of possible need or severity group.
Relative standard error between 25% and < 50%, estimate should be interpreted with caution.
Sum of those who used services or wanted services, as a percentage of persons in the corresponding level of possible need or severity group.
Percentage of service users accounted for by each level of possible need or severity group.
The centre panel of Table 1 shows the percentage of respondents who reported service demand within each level of possible need. Rates of any service demand varied significantly across levels of possible need, being highest for persons with 12-month disorders (44%), followed by persons with any other indicator of possible need (24%). There was also a significant gradient according to severity of disorder, with four-fold variation between the mild (22%) and severe (80%) groups. These patterns were similar for the two components of service demand, i.e. among those who used services and those who wanted but did not use services. In all levels of possible need and severity groups, the majority of individuals reporting service demand were those who had used services.
The right-hand panel of Table 1 shows that 16% of the general population of adults aged 16–64 years reported service demand, comprising mainly individuals who met criteria for a 12-month disorder (10%). Individuals with 12-month disorders comprise the majority (60%) of all service users, followed by individuals with a lifetime but no 12-month mental disorder (20%).
Consultations for mental health problems
The left-hand panel of Table 2 shows the number of consultations for mental health problems in the past 12 months reported by service users, using the grouped data available in the survey CURF. Broadly, this shows more intensive service use by persons with a 12-month mental disorder and, among those with a 12-month disorder, by persons with more severe disorders.
Number of past-year consultations for mental health problems among persons aged 16–64 years who used services (n = 1003).
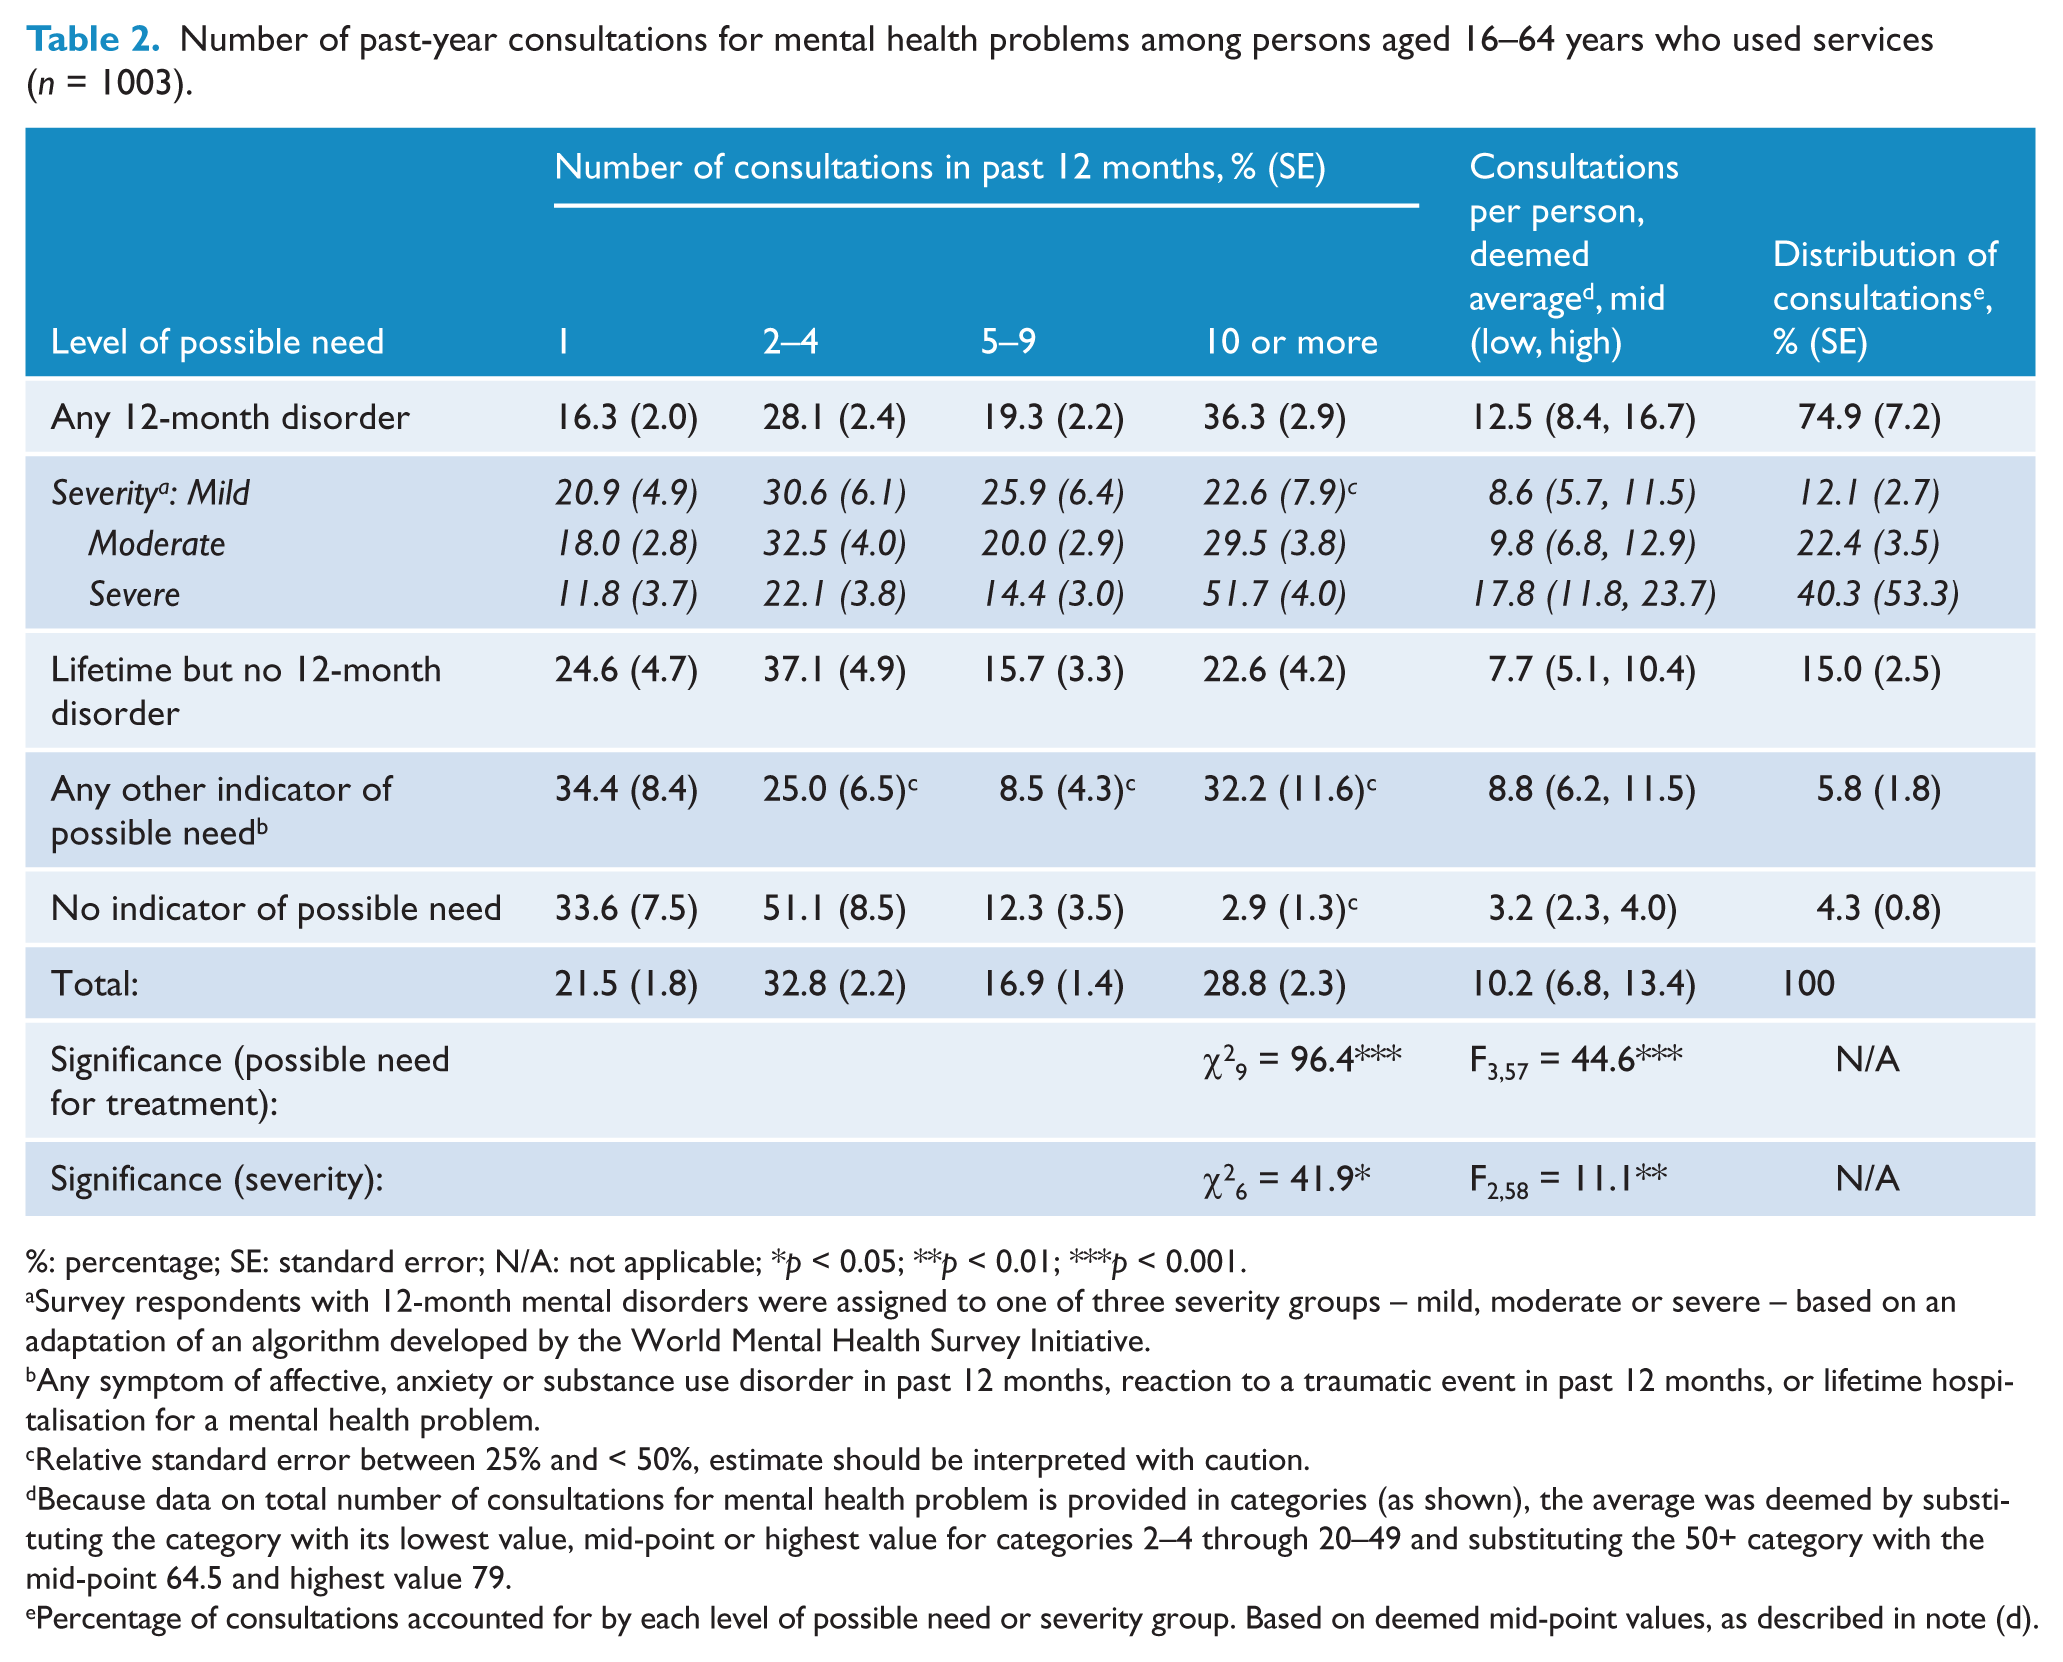
%: percentage; SE: standard error; N/A: not applicable; *p < 0.05; **p < 0.01; ***p < 0.001.
Survey respondents with 12-month mental disorders were assigned to one of three severity groups – mild, moderate or severe – based on an adaptation of an algorithm developed by the World Mental Health Survey Initiative.
Any symptom of affective, anxiety or substance use disorder in past 12 months, reaction to a traumatic event in past 12 months, or lifetime hospitalisation for a mental health problem.
Relative standard error between 25% and < 50%, estimate should be interpreted with caution.
Because data on total number of consultations for mental health problem is provided in categories (as shown), the average was deemed by substituting the category with its lowest value, mid-point or highest value for categories 2–4 through 20–49 and substituting the 50+ category with the mid-point 64.5 and highest value 79.
Percentage of consultations accounted for by each level of possible need or severity group. Based on deemed mid-point values, as described in note (d).
In order to better understand these data, we converted the grouped data for each respondent to a deemed number of consultations. We estimated the average number of consultations per person to be 10, most likely falling within the range 7 to 14 (right-hand panel, Table 2). As expected, the average number of consultations varied significantly according to level of possible need. That is, persons with 12-month disorders reported an average of 13 consultations, 50% more than those with a lifetime but not current disorder or any other indicator of possible need, and four times more than those with no indicator of possible need. Average number of consultations also increased with severity of disorder. Persons with mild or moderate disorders used a similar quantum of consultations to people with lifetime but not current disorders or any other indicator of possible need; people with severe disorders received twice that number. People with a 12-month disorder accounted for 75% of all consultations received (with more than half of those received by persons with severe disorders), people with a lifetime but no current disorder accounted for 15%, with the remaining groups each accounting for only 4–6%.
Figure 1 brings together key measures of prevalence, service demand and service use, in order to illustrate key patterns regarding engagement with mental health services. Persons with a 12-month disorder make up 22% of the population but, as expected, they account for 60% of service users because of their relatively high levels of service demand and service use, and 75% of consultations due to their high average number of consultations. The patterns are somewhat different for levels of possible need. Individuals with a lifetime but no 12-month disorder make up a larger percentage of the population (27%) than those with 12-month disorders, but relatively few in this group report service demand and service use. They account for a similar share of service users and consultations as individuals with mild 12-month mental disorders, and consume a similar average number of consultations. In contrast, individuals with any other indicator of possible need report levels of service demand, service use and an average number of consultations similar to those with mild mental disorders, but their share of service users and consultations is smaller because they make up only a small percentage of the population (5%). Finally, those with no indicator of possible need represent almost half (46.6%) of the population, so even the low level of service demand in this group (3.9%) would equate to a sizeable number of persons, hence they account for 14% of service users. However due to their small average number of consultations, they account for only 2% of consultations.
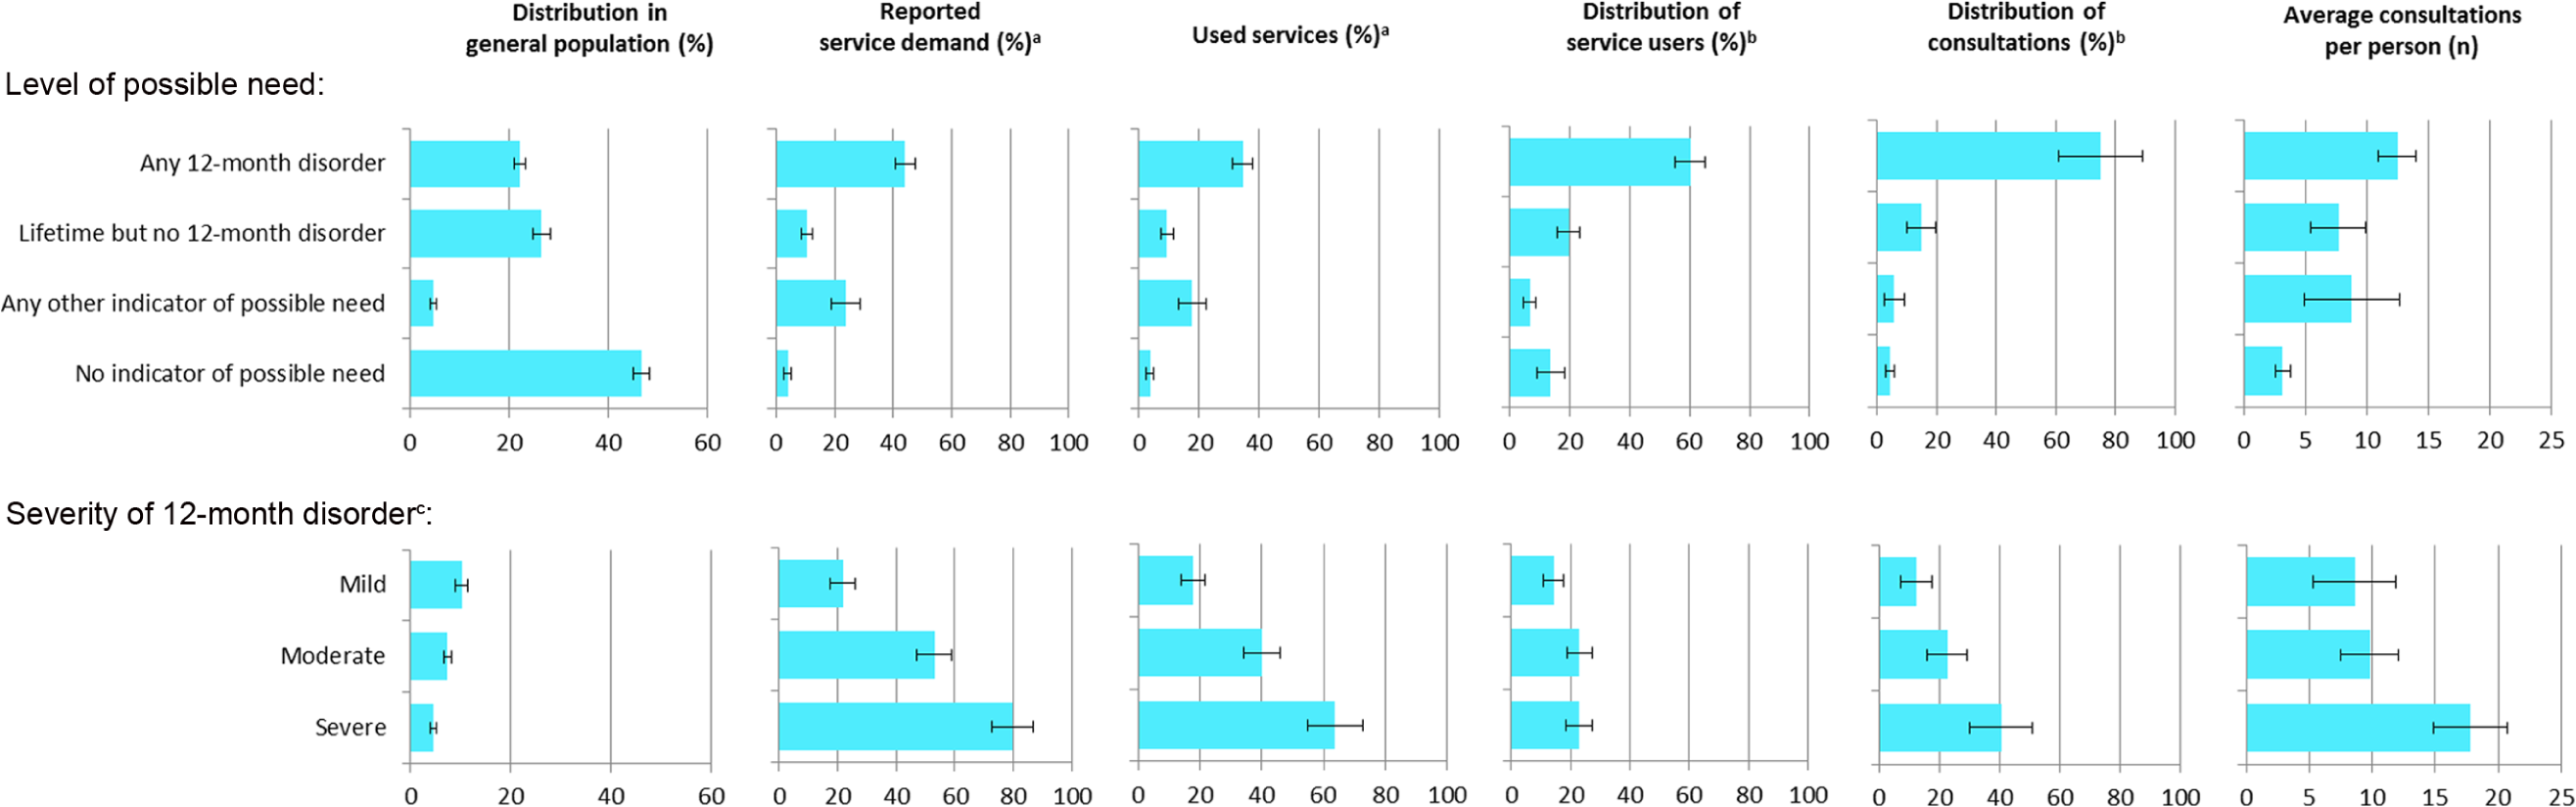
Key estimates of prevalence, service demand and service use and 95% confidence intervals among persons aged 16–64 years, by level of possible need or severity of 12-month disorder.
Patterns according to severity among individuals with 12-month mental disorders are shown in Figure 1. While people with severe disorders represent less than 5% of the total population (or 20% of individuals with 12-month mental disorders), they report higher levels of service demand and service use compared to their counterparts with mild or moderate disorders. Consequently, they comprise almost 40% of all service users with a mental disorder, and account for the majority of consultations among those with mental disorders because of their higher average number of consultations.
Health professionals consulted
The left-hand panel of Table 3 shows the health professionals consulted for mental health problems. Twice as many people with a 12-month disorder saw a psychologist (40%) compared to people with all other levels of possible need (17–21%). There were no other significant differences.
Health professionals consulted, and distribution of total consultations by type of professional, for mental health problems among persons aged 16–64 years who used services (n = 1003).
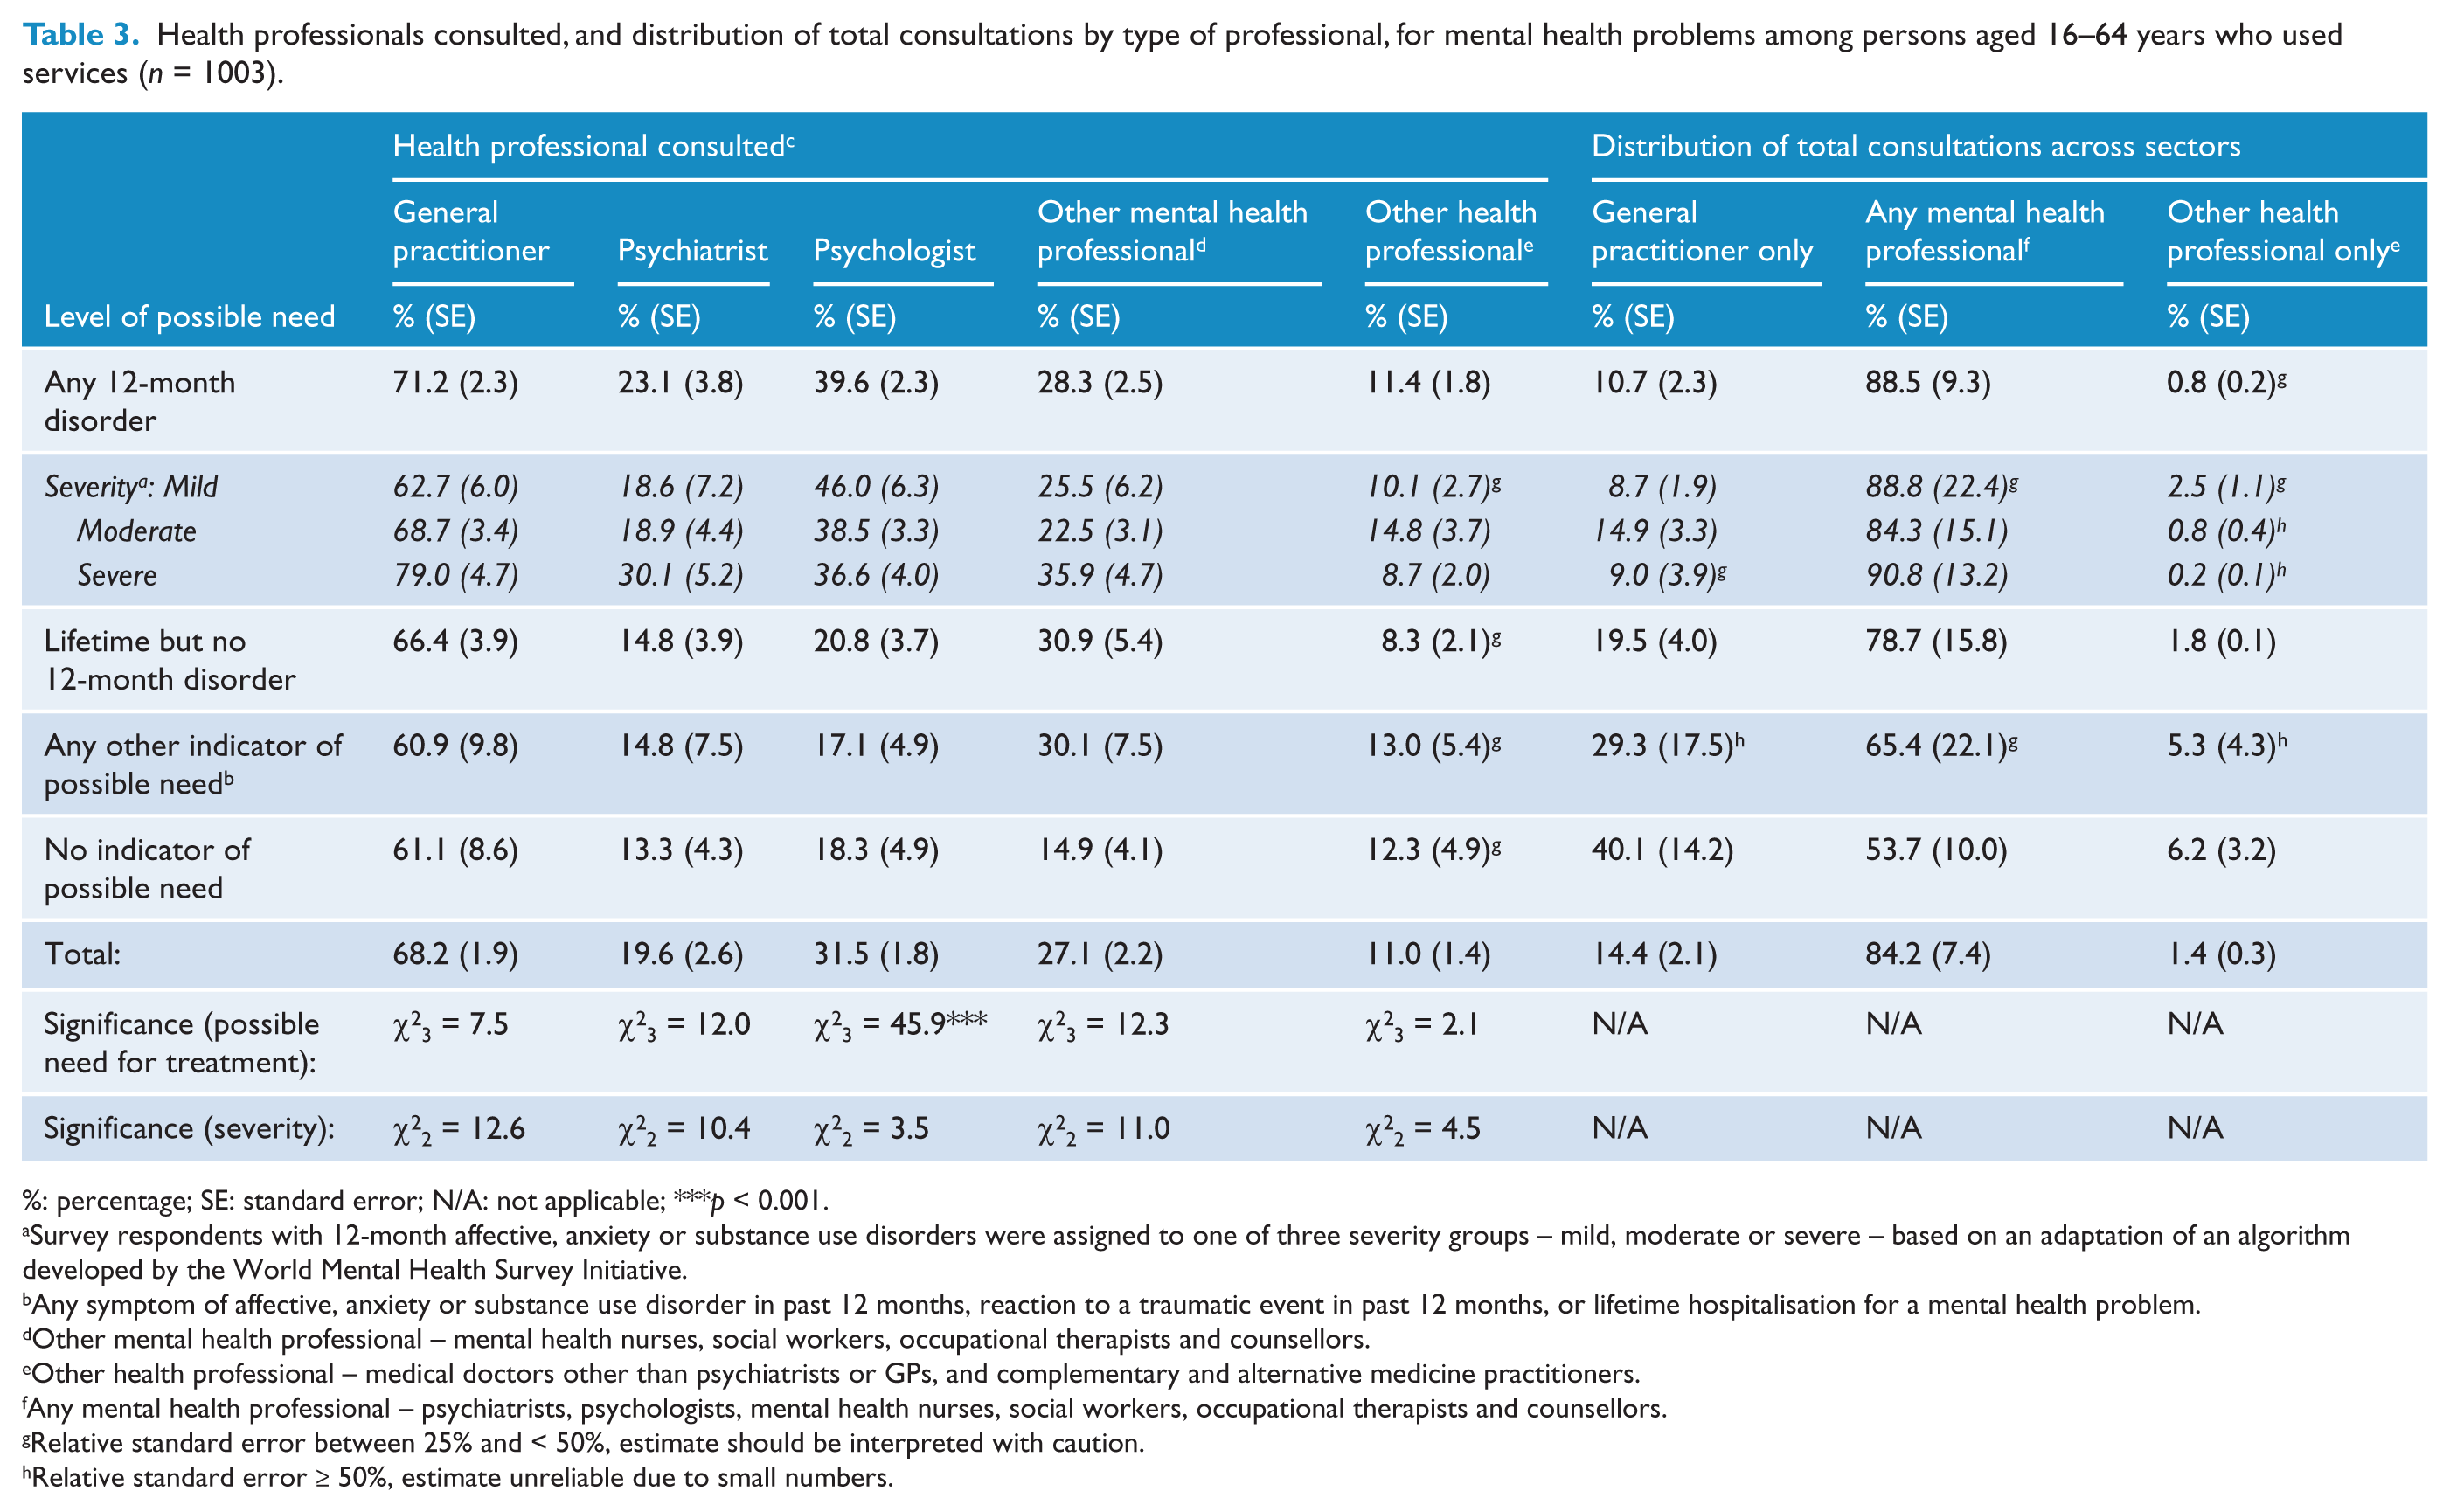
%: percentage; SE: standard error; N/A: not applicable; ***p < 0.001.
Survey respondents with 12-month affective, anxiety or substance use disorders were assigned to one of three severity groups – mild, moderate or severe – based on an adaptation of an algorithm developed by the World Mental Health Survey Initiative.
Any symptom of affective, anxiety or substance use disorder in past 12 months, reaction to a traumatic event in past 12 months, or lifetime hospitalisation for a mental health problem.
Other mental health professional – mental health nurses, social workers, occupational therapists and counsellors.
Other health professional – medical doctors other than psychiatrists or GPs, and complementary and alternative medicine practitioners.
Any mental health professional – psychiatrists, psychologists, mental health nurses, social workers, occupational therapists and counsellors.
Relative standard error between 25% and < 50%, estimate should be interpreted with caution.
Relative standard error ≥ 50%, estimate unreliable due to small numbers.
The survey CURF provides information about the number of consultations with each type of health professional, but groups the number of consultations differently for each, hampering comparison. To address this, we examined the deemed average number of consultations (regardless of type of professional), for people who consulted any of three mutually exclusive ‘sectors’: GP only; any mental health professional (with or without other professionals); and other health professional only. The right-hand panel of Table 3 shows a gradient in the distribution of consultations across each sector for people in each level of possible need. People who met criteria for a 12-month mental disorder received a relatively higher percentage of consultations from the mental health sector, whereas people with no other indicator of possible need received a relatively greater percentage of services from the GP only or other health professional sectors. Interestingly, although service users with a lifetime but not 12-month disorder and any other indicator of need consumed a similar average number of services to those with mild 12-month mental disorders (see previous section); they received relatively fewer services involving the mental health sector.
Types of interventions used or wanted
The types of treatment used or wanted by adults aged 16–64 years with service demand are shown in Table 4. Information was more commonly nominated among those with a 12-month disorder (50%) than all other categories (23–41%). There was significant positive association between severity of disorder and service demand for information and for medicine or tablets.
Types of interventions used or needed by persons aged 16–64 years with service demand (n = 1210).
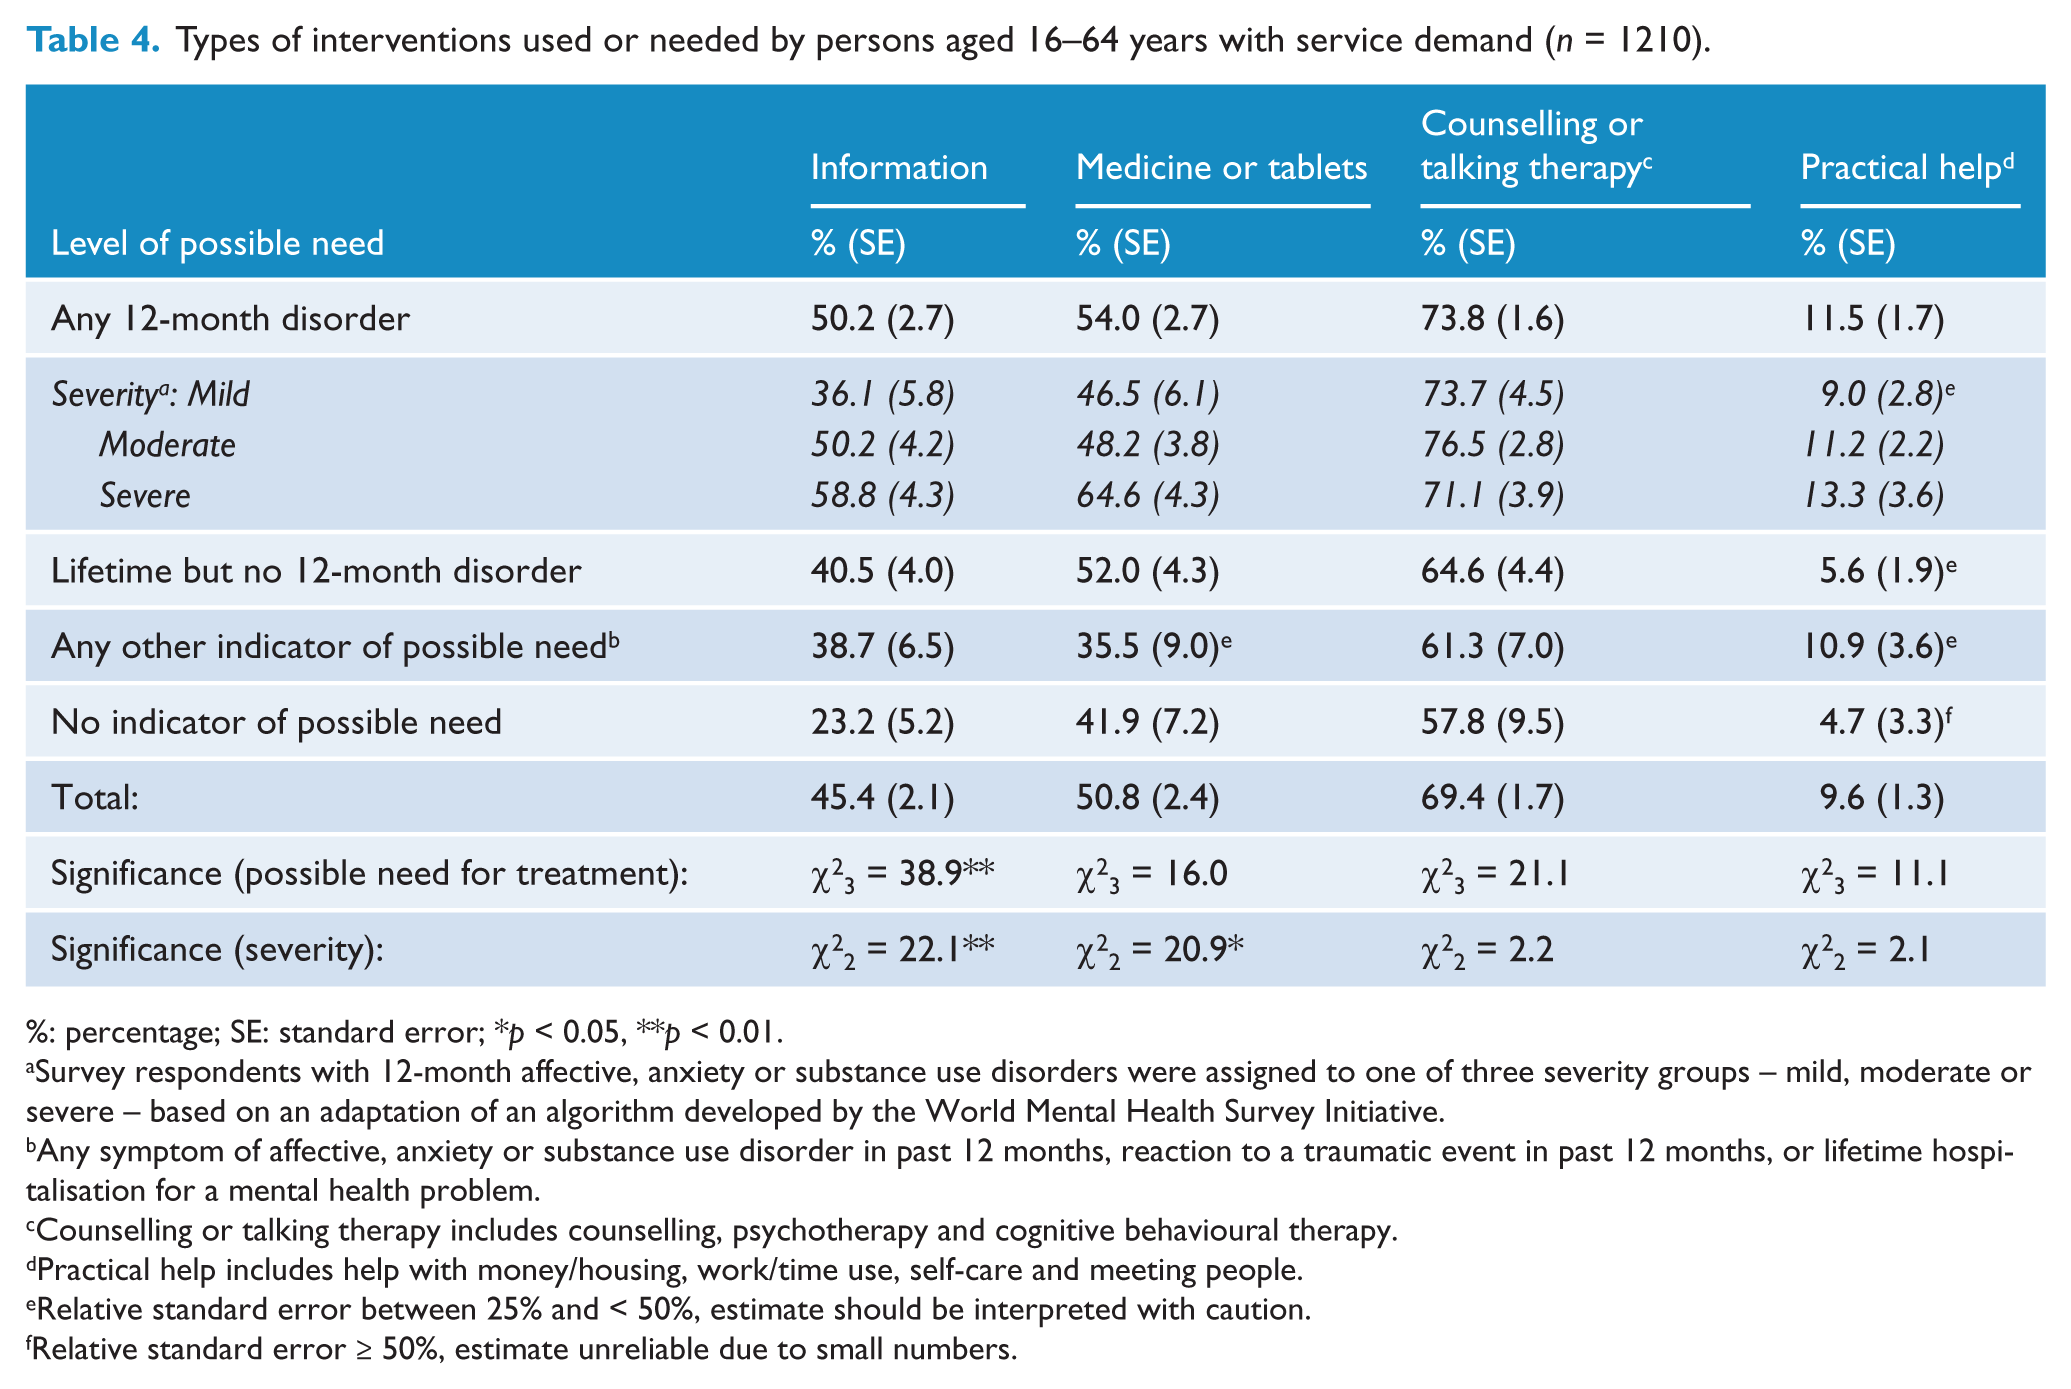
%: percentage; SE: standard error; *p < 0.05, **p < 0.01.
Survey respondents with 12-month affective, anxiety or substance use disorders were assigned to one of three severity groups – mild, moderate or severe – based on an adaptation of an algorithm developed by the World Mental Health Survey Initiative.
Any symptom of affective, anxiety or substance use disorder in past 12 months, reaction to a traumatic event in past 12 months, or lifetime hospitalisation for a mental health problem.
Counselling or talking therapy includes counselling, psychotherapy and cognitive behavioural therapy.
Practical help includes help with money/housing, work/time use, self-care and meeting people.
Relative standard error between 25% and < 50%, estimate should be interpreted with caution.
Relative standard error ≥ 50%, estimate unreliable due to small numbers.
Characteristics of individuals with service demand
Table 5 shows the results of the multivariate logistic regression models comparing the clinical, functional and treatment characteristics of individuals who did and did not report service demand in each of levels of possible need 1–3, after controlling for a range of socio-demographic factors. Service demand was associated with higher levels of past-year suicidality and psychological distress in each level of possible need. Service demand was also associated with poorer clinical and functional status on a range of measures – number of lifetime or 12-month disorders, recency of lifetime disorder, number of days out of role, reaction to a traumatic event in the past 12 months, and lifetime hospitalisation – among persons with a 12-month disorder and persons with a lifetime but no 12-month disorder. Presence of 12-month symptoms was very high among those with any other indicator of possible need group, but did not differ significantly according to service demand. Medications or tablets for mental health were used by half of individuals reporting service demand who reported a 12-month disorder or lifetime but no 12-month disorder, and one-third of those who reported any other indicator of possible need. However statistical comparisons are not reported because only a very small number of people without service demand reported taking medications or tablets for mental health in the past 12 months.
Associations between service demand and measures of clinical, functional and treatment status among persons aged 16–64 years in each category of possible need for treatment.
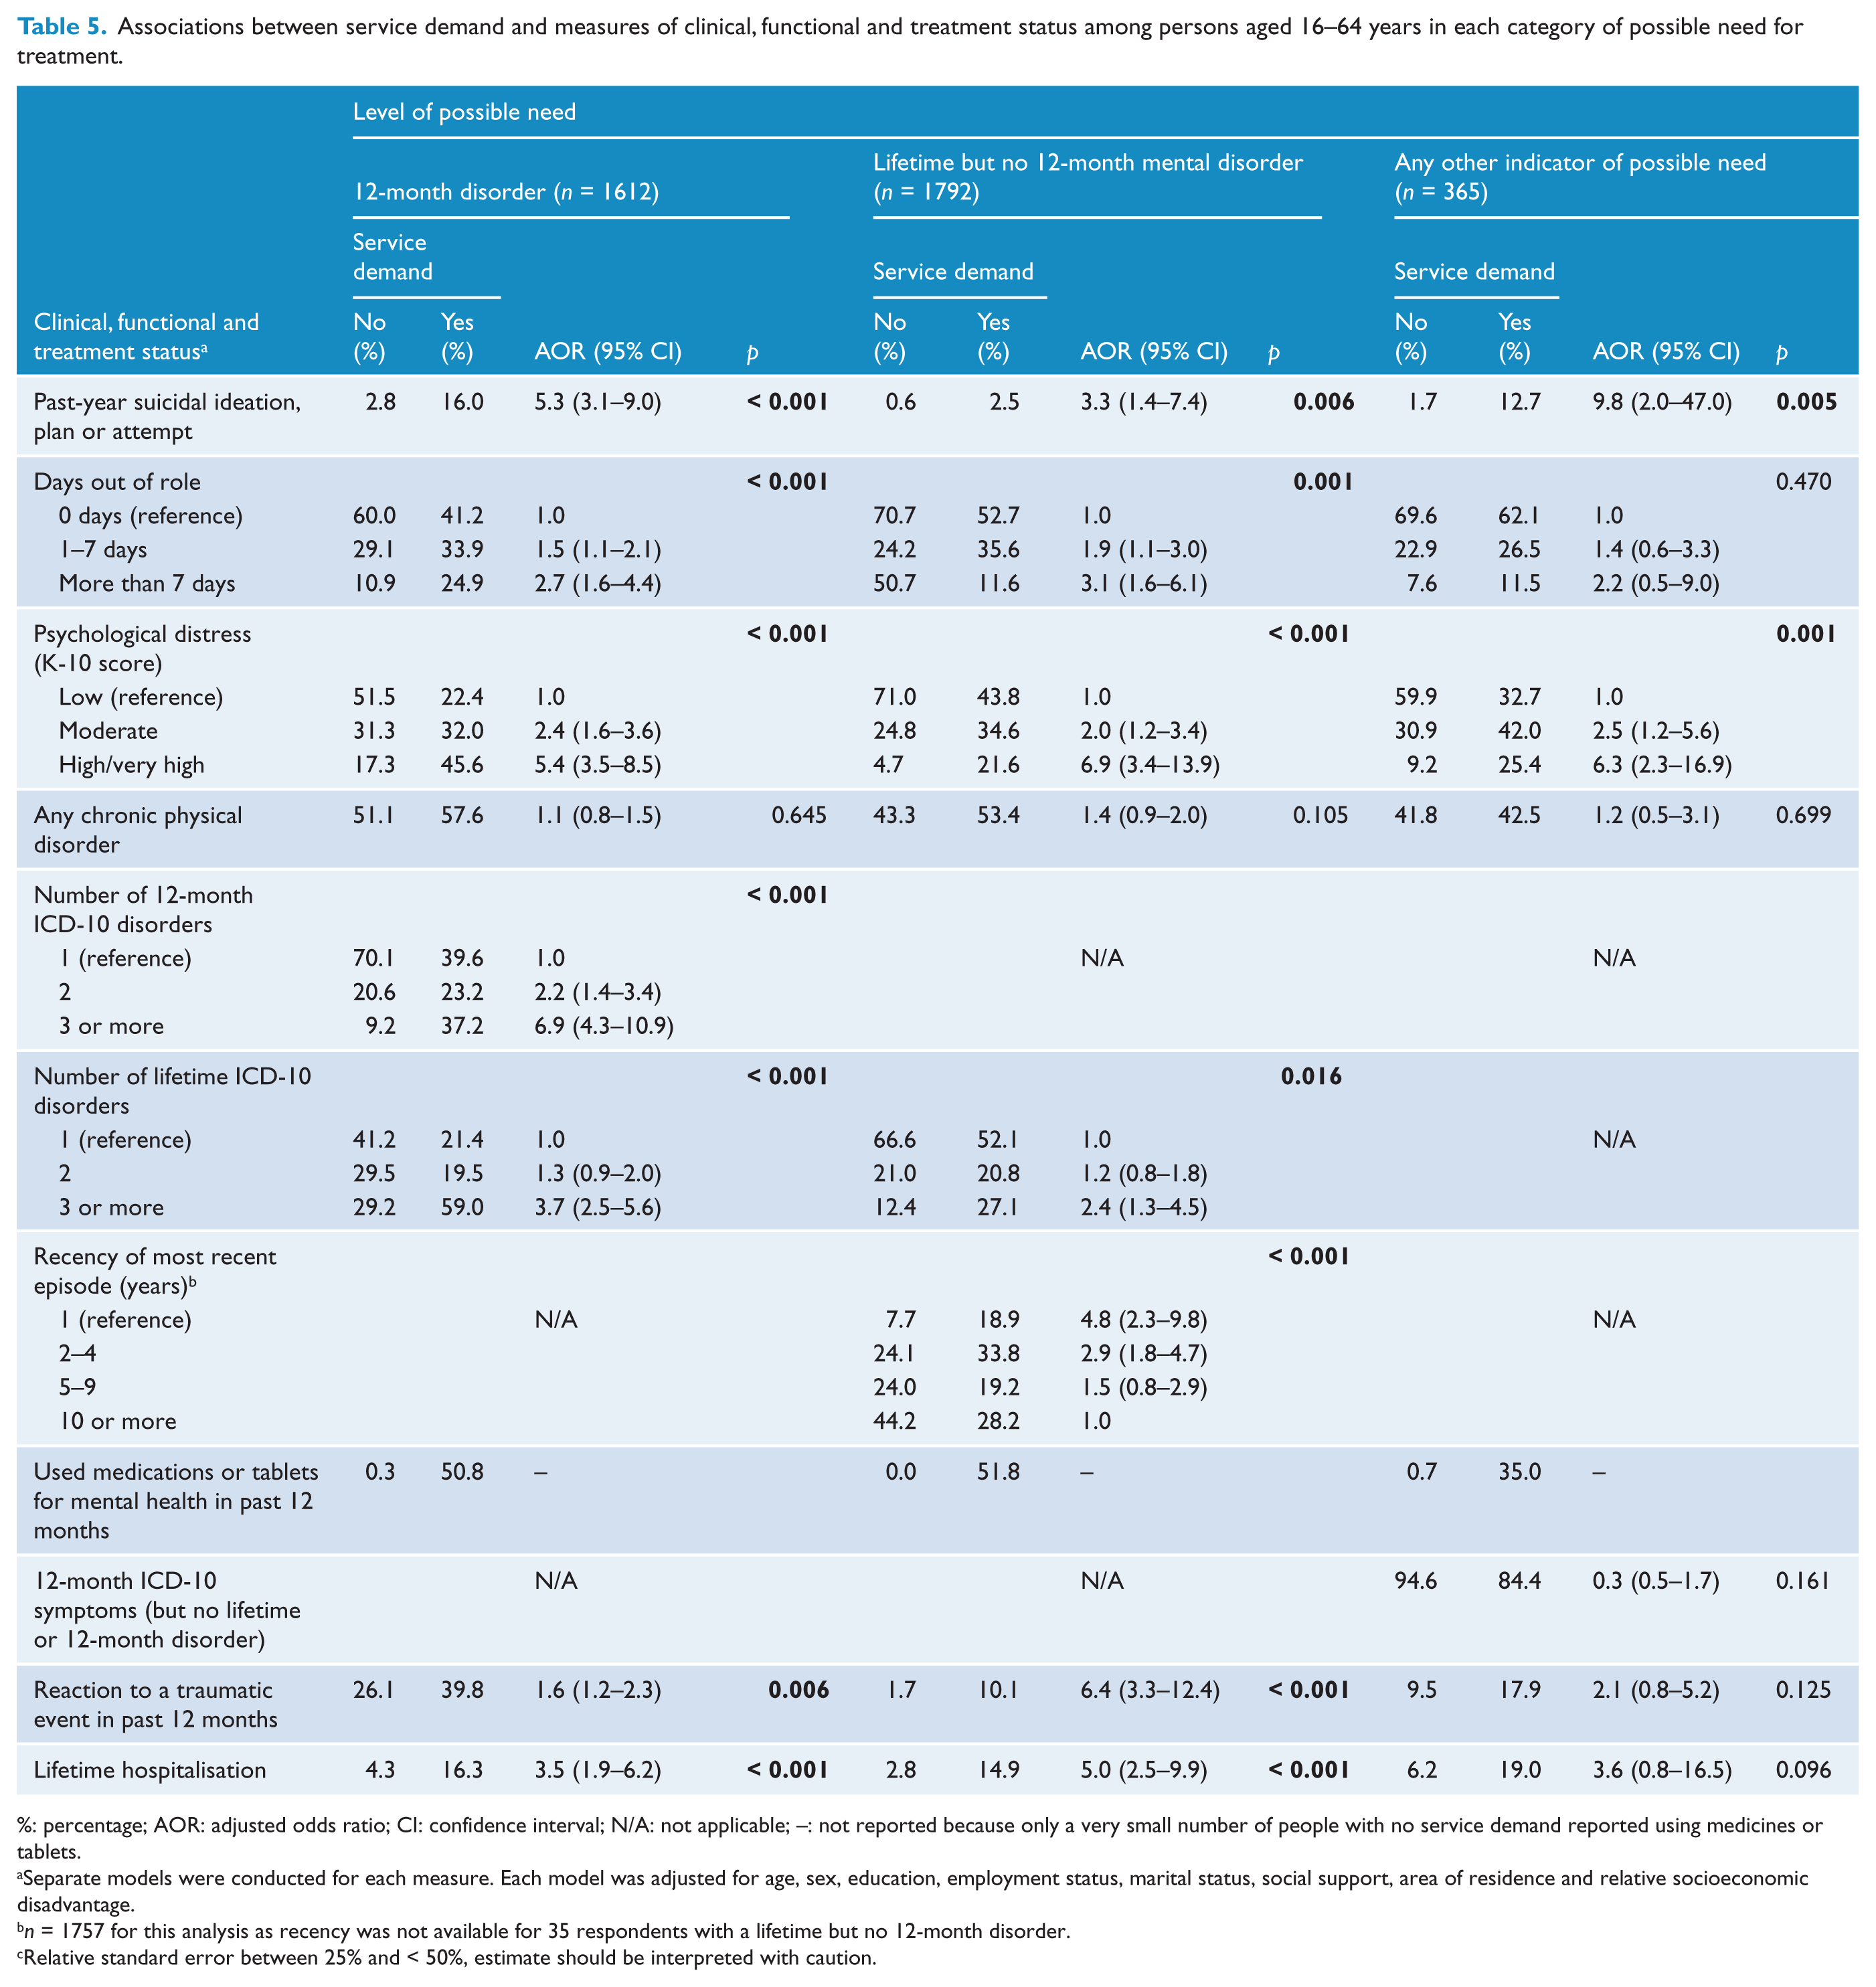
%: percentage; AOR: adjusted odds ratio; CI: confidence interval; N/A: not applicable; –: not reported because only a very small number of people with no service demand reported using medicines or tablets.
Separate models were conducted for each measure. Each model was adjusted for age, sex, education, employment status, marital status, social support, area of residence and relative socioeconomic disadvantage.
n = 1757 for this analysis as recency was not available for 35 respondents with a lifetime but no 12-month disorder.
Relative standard error between 25% and < 50%, estimate should be interpreted with caution.
Discussion
This study examined whether service demand for mental health care varied among Australian adults aged 16–64 years according to their level of possible need. There were four main findings. Firstly, 16% of adults reported service demand, of whom four out of five had used services, and one in five wanted but had not used services. Of those reporting service demand, one-third did not meet criteria for a 12-month disorder, equating to 5.7% of the adult population aged 16–64 years or almost 776,000 people in 2007.
Secondly, treatment patterns tended to follow a gradient defined by level of possible need. For example, people with 12-month disorders accounted for 60% of all service users and 75% of all consultations for mental health problems. They received, on average, 1.6–3.9 times more consultations than their counterparts in other levels of possible need. They also had 1.9–2.2 times higher rates of psychologist consultation – this may reflect the eligibility criteria for the widely utilised Better Access programme, which requires the presence of a diagnosis in order for a referral to be made to an allied health professional. Treatment by a GP or non-mental health professional exclusively was relatively more common among those with any other indicator of possible need or no indicator of possible need, whereas treatment by a mental health professional was relatively more common among people with 12-month or lifetime but no 12-month mental disorders.
Thirdly, levels of service demand for counselling or talking therapy, medicine or tablets, and practical help were similar among respondents in all levels of possible need. In contrast, service demand for information was more common among respondents with a 12-month disorder.
Fourthly, people reporting service demand generally had higher levels of symptoms and impairment compared to their counterparts without service demand. Among those reporting service demand, the proportion of individuals with a lifetime but not current disorder and a 12-month disorder reporting use of medicines or tablets for mental health were similar (approximately 51%).
Limitations
Large-scale epidemiological studies, such as the 2007 NSMHWB, remain the gold standard for estimating service demand (Aoun et al., 2004; Mechanic, 2003). Nonetheless, the results should be interpreted in light of several caveats. The first relates to the measurement of diagnoses. The CIDI has acceptable reliability and validity and is widely used internationally (Wittchen, 1994), but may not accord with diagnoses assigned by a clinician. The 2007 NSMHWB did not assess the presence of all mental disorders, and some of the apparent discordance between diagnosis and service use estimates may be due to misclassification of persons with mental disorders not captured. However it is expected many people with disorders outside the survey’s scope will meet diagnostic criteria for an in-scope disorder due to high comorbidity (Regier et al., 1990), and the total number misclassified will be low (Druss et al., 2007). The survey response rate was 60%, but we do not know whether this may have resulted in any relevant selection bias.
The second methodological issue relates to the assessment of service use, which was based on respondent self-report. Self-report has been associated with an under-reporting of service use, however people with elevated distress or more severe disorders may report greater levels of service use than those without these characteristics (Alonso et al., 2007; Rhodes and Fung, 2004; Rhodes et al., 2002). The survey CURF provided only categorical information about number of consultations for mental health problems, and we cannot definitively say that our deemed averages accurately represent the actual number of services used. The CURF provided information about the types of interventions desired by people who wanted but had not used services, but not the quantity required.
Thirdly, small numbers potentially limit the reliability of some estimates, for example the proportions of people within categories of possible need and severity who consulted a non-mental health professional, or who reported service demand for practical help. We identified estimates with large standard errors, so this can be taken into consideration.
Fourthly, this paper explored service utilisation patterns at a national level. It cannot be assumed that the observed patterns would be the same in specific geographical locations, or among specific sub-populations.
Implications
The findings of this study shed light on the nature of service demand among persons without a 12-month disorder in Australia. Based on prevalence alone, 22% of adults with a 12-month mental disorder plus a further 31% of Australian adults reported having an indicator of possible need for mental health care. This profile broadly concurs with that found in other countries (Codony et al., 2009; Druss et al., 2007), despite differences in service systems and study methodologies. Although service demand among people without a 12-month disorder represents a considerable number of people (5.7% of the population), their impact on services is likely to be lessened by their lower service requirements (assuming the same patterns among those who wanted but had not used services as for service users).
We found that persons with a lifetime but no 12-month disorder accounted for almost one-fifth (18%) of individuals with service demand. It has been suggested that many people in this group have recent episodes and are receiving maintenance treatment to prevent relapse (Druss et al., 2007). We found support for this in our Australian sample. Among Australian adults with a lifetime but no 12-month mental disorder, those reporting service demand had more recent episodes than those without service demand; had poorer clinical and functional status; had similar rates of self-reported 12-month use of medicines or tablets for mental health to their counterparts with 12-month disorders; and accounted for a similar proportion, and average number, of mental health consultations as people with mild 12-month mental disorders.
Persons with any other possible indicator of need comprised 7% of adults with service demand. Among this group, the presence of 12-month mental disorder symptoms was very high overall. Individuals reporting service demand had elevated levels of suicidality and psychological distress. Of those who had used services, their estimated average number of consultations was roughly equivalent to persons with mild 12-month disorders, but a greater percentage of their consultations were provided exclusively by a GP or non-mental health professional. This group is important to consider, given evidence of their increased risk of developing mental disorders (Pietrzak et al., 2012). It is argued that, in addition to lowering symptom levels, treating sub-threshold symptoms may prevent the transition to a disorder meeting diagnostic threshold, providing a more cost-effective treatment pathway and preventing further disability (Kessler et al., 2003). Equally, however, there are concerns about whether it is appropriate to ‘medicalise’ this population, many of whom may be experiencing transient symptoms in response to a specific stressor (Sareen et al., 2012), and to provide unnecessary treatment which may increase stigma, cause harm, or waste limited healthcare resources (Druss et al., 2007). At present, there are no clear criteria for determining which individuals within this group are most at risk and require services.
Few (4%) persons with no indicator of possible need reported service demand. This is consistent with findings from the USA (Druss et al., 2007), and a previous analysis of Australians deemed to have used services under the Better Access programme in 2007 (Harris et al., 2011). Among this group, we found that the average number of consultations received by those using services was only one-quarter of that received by persons with 12-month disorders, and a much greater percentage of their consultations were with a GP or non-mental health professional exclusively. One US study has suggested that rates and patterns of this kind do not suggest a major problem with over-servicing, i.e. the use of too many services or services at an unnecessarily high level of specialisation (Druss et al., 2007).
The current study provides an empirical contribution to debate around whether people who do not meet criteria for a current mental disorder should be considered in scope for mental health service planning. Findings suggest that service demand among community-dwelling adults aged 16–64 years in Australia in 2007 was 16%, approximately 23% higher than the service utilisation rate of 13%. Over the past decade Australia has implemented major mental health reforms to increase access to mental health care (Jorm, 2011). Available evidence suggests that, in the decade from 1997 to 2007, these have impacted on the types of health professionals seen (Saw et al., 2010) and types of services wanted by those who had not used services or who wanted more of them (Meadows and Bobevski, 2011), but their effect on overall treatment rates may not have occurred until after 2007 (Whiteford et al., 2014). Analysis of data from a repeat administration of the NSMHWB is required to assess the effects of these reforms on service demand.
The results of this study support previous findings that many people with 12-month disorders, particularly milder disorders, have not used and do not want mental health services. There is ongoing debate about the necessity and cost-effectiveness of treatment for people with mild mental disorders, with some arguing treatment is not necessary for many in this group due to low distress and spontaneous remission (Sareen et al., 2012). Those who do not seek treatment have a substantial likelihood of remission (Sareen et al., 2012; Whiteford et al., 2013), highlighting that further work is required to determine what proportion, if any, of those with a disorder but no service demand should be included in planning for mental health service delivery.
This study asked ‘Who reports service demand and what services do they use or want?’ It did not examine whether the care received was evidence based or of sufficient duration to effect change (Wang et al., 2002). An important next step is to examine whether resources are being invested into cost-effective interventions that will result in sustained benefits to those with service demand, specific to their level of possible need.
Conclusions
The findings of this study may help planners and policy-makers design mental health services for people with differing levels of possible need, and to estimate the type and quantum of services they require. A significant proportion of mental health service users, in Australia and other high-income countries, do not meet criteria for a current mental disorder, but may access care to maintain their well-being after being acutely unwell or may be at risk of developing a mental illness. Further research is required to determine whether the services received or wanted are appropriate and of adequate quality for each of these groups.
Footnotes
Acknowledgements
The 2007 NSMHWB was funded by the Australian Government Department of Health and Ageing, and conducted by the Australian Bureau of Statistics.
Funding
This work was supported by the New South Wales Ministry of Health and the National Health and Medical Research Council Centre for Research Excellence in Mental Health Systems Improvement (APP1041131).
Declaration of interest
The authors report no conflicts of interest. The authors alone are responsible for the content and writing of the paper.