
Abstract
Objective:
While schizophrenia may have a progressive component, the evidence for neurodegenerative processes as indicated by reactive astrocytes is inconclusive. We recently identified a subgroup of individuals with schizophrenia with increased expression of inflammatory markers in prefrontal cortex, and hypothesized that this subgroup would also have reactive astrocytes.
Method:
We measured glial fibrillary acidic protein (GFAP) mRNA by quantitative real-time reverse transcriptase polymerase chain reaction (RT-PCR) and protein levels by immunoblotting in grey matter homogenate from 37 individuals with schizophrenia and 37 unaffected controls. We examined the morphology of GFAP-positive astrocytes in immunostained sections of middle frontal gyrus. We tested if GFAP expression or astrocyte morphology were altered in people with schizophrenia with increased expression of inflammatory markers. We used RNA-Seq data on a subset of patients and controls (n=20/group) to ascertain whether mRNA transcripts associated with astrogliosis were elevated in the individuals with active neuroinflammation.
Results:
GFAP (mRNA and protein) levels and astrocyte morphology were not significantly different between people with schizophrenia and controls overall. However, individuals with schizophrenia with neuroinflammation had increased expression of GFAP mRNA (t(33)=2.978, p=0.005), hypertrophic astrocyte morphology (χ2(2)=6.281, p=0.043), and statistically significant elevated expression of three mRNA transcripts previously associated with astrogliosis.
Conclusions:
We found clear evidence of astrogliosis in a subset of people with schizophrenia. We suggest that the lack of astrogliosis reported in previous studies may be due to cohort differences in aetiopathology, illness stage, treatment exposure, or a failure to examine subsets of people with schizophrenia.
Introduction
Schizophrenia is a disorder characterized by heterogeneity in several domains, including genetic risk (Walters et al., 2010), cognitive deficits (Weickert et al., 2000) and volumetric brain changes (Collin et al., 2012). Recently, we also observed heterogeneity in schizophrenia neuropathology (Fillman et al., 2013). We identified a subgroup (38%) of individuals with schizophrenia with increased expression of inflammatory marker mRNAs (interleukin-6, SERPINA3, interleukin-1β, interleukin-8) in the dorsolateral prefrontal cortex (DLPFC; Fillman et al., 2013). The schizophrenia group also had increased microglial density (Fillman et al., 2013). Microglia activation (microgliosis) and increased interleukin expression are typically accompanied by reactive astrocytes (astrogliosis; Spooren et al., 2011); however, the evidence to date for astrogliosis occurring in brains of people with schizophrenia is controversial.
Increased cortical microgliosis in people with schizophrenia has previously been observed in post-mortem studies (Bayer et al., 1999; Busse et al., 2012; Fillman et al., 2013; Radewicz et al., 2000; Rao et al., 2013), though not consistently (Arnold et al., 1998; Kano et al., 2011; Steiner et al., 2006, 2008). In vivo positron emission tomography (PET) imaging studies have also identified microgliosis in schizophrenia. A study of people with recent-onset schizophrenia and another study of individuals who were recovering from a psychotic episode both found increases in a marker indicative of microgliosis (binding of [11C]PK11195 to the mitochondrial 18kDa translocator protein (TSPO)) in grey matter (Doorduin et al., 2009; Van Berckel et al., 2008); whereas another study of chronic patients with schizophrenia failed to find a change using another microglial marker (Takano et al., 2010) (binding of [11C]DAA1106, an agonist with greater affinity for TSPO than PK11195). The latter study did find a positive correlation between microglial marker binding and positive symptoms, and thus the three in vivo PET studies are consistent with increased microgliosis being especially prominent in those with recent psychotic exacerbation. Reactive microglia and/or macrophages and their associated cytokines provide the required cues for the induction of astrogliosis (Balasingam et al., 1996), and thus the presence of microgliosis and increased inflammatory cytokine expression in schizophrenia would be expected to trigger astrogliosis in people with schizophrenia.
Consistent evidence of astrogliosis in post-mortem brains from people with schizophrenia has proven elusive, perhaps in part due to inadequate statistical power (Schnieder and Dwork, 2011). Investigations of astrogliosis include studies of glial morphology and size, measures of an intermediate filament protein, glial fibrilliary acidic protein (GFAP) and GFAP mRNA. There is no evidence of change in glial cell size (Rajkowska et al., 1998) and most immunohistochemistry studies fail to find increased density of GFAP positive cells (Arnold et al., 1996, 1998; Casanova et al., 1990; Damadzic et al., 2001; Falkai et al., 1999; Niizato et al., 2001; Pantazoloulos et al., 2010; Stevens et al., 1988). Williams and colleagues (2013) recently found a decrease in GFAP-positive cell density in the cingulate grey and white matter. However, two studies utilizing the Holzer stain found increased densities of astrocytes in periventricular regions of the diencephalon (Bruton et al., 1990; Stevens, 1982) as well as in white matter and cerebral cortex (Bruton et al., 1990). Cortical and hippocampal GFAP protein has been reported to be decreased (Johnston-Wilson et al., 2000; Steffek et al., 2008; Toro et al., 2006), not changed (Arnold et al., 1996; Dean et al., 2006; Roberts et al., 1986, 1987; Steffek et al., 2008) or increased (Feresten et al., 2013; Toro et al., 2006) in people with schizophrenia. A similar picture emerges for mRNA studies of GFAP expression, again with decreased (Webster et al., 2005) or not changed (Katsel et al., 2011) expression in the anterior cingulate cortex and increased expression in subcortical structures (Barley et al., 2009) in individuals with schizophrenia. It is noteworthy that three of the five studies finding evidence of increased astrogliosis in schizophrenia included subcortical structures in their analysis, as astrogliosis resolves more slowly in deeper subcortical regions (Norton et al., 1992) and thus astrogliosis in these regions would capture more temporally distant ‘injury’. It is important to note that several studies of astrogliosis utilized tissue from elderly patients with schizophrenia (Arnold et al., 1996, 1998; Bruton et al., 1990; Katsel et al., 2011; Roberts et al., 1987), which may have confounded results because astrogliosis is elevated with the normal aging process (Nichols et al., 1993). In summary, despite increases in central nervous system (CNS) inflammation and microgliosis in schizophrenia, only a few studies find increased astrogliosis that would be indicative of an active neurodegenerative process.
As microgliosis is usually associated with astrogliosis, a study examining markers of both microgliosis and astrogliosis in the same individuals with schizophrenia and based on the assumption that differences may only affect a subgroup may help to resolve the apparent inconsistencies of previous studies. The aim of the current study was to identify quantitative or qualitative changes in GFAP, the elevation of which is considered to be a sensitive marker of astrogliosis (Norton et al., 1992). We studied the middle frontal gyrus from people with schizophrenia (mean age 51 years) within a relatively large tissue collection (37 individuals with schizophrenia and 37 controls). This sample size is sufficient to provide adequate power to detect a systematic effect of diagnosis (Schnieder and Dwork, 2011). We hypothesized that astrogliosis would be identifiable in the subgroup of individuals with schizophrenia with increased cytokine mRNAs. Utilizing a database of mRNA transcript levels determined by next generation sequencing (RNA-Seq) on a subset of samples from our cohort (Fillman et al., 2013), we ascertained whether mRNA transcripts increased with astrogliosis were also elevated in the individuals with increased expression of inflammatory markers.
Methods
Human post-mortem brain tissue and anatomy
Post-mortem tissue from the DLPFC was obtained from 37 individuals with schizophrenia and 37 controls (demographic summary in Table 1) within the New South Wales Tissue Resource Centre collection, which has been characterized previously (Weickert et al., 2010). We also utilized our existing database of mRNA transcript expression levels determined by RNA-Seq in DLPFC from a subset of 20 individuals with schizophrenia and 20 controls (demographic summary in Table 1) described previously (Fillman et al., 2013).
Demographics of the schizophrenia and matched unaffected control subjects in the New South Wales Tissue Resource Centre post-mortem brain tissue cohort.
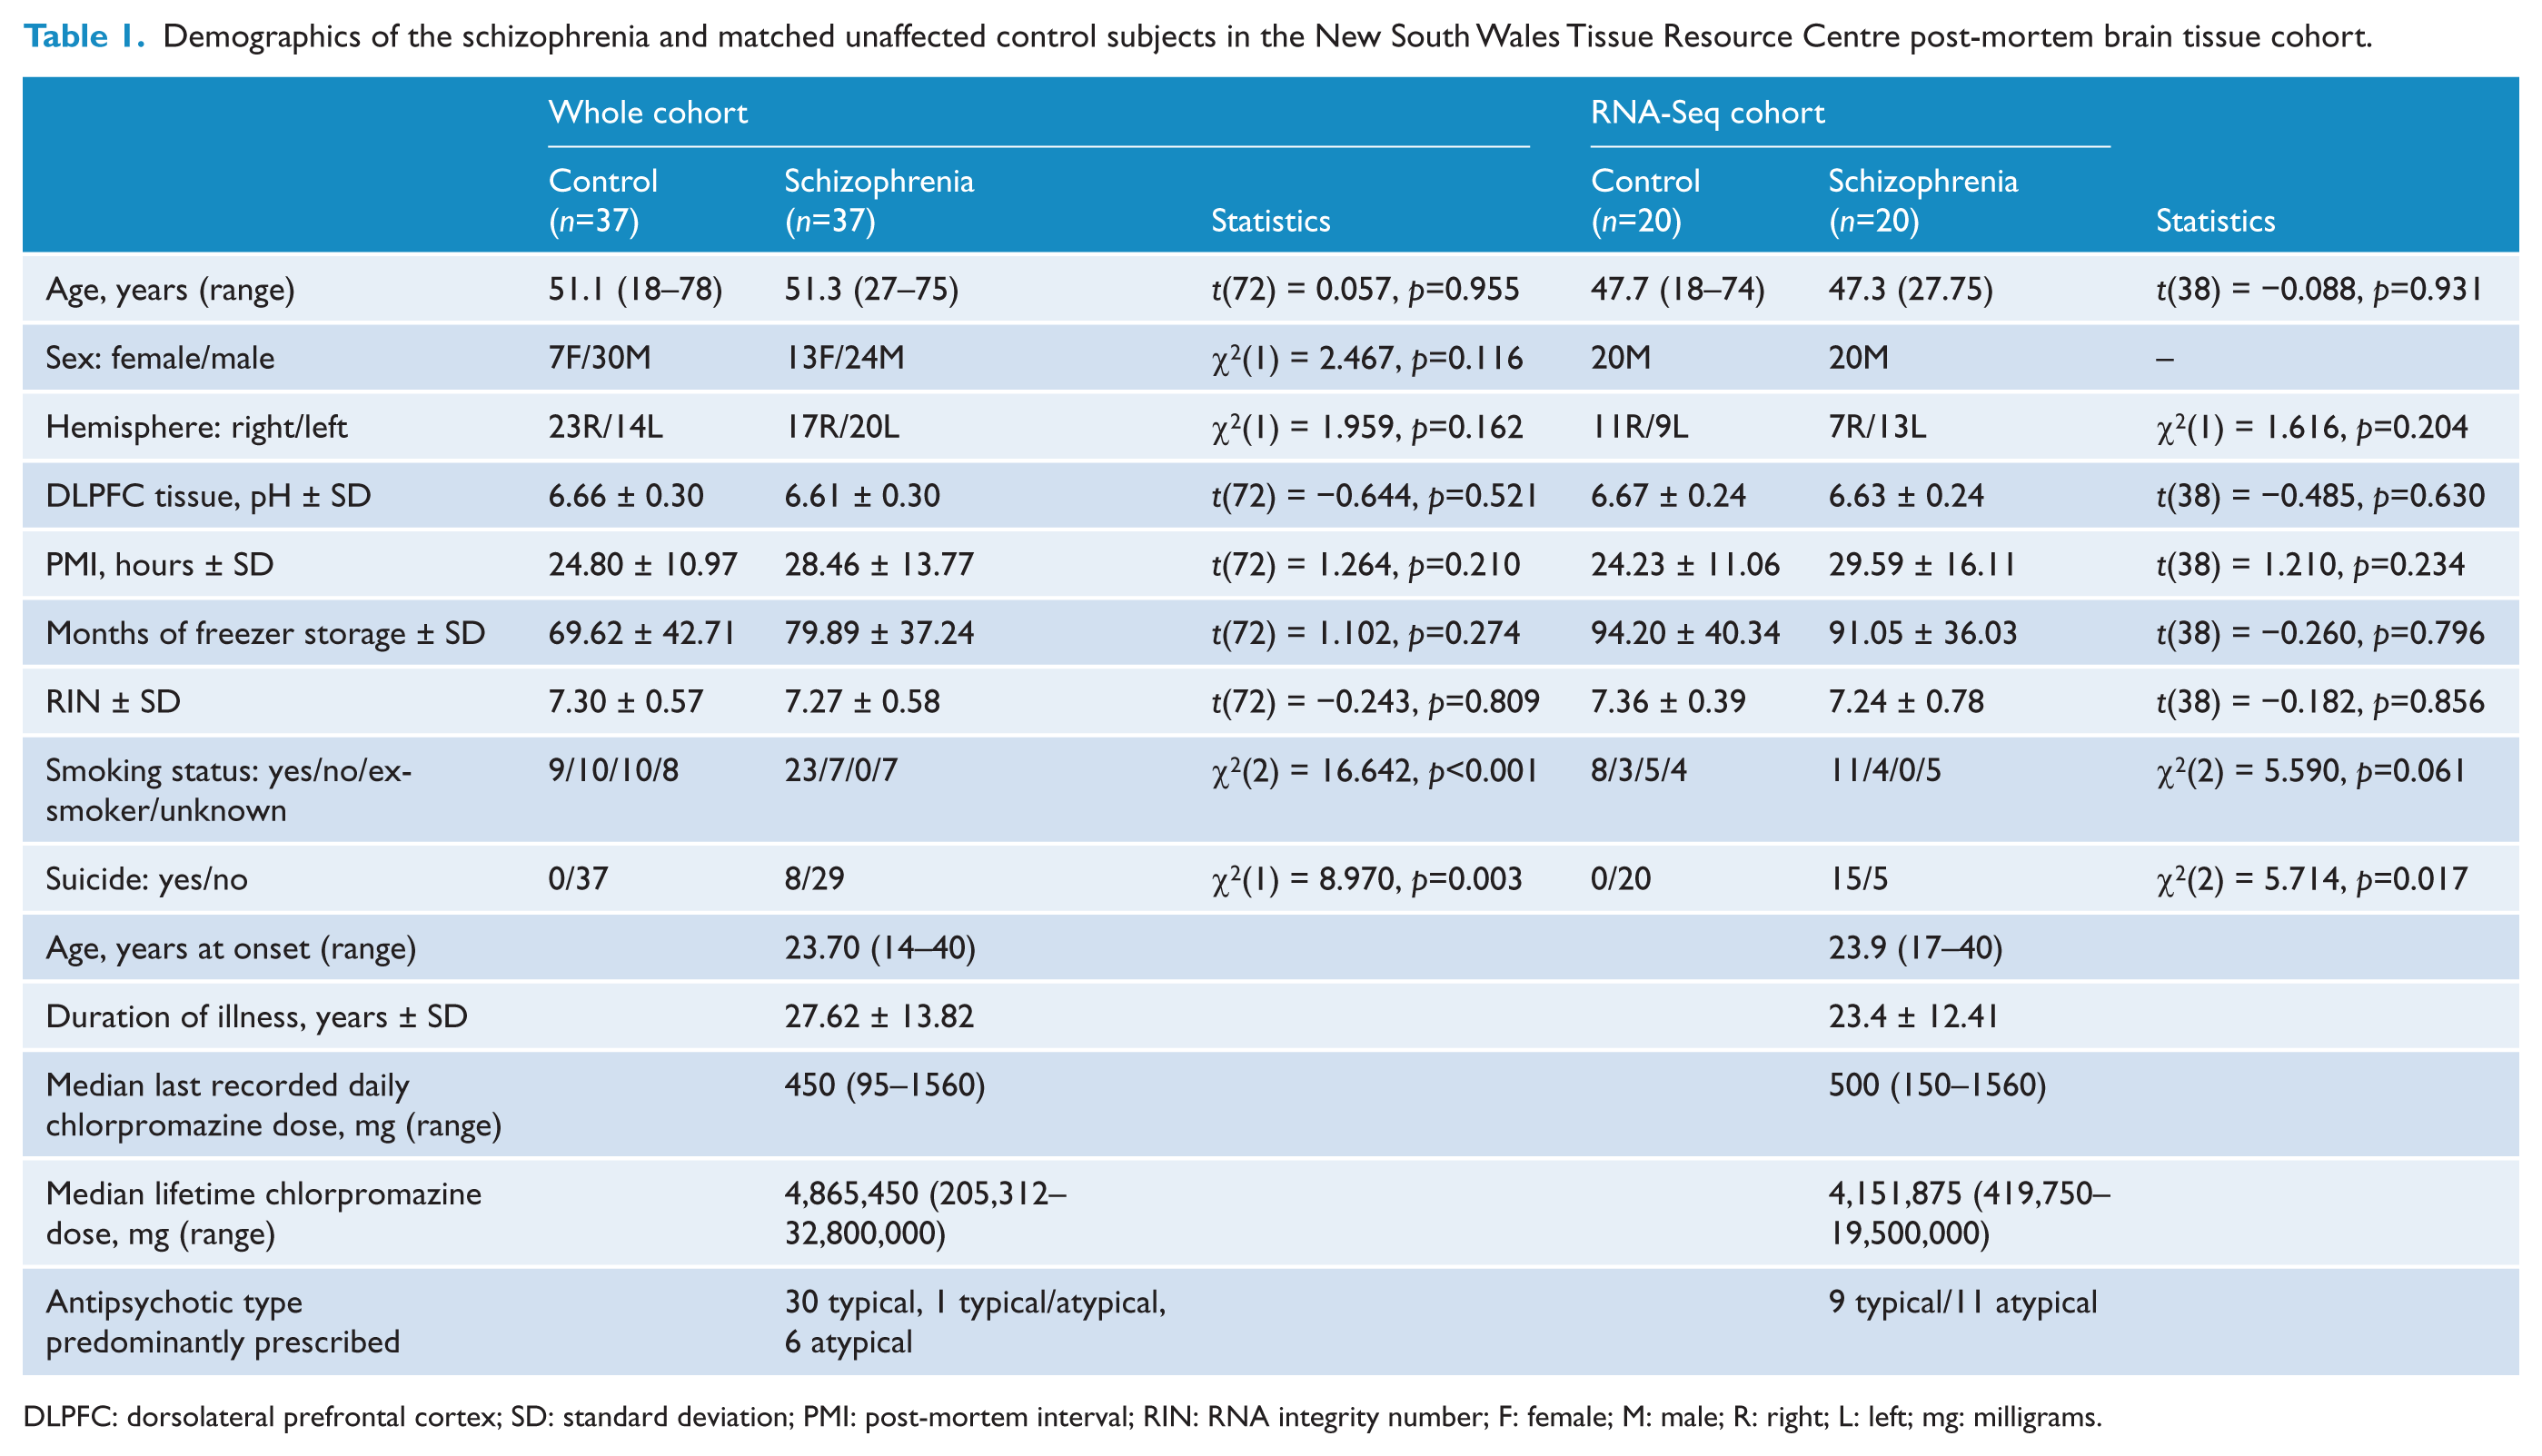
DLPFC: dorsolateral prefrontal cortex; SD: standard deviation; PMI: post-mortem interval; RIN: RNA integrity number; F: female; M: male; R: right; L: left; mg: milligrams.
For homogenates (mRNA and protein), tissue was sampled from the middle one-third (rostro-caudally) of the middle frontal gyrus anterior to the premotor cortex. Grey matter tissue was dissected from 1 cm thick coronal blocks just rostral to or at the genu of the corpus callosum, typically along the inferior frontal sulcus (containing ventral middle frontal gyrus and dorsal inferior gyrus). For slide-based analyses, the blocks typically contained the superior frontal sulcus and the entire middle frontal gyrus. From these sections, the presence of BA46 in each series of sections was cytoarchitecturally confirmed using immunohistochemistry for the neuronal marker NeuN (Rajkowska and Goldman-Rakic, 1995).
This study was carried out in accordance with the latest version of the Declaration of Helsinki after review by the Human Research Ethics Committee at the University of New South Wales (HREC No. 07261 and 12435).
Quantitative PCR
RNA extraction and complimentary DNA (cDNA) preparation has been described previously in detail (Weickert et al., 2010). We used aliquots of the same cDNA synthesized and utilized for the Weickert et al. (2010) publication. GFAP mRNA was measured by quantitative real-time reverse transcriptase polymerase chain reaction (RT-PCR) (TaqMan probe Hs00909236_m1; Applied Biosystems, Australia) and normalized using the geometric mean of expression levels of four housekeeping genes: glyceraldehyde 3-phosphate dehydrogenase (GAPDH: Hs99999905_m1), β-actin (ACTB: Hs99999903_m1), TATA-binding protein (TBP: Hs00427621_m1) and ubiquitin C (UBC: Hs00824723-m1). The expressions of these housekeeping genes were unchanged in schizophrenia compared to controls and represent genes with high, medium and low levels of expression (Weickert et al., 2010).
Western blotting analysis
Protein homogenates were prepared from 40 mg of frozen DLPFC tissue homogenized in 400 μL of buffer (0.05 M Tris, pH 7.5, 50% glycerol, 2 mM 4-(2-aminoethyl)benzene-sulfonyl fluoride hydrochloride, 0.015 mM aprotinin, 0.038 mM leupeptin, 0.030 mM pepstatin A, 0.028 mM E-64, 0.08 mM bestatin). Western blotting was carried out using the standard procedure as described in Fillman and colleagues (2013). Protein (10 μg) was diluted in Laemmli buffer and separated by gel electrophoresis in 12% Bis/Tris acrylamide gels. Proteins were transferred onto nitrocellulose membranes, which were blocked in 5% skim milk in Tris-buffered saline with Tween-20. Membranes were incubated with primary monoclonal antibodies for GFAP (Chemicon MAB360, clone GA5) or β-actin (Chemicon MAB1501) at 4°C overnight, then washed and incubated with appropriate anti-mouse peroxidase-conjugated affinity purified secondary antibodies at room temperature for 1 hour. After further washing, membranes were incubated with chemiluminescence reagent (Millipore, Sydney, Australia) and exposed to film from which we determined the levels of GFAP and β-actin protein by densitometry using Quantity One 1-D Analysis Software version 4.6.5 (Bio-Rad Laboratories, Hercules, CA, USA). GFAP protein levels were normalized to levels of β-actin and to a pooled internal standard (consisting of DLPFC protein homogenate from six individuals combined) run on each gel to control for inter-gel variability.
Immunohistochemistry analysis
Astrocyte morphology was determined by visual inspection of GFAP immunoreactive astrocyte processes. We stained fresh-frozen sections of middle frontal gyrus with a polyclonal rabbit anti-GFAP antibody (DAKO Z0334; 1:1000) and 3,3’-diaminobenzidine immunohistochemistry following published protocols (Fillman et al., 2013). Sections were counterstained with thionin (Nissl stain). Images were obtained on a Nikon Eclipse 80i microscope (Coherent Scientific, Hilton, SA, Australia) with a 40× objective. The morphology of GFAP-positive astrocytes in the white matter was classified by being predominantly fibrous (‘resting’), intermediate or hypertrophic (swollen) for each case by two independent scientists (VSC, SJF) who were blind to diagnosis.
Statistical analysis
Statistical analyses were performed using SPSS statistics (version 20; IBM, Armonk, NY, USA). If the data were non-normally distributed within each diagnostic group, data were log10 transformed (GFAP mRNA transcript levels, GFAP 35 kDa and GFAP 43 kDa protein levels) or square root transformed (GFAP 48 kDa protein levels). Data for GFAP 39 kDa could not be normalized by transformation in the schizophrenia group and were analysed non-parametrically as an ordinal variable. Population outliers were defined as those values that fell outside of two standard deviations from the diagnostic group mean.
Parametric and non-parametric tests were performed as appropriate to determine diagnostic group differences in gene and protein expression levels, and to examine if sex, hemisphere, smoking status, medication status (predominantly typical versus atypical antipsychotic treatment) and suicide were related to GFAP mRNA and protein levels. We used Spearman and Pearson correlations as appropriate to relate gene expression levels within each group with demographic (age, pH, post-mortem interval (PMI), freezer storage time and RNA integrity number (RIN)) and, in the schizophrenia group, clinical (age at onset of schizophrenia, duration of illness, daily chlorpromazine equivalent dose, lifetime chlorpromazine equivalent dose) variables.
To determine whether gliosis may be altered in a subset of people with schizophrenia, we divided the disease group into an a priori defined subset of individuals with increased cortical expression of inflammatory markers (interleukin-6, SERPINA3, interleukin-1β, interleukin-8) at the time of death relative to those without (Fillman et al., 2013) and determined differences in GFAP expression and astrocyte morphology. The subset of individuals with increased inflammatory markers was identified statistically using a recursive two-step cluster analysis, as described in detail in Fillman et al. (2013). There were 33 controls and 23 people with schizophrenia with low expression of inflammatory markers, and four controls and 14 people with schizophrenia with high expression of inflammatory markers.
We also explored our existing database of mRNA transcript expression levels determined by RNA-Seq in DLPFC from 20 individuals with schizophrenia (12 individuals with low and eight with high inflammation) and 20 controls (17 individuals with low and three with high inflammation; Fillman et al., 2013) to determine if any mRNA transcripts from a gene list of 50 transcripts that are specifically up-regulated in astrocytes 24 hours following a systemic lipopolysaccharide (LPS) endotoxin injection (Zamanian et al., 2012), a treatment known to elicit an inflammatory response, were up-regulated in the high inflammatory group. Owing to the small sample size of controls with high inflammation, this group was excluded from statistical analysis and only qualitatively appraised. Parametric and non-parametric tests were performed as appropriate and significance levels were adjusted using Hockberg’s step-up method based on the Bonferroni test (Hochberg, 1988).
Results
Relationship between GFAP expressions and demographic and clinical variables
We found greater expression of GFAP mRNA with increasing age (Table S1). Consistent with GFAP protein being expressed as multiple isoforms (Middeldorp and Hol, 2011), we detected four immunoreactive bands running at about 35, 39, 43 and 48 kDa (Figure 1B). Total GFAP protein, the 48 kDa and the 43 kDa isoforms across all subjects, also correlated positively with age (Table S1). There were no significant differences in GFAP mRNA levels or total GFAP protein levels according to sex (mRNA: t(66)=0.638, p=0.526; protein: t(70) = −0.726, p=0.470). However, the 43 and 35 kDa isoforms of GFAP protein were both significantly lower in males as compared to females (43 kDa: t(68) = −2.522, p=0.014; 35 kDa: t(68) = −2.137, p=0.036). GFAP mRNA or protein levels did not differ significantly between brain hemispheres (all t-values < 1.0, all p-values > 0.05), except for the 39 kDa GFAP isoform which had greater expression in the right hemisphere (t(61) = −2.202, p < 0.031). We explored this further in a two-way ANOVA, where there was a significant main effect of hemisphere (F(1,67)=5.170, p=0.026) and a non-significant main effect of diagnosis (F(1,67)=0.606, p=0.439) for the 39 kDa isoform. There was no significant interaction effect between hemisphere and diagnosis (F(1,67)=0.088, p=0.768). Smoking status had no significant effect on GFAP mRNA or protein levels (all F-values < 2.2; all p-values > 0.05). Peri-mortem factors, such as DLPFC tissue pH and PMI correlated negatively with GFAP levels (Table S1). This was also reflected in the negative correlations between RIN and GFAP mRNA and protein levels (Table S1).
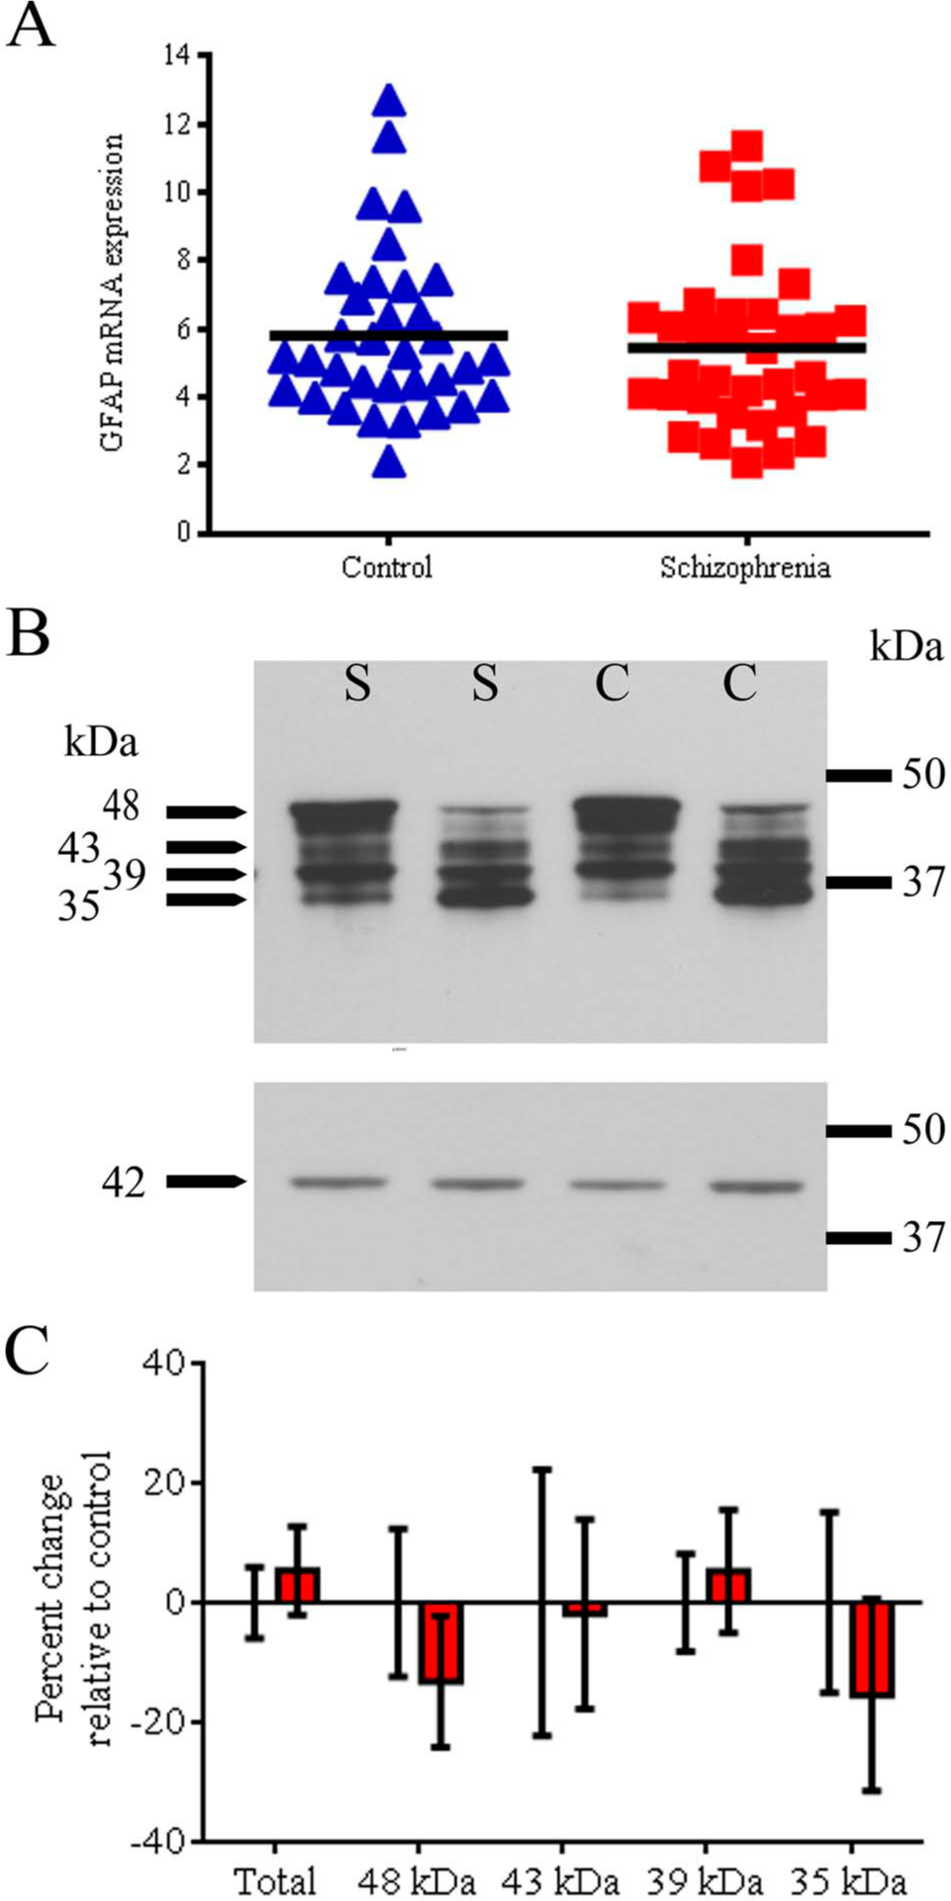
Glial fibrillary acidic protein (GFAP) expression in dorsolateral prefrontal cortex (DLPFC) from individuals with schizophrenia and unaffected controls.
Cause of death was significantly related to expression of GFAP in the schizophrenia group, with mRNA transcript levels for GFAP being significantly lower in people who died by suicide compared to patients who died from other causes (t(33)=3.800, p=0.001). Similarly, total GFAP protein and the 43 kDa isoform levels were significantly lower in individuals who died by suicide compared to patients who died from other causes (total GFAP protein: t(34)=2.073, p=0.046; 43 kDa: t(33)=3.638, p=0.001). Suicide is associated with a younger age at death and when we co-varied for age, the above relationships with mode of death disappeared (all F-values < 3.267, all p-values > 0.05).
Age at onset of schizophrenia, daily dose of antipsychotic medications and last recorded chlorpromazine dose were not correlated with GFAP mRNA expression (Table S1). Although duration of illness and lifetime chlorpromazine dose correlated positively with GFAP mRNA expression and with the levels of GFAP 43 kDa protein (Table S1), these correlations were no longer significant when age at death was controlled for (both r-values < 0.2, p > 0.05).
GFAP mRNA transcript expression-group differences
We observed a decreasing trend in GFAP mRNA (an average decrease of 6%) in the DLPFC from people with schizophrenia (Figure 1A), which was not statistically significant after controlling for the effects of age, pH and RIN (F(1,63)=3.036, p=0.086).
We examined whether individuals with schizophrenia who had increased expression of inflammatory markers (n=14) at the time of death (Fillman et al., 2103) had higher levels of GFAP mRNA than those who did not (n=23). Average GFAP mRNA levels were significantly greater (52%) in the high inflammatory schizophrenia group (t(33)=2.978, p=0.005; Figure 2A) compared to the low inflammatory schizophrenia group, with only a slight increase in the high inflammatory control group (7%) compared to low inflammation controls.
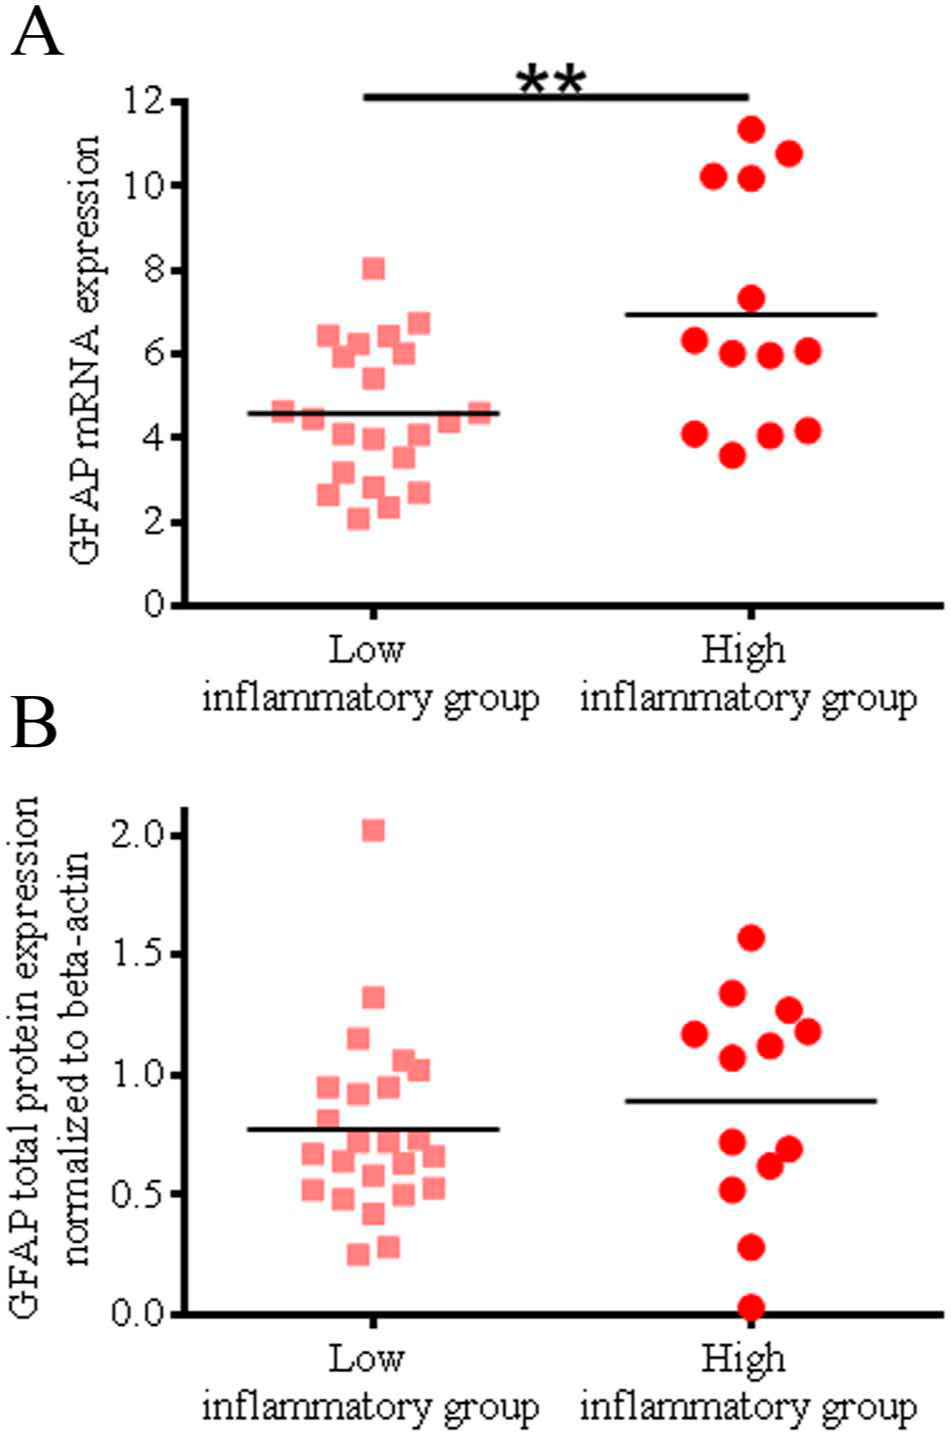
Glial fibrillary acidic protein (GFAP) expression in dorsolateral prefrontal cortex (DLPFC) from individuals with schizophrenia identified to have high and low expressions of inflammatory markers.
GFAP protein expression-group differences
Comparing the total schizophrenia and control groups, we observed a 7% increase in total levels of GFAP protein, but this was not statistically significant (F(1,67)=0.299, p=0.586, after controlling for age, pH, PMI; Figure 1C). The difference in mean levels of individual GFAP immunopositive protein bands ranged from 5% increased to 15% decreased in people with schizophrenia relative to controls, and there was no statistically significant difference between the two diagnostic groups overall (48 kDa: 13% decrease, F(1,68)=0.229, p=0.634, co-varied for age, pH and PMI; 43 kDa: 2% decrease, F(1,66)=0.031, p=0.861, co-varied for age and RIN; 39 kDa: 5% increase, U=625, p=0.954; or 35 kDa: 15% decrease, F(1,68)=1.747, p=0.191). A high degree of variance in levels of expression of the 43 kDa and the 35 kDa isoforms was evident by visual inspection of films (Figure 1B), but no particular diagnosis-specific pattern emerged upon qualitative analysis. GFAP mRNA transcript levels correlated significantly, but relatively weakly, with the amount of total GFAP immunoreactive protein as determined by Western blotting (Pearson’s r=0.251, p=0.042).
Although the mean total GFAP protein levels were increased by 21% in people with schizophrenia with high expression of inflammatory markers, this was not statistically significant (F(1,31)=0.123, p=0.728, co-varied for age, pH and PMI; Figure 2B). Mean levels of the individual GFAP protein isoforms were numerically higher for people with schizophrenia and controls who also had higher expression of inflammatory markers than those who had normal levels, but these increases were not statistically significant (data not shown).
Astrocyte morphology
For each case, we classified GFAP-positive astrocytes as having a predominantly fibrous, intermediate or hypertrophic morphology (Figure 3A–D). Cases with predominantly fibrous astrocyte morphology had significantly less expression of GFAP mRNA than those with intermediate or hypertrophic astrocyte morphology (Figure 3E). Consistent with this, total, 48 kDa and 43 kDa GFAP protein levels were also reduced in individuals with fibrous astrocyte morphology relative to individuals with hypertrophic morphology (Figure 3E).
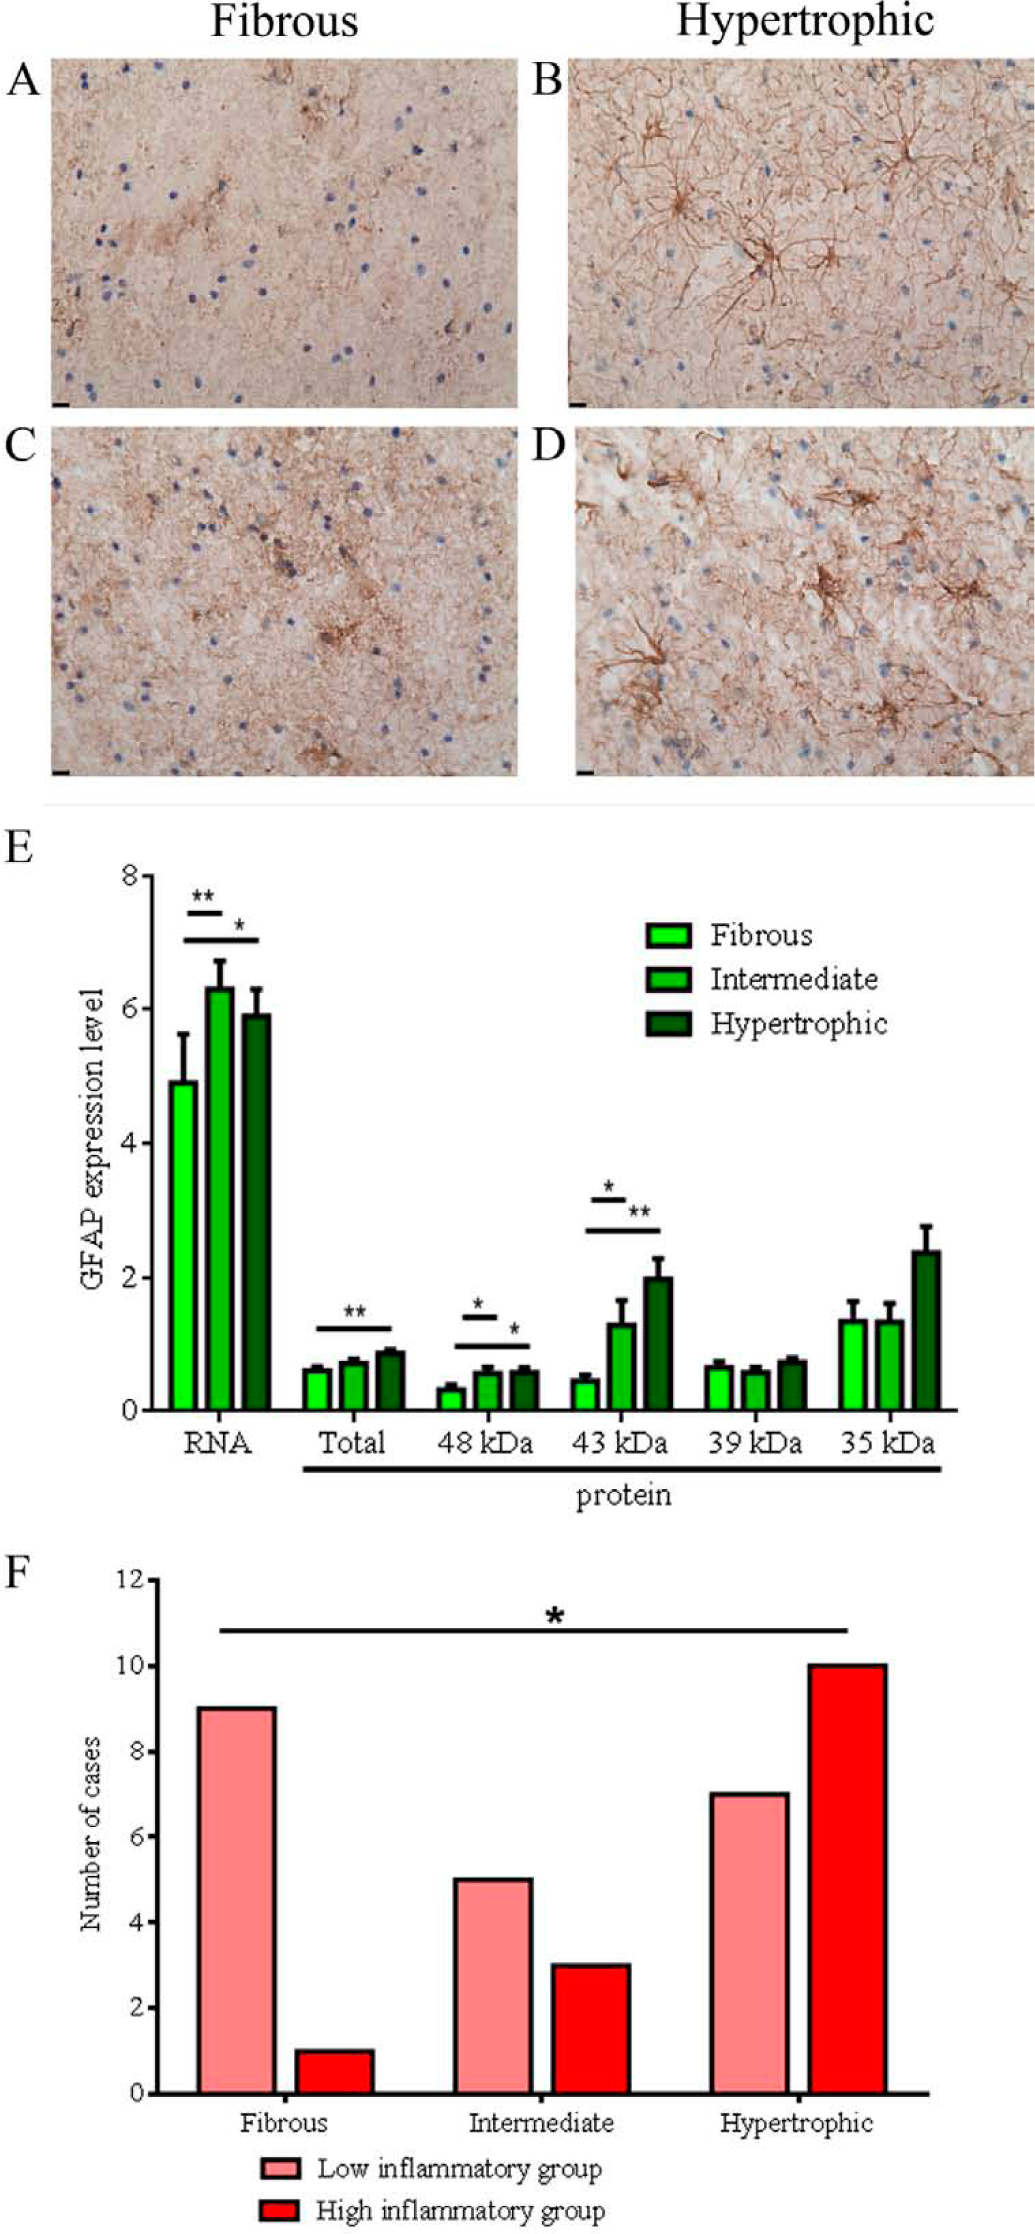
Astrocyte morphology in the white matter of the middle frontal gyrus. Representative images (40× objective, scale bar 10 microns) illustrating the fibrous
The individuals with predominantly fibrous astrocyte morphology were significantly younger (44 years) than those with hypertrophic morphology (55 years: F(2,68)=3.150, p=0.049; Fisher’s least significant difference (LSD) post-hoc test between fibrous and hypertrophic morphology, p=0.015).
Tissue pH was significantly higher in individuals with predominantly fibrous astrocyte morphology (pH 6.82) than in those with hypertrophic morphology (pH 6.48: F(2,68)=10.930, p<0.001; LSD post-hoc test between fibrous and hypertrophic morphology, p<0.001). Consistent with this, RIN was also significantly higher in those individuals with predominantly fibrous astrocyte morphology (average RIN 7.58) compared to those with hypertrophic morphology (RIN 7.06: F(2,68)=5.848, p=0.005; LSD post-hoc test between fibrous and hypertrophic morphology, p=0.001).
Consistent with our other results, there was no obvious diagnostic difference between individuals with schizophrenia and controls in the astrocyte morphology found in the DLPFC (χ2(2)=0.543, p=0.762). However, people with schizophrenia with high expression of inflammatory markers were more likely to have astrocytes with hypertrophic morphology, whereas those people with schizophrenia with low expression of inflammatory markers predominantly had astrocytes with fibrous morphology (χ2(2)=6.281, p=0.043, Cramér’s V=0.424; Figure 3F). Three of the four control individuals with high expression of inflammatory markers also had astrocytes with hypertrophic morphology. These data seem to represent the fact that based on the odds ratio, regardless of diagnostic status, individuals were 4.3 times more likely to have astrocytes with hypertrophic morphology if they had high inflammation than if they had low inflammation.
We found that no patients prescribed atypical antipsychotics over their lifetime had astrocytes with hypertrophic morphology and only one patient prescribed atypical medication had astrocytes of an intermediate morphology. When we tested this distribution using the chi-squared statistic, this was highly significant (χ2(2)=10.900, p=0.004, Cramér’s V=0.566). Patients with predominantly fibrous astrocyte morphology had significantly less expression of GFAP mRNA than those with intermediate or hypertrophic astrocyte morphology (0.5444 versus 0.7333, t(32)=2.361, p=0.024). Consistent with this, total and 39 kDa GFAP protein levels were also reduced in individuals with fibrous astrocyte morphology relative to individuals with hypertrophic morphology (0.4249 versus 0.7435, t(25.922)=3.214, p=0.003), though this effect was not evident for total GFAP protein or the 35 kDa, 43 kDa or 48 kDa GFAP protein bands.
Other molecular markers consistent with increased astrogliosis in a subgroup of patients with schizophrenia
To further support our evidence of astrogliosis in a subgroup of people with schizophrenia expressing high levels of inflammatory markers, we determined if any transcripts in a group of 50 mRNAs which are specifically up-regulated in astrocytes following LPS endotoxin injection in mouse brain (Zamanian et al., 2012) are also changed in this subgroup. We utilized an existing RNA-Seq database for a subset of samples from 20 individuals with schizophrenia and 20 controls (Fillman et al., 2013). Within the high inflammation subgroup (n=8), 12 of the 50 queried transcripts had elevated expression indicative of astrogliosis (Table 2). Three gene transcripts (FBLN5, STEAP4, SERPINA3) survived Hochberg’s correction for multiple comparisons (Hochberg, 1988), with increased gene expression levels ranging between 45% and 1742% (Figure 4).
Elevated expression of astrogliosis-associated mRNA transcripts in the subgroup of individuals with schizophrenia also expressing high levels of inflammatory markers.
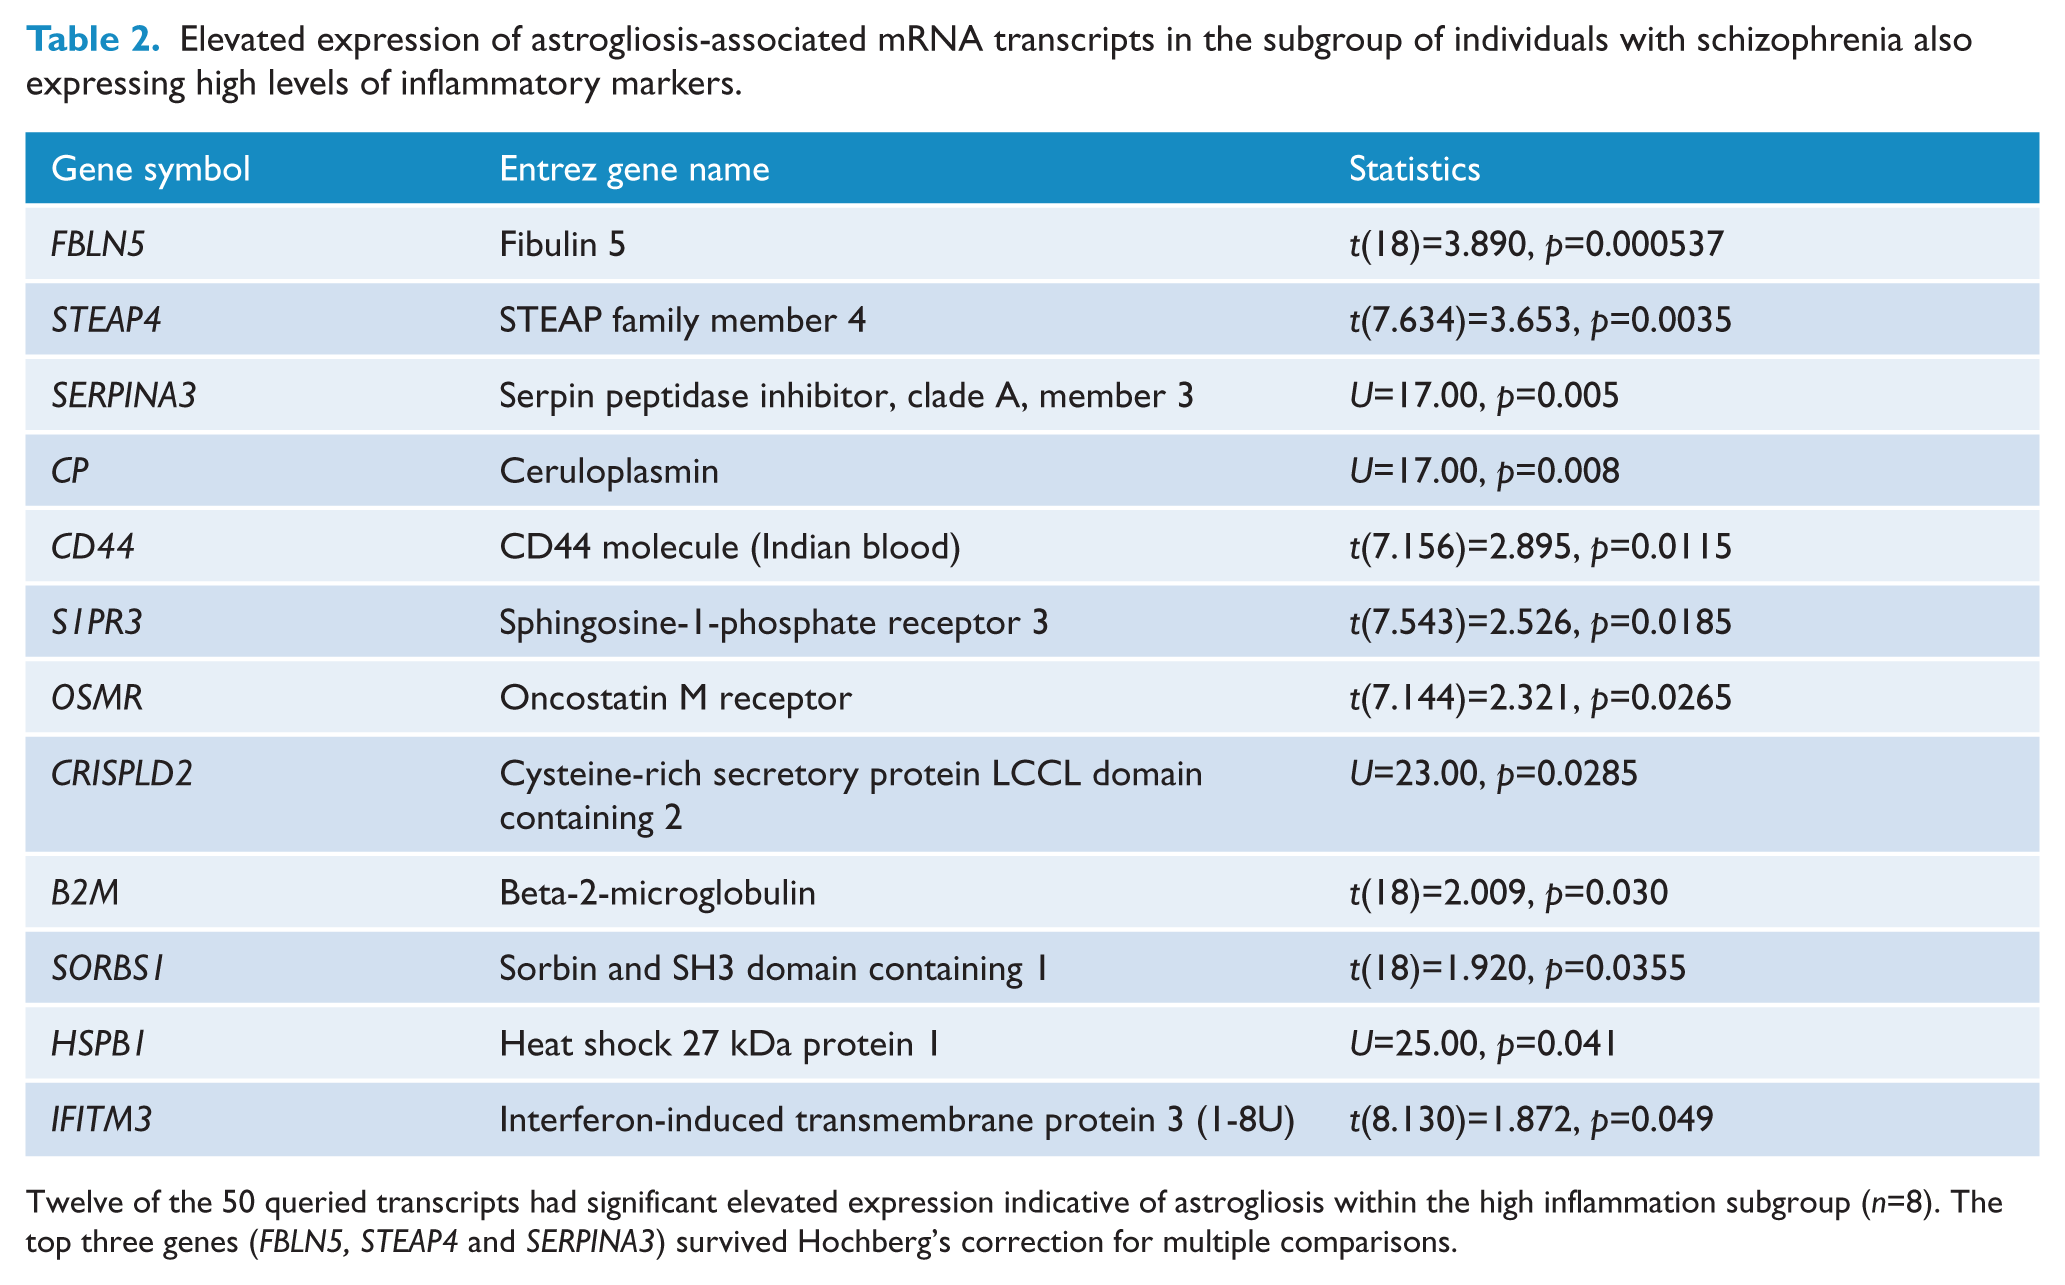
Twelve of the 50 queried transcripts had significant elevated expression indicative of astrogliosis within the high inflammation subgroup (n=8). The top three genes (FBLN5, STEAP4 and SERPINA3) survived Hochberg’s correction for multiple comparisons.
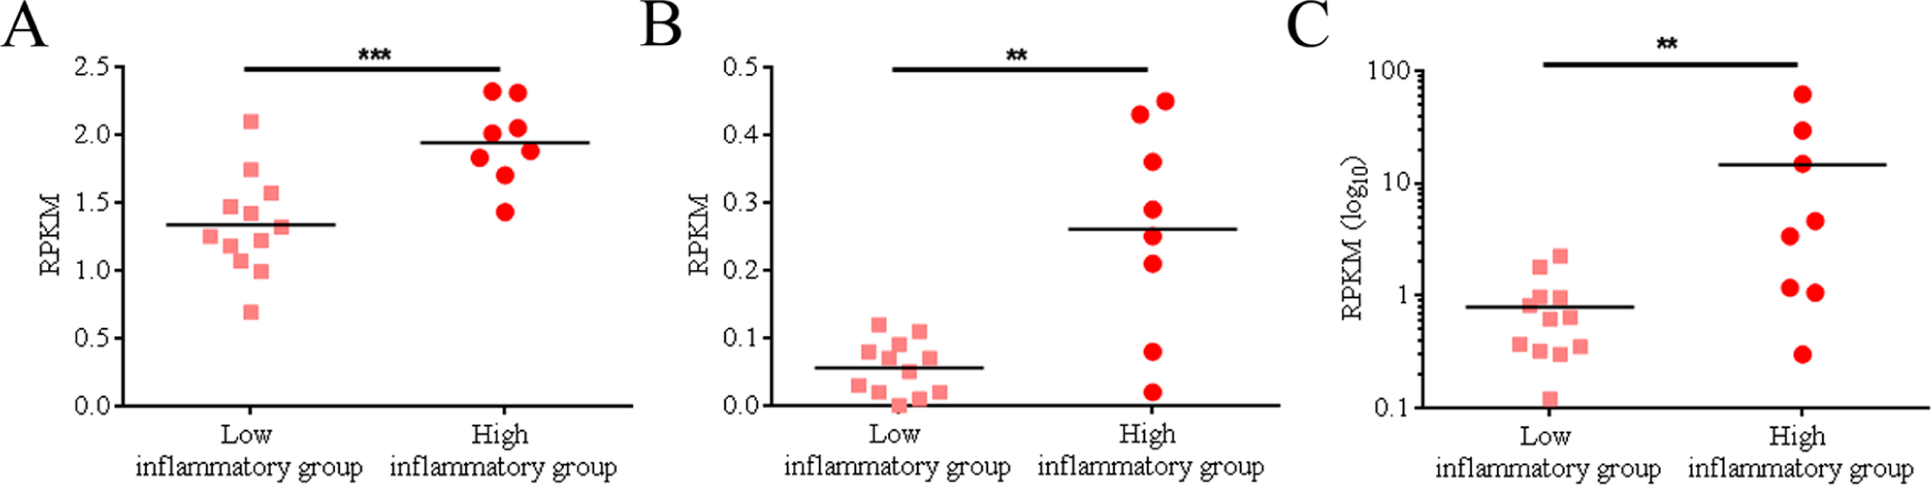
Increased expression of astrogliosis-associated mRNA transcripts in a cluster of individuals with schizophrenia defined by expression of inflammatory markers.
Discussion
We investigated markers of astrogliosis in a cross-sectional study of post-mortem brain tissue with sufficient power to avoid type II errors (Schnieder and Dwork, 2011) and found that compared to the control group there was no statistically significant overall difference in GFAP expression or astrocyte morphology in the schizophrenia group. We used a comprehensive range of measures, mRNA and protein expression of GFAP as well as classification of astrocyte morphology based on GFAP immunostaining. The measures were internally consistent with one another and confirmed previously noted correlations between GFAP expression and age (positive; Nichols et al., 1993) and tissue pH (negative; Feresten et al., 2013; Toro et al., 2006), supporting the internal validity of our study as well as the results of earlier studies.
Importantly, our analysis, stratified by neuroinflammatory subtype, revealed significantly increased GFAP mRNA expression and a more prevalent occurrence of hypertrophic astrocyte morphology in those individuals with schizophrenia who had increased expression of inflammatory markers, similar to what has been found with neuroinflammation in rodents (Spooren et al., 2011). This observation was supported by an exploration of our RNA-Seq expression database, which suggested that other markers of astrogliosis are also increased in the high inflammatory subgroup of patients with schizophrenia.
The fact that inflammation in the CNS of a subgroup of our cohort of people with schizophrenia increased GFAP expression relative to those individuals with schizophrenia who had no evidence of inflammation, but not beyond the maximum observed in the unaffected control group, lead us to speculate that even in the presence of a known gliosis trigger, the astrocytic response in schizophrenia may be less than anticipated from results of studies of non-schizophrenia brains. Interestingly, astrocytic hyperplasia has been observed in a subgroup of elderly individuals with both schizophrenia and dementia, who exhibited increased density of astrocytes in several cortical regions relative to non-demented patients but only about 50% of that observed in a comparison group of subjects with Alzheimer’s disease (Arnold et al., 1996). Similarly, GFAP and Holzer-stained tissue from individuals who had all undergone lobotomy 15–36 years earlier revealed significantly less astroglia in individuals with schizophrenia relative to epileptic and mentally retarded individuals (Niizato et al., 2001). In our study, even the individuals with schizophrenia and ongoing inflammation who had increased expression of GFAP mRNA did not exceed the maximum expression observed in unaffected controls, suggesting their gliotic process is within the limits of what can be found in individuals without schizophrenia. Thus, while we can conclude that glia from at least a subgroup of individuals with schizophrenia may be able to mount an astrocytic response to inflammation or neurodegenerative events, the data suggest that the gliotic reaction in brains from people with schizophrenia is somewhat attenuated relative to that observed in other injured or neurodegenerative conditions.
In support of possible attenuation of astroglial cells in the brains of some people with schizophrenia, is the fact that antipsychotic medications appear to inhibit gliosis. Long-term antipsychotic drug (haloperidol and olanzapine for 17–27 months) exposure in rhesus macaques decreases astrocyte numbers in the parietal lobe (Konopaske et al., 2008), which suggests that the reduced GFAP levels sometimes observed in people with schizophrenia compared to controls (Johnston-Wilson et al., 2000; Steffek et al., 2008; Toro et al., 2006; Webster et al., 2005) could be a confound of antipsychotic medication. In support of this, Arnold and colleagues (1998) observed a significant negative correlation between GFAP expression and last recorded chlorpromazine dose. However, another primate study investigating a broader range of antipsychotic medications over 6 months found increased glial density in the DLPFC (Selemon et al., 1999). It is unclear whether the antipsychotic doses used in the two primate studies were comparable, with one study reporting the plasma drug concentrations (Konopaske et al., 2008) and the other the administered daily dose (Selemon et al., 1999). We and others (Barley et al., 2009; Toro et al., 2006) have observed a positive relationship between GFAP mRNA and protein levels and lifetime antipsychotic medication exposure; however, our analysis suggests that this relationship may be driven by the positive relationships of both GFAP expression and total antipsychotic medication exposure with the age of subjects.
While the experimental primate studies reviewed above are contradictory, animal models where gliosis is actively induced and treated with antipsychotic drugs may be more informative. Administration of the non-competitive N-methyl-
While our study used four different approaches to examine gliosis in schizophrenia, it still has limitations. First, we only examined one brain area and it may be that increased levels of gliosis are more prominent outside of the DLPFC in schizophrenia. This is supported by studies of the brains in the Stanley Medical Research Institute’s neuropathology collection, where investigators have reported increased, decreased or no change in GFAP depending on brain region examined (Barley et al., 2009; Johnston-Wilson et al., 2000; Toro et al., 2006; Webster et al., 2005). Second, while we found significant changes in mRNA expression of GFAP and in astrocyte morphology in the individuals with schizophrenia and high expression of inflammatory markers, this was not reflected by significant changes in GFAP protein as measured by Western blotting. This is possibly attributable to the semi-quantitative nature of Western blotting or because there are no changes in steady-state protein expression, but rather an increase in GFAP turnover, or to differences in the time course of GFAP mRNA and protein changes (Norton et al., 1992). Third, we studied a wide age-range that may have added variance to our measurements, making it more difficult to detect any diagnostic difference. Additionally, evidence of inflammation proximal to the time of death may not in all circumstances result in an astrocytic response, as in some cases this inflammation may have arisen as part of the dying process and the normal physiological response would not have taken place. Nonetheless, in our study we have identified changes in astrocytes that co-occur with neuroinflammation and while these events can be causally linked, there are many other factors that can lead to variation in astrocyte morphology or astrocyte function (stress, exercise, plasticity, etc.) that may also independently or synergistically contribute causally to the changes we observe. We found that GFAP along with other astrocyte ‘state’ molecular markers might be equally or more sensitive to changes (e.g. FBLN5, STEAP4 and SERPINA3 mRNAs, which showed significant average increases in the schizophrenia inflammatory cluster). Increased SERPINA3 expression in schizophrenia has been described previously (Arion et al., 2007; Fillman et al., 2013; Saetre et al., 2007), and SERPINA3 remains relatively highly expressed in astrocytes over the course of 1 week following injury, thus making it a potentially useful marker of persistent reactive gliosis (Zamanian et al., 2012). While the function of the top 12 up-regulated astrogliosis markers (Table 2) is scarcely described in the literature, their known functions suggest they are important for the inflammatory response (S1PR1, OSMR), oxidative stress response (CP, FBLN5, STEAP4) and cell migration (S1PR1, FBLN5). Two of these molecules are also important for the integrity of the blood–brain barrier (IFITM3, S1PR1), and IFITM variants have recently been found up-regulated in schizophrenia patients (Hwang et al., 2013; Siegel et al., 2013). The specificity of some identified markers needs verification as, for example, cluster of differentiation 44 (CD44) has been reported to be expressed on several CNS cell types (Kaaijk et al., 1997).
In conclusion, our study suggests that if there are gliotic changes in astrocytes in schizophrenia, as may be expected by an ongoing neurodegenerative condition with cortical volume loss over time (Collin et al., 2012), these astrocytic reactions may be either short-lived or may be blocked in many people with schizophrenia. The latter is supported by our observation that astrocytes from people with schizophrenia fail to mount a large-scale gliotic response to increased inflammatory markers, but rather mount a significant but modest increase in astrogliotic indices. It remains unclear whether astrogliosis is beneficial or harmful, as reactive astrocytes serve to encapsulate and isolate infections from surrounding healthy brain tissue and help seal a damaged blood–brain barrier, but at the same time also inhibit axon regeneration and synaptogenesis, impairing the brain’s ability to repair damage (Middeldorp and Hol, 2011; Norton et al., 1992). The absence of evidence for gliosis in schizophrenia has been one of the major foundations of the neurodevelopmental disorder theory regarding the cause of schizophrenia, and is also used to argue that the timing of the lesion is in the prenatal period (Weinberger, 1987). However, astrogliosis may be more integral to schizophrenia pathology than recent theories suggest, and we conclude that the neurodevelopmental theory of schizophrenia does not wholly account for the disease course and that there may be a degenerative component to schizophrenia in a substantial subset of cases.
Footnotes
Acknowledgements
We thank Shan-Yuan Tsai and Katherine M Allen for excellent technical assistance in the laboratory.
Funding
This work was supported by the Schizophrenia Research Institute (utilizing infrastructure funding from the Macquarie Group Foundation and the New South Wales Ministry of Health), Neuroscience Research Australia, and the University of New South Wales. Tissues were received from the New South Wales Tissue Resource Centre at the University of Sydney, which is supported by the National Health and Medical Research Council (NHMRC) of Australia, the Schizophrenia Research Institute, and the National Institute of Alcohol Abuse and Alcoholism (NIH (NIAAA) R24AA012725). JW was supported by a NHMRC Postdoctoral Training Fellowship (#568884). CSW is a recipient of a NHMRC Senior Research Fellowship (#1021970).
Declaration of interest
The authors report no conflicts of interest. The authors alone are responsible for the content and writing of the paper.
References
Supplementary Material
Please find the following supplemental material available below.
For Open Access articles published under a Creative Commons License, all supplemental material carries the same license as the article it is associated with.
For non-Open Access articles published, all supplemental material carries a non-exclusive license, and permission requests for re-use of supplemental material or any part of supplemental material shall be sent directly to the copyright owner as specified in the copyright notice associated with the article.