
Abstract
Background
Lysophosphatidylethanolamines (lyso-PEs) are the partial hydrolysis products of phosphatidylethanolamine. Although lyso-PEs are important biomarkers in various diseases, their determination is limited by the lack of simple and efficient quantification methods. This study aims to develop an improved quantitative method for the determination of lyso-PEs and its application to an epidemiological study.
Methods
Single reaction monitoring channels by collision-induced dissociation for seven lyso-PEs were established using liquid chromatography-tandem mass spectrometry. Plasma lyso-PEs were extracted with a single-phase method using an isotopically labelled internal standard for quantification. The proposed method was adopted to define lyso-PEs in plasma samples of children aged 9–12 years living in Sapporo, Japan.
Results
The limit of detection and limit of quantification for each lyso-PE ranged between 0.001–0.015 and 0.002–0.031 pmol/μL, respectively. Recoveries were found to be > 91% for all the species. The analysis results of children’s plasma showed that the total lyso-PE concentrations in boys (n = 181) and girls (n = 161) were 11.53 and 11.00 pmol/μL (median), respectively. Participants were further classified by the percentage of overweight and subgrouped as underweight (n = 12), normal range (n = 292), or overweight (n = 38). Interestingly, the reduction of lyso-PE 16:0 and increased lyso-PE 22:6 were observed in overweight children compared with normal range (Fold change: 0.909 and 1.174, respectively).
Conclusions
This study successfully established a simple quantitative method to determine lyso-PE concentrations. Furthermore, our method revealed the possible relation between plasma lyso-PEs and overweight status.
Keywords
Introduction
Lysophospholipids (lyso-PLs) are partially deacylated products of phospholipids produced by phospholipases A1 and A2. 1 There are several types of lyso-PLs, such as lysophosphatidic acid, lysophosphatidylcholine (lyso-PC), lysophosphatidylethanolamine (lyso-PE), lysophosphatidylglycerol, lysophosphatidylinositol, and lysophosphatidylserine based on their head groups.2,3 Lyso-PLs are widely distributed in the human body and mediate various physiological functions, including cell signaling, proliferation, and migration.4,5 Lyso-PE is the predominant type of lyso-PL following lyso-PC. 6 Lyso-PE has been reported to have bioactivities, such as stimulation of intracellular Ca2+ concentrations, 7 neurite outgrowth stimulation, 8 activation of mitogen-activated protein kinase signaling, 9 and anti-inflammatory effects by inhibiting M1 macrophage polarization.10,11 Moreover, our previous study suggested that lyso-PE was associated with metabolic dysfunction in the liver. 12 There are several reports on the relation between lyso-PEs and various diseases. Lyso-PE concentrations were decreased in the serum of patients with non-alcoholic fatty liver disease (NAFLD) and non-alcoholic steatohepatitis (NASH) than in healthy individuals.13,14 In addition, several lyso-PE species were decreased and increased in the serum of patients with type 2 diabetes (T2D).15,16 Lyso-PLs, such as lyso-PC and lyso-PE, seem to be associated with glucose-mediated insulin secretion in diabetes targeting tissues. 17 Higher concentrations of these lyso-PLs may induce insulin resistance and islet dysfunction. 18 The relation between the alternation of lyso-PEs and diseases has been controversial. However, these findings suggest that lyso-PE is a potential biomarker for lifestyle-related diseases.
To date, semi-quantitative methods have been used for the quantification of lyso-PEs owing to the lack of authentic standards.19,20 In a previous study, we developed an absolute quantitative method for the determination of lyso-PE species using liquid chromatography-tandem mass spectrometry (LC-MS/MS), enabling the detection of small amounts of lyso-PE species in clinical samples. 14 However, this method is time-consuming for largescale studies due to its complex extraction process, and the odd-chain internal standard used for quantification may overlap with endogenous species. Herein, we developed an improved quantitative method for seven major lyso-PE species (lyso-PE 16:0, 18:0, 18:1, 18:2, 20:4, 20:5, and 22:6) using LC-MS/MS with modifications to our previous method. 14 The isotopically labelled internal standard, lyso-PE 18:1 (d7), was used for quantification.
Dysregulated lipid metabolism in childhood obesity is known to cause various lifestyle-related diseases, such as T2D and NAFLD.21–23 The prevention and treatment of childhood obesity are essential for reducing the risk of various diseases in adults. This requires a whole-system approach based on the mechanisms underlying childhood obesity development. 24 Moreover, its elucidation needs to reveal the lipid profiles in healthy pediatric plasma. However, the absolute concentrations of lipids, such as lyso-PE, in pediatric plasma have not been explored. Hence, after validation, the proposed method was applied to plasma samples from healthy preadolescent children living in Sapporo, Hokkaido, Japan.
Material and methods
Materials
LC-MS-grade methanol (MeOH) and acetonitrile were purchased from Kanto Chemical Co. Inc. (Tokyo, Japan). LC-MS-grade isopropanol and CHCl3 were purchased from FUJIFILM Wako Pure Chemical Corporation (Osaka, Japan) and Nacalai Tesque Inc. (Kyoto, Japan), respectively. Ammonium acetate (1 mol/L solution) and ethylenediaminetetraacetic acid were obtained from Sigma-Aldrich (St. Louis, MO, USA). 2,6-di-tert-butyl-p-cresol was purchased from Tokyo Chemical Industry Co., Ltd. (Tokyo, Japan). Deuterated lyso-PE (lyso-PE 18:1[d7]), used as the internal standard, was purchased from Avanti Polar Lipids, Inc. (AL, USA). The lyso-PE standards analyzed in this study included 1-palmitoyl-2-hydroxy-sn-glycero-3-phosphoethanolamine (lyso-PE 16:0), 1-stearoyl-2-hydroxy-sn-glycero-3-phosphoethanolamine (lyso-PE 18:0), 1-oleoyl-2-hydroxy-sn-glycero-3-phosphoethanolamine (lyso-PE 18:1), 1-linoleoyl-2-hydroxy-sn-glycero-3-phosphoethanolamine (lyso-PE 18:2), 1-arachidonyl-2-hydroxy-sn-glycero-3-phosphoethanolamine (lyso-PE 20:4), 1-eicosapentaenoyl-2-hydroxy-sn-glycero-3-phosphoethanolamine (lyso-PE 20:5), and 1-docosahexaenoyl-2-hydroxy-sn-glycero-3-phosphoethanolamine (lyso-PE 22:6). Lyso-PE 16:0, 18:0, and 18:1 were purchased from Avanti Polar Lipids, Inc. (AL, USA), while other lyso-PE species were synthesized in-house. 14
Lyso-PE extraction
150 μL of MeOH and 50 μL of internal standard (lyso-PE 18:1[d7], 0.42 μmol/L) in MeOH were added to 10 μL of plasma in a 1.5 mL Eppendorf. Subsequently, 100 μL of CHCl3 and 20 μL of Milli-Q (ultrapure) were added to the mixture and vortexed at 3,500 r/min for 10 min (MSV-3500, Funakoshi Co., Ltd., Tokyo, Japan). After centrifugation at 15,000 r/min at 4°C for 10 min (Tabletop Micro Refrigerated Centrifuge Model 3520, KUBOTA Co., Ltd., Tokyo, Japan), the single-phase centrifuge was transferred to a new vial and evaporated under vacuum at 4°C with a centrifugal concentrator (CVE-3000, EYELA Co., Ltd., Tokyo, Japan). The dried lipid extracts were redissolved in 100 μL of MeOH and vortexed for 1 min. Following that, the extracts were centrifuged at 15,000 r/min at 4°C for 10 min to remove any insoluble compounds and then transferred to LC-MS vials. All MeOH used for the extraction contained 0.001% 2,6-di-tert-butyl-p-cresol to prevent lipid oxidation.
Analysis of lyso-PE species by targeted LC-MS/MS
The LC-MS/MS analysis was performed using a modified version of our previously described method. 14 Single reaction monitoring channels by collision-induced dissociation for each lyso-PE species were established using a TSQ Quantum Access mass spectrometer (Thermo Fisher Scientific, Inc., Waltham, MA, USA) in the electrospray ionization negative ion mode. The optimized ion source parameters were set as follows: spray voltage: 3,000 V; vaporizer temperature: 300°C; capillary temperature: 200°C; sheath gas (nitrogen) pressure: 30 psi; ion sweep gas (nitrogen) pressure: 4 psi; and auxiliary gas (nitrogen) pressure: 35 psi. The single reaction monitoring channels obtained for each lyso-PE species are presented in Supplemental Information Table S1.
The high-performance liquid chromatography system (Shimadzu, Kyoto, Japan) with a Hypersil GOLD column (50 × 2.1 mm, 5.0 μm, Thermo Fisher Scientific Inc., MA, USA) was used for lyso-PE separation. The oven temperature was maintained at 45°C, and the sample tray was kept at 4°C. Briefly, 5 μL of the sample was injected into the equipment. Chromatographic separation was performed using a mobile phase consisting of 60% Milli-Q, 20% MeOH, and 20% acetonitrile with 5 mmol/L aqueous ammonium acetate containing 500 nmol/L EDTA (A), and isopropanol (B). The gradient at a flow rate of 0.4 mL/min was set as follows: 0–1 min (80% A, 20% B); 1–3 min (gradually changed to 40% A, 60% B); 3–5 min (40% A, 60% B); 5–6 min (gradually changed to 0% A, 100% B); 6–7 min (0% A, 100% B); and 7–10 min (80% A, 20% B).
Method validation
To evaluate the linearity of this method, a series of diluted lyso-PE standard solutions were prepared at final concentrations of 0.001, 0.002, 0.004, 0.007, 0.015, 0.031, 0.063, 0.125, 0.25, 0.5, 1, and 2 pmol/μL with a constant amount of internal standard (lyso-PE 18:1[d7]; final concentration: 0.21 μmol/L). The limits of detection (LOD) and limits of quantification (LOQ) were evaluated at signal-to-noise ratios of 3 and 10, respectively. The recovery and matrix effect of the method were confirmed by spiking the known concentration of lyso-PE standards (Low: 0.5 pmol/μL; Medium: 1.0 pmol/μL; High: 2.0 pmol/μL) into 10 μL human plasma (n = 6 replicates). Recovery was calculated as the ratio of the area of (spiked sample) to the area of (spiked extract). The matrix effect was calculated as the ratio of the area of (spiked extract) to the area of (standard).
Field validation
Plasma samples from non-fasting individuals were provided by the participants of the Hokkaido Study on Environment and Children’s Health, the Hokkaido Cohort25–28 and stored at −80°C. Selection of the participants to collect samples was written elsewhere.29,30 The participants were healthy preadolescent children aged 9–12 years (n = 342 volunteers, boys = 181, girls = 161) living in Sapporo City in Hokkaido, Japan. The height and weight of the children were measured at pediatric clinics on the same day of blood collection. The research objectives and methods were explained to the participants, and written informed consent was obtained from all parents, as well as an informed accent from all children.
GraphPad Prism 8.0.1 (GraphPad Software Inc., La Jolla, CA, USA) was used as the software for all statistical analysis. Nonparametric Mann–Whitney U-test was used for the comprehensive analysis of lyso-PE concentration between boys and girls. For comparison involving three or more groups, the nonparametric Kruskal–Wallis test was used. Statistical significance was set at P < 0.05. The results of lyso-PE concentrations were expressed as median (interquartile range).
Definitions
Body mass index (BMI) was calculated as weight (kg)/height squared (m2). Under BMI, underweight, normal range, and overweight were defined (according to the cut-off points) as less than 18.5 kg/m2, 18.5–25.0 kg/m2, and more than 25.0 kg/m2, respectively. 31 Percentage of overweight (POW) is based on age- and sex-specific standard body weight for height and is used to define childhood obesity in Japan. 32 POW was calculated as [measured weight (kg) – standard weight (kg)/standard weight (kg)] × 100. 33 According to POW, children with POW < −20% and children with POW ≧ +20% were classified as underweight and overweight, respectively. Children with POW between these cutoff points were classified as a normal range.33,34 In this study, obesity was included in overweight.
Results
Method validation (linearity, sensitivity, separation, and extraction of lyso-PEs)
Under optimized conditions, the linearity, LOD, and LOQ of each lyso-PE species were evaluated (Supplemental Information Table S2). For all lyso-PE standards, the R2 was > 0.9936, indicating good linearity. The LOD and LOQ for lyso-PEs ranged from 0.001 to 0.015 pmol/μL and 0.002 to 0.031 pmol/μL, respectively.
Lyso-PEs in plasma samples were extracted using a single-phase extraction method, as shown in Figure 1(a). Separation of the lyso-PE species was achieved in approximately 4 min under optimized conditions. Symmetrical peaks were obtained for each lyso-PE species in both standard and plasma samples (Figure 1(b)). All lyso-PE standards were spiked into the plasma, and the recovery, matrix effects, and reproducibility were evaluated (Supplemental Information Table S3). The recoveries of all lyso-PE species ranged from 91.2% to 120.3%, with coefficients of variation (CVs) within 10%, except for lyso-PE 20:5 (approximately 16.9%). The matrix effect for all lyso-PE species ranged from 61.6% to 96.5%, with CVs within 15%. The CVs of intraday and interday assays for most lyso-PE species at different concentrations were within 15%. Workflow of the proposed method from sample preparations to liquid chromatography-tandem mass spectrometry analysis. (a) Lipid extraction by single-phase method. (b) Single reaction monitoring chromatograms of internal standard (IS) and lysophosphatidylethanolamine (lyso-PE) standards in a standard and plasma sample.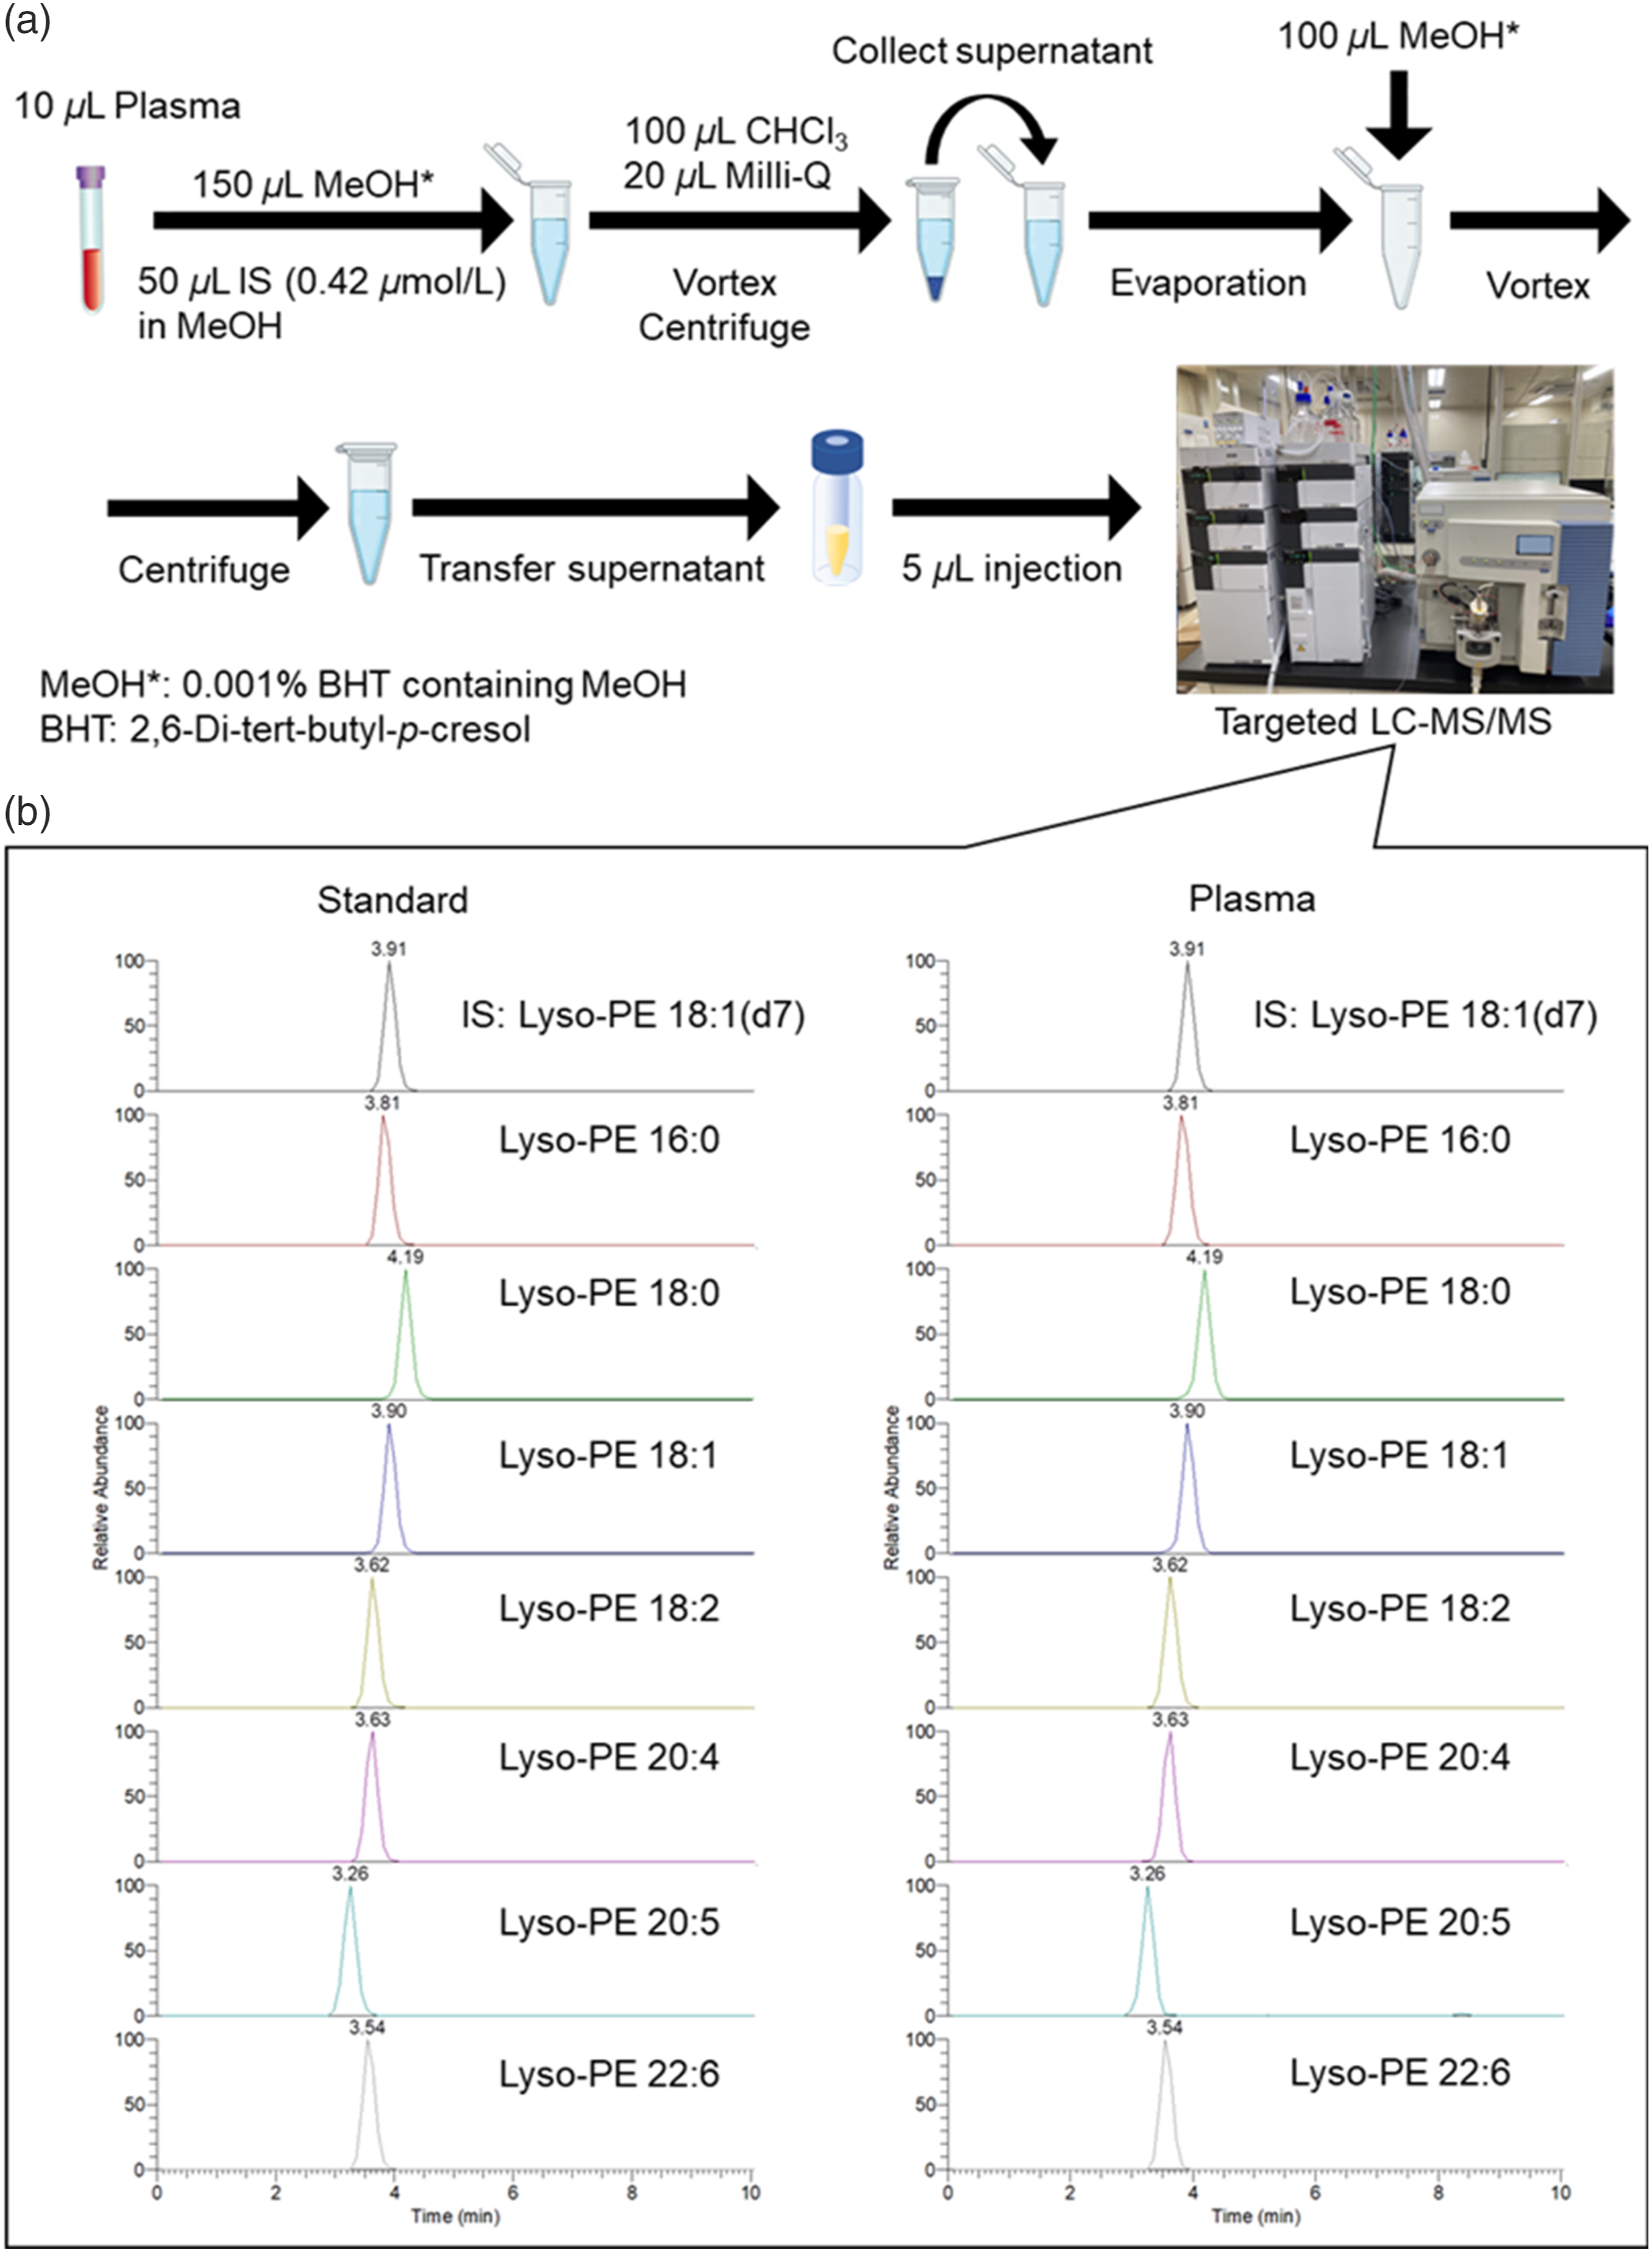
Determination of plasma lyso-PE concentrations in preadolescent children
Characteristics of participants.
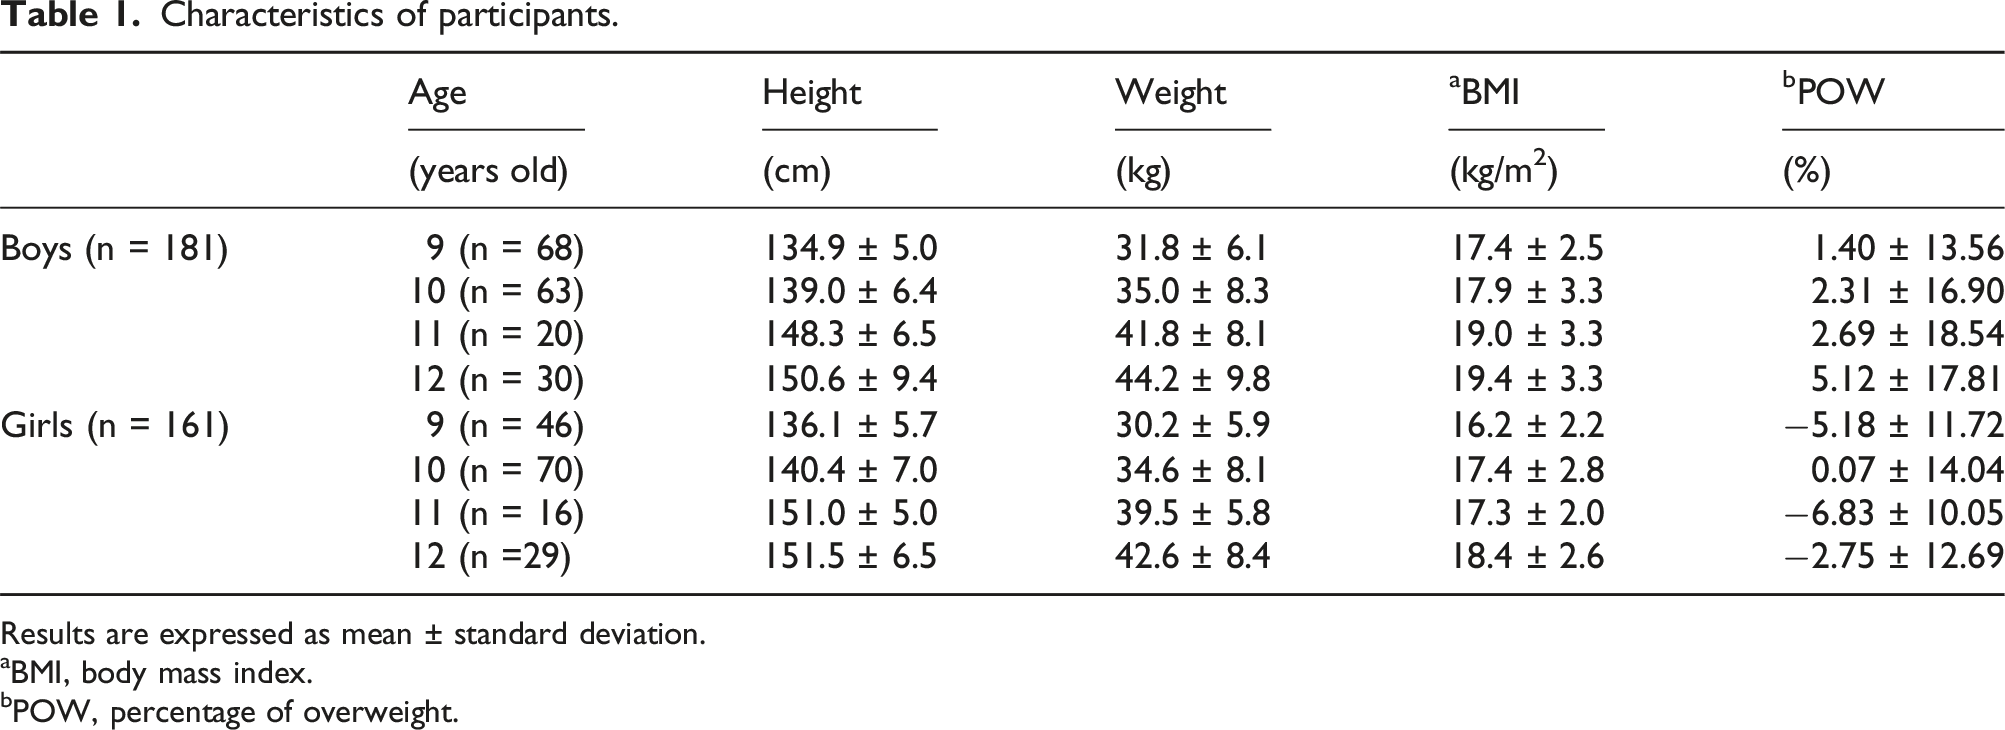
Results are expressed as mean ± standard deviation.
aBMI, body mass index.
bPOW, percentage of overweight.
The Number of Children Categorized by BMI and POW.
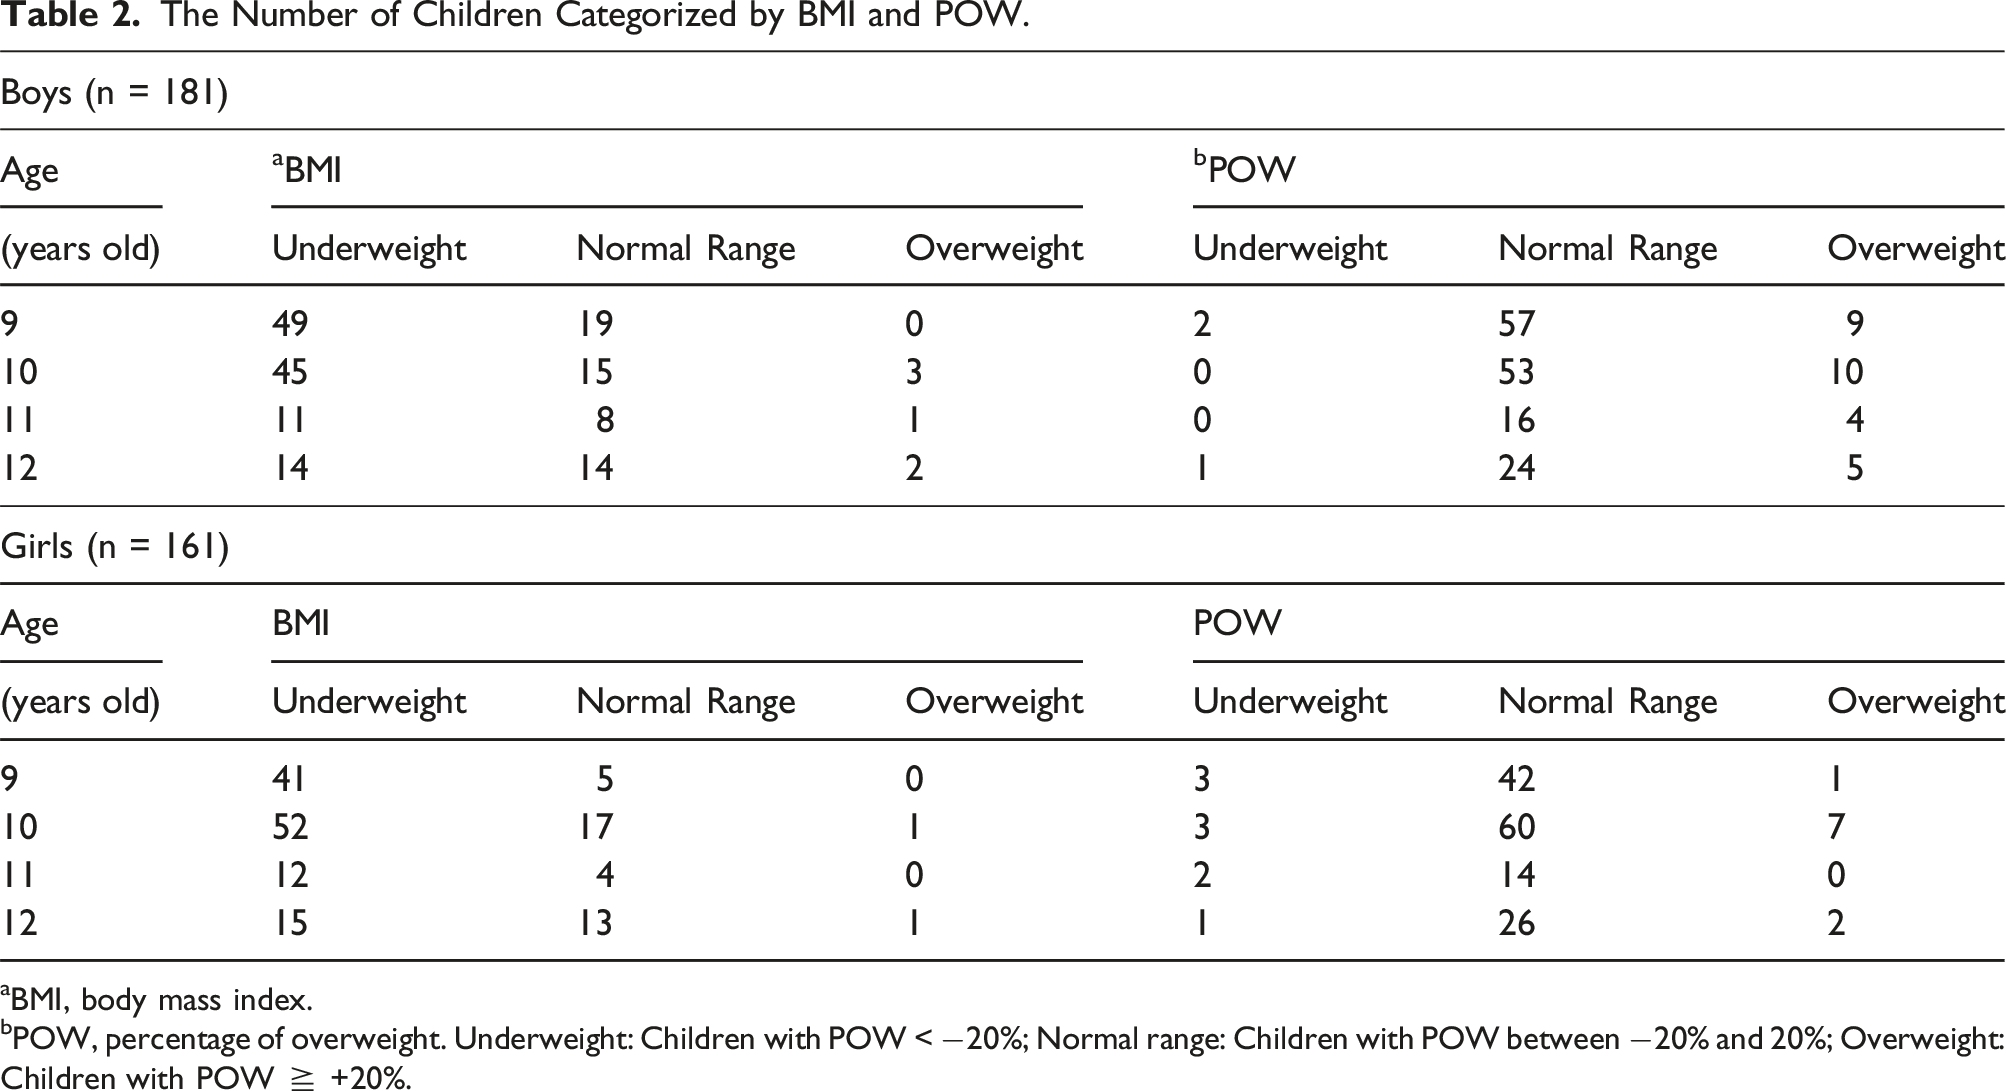
aBMI, body mass index.
bPOW, percentage of overweight. Underweight: Children with POW < −20%; Normal range: Children with POW between −20% and 20%; Overweight: Children with POW ≧ +20%.
Comparison of Lyso-PE Concentrations Between Boys and Girls.
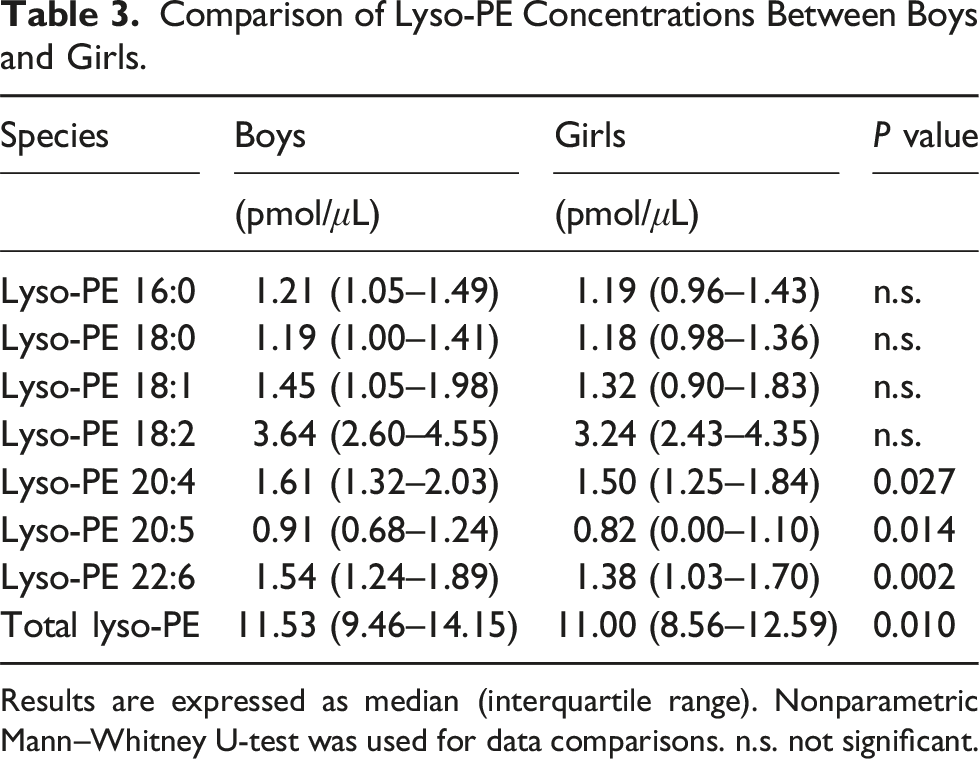
Results are expressed as median (interquartile range). Nonparametric Mann–Whitney U-test was used for data comparisons. n.s. not significant.
Differences in lyso-PE concentrations according to age were also evaluated (Figure 2). The total lyso-PE concentrations in all children of each age (9, 10, 11, 12 years old) were 11.05 (8.60–13.48) pmol/μL, 11.69 (9.38–13.32) pmol/μL, 11.59 (9.88–13.75) pmol/μL, and 10.47 (8.40–13.15) pmol/μL, respectively. Results are expressed as median (interquartile range). There were no significant differences in the concentrations of any of the lyso-PE species according to age. Box plots of each lysophosphatidylethanolamine concentration in the plasma of preadolescent children aged from 9 to 12 years old. n.s., not significant; Lyso-PE, Lysophosphatidylethanolamine.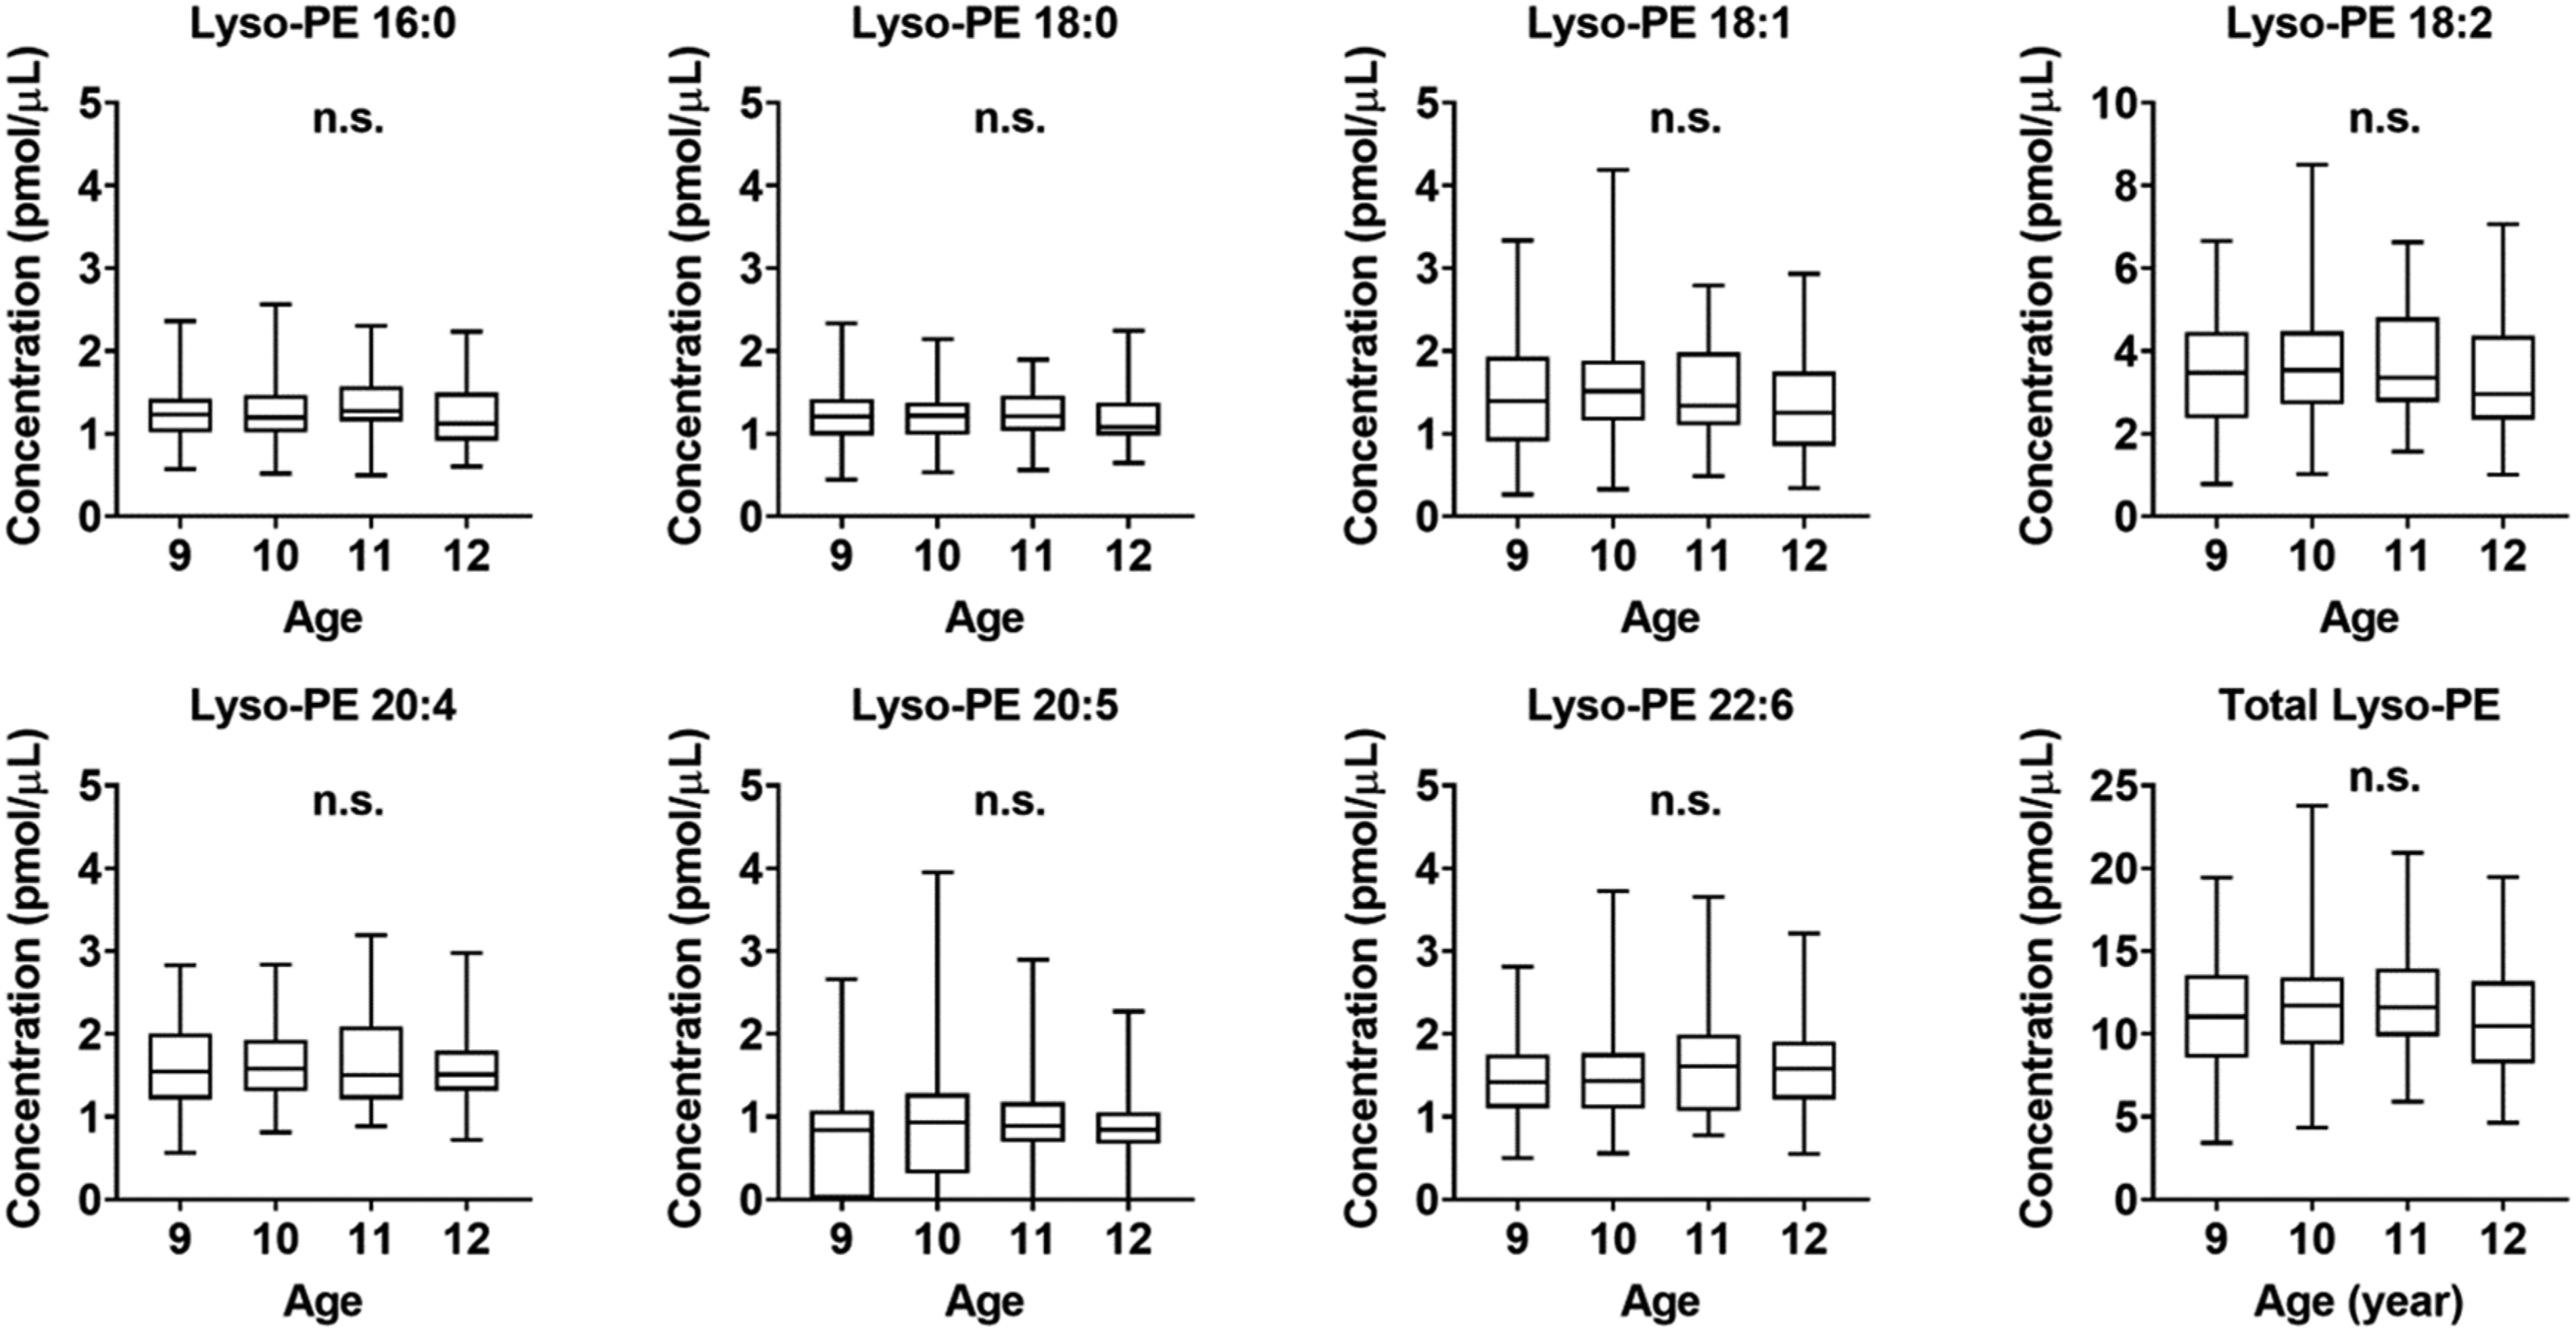
The relative abundance of lyso-PE species in plasma samples from children was confirmed (Figure 3). Lyso-PE 18:2 was the most abundant species in plasma samples from children. Lyso-PE 18:2 accounted for 30.1 ± 5.5%, followed by lyso-PE 20:4 of 14.5 ± 2.9%, lyso-PE 22:6 of 13.6 ± 3.7%, lyso-PE 18:1 of 12.5 ± 2.9%, lyso-PE 16:0 of 11.3 ± 2.2%, lyso-PE 18:0 of 10.9 ± 2.1%, and lyso-PE 20:5 of 7.2 ± 5.3% (mean ± standard deviation). Relative abundance of lysophosphatidylethanolamine species in plasma samples of preadolescent children (n = 342). Lyso-PE, Lysophosphatidylethanolamine.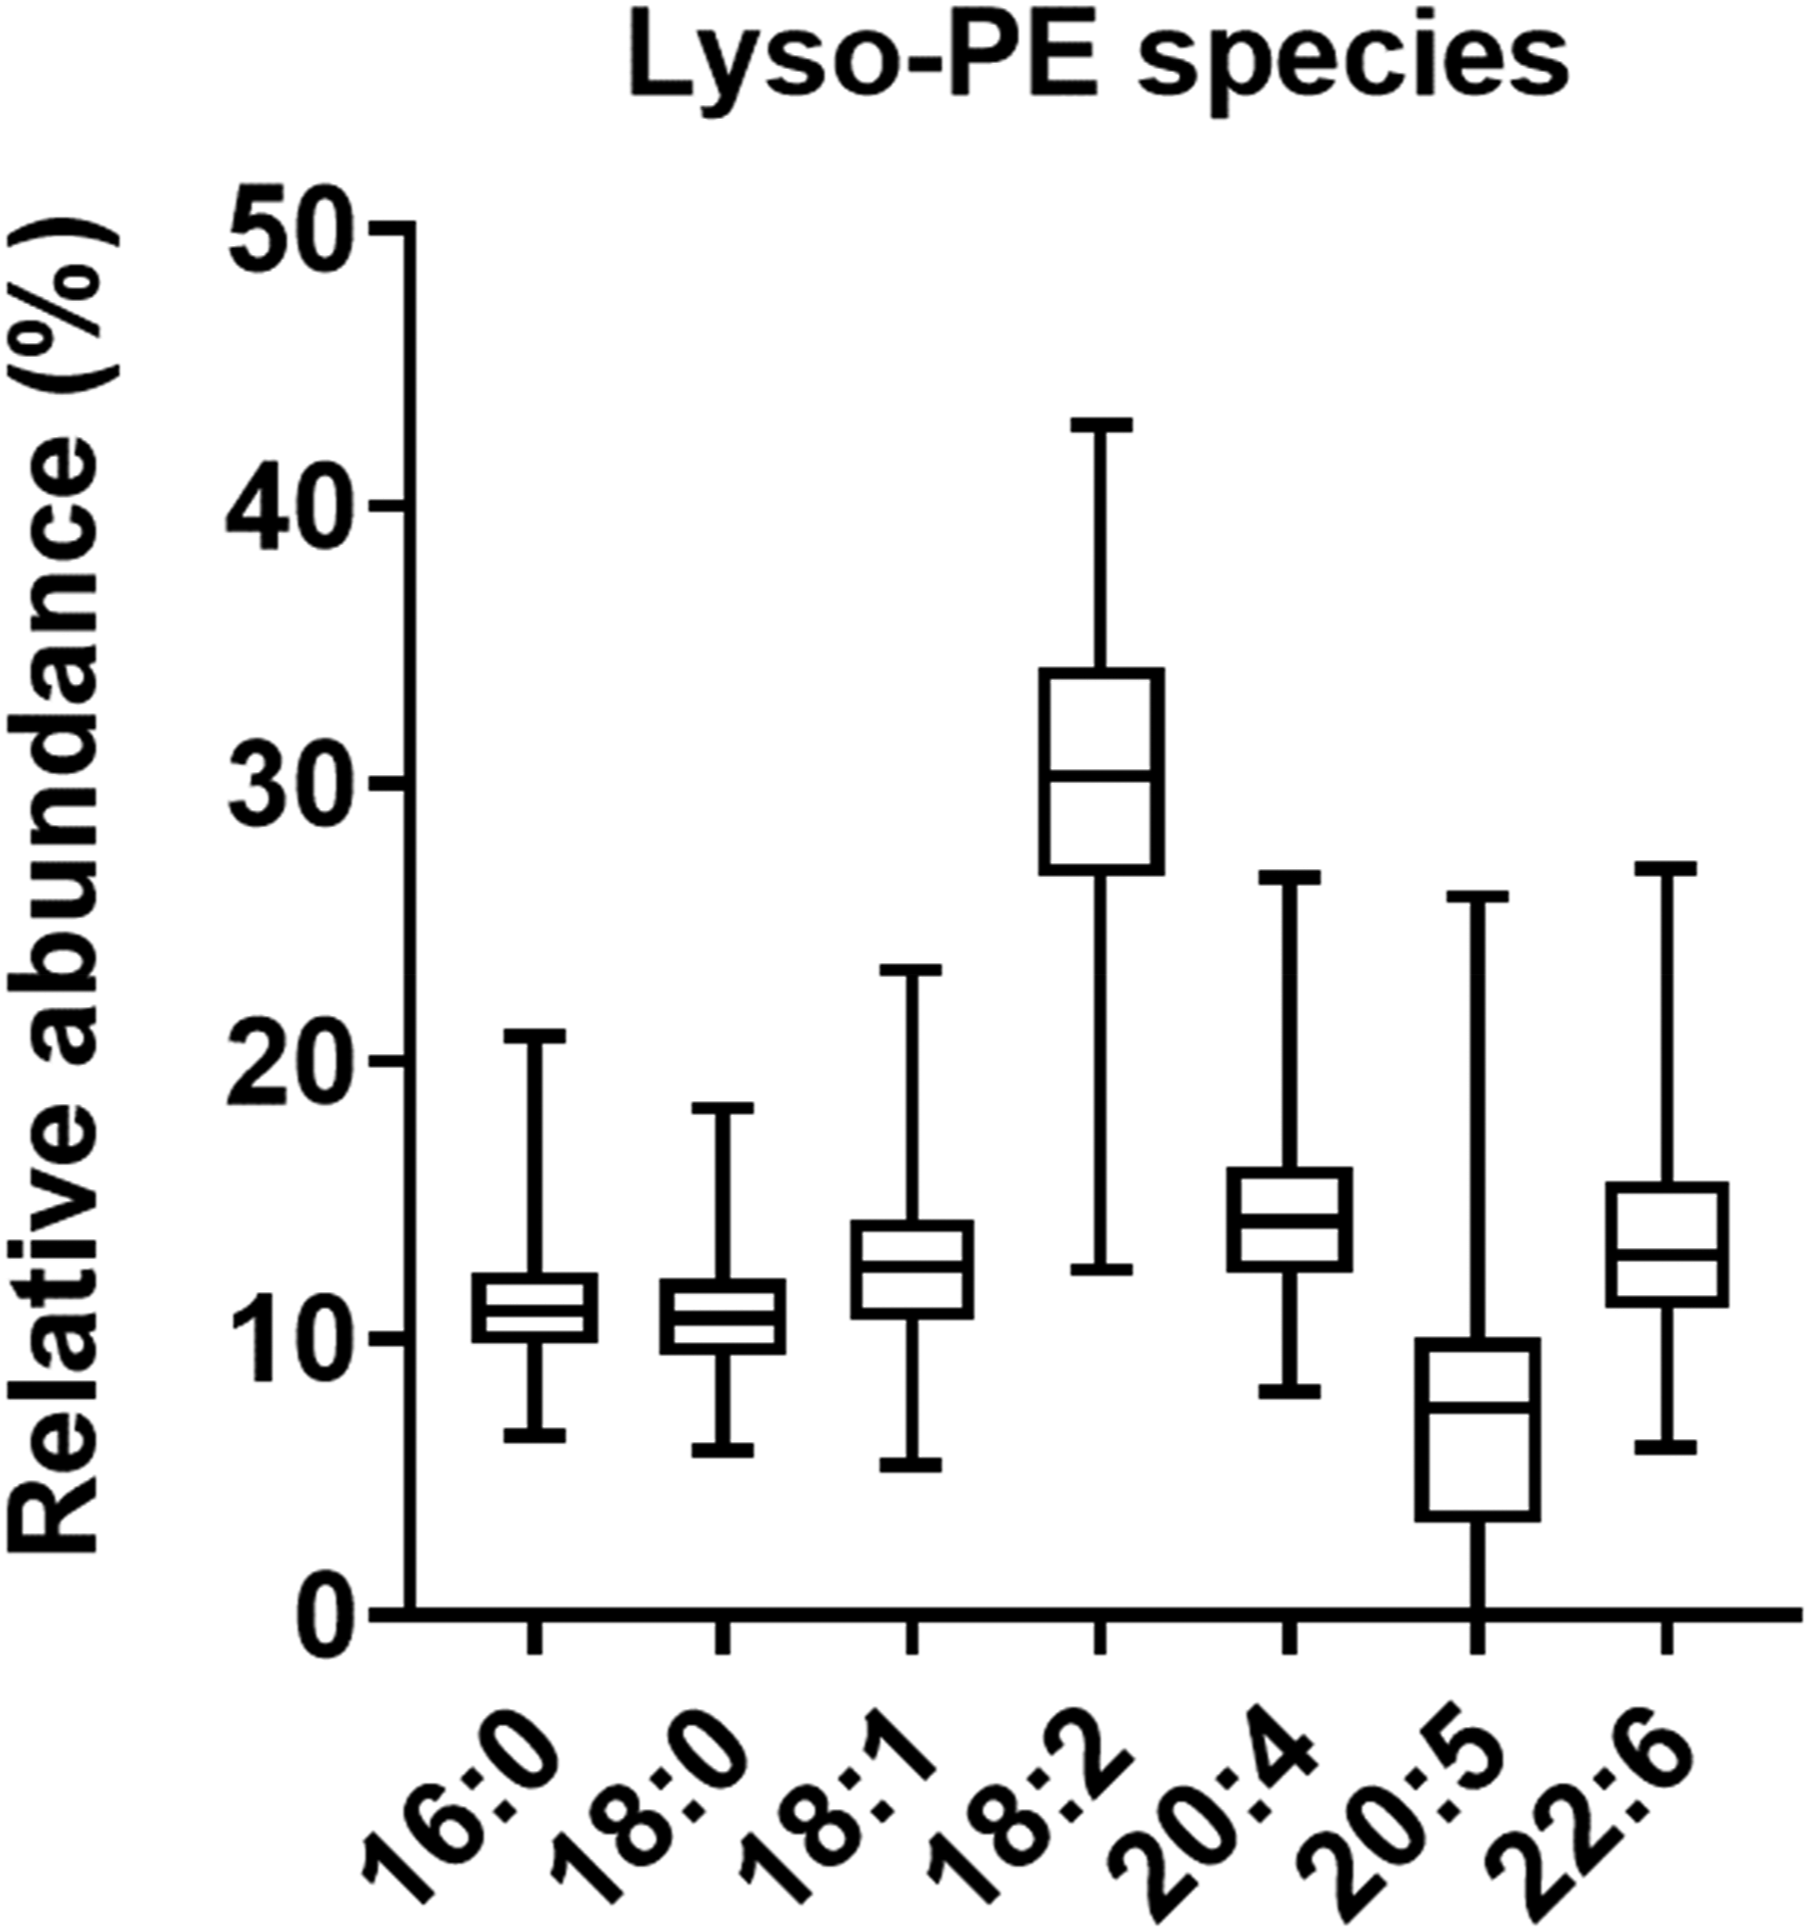
To explore the relation between plasma lyso-PE concentrations and childhood obesity, the differences in lyso-PE concentrations among the subgroups (underweight, normal range, and overweight) according to POW were confirmed. The total lyso-PE concentration in the plasma samples was found to be 11.26 (9.44–13.27) pmol/μL in underweight, 11.30 (8.97–13.67) pmol/μL in normal range, and 10.69 (8.29–12.71) pmol/μL in overweight children (Figure 4). There were no significant differences in almost all lyso-PE concentrations, including total lyso-PE concentrations, among the groups. In addition, no significant correlation was observed between lyso-PE concentrations and POW (data not shown). However, the plasma lyso-PE 16:0 concentrations were significantly lower in overweight children than in normal range children (P = 0.048). The concentrations of lyso-PE 16:0 in underweight, normal range, and overweight children were 1.40 (1.07–1.62) pmol/μL, 1.22 (1.02–1.48) pmol/μL, and 1.11 (0.90–1.30) pmol/μL, respectively. Moreover, lyso-PE 22:6 was increased in overweight children compared with normal range children (P = 0.034). The concentration of lyso-PE 22:6 in underweight, normal range, and overweight children were 1.60 (1.09–1.69) pmol/μL, 1.45 (1.12–1.78) pmol/μL, and 1.70 (1.33–1.92) pmol/μL, respectively. Box plots of each lysophosphatidylethanolamine concentration in the plasma of preadolescent children according to percentage of overweight (POW). Underweight: Children with POW < −20%; Normal range: Children with POW between −20% and 20%; Overweight: Children with POW ≧ +20%. Nonparametric Kruskal–Wallis test with Dunn’s multiple comparisons test, *P < 0.05, n.s. not significant. Lyso-PE, Lysophosphatidylethanolamine.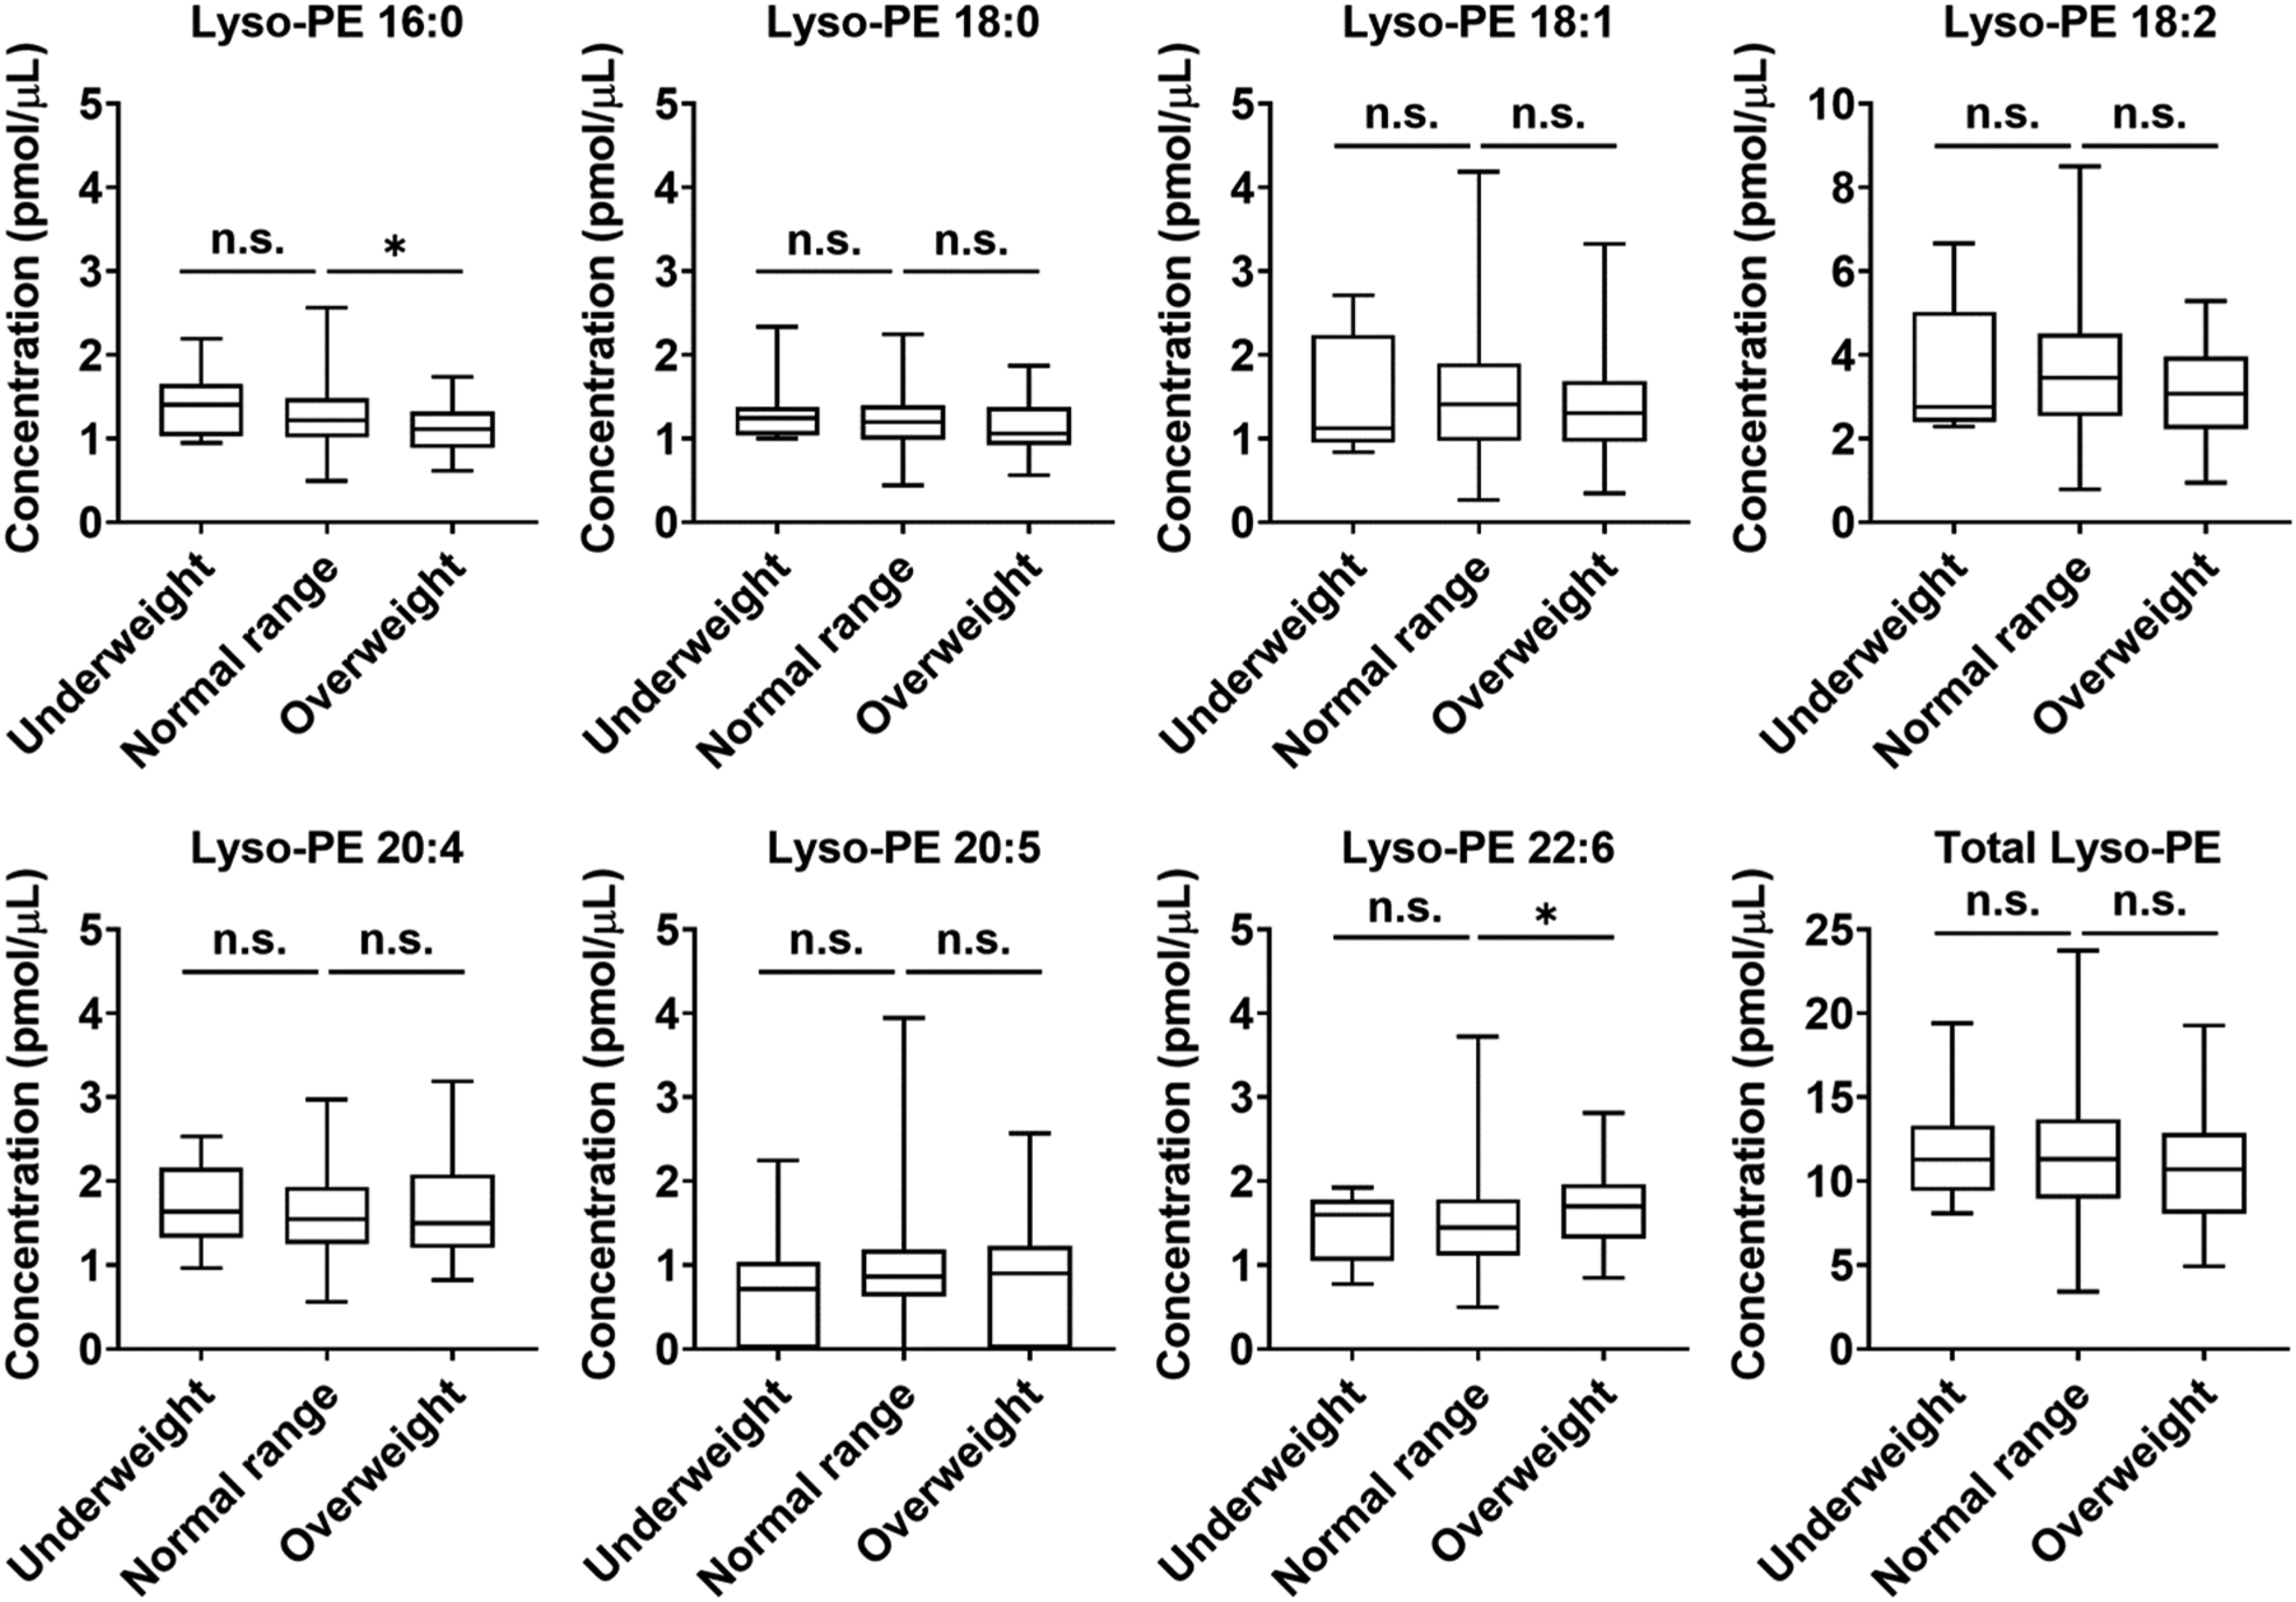
Discussion
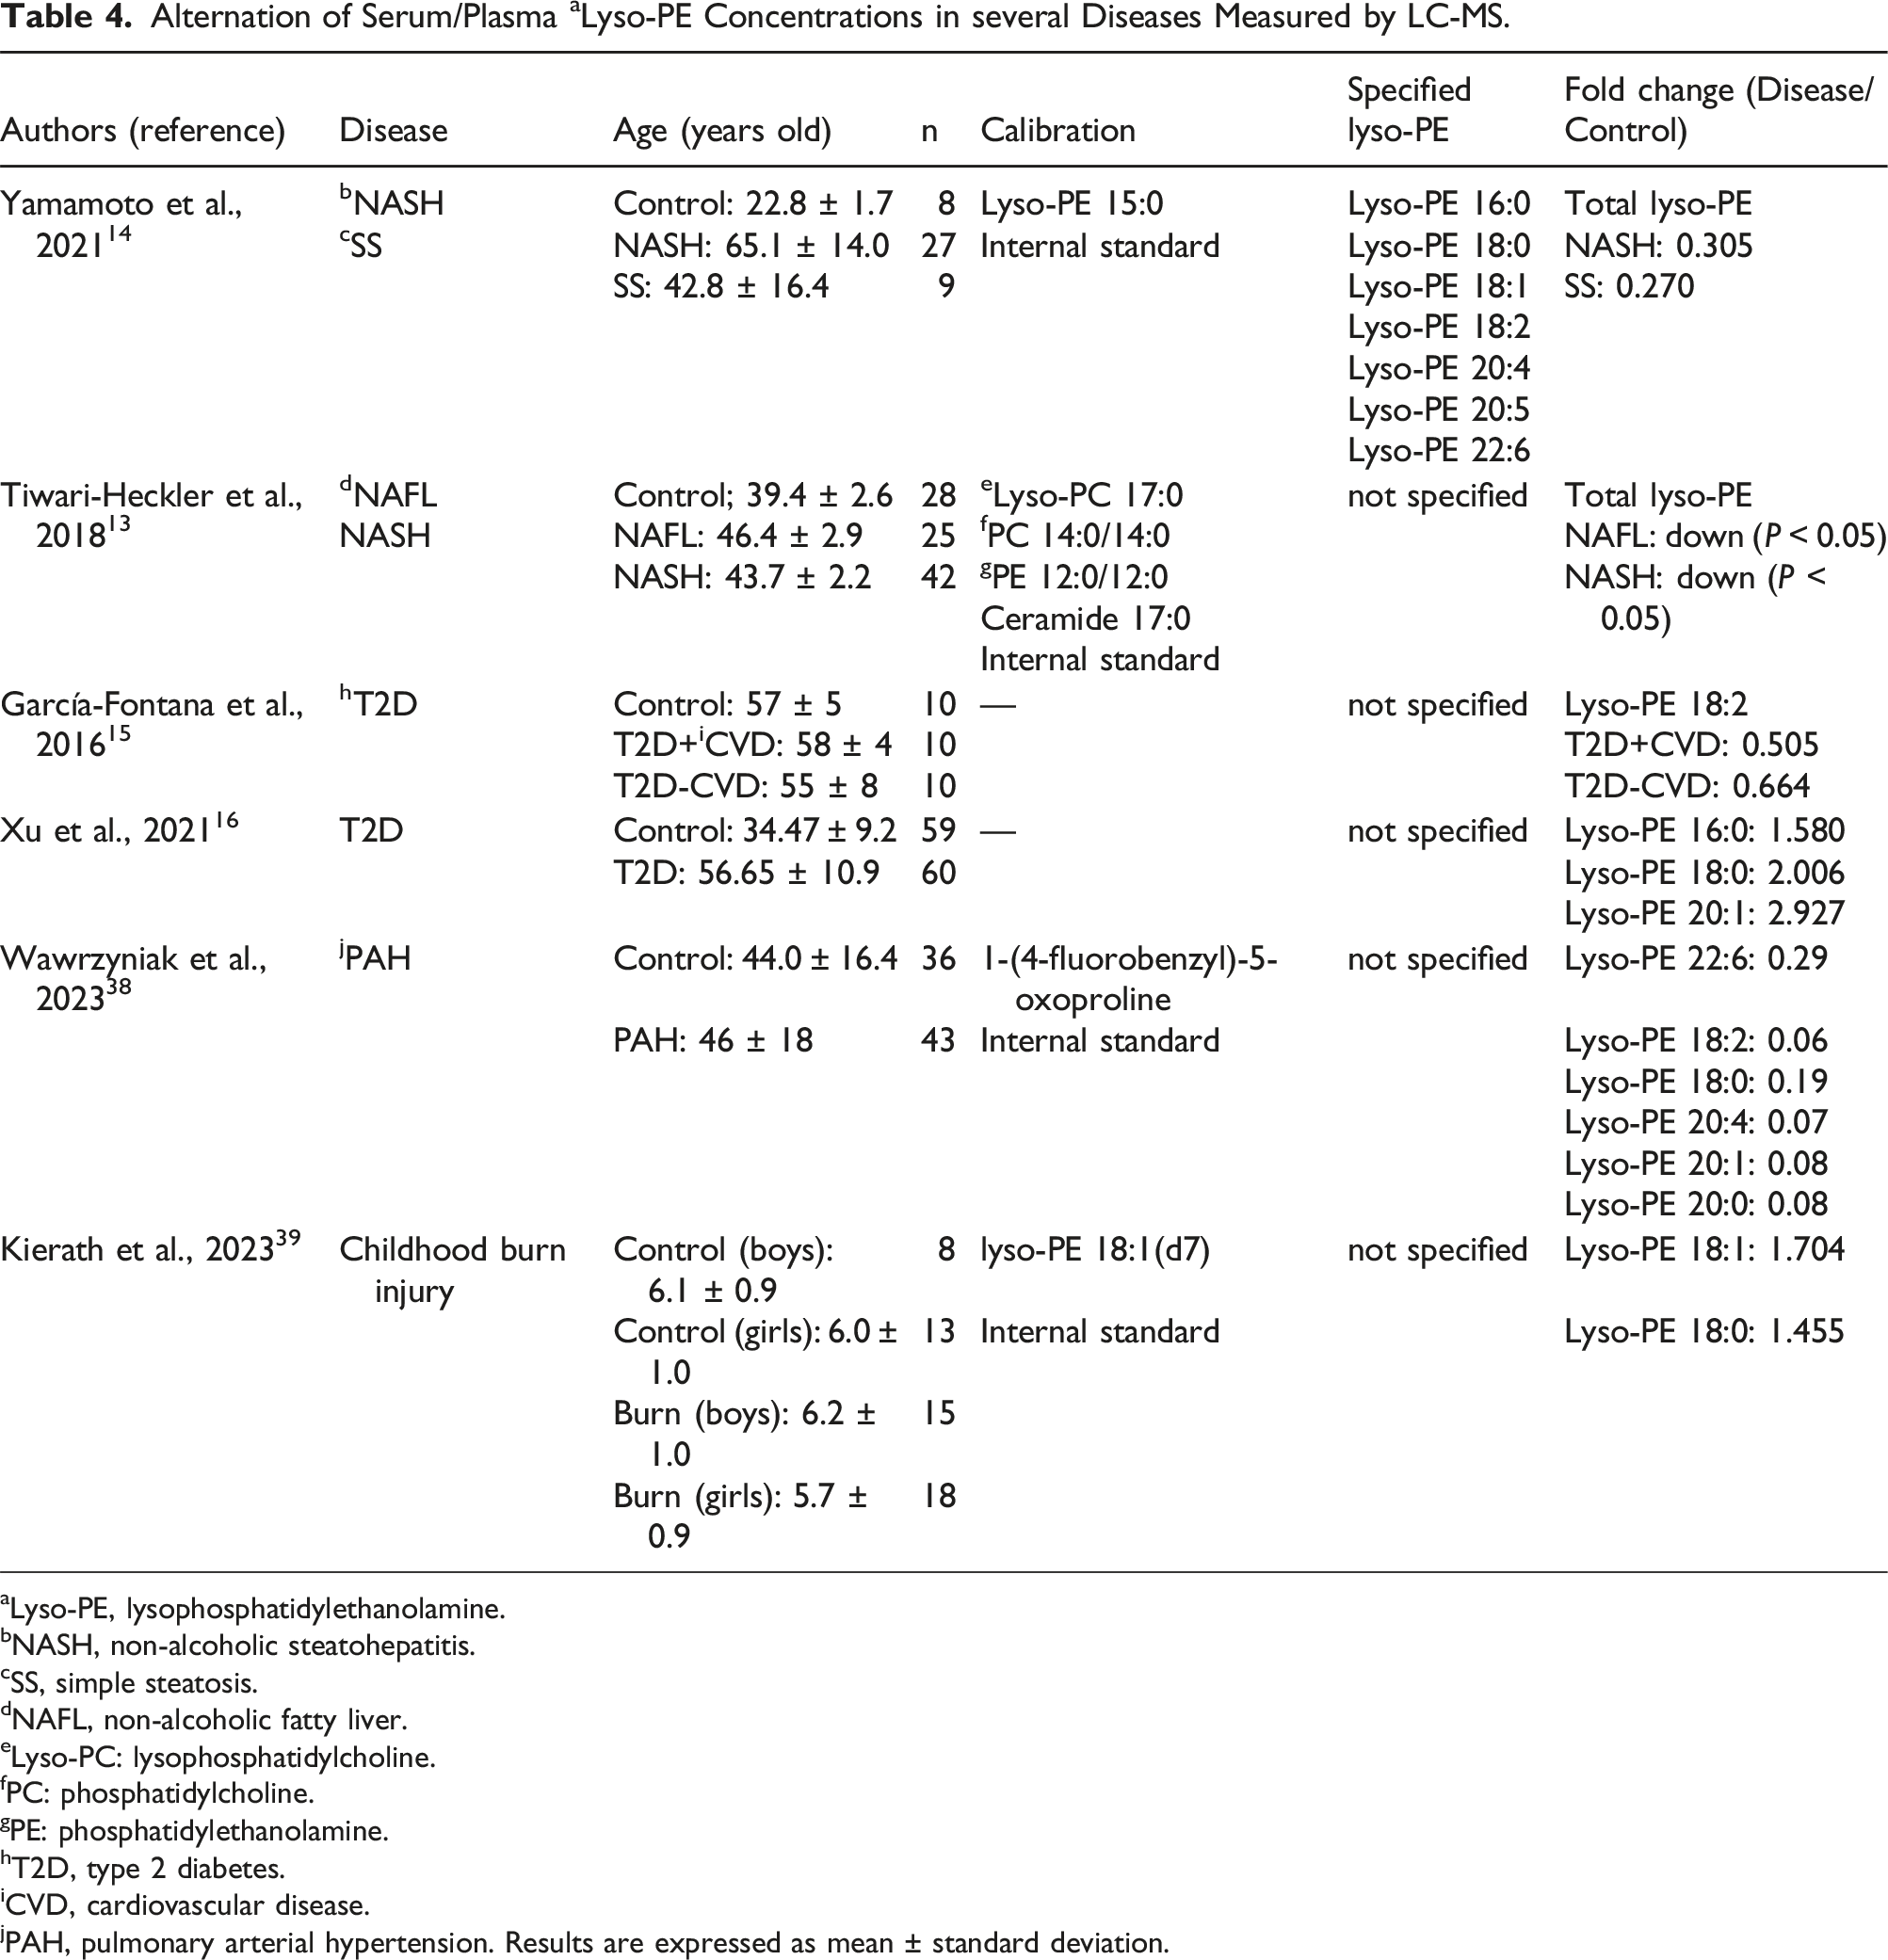
Alternation of Serum/Plasma a Lyso-PE Concentrations in several Diseases Measured by LC-MS.
aLyso-PE, lysophosphatidylethanolamine.
bNASH, non-alcoholic steatohepatitis.
cSS, simple steatosis.
dNAFL, non-alcoholic fatty liver.
eLyso-PC: lysophosphatidylcholine.
fPC: phosphatidylcholine.
gPE: phosphatidylethanolamine.
hT2D, type 2 diabetes.
iCVD, cardiovascular disease.
jPAH, pulmonary arterial hypertension. Results are expressed as mean ± standard deviation.
We established LC-MS/MS conditions to separate the lyso-PE species but not the regioisomers. Lyso-PEs have one acyl chain attached to either the sn-1 or sn-2 position of glycerol. Research on the fatty acid distribution of lyso-PLs revealed that saturated fatty acids were found mainly at the sn-1 position, and polyunsaturated fatty acids were detected mainly at the sn-2 position. 36 However, both saturated fatty acid-containing lyso-PEs and polyunsaturated fatty acid-containing lyso-PEs have an acyl chain at the sn-1 position in the plasma and serum because sn-2 types of lyso-PEs are quickly converted to more stable sn-1 types of lyso-PEs in an aqueous environment.6,36 Therefore, we established a targeted LC-MS/MS method using sn-1 lyso-PE standards that did not distinguish sn-1 from sn-2 in the samples. Under LC-MS/MS conditions, a single sharp peak was observed for each lyso-PE species in both the standard and plasma samples (Figure 1(b)), showing clean separation. However, it is necessary for the quantification to consider the natural isotopes because the retention time was similar among the species whose m/z were close, such as lyso-PE 18:0, 18:1, and 18:2. Theoretically, one lyso-PE species has several natural isotopes because it can be replaced by a rare stable isotope. Our method with the triple quadrupole mass spectrometer can reduce the interference of a natural isotope with the detection of another species, but cannot eliminate it. However, our results indicates that the proposed method has a high sensitivity for each lyso-PE species in clinical samples in which there is a less natural isotope.
We revealed the profiling of plasma lyso-PE concentrations in preadolescent children using a newly established method. First, we confirmed the difference in lyso-PE concentrations between boy and girl participants. The concentrations of several lyso-PE species were significantly higher in boys than in girls (Table 3), indicating that plasma lyso-PE concentrations are associated with sex. To date, there have been no reports comparing plasma lyso-PE concentrations in boys and girls. To the best of our knowledge, this is the first study to reveal sex-related differences in lyso-PE concentrations. The association between the bioactivities of lyso-PEs and sex differences needs to be investigated in the future.
Second, we confirmed differences in the concentrations and composition of lyso-PEs according to age. As shown in Figure 2, there was no significant difference in lyso-PE concentrations among all age groups. In a previous study, we determined the composition of serum lyso-PEs in adults. 37 The relative abundance of lyso-PE in plasma samples from children was evaluated and compared with that in adults (Figure 3). Our previous research revealed that lyso-PE 18:2 accounted for 24.1 ± 5.2%, followed by lyso-PE 20:4, lyso-PE 18:0, lyso-PE 22:6, lyso-PE 16:0, lyso-PE 18:1, and lyso-PE 20:5. 37 Compared with that in adults, the concentration of lyso-PE 18:2 was slightly higher in children (30.1 ± 5.5%). Lyso-PE 18:2 and lyso-PE 20:4 were the dominant species, and lyso-PE 20:5 was the least abundant among all the lyso-PE species in both children and adults. These results suggest that the concentrations and composition of lyso-PE species in children are similar to those in adults. However, the data about the lyso-PE concentration in adults and children was obtained from different methods. Further research on plasma lyso-PE in adults using the new method is needed to reveal the appropriate difference between adults and children.
Finally, we explored the association between lyso-PEs and obesity. The children were classified by two cutoffs, BMI and POW, and the concentrations of lyso-PEs in the plasma were compared among the subgroups (underweight, normal range, and overweight). In the previous research, lyso-PE concentrations were inversely associated with BMI in the plasma of adult participants. 38 However, in this study, no significant correlation was observed between the lyso-PE concentrations and BMI in preadolescent children (data not shown). It was difficult to compare the three groups using statistical analysis because of the small sample size of overweight children categorized by BMI. We evaluated the difference in lyso-PE concentration according to age within the same BMI groups, but there was no significant difference (Supplemental Information Table S4). To date, there is no gold standard for evaluating childhood obesity. 39 Although BMI is used for the definition of childhood obesity, 24 it has not reached a consensus. In Japan, POW is used to define overweight children. 32 Several reports suggest that POW seems to be more appropriate than BMI for the evaluation of childhood obesity because BMI dynamically changes in childhood.32,40 In addition, it is suggested that POW is associated with biochemical parameters related to childhood obesity, such as hypertension 41 and the reduced high-density lipoprotein-cholesterol concentration. 42 Therefore, we also confirmed the relation between the lyso-PE concentrations and POW. As shown in Figure 4, lyso-PE 16:0 was significantly lower in overweight children than in normal range (Fold change: 0.909), whereas lyso-PE 22:6 was significantly higher in overweight compared with normal range (Fold change: 1.174). Several reports have revealed that serum lyso-PE concentrations are lower in patients with NAFLD and NASH than in healthy individuals.13,14 We also found that lyso-PE concentrations were decreased in the livers of NASH mice. 43 Furthermore, lyso-PE 18:2 concentration was decreased in patients with T2D, 15 whereas lyso-PE 16:0, 18:0, and 20:1 were increased in patients with T2D and diabetes nephropathy. 16 Lyso-PEs have also been reported to be potential biomarkers of other diseases44,45 (Table 4). Both NAFLD and T2D are often accompanied by metabolic syndromes, including obesity. 46 Overweight in children, especially in adolescence, leads to metabolic disorders, such as increased fasting glucose, impaired glucose tolerance, T2D, and NAFLD21–24 when they become adults. Our findings suggest that reduced plasma lyso-PE 16:0 and increased lyso-PE 22:6 concentrations in overweight children may be associated with lifestyle-related diseases, such as T2D and NAFLD, in adults. So far, the study of plasma lipid profiling in children has been limited because it is difficult to collect the samples from healthy children. In the previous research, several lyso-PE concentrations positively correlated with age in Alström syndrome/Bardot-Biedl syndrome patients. 47 However, significant correlations were not observed between lyso-PE concentrations and age in healthy preadolescent children. Further research on plasma lyso-PE concentrations in different ages, such as infants and geriatric participants, is required to reveal the correlations between lyso-PEs and age. The understanding of the changes associated with growth and senescence in lyso-PE concentrations could contribute to finding new insight into the bioactivities of lyso-PEs. Our research on the absolute plasma lyso-PE concentrations in preadolescent children may lead to the prediction of lifestyle-related disease onset in adults and new treatment approaches in the future.
This study had some limitations. Although we have improved our sample pretreatment procedure, we have not performed a comparative investigation with other complex pretreatment procedures but only compared the previous pretreatment method. The LC-MS system conditions were monitored by injecting but lyso-PE standards not the quality controls during the measurement. The interference of the natural isotope of lyso-PEs could not be eliminated using our method with the triple quadrupole mass spectrometer. The association between plasma lyso-PE concentrations and overweight status was evaluated without adjustment for confounding factors, including age and sex. We measured the concentrations of lyso-PE species in non-fasting plasma samples. Moreover, the number of overweight children was small in this study. Further investigation is required to confirm the relation between lyso-PE species and food intake using fasting plasma samples with more sample number of overweight participants.
Conclusions
We developed a more robust, simple, and sensitive quantitative method for the determination of lyso-PE species using LC-MS/MS than that used in our previous method. The proposed method was applied to plasma samples from healthy preadolescent children and it revealed that the concentrations of several lyso-PE species were significantly higher in boys than in girls. In addition, our findings suggest that plasma lyso-PE concentrations are associated with overweight status. A further investigation targeting a larger number of overweight children is required to determine the association between lyso-PEs and obesity. To the best of our knowledge, this is the first study to reveal the profile of plasma lyso-PE concentrations in Japanese preadolescent children. This study may contribute to the elucidation of the relation between lyso-PEs and childhood obesity.
Supplemental Material
Supplemental Material - Determination of plasma lysophosphatidylethanolamines (lyso-PE) by LC-MS/MS revealed a possible relation between obesity and lyso-PE in Japanese preadolescent children: The Hokkaido study
Supplemental Material for Determination of plasma lysophosphatidylethanolamines (lyso-PE) by LC-MS/MS revealed a possible relation between obesity and lyso-PE in Japanese preadolescent children: The Hokkaido study in Nao Inoue, Siddabasave Gowda B. Gowda, Divyavani Gowda, Toshihiro Sakurai, Atsuko Ikeda-Araki, Yu Ait Bamai, Rahel Mesfin Ketema, Reiko Kishi, Hitoshi Chiba, and Shu-Ping Hui in Annals of Clinical Biochemistry
Footnotes
Acknowledgements
The authors thank the Central Research Laboratory, Faculty of Health Sciences, Hokkaido University for kindly providing the workspace and apparatus. We thank the Center for Environmental and Health Sciences, Hokkaido University, for providing the plasma samples. We would like to express our appreciation to all participants of the Hokkaido Study. We also thank all members of the Laboratory of Advanced Lipid Analysis, Hokkaido University, for their assistance with LC-MS/MS. We would like to thank Editage (![]() ) for English language editing.
) for English language editing.
Declaration of conflicting interests
The author(s) declared no potential conflicts of interest with respect to the research, authorship, and/or publication of this article.
Funding
The author(s) disclosed receipt of the following financial support for the research, authorship, and/or publication of this article: This study was supported by research fellowships from the Japan Society for the Promotion of Science for Young Scientists (grant number: 23KJ0068) and KAKENHI (grant numbers: 21K14812, 21H04843, and 23K06861).
Ethical approval
This study was approved by the ethics review board of the Faculty of Health Sciences, Hokkaido University (approval number: 22–33) and the Center for Environmental and Health Sciences, Hokkaido University (approval number: 21–136).
Guarantor
Shu-Ping Hui.
Contributorship
Conceptualization: N.I., S.G.B.G., T.S., A.I., H.C, and S.-P.H.; methodology: N.I., S.G.B.G., D.G., and T.S.; validation: N.I., S.G.B.G, and D.G.; formal analysis: N.I., S.G.B.G., and D.G.; investigation: N.I., S.G.B.G., and D.G.; resources: S.G.B.G., T.S., A.I., Y.A.B., R.M.K., R.K., H.C, and S.-P.H.; data curation: N.I., S.G.B.G., and D.G.; writing-original draft preparation: N.I. and S.G.B.G.; writing-review and editing: N.I., S.G.B.G., D.G., T.S., A.I., Y.A.B., R.M.K., R.K., H.C, and S.-P.H.; supervision: S.G.B.G., D.G., T.S., A.I., H.C, and S.-P.H.; funding acquisition: N.I., S.G.B.G., A.I., and S.-P.H. All authors have read and agreed to the published version of the manuscript.
Source of biological materials
Non-fasting plasma samples from healthy preadolescent children were provided by the participants of the Hokkaido Study on Environment and Children’s Health, the Hokkaido Cohort.
Data availability statement
The raw data for this study are available from the corresponding author (Prof. Shu-Ping Hui,
Supplemental material
Supplemental material for this article is available online.
Appendix
References
Supplementary Material
Please find the following supplemental material available below.
For Open Access articles published under a Creative Commons License, all supplemental material carries the same license as the article it is associated with.
For non-Open Access articles published, all supplemental material carries a non-exclusive license, and permission requests for re-use of supplemental material or any part of supplemental material shall be sent directly to the copyright owner as specified in the copyright notice associated with the article.