
Abstract
Background
Carnitine is essential for fatty acid metabolism. Free carnitine (FCA) is excreted in the urine in the glomerulus, but is partly reabsorbed by a carnitine transporter. The mechanism underlying the decrease in serum carnitine level during pregnancy is unclear.
Objective
To investigate whether low carnitine level is associated with increased renal excretion in pregnant women.
Methods
We recruited 43 healthy pregnant and 25 non-pregnant women. Total carnitine (TCA) and FCA levels were measured using the enzymatic cycling method, and the acylcarnitine (ACA) level was calculated. Fractional excretion (FE) was calculated as carnitine clearance divided by creatinine clearance.
Results
The mean TCA, FCA, and ACA levels were lower at 12 weeks of gestation in pregnant than non-pregnant women (P < .001); the levels decreased further at 36 weeks, reaching 39%, 36%, and 52% of those in non-pregnant women, respectively (P < .001). The FEs were 3–4-fold higher in pregnant women than non-pregnant women. Pregnant women had a lower serum FCA/TCA ratio than non-pregnant women (0.788 ± 0.098 vs 0.830 ± 0.074, respectively; P < .05), whereas the urine FCA/TCA ratio was similar between the groups.
Conclusion
Low carnitine level is associated with increased renal excretion during late pregnancy.
Introduction
Carnitine (β-hydroxy-γ-trimethylammonium butyrate) is a hydrophilic quaternary amine synthesized from lysine and methionine. It is distributed ubiquitously across tissues and plays an essential role in energy synthesis using long-chain-fatty acid (LCFA). 1 The process begins with the conversion of LCFA to acyl-CoA by acyl-CoA synthetase. Acyl-CoA is an activated form of LCFA that can enter the mitochondrial intermembrane space but cannot pass through the mitochondrial inner membrane. Therefore, carnitine palmitoyltransferase 1 on the outer membrane converts acyl-CoA and free carnitine (FCA) to acylcarnitine (ACA). 1 Then, carnitine-acylcarnitine translocase on the inner membrane exchanges ACA in the intermembrane space with FCA in the mitochondrial matrix across the inner membrane. When ACA reaches the mitochondrial matrix, it is converted into acyl-CoA and FCA by carnitine palmitoyltransferase 2 on the inner membrane. Finally, acyl-CoA is used for energy production by β-oxidation in the mitochondrial matrix. The dissociated FCA in the matrix is transported back to the intermembrane space by carnitine-acylcarnitine translocase on the inner membrane. This process is repeated to use the cytosolic LCFA for mitochondrial energy production.
During pregnancy, fetuses require a large amount of energy for development and growth. Multiple nutrients are transported from the mother to the fetus through the placenta. For example, glucose is transported across the placenta by glucose transporter 1, 2 whereas L-amino acids are transported by a heterodimer of large amino acid transporter 1 and CD98, known as SLC7A5 and SLC3A2, respectively. 3 Fatty acids are an important source of fetal energy. 4 Some fatty acids, including essential fatty acids, are taken up by the placenta and deposited in fetal tissues,5,6 although de novo fatty acid synthesis also occurs in fetuses. 7 To use fatty acids for energy production, carnitine levels must be increased during late pregnancy; however, studies have shown that maternal serum carnitine levels are decreased during pregnancy.8,9 Carnitine deficiency during pregnancy reportedly led to preterm and low-birth-weight infants with intrauterine growth retardation. 10 This indicates that carnitine has multiple physiological functions in major metabolic pathways that are essential for development and growth.11,12 Carnitine deficiency is also believed to cause fatty liver under parental nutrition in children.13,14 Besides the decreased carnitine levels in maternal serum, it is unclear whether the carnitine level in umbilical cord blood is maintained and further related to fetal growth. Because umbilical cord blood reflects the fatty acid supply derived from not only fetal but also maternal serum, the carnitine level in umbilical cord blood may be partly related to fetal growth during pregnancy.
Because the glomerular filtration rate (GFR) is increased during pregnancy, 15 a low serum carnitine level may be due to the increased renal excretion. Although some studies have suggested that renal carnitine excretion is decreased in late pregnancy, the GFR changes during pregnancy were not considered. This observational study investigated whether the low carnitine level in pregnant women is associated with increased renal excretion. We calculated the fractional excretion (FE) rate of carnitine to correct the increase in GFR during pregnancy.
Materials and methods
Study participants
We recruited healthy pregnant women in the first trimester from Juntendo University Hospital.16,17 We excluded participants with poorly controlled hypertension, diabetes mellitus, hypothyroidism, autoimmune disease, renal disease, or overt systemic inflammation. Additionally, we recruited healthy non-pregnant women from the general public using a website advertisement. Written informed consent was obtained from the study participants.
The study protocol was approved by the Ethics Committee of Juntendo University Hospital. The study was performed in accordance with the 1964 Declaration of Helsinki and its latest amendments (2013). 18
Study protocol
For pregnant women, blood samples were drawn after overnight fasting from the cubital vein at 12, 25, and 36 weeks of gestation. Early or late visits (by up to 6 days) were allowed. Urine samples were collected at 36 weeks. At delivery, umbilical cord blood samples were obtained from newborns. For control women, fasting blood and urine samples were obtained in the same manner as for pregnant women.
We excluded pregnant women with missing samples or preterm birth. In total, 68 women (43 in the pregnant group and 25 in the control group) were included in the analysis.
Carnitine and creatinine (Cr) level measurement
Serum was separated by centrifugation at 1500 g for 15 min. The total carnitine (TCA) levels were measured using an automated analyzer (LABOSPECT 008; Hitachi High-Tech, Tokyo, Japan) using high-sensitivity commercial kits based on the enzyme cycling method (Kainos Laboratories, Tokyo, Japan). 19 For TCA level measurement, ACA was hydrolyzed into L-carnitine by acylcarnitine esterase. Then, L-carnitine (i.e. FCA) was converted into dehydrocarnitine by carnitine dehydrogenase in the presence of β-thio-nicotinamide-adenine dinucleotide (thio-NAD+), producing thio-NADH. The same enzyme also catalyzes the reverse reaction with β-nicotinamide-adenine dinucleotide (NADH), producing NAD+. Because L-carnitine is a substrate in the precedent reaction, this cycling reaction amplifies the conversion of thio-NAD+ to thio-NADH. The synthetic rate of thio-NADH is proportional to the initial L-carnitine level. The ACA level was calculated by subtracting the FCA level from the TCA level. The Cr level was determined using the enzymatic method.
Calculation of the FE rate of carnitine
The Cr clearance (Ccr) and carnitine fractions clearance (CTCA, CFCA, and CACA) were calculated using the following formula: ([X]urine × UV)/[X]serum, where [X]urine and [X]serum are the urine and serum levels of X, respectively, and UV is the urine volume. The GFR increases during pregnancy. To correct for the influence of GFR, CTCA, CFCA, and CACA were divided by Ccr to calculate the FE. The FE (%) was calculated without urine volume: ([carnitine]urine × [Cr]serum × 100)/([carnitine]serum × [Cr]urine).
Other biochemical and haematological analyses
The total protein (TP) and albumin levels were determined using the biuret and modified bromocresol purple methods. 20 The alkaline phosphatase (ALP) and creatine kinase (CK) activities were measured using the Japan Association of Clinical Chemistry reference methods and commercially available kits. Serum iron and magnesium levels were measured using the 2-nitroso-5-[N-n-propyl-N-(3-sulfopropyl) amino] phenol method (Quick-auto Neo Fe; Shino-test, Tokyo, Japan). 21 We performed complete blood count using an automated hematology analyzer (XT4000i; Sysmex, Kobe, Japan).
Statistical analysis
Data were tested for normality of distribution. Variables were compared between the pregnant and control groups using Student’s t-test or Welch’s t-test as appropriate. We used one-way repeated measures analysis of variance to examine the effects of gestational age on the variables. Correlations between two factors were analysed using Pearson’s correlation. Variables with skewed distributions were transformed logarithmically before statistical analysis. P-values <.05 were considered indicative of statistical significance.
Results
Anthropometric variables
Comparison of anthropometric variables and laboratory parameters among controls, pregnant women, and neonates.
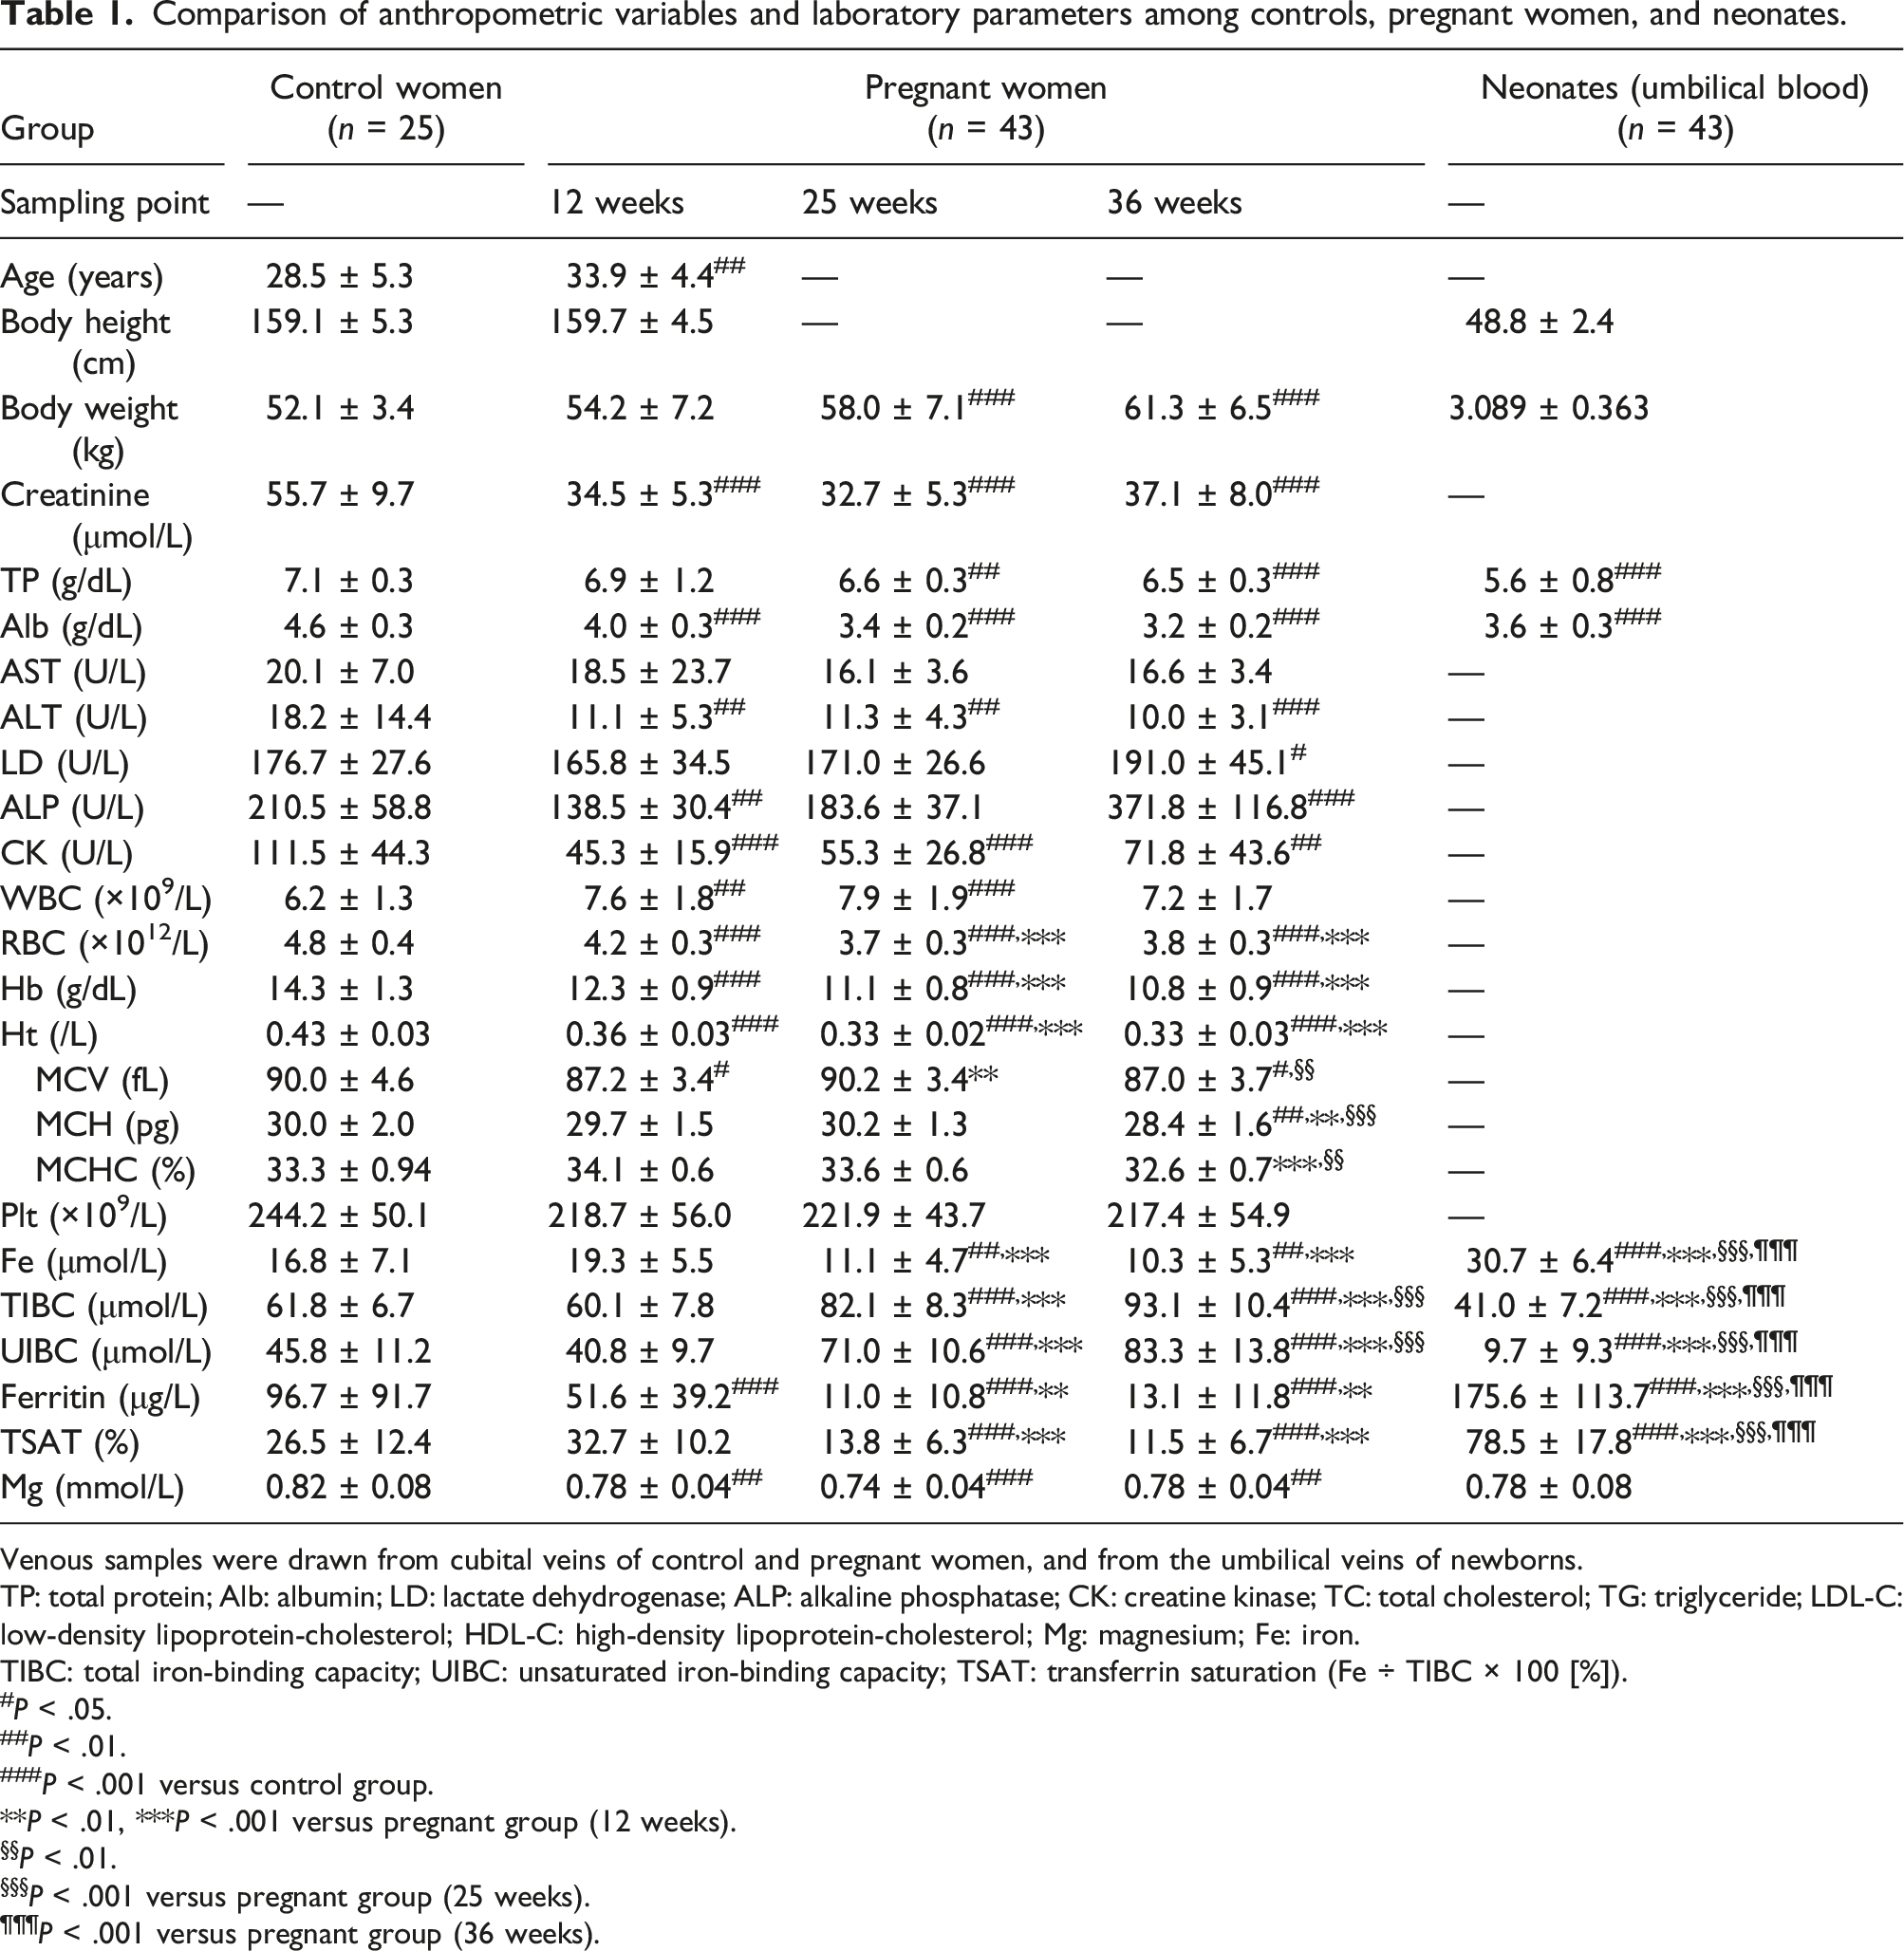
Venous samples were drawn from cubital veins of control and pregnant women, and from the umbilical veins of newborns.
TP: total protein; Alb: albumin; LD: lactate dehydrogenase; ALP: alkaline phosphatase; CK: creatine kinase; TC: total cholesterol; TG: triglyceride; LDL-C: low-density lipoprotein-cholesterol; HDL-C: high-density lipoprotein-cholesterol; Mg: magnesium; Fe: iron.
TIBC: total iron-binding capacity; UIBC: unsaturated iron-binding capacity; TSAT: transferrin saturation (Fe ÷ TIBC × 100 [%]).
#P < .05.
##P < .01.
###P < .001 versus control group.
**P < .01, ***P < .001 versus pregnant group (12 weeks).
§§P < .01.
§§§P < .001 versus pregnant group (25 weeks).
¶¶¶P < .001 versus pregnant group (36 weeks).
Pregnancy-induced changes in biochemical and haematological parameters
Several serum component levels were changed during pregnancy. Although the mean TP level was similar in pregnant women at 12 weeks and control women, it was 7.0% and 8.5% lower in pregnant women at 25 and 36 weeks, respectively, than in control women (Table 1). The albumin level decreased earlier and more significantly than the TP level during pregnancy. The mean albumin level was 30% lower in pregnant women at 36 weeks than in control women. The transaminase levels decreased during pregnancy. The ALP activity was increased significantly in pregnant women at 36 weeks, indicating overproduction of placental ALP isozyme.
The complete blood count revealed progressively worsening iron deficiency anemia during pregnancy. The mean haemoglobin level in pregnant women decreased to 10.8 g/dL. The mean corpuscular volume, mean corpuscular haemoglobin, and mean corpuscular haemoglobin concentration were significantly lower in pregnant women at 36 weeks than in control women. Compared with the levels in pregnant women at 12 weeks, the TIBC and UIBC levels increased by 55% and 103%, respectively, whereas the serum iron level decreased by 46% at 36 weeks. The ferritin level in pregnant women at 25 and 36 weeks were less than one-eighth and one-sixth of that in controls. The transferrin saturation in pregnant women at 25 and 36 weeks was less than one-seventh of that in controls. Although the magnesium level was significantly lower in pregnant women than in control women, the difference was small.
Pregnancy-induced changes in serum carnitine level
Comparison of serum levels of carnitine and ketone bodies among controls, pregnant women, and neonates.
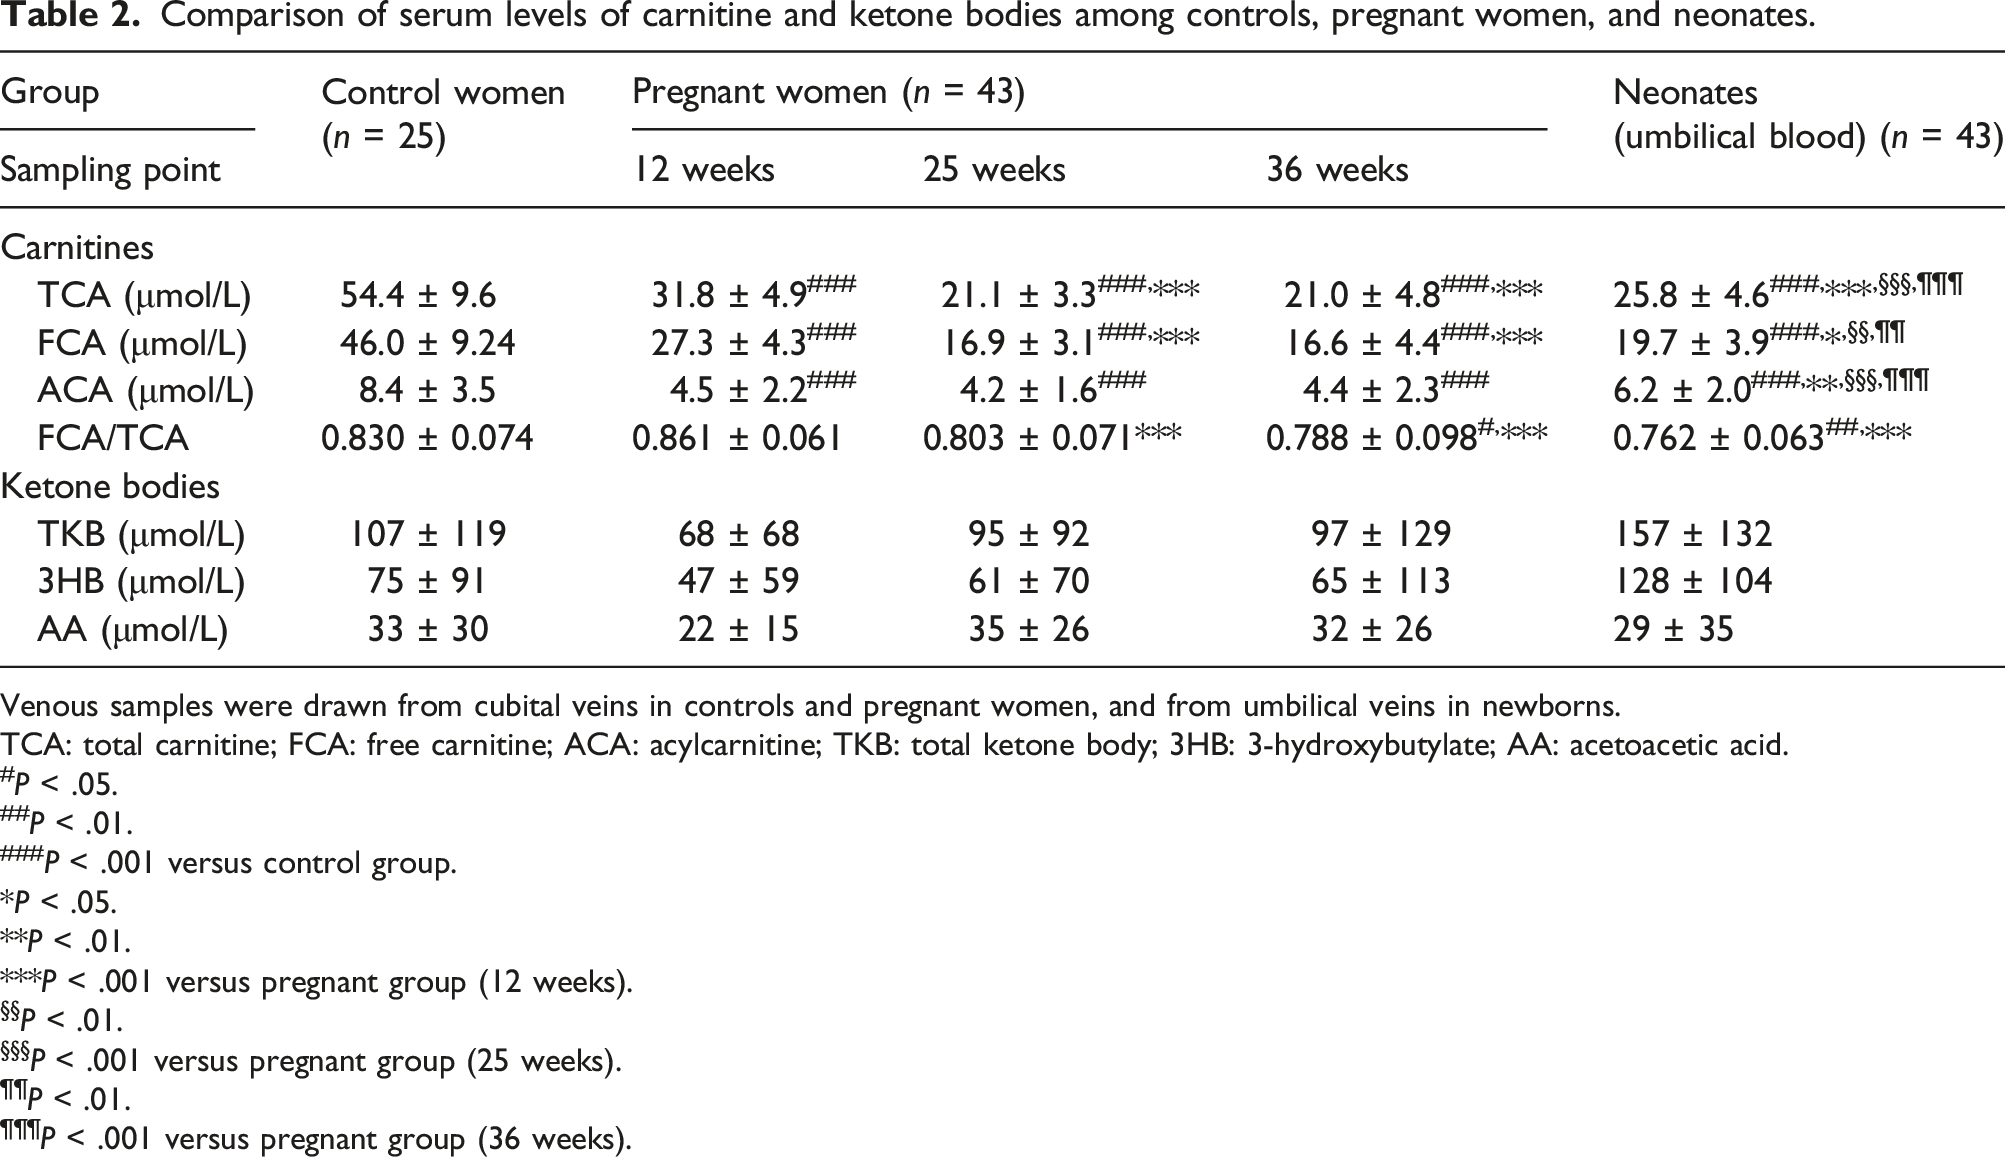
Venous samples were drawn from cubital veins in controls and pregnant women, and from umbilical veins in newborns.
TCA: total carnitine; FCA: free carnitine; ACA: acylcarnitine; TKB: total ketone body; 3HB: 3-hydroxybutylate; AA: acetoacetic acid.
#P < .05.
##P < .01.
###P < .001 versus control group.
*P < .05.
**P < .01.
***P < .001 versus pregnant group (12 weeks).
§§P < .01.
§§§P < .001 versus pregnant group (25 weeks).
¶¶P < .01.
¶¶¶P < .001 versus pregnant group (36 weeks).
Carnitine levels in umbilical cord serum
The mean carnitine fractions were significantly higher in the umbilical cord blood than in pregnant women at 25 and 36 weeks, although the levels were lower than those in control women. The FCA/TCA ratio in umbilical cord serum was similar to that in pregnant women at 25 and 36 weeks. There were no significant associations between carnitine levels in maternal (at 36 weeks) and umbilical cord serum (Figure 1). Correlations between maternal serum (36 weeks) and umbilical cord blood carnitine levels. Correlations between maternal serum and umbilical cord blood carnitine levels were analysed using Pearson’s correlation.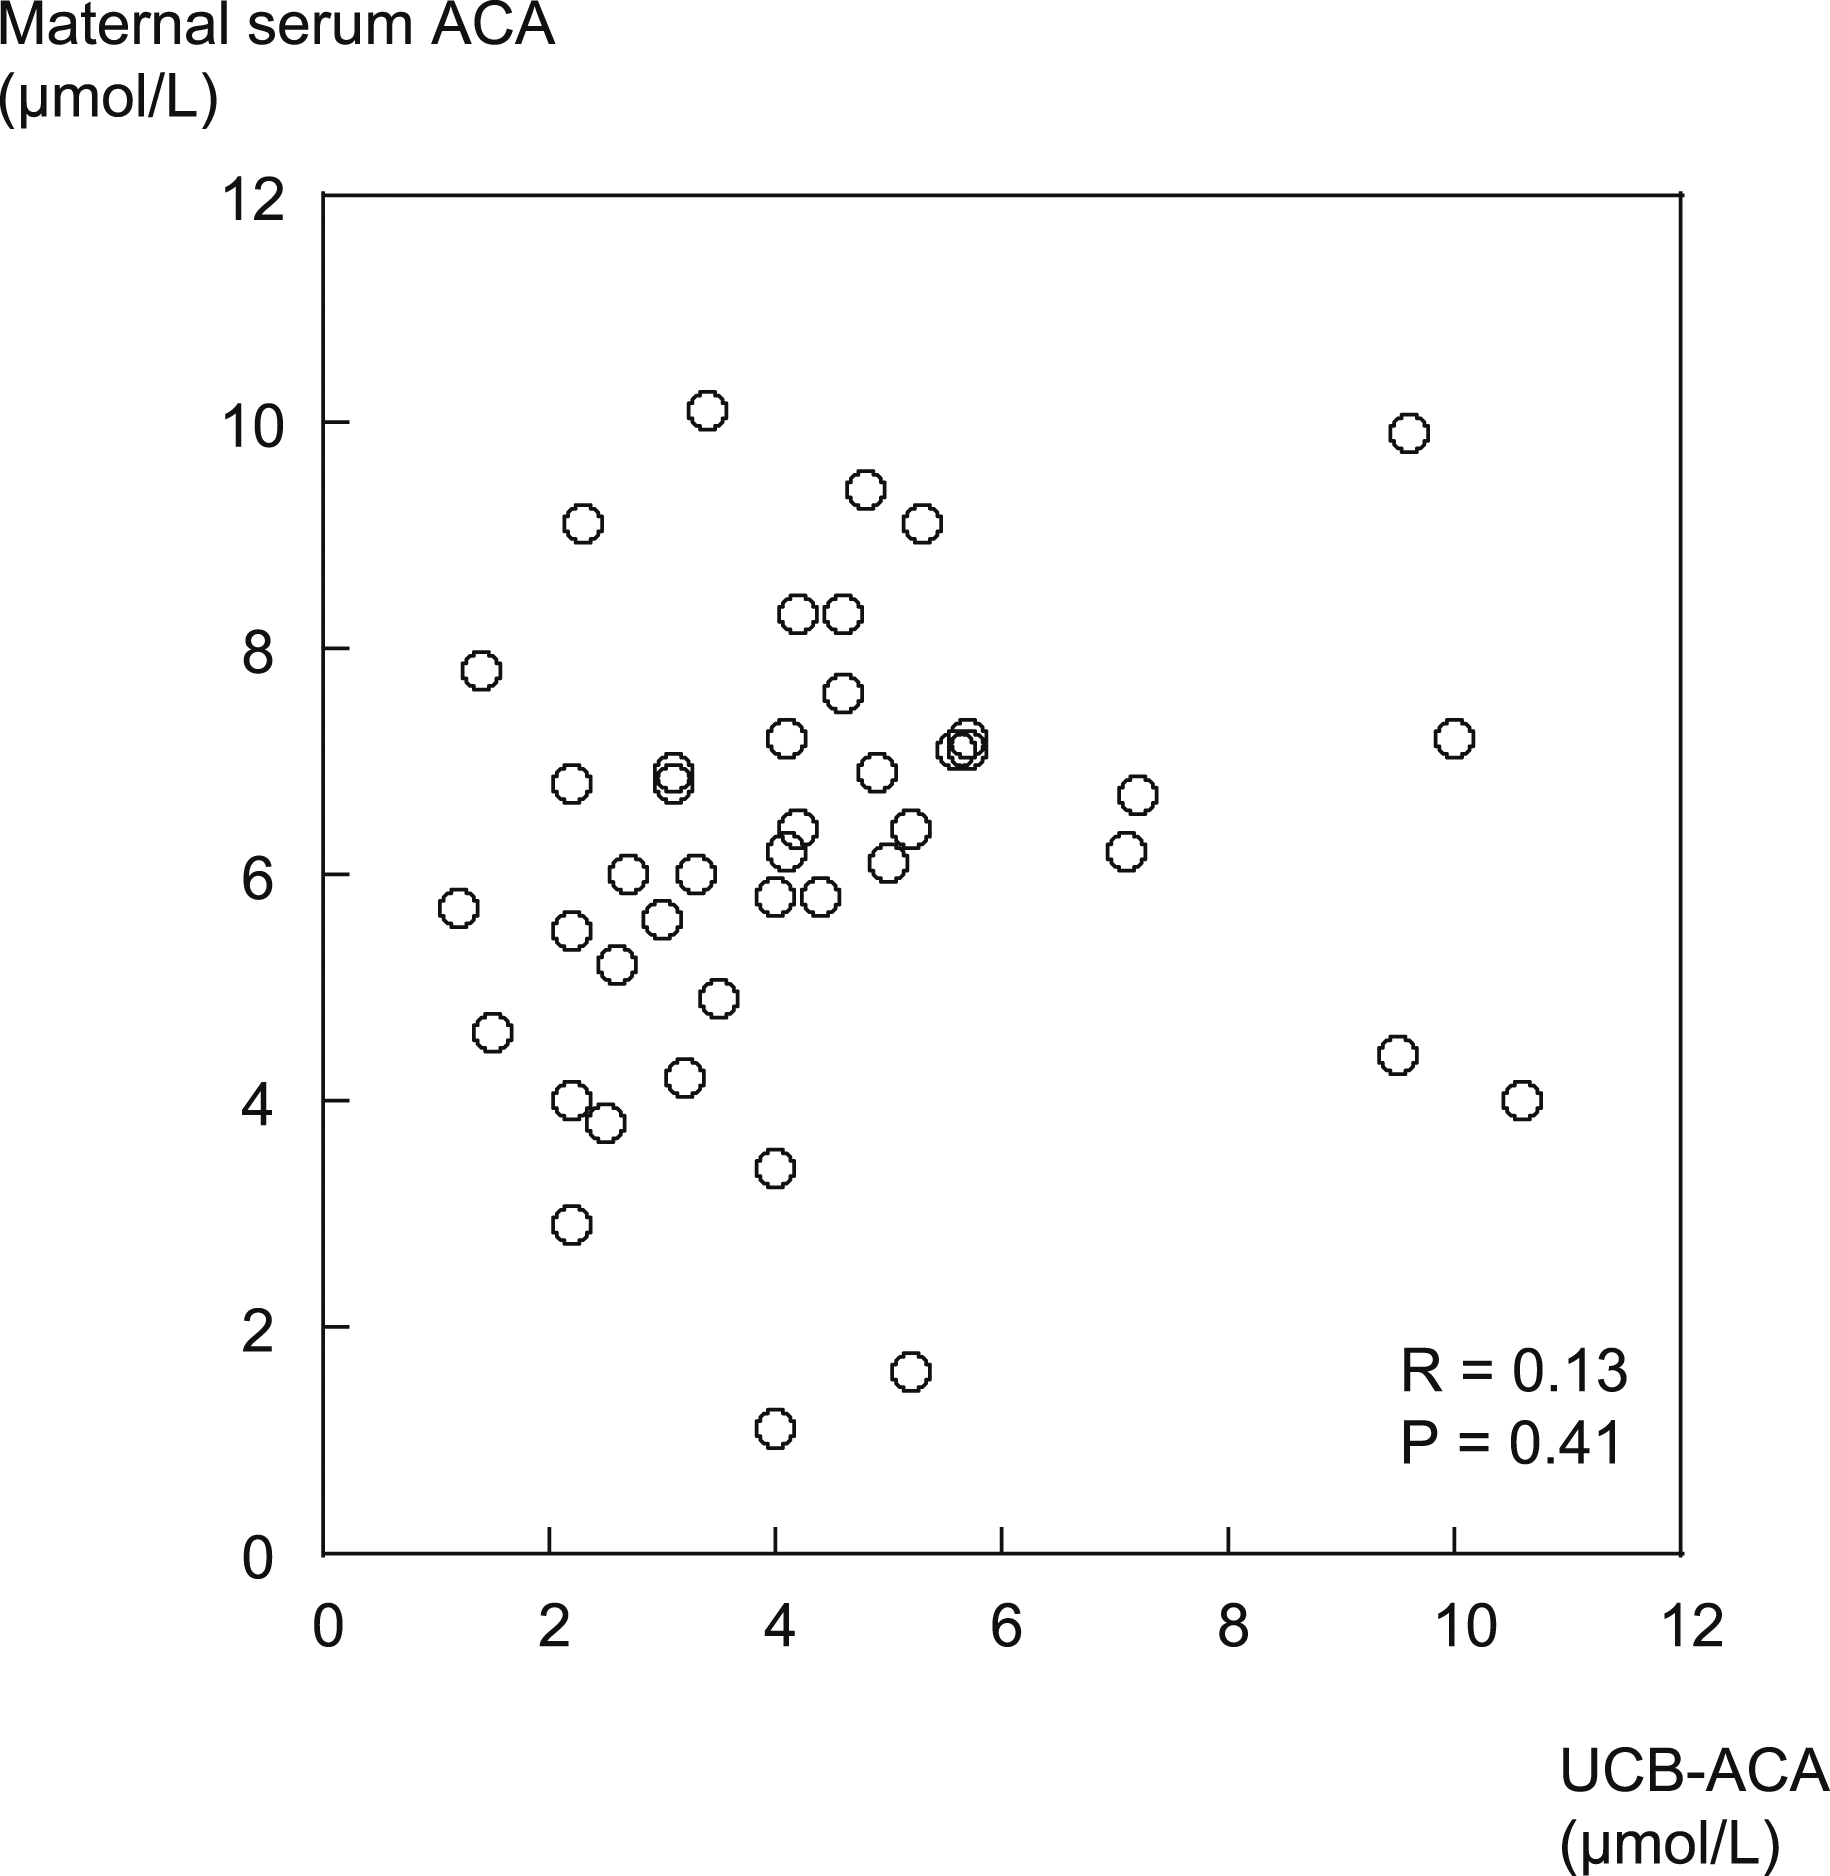
Urinary carnitine excretion in late pregnancy
Urinary biochemical markers and fractional excretion of carnitine in control and pregnant women.
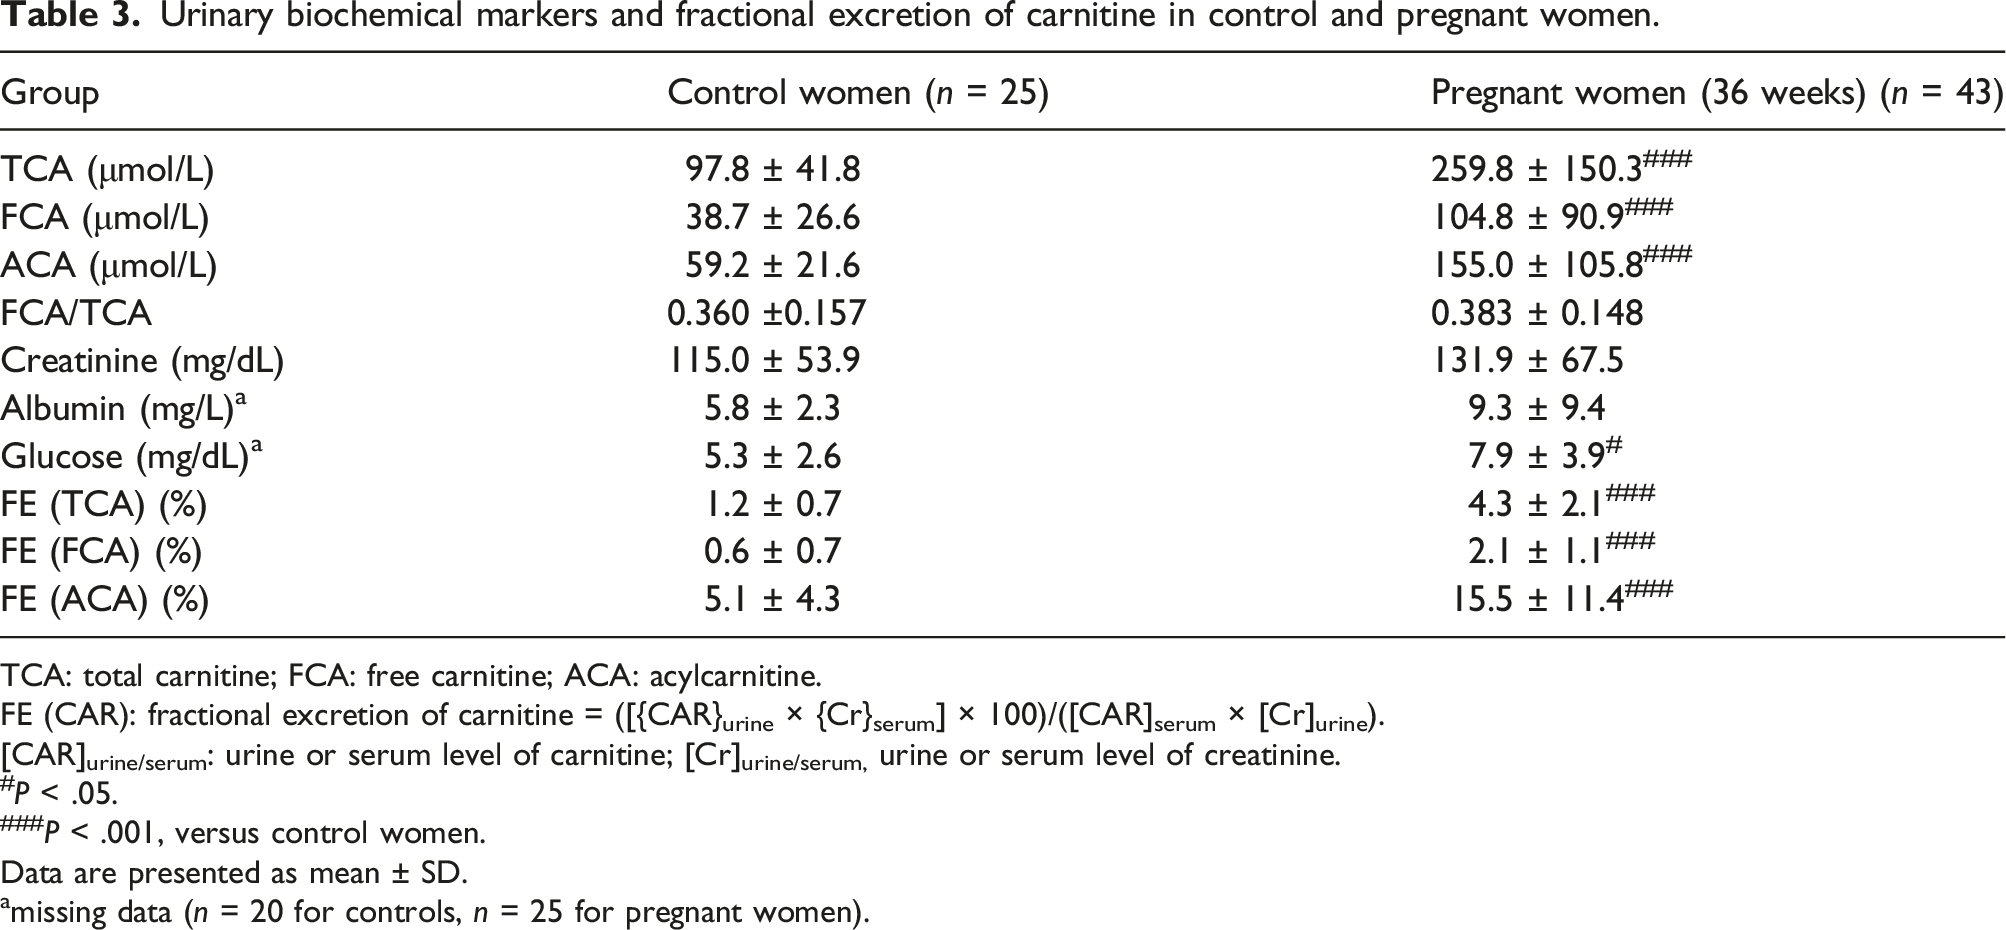
TCA: total carnitine; FCA: free carnitine; ACA: acylcarnitine.
FE (CAR): fractional excretion of carnitine = ([{CAR}urine × {Cr}serum] × 100)/([CAR]serum × [Cr]urine).
[CAR]urine/serum: urine or serum level of carnitine; [Cr]urine/serum, urine or serum level of creatinine.
#P < .05.
###P < .001, versus control women.
Data are presented as mean ± SD.
amissing data (n = 20 for controls, n = 25 for pregnant women).
Relationship between carnitine level and fetal growth
We analysed the correlation between carnitine levels and body parameters at birth. In pregnant women at 36 weeks, the ACA level had a weak positive correlation with birth weight, but not with birth length (Figure 2(a)). On the other hand, the carnitine fraction in the umbilical cord blood had no significant correlations with birth weight or length (Figure 2(b)). Correlations among birth weight, birth height, and maternal serum (36 weeks) and umbilical cord blood carnitine levels. Correlations between two variables were analysed using Pearson’s correlation. (a) Correlations of maternal serum carnitine levels with birth weight and height. (b) Correlations of umbilical cord blood carnitine levels with birth weight and height.
Discussion
In this study, we found that a low carnitine level is associated with increased renal excretion in pregnant women. The maternal serum TCA, FCA, and ACA levels were 40–46% lower in pregnant women at 12 weeks than in control women (Table 2). The TCA and FCA levels decreased further in pregnant women at 25 and 36 weeks. The FE-TCA, FE-FCA, and FE-ACA were 3–4-fold higher in pregnant women at 36 weeks than in control women. Serum carnitine concentration and urinary carnitine excretion were negatively correlated in pregnant women at 36 weeks. Although the effects of plasma dilution during pregnancy on serum carnitine levels are unclear, the levels of serum carnitine fractions at 36 weeks were lower than those in controls when we corrected each value by albumin concentrations of control and maternal serum at 36 weeks (data not shown).
Several factors affect the serum carnitine level during pregnancy. First, the serum carnitine level depends on intestinal absorption. In healthy individuals, about three-fourths of the serum carnitine is derived from food intake. 22 Carnitine is absorbed by the organic cation/carnitine transporter 2 (OCTN2), which is expressed on the apical membrane of enterocytes in the small intestine. 23 Although dietary carnitine intake can be reduced due to hyperemesis gravidarum in the first trimester, the intake usually recovers to or exceeds that in non-pregnant women thereafter. In a Korean study, pregnant women had significantly 54% and 41% lower dietary intake of TCA in the first and second trimesters than that in the third trimester. However, the pregnant women had 37% higher carnitine intake in the third trimester than non-pregnant women. 9 Although the association between carnitine intake and serum carnitine levels was not assessed in the above study, the food intake in late pregnancy is unlikely to be the major cause of the low carnitine level.
Second, de novo carnitine is synthesized from amino acids (lysine and methionine) in the liver, kidneys, and brain. 24 Carnitine synthesis requires vitamin C, vitamin B6, niacin, and iron.25,26 Because carnitine synthesis accounts for only one-fourth of the serum carnitine level in healthy individuals, 22 it is likely to serve as a buffering system to maintain serum carnitine levels in pregnant women. Few studies have evaluated carnitine synthesis in pregnant women; therefore, further studies are needed.
Third, urinary carnitine excretion depends on glomerular filtration and tubular reabsorption. During pregnancy, renal vascular resistance declines significantly, resulting in a 50–85% increase in the GFR, that is, hyperfiltration 27 Although both FCA and ACA are filtered in glomeruli, only FCA is reabsorbed by OCTN2. At 36 weeks of gestation, the urinary FCA and ACA levels were 2.6- and 2.7-fold higher than those in non-pregnant women (Table 3), indicating increased urinary secretion of FCA and ACA in pregnant women. A Korean study found that the urinary carnitine level was decreased in late pregnancy. 9 However, the urinary carnitine level was calculated as the carnitine/Cr ratio (i.e. μmol/g Cr). Such correction is not appropriate in pregnant women because urinary Cr excretion is also increased (Table 3). To evaluate urinary carnitine excretion with adjustment for high urinary Cr excretion, we calculated the TCA, FCA, and ACA FE. FE is the fraction filtered by the glomerulus that is excreted into the urine. The FEs were 3–3.6-fold higher in pregnant women at 36 weeks than in control women. Because GFR increases in late pregnancy by less than 2-fold of the baseline, 27 a significant increase in FE is expected. Although the serum FCA/TCA ratio was significantly lower in pregnant women at 25 and 36 weeks than in control women (Table 2), the urinary FCA/TCA ratio did not differ significantly between control women and late pregnancy (Table 3). Our results suggest that FCA reabsorption is reduced in late pregnancy. Impaired FCA reabsorption is closely related to altered sodium distribution in pregnant women. Urinary FCA is taken up by OCTN2, which is located in the apical brush-border membrane on the urinary side of proximal renal tubules. 28 OCTN2 is a high affinity sodium-dependent co-transporter of FCA. 28 Thus, a transmembrane sodium gradient drives carnitine from the urine into epithelial cells. Cytoplasmic sodium in epithelial cells is pumped into the circulation by the sodium/potassium-ATPase located in the basolateral membrane on the blood side. In pregnant rats, sodium/potassium-ATPase activity in the renal cortex is decreased in the middle and late pregnancy.29,30 In this condition, the cytoplasmic sodium level is relatively high, which decreases the transmembrane sodium gradient between the urine and endothelial cells. As a result, sodium-dependent FCA transport is likely to decrease in renal tubules.
In addition to the aforementioned mechanism, transplacental transfer of maternal serum carnitine to fetus may also occur. Placenta expresses OCTN2 on the brush-border membranes of syncytiotrophoblast cells.31,32 These cells are derived from the fetus and are in direct contact with maternal blood. An in vitro study of perfused human placenta showed that the FCA and TCA levels in the umbilical artery and vein were similar to those in the maternal vein, suggesting an absence of active transplacental transport of carnitine. 33 However, FCA and TCA are accumulated in placental tissues after perfusion. Placental tissues take up maternal carnitine and used it for placental energy synthesis by fatty acid oxidation. In a previous study, we found that the level of lipoprotein lipase (an enzyme hydrolyzing triglyceride-rich lipoproteins) in umbilical cord blood was positively correlated with the neonatal birth weight. 17 The umbilical cord blood level of very low-density lipoprotein-triglyceride increased with the gestational age; 34 the very low-density lipoprotein-triglyceride was hydrolyzed by fetal lipoprotein lipase into free fatty acids. In the present study, birth weight and height were not significantly correlated with the umbilical cord blood carnitine level. In addition to the placenta, carnitine is synthesized in the fetal kidneys, liver, and spinal cord. 35 These observations are consistent with our findings that TCA, FCA, and ACA levels in the umbilical cord blood were 19–41% higher than those in the maternal serum at 36 weeks of gestation (Table 2). Because umbilical cord blood carnitine level is slightly increased and the maternal serum carnitine level is markedly decreased, placental carnitine transfer may not be the major reason for the decrease in maternal carnitine level in late pregnancy.
This study had several limitations. First, we did not evaluate maternal food intake. Dietary components for carnitines may be different in each pregnant woman and affect blood carnitine levels. Second, we measured maternal serum and umbilical cord blood carnitine levels at different times. Despite these limitations, renal carnitine loss appears to be the main reason for the decreased FCA level in late pregnancy. In summary, the low carnitine level is associated with increased renal excretion in pregnant women. Further studies are needed to determine whether the low FCA level in pregnancy should be treated and whether carnitine supplementation is a useful approach for promoting fetal growth.
Footnotes
Acknowledgements
We would like to thank Mrs. Naomi Misawa for her assistance and technical help in this study.
Declaration of conflicting interests
The author(s) declared no potential conflicts of interest with respect to the research, authorship, and/or publication of this article.
Funding
The author(s) disclosed receipt of the following financial support for the research, authorship, and/or publication of this article: This research was supported by JSPS KAKENHI (grant no. 19K07874 and 18K07477) and a Grant-in-Aid for Special Research in Subsidies for Ordinary Expenses of Private Schools From the Promotion and Mutual Aid Corporation for Private Schools of Japan.
Ethical approval
The study protocol was approved by the Ethics Committee of Juntendo University Hospital (Approval No. 632).
Guarantor
SH and TM.
Contributorship
YK, SH, and TM researched literature and conceived the study. SH, EN, SM, and TM were involved in protocol development, gaining ethical approval, patient recruitment. TU, SH, YF, KS, AH, and YH were conducted data measurements and statistical analysis. YK, SH, and TM wrote the first draft of the manuscript. All authors confirm that they have contributed to the intellectual content of this paper and met the following three requirements: (a) significant contributions to the study conception and design, data acquisition, or analysis and interpretation of the data; (b) drafting or revising the article for intellectual content; and (c) final approval of the published article.