
Abstract
Background
Isoelectric focusing (IEF) is a method with an exquisite resolution, and coupled with affinity immunoblotting (AIB), it can provide superior sensitivity to detect monoclonal free light chains (FLC).
Methods
We tested the hypothesis that IEF/AIB is more sensitive and specific for monoclonal FLC detection in serum and urine samples than conventional methods, that is, electrophoresis (ELP), immunofixation (IF) and serum FLC ratio assessment. Investigation included 107 samples of 68 patients, among which 21 multiple myeloma patients were recently tested for minimal residual disease and 18 patients with AL amyloidosis.
Results
Monoclonal FLC were detected by IEF/AIB in 37% of serum samples negative for monoclonal FLC on ELP/IF. As for urine samples, significant advantage of the IEF/AIB over ELP/IF was not demonstrated. Considering both serum and urine results, IEF/AIB definitely revealed monoclonal FLC in 20/83 (24%) of ELP/IF-negative samples. FLC ratio was abnormally high (>1.65) in all 11 patients definitely positive for monoclonal FLC kappa by IEF/AIB but also in 16/47 (34%) IEF/AIB-negative samples. Abnormally low values (<0.26) were found only in 10/28 samples (36%) positive for monoclonal FLC lambda. Appropriate use of renal FLC ratio reference range reduced the number of presumably false positives (6/47, i.e. 13%) but not false negatives (17/28, i.e. 61%).
Conclusions
The IEF/AIB method is more sensitive than IF and might be used in patients with negative IF results before deciding whether to proceed to minimal residual disease testing.
Keywords
Introduction
Isoelectric focusing (IEF) is a method with an exquisite resolution. Several studies were performed in the 1980s and 1990s that used it to diagnose and monitor patients with monoclonal gammopathies. However, despite promising results1–9 and reports of solving difficult cases, 10 the method is rarely used for this purpose. Many laboratories use IEF to detect oligoclonal IgG bands in cerebrospinal fluid, mostly using commercial kits from Sebia or Helena Companies that are suitable for separation and detection of oligoclonal as well as monoclonal IgG 11 but may be suboptimal for detection of other immunoglobulins or free light chains.
Considering several new and highly effective treatment options for patients with multiple myeloma and other lymphoproliferative disorders accompanied by the presence of a monoclonal protein, as well as substantial costs and invasivity of minimal residual disease (MRD) assessment, we speculated that IEF followed by affinity immunoblotting (AIB) might be a suitable test for those patients fulfilling criteria for complete remission using conventional laboratory methods of monoclonal protein detection – electrophoresis (ELP) and immunofixation (IF). The other test used in monoclonal gammopathies is the quantitative determination of free light chains (FLC) in serum and their ratio. However, guidelines published so far12,13 rely only on one of several available tests, namely, Freelite™ (The Binding Site) assay. FLC ratio reference range (0.26–1.65) derived from the old study of Katzmann et al. 14 is still used in these guidelines, although several authors showed substantially different ratios in patients without monoclonal gammopathy in more recent studies.15–20 In addition, abnormal FLC kappa/lambda ratio has been observed following autologous stem cell transplantation (ASCT) and attributed to ‘regenerative’ oligoclonal response; the authors conclude that abnormal FLC kappa/lambda ratio per se should not exclude stringent complete response in patients with ASCT. 21
Because monoclonal FLC component often accompanies monoclonal immunoglobulin, we started with detection of FLC using IEF followed by AIB, a method that was shown to have a sensitivity of approximately 1–2 ng FLC protein per lane.18,22,23 This method was used in a previous study to investigate FLC monoclonality in serum samples with an abnormal FLC ratio, 18 but its performance in serum and urine samples, compared to conventional methods, has not been systematically evaluated previously.
Material and methods
Reagents and accessories
Sodium dihydrogen phosphate dihydrate, disodium hydrogen phosphate dihydrate, hydrochloric acid, acetic acid, sodium hydroxide and glutaraldehyde were obtained from Penta (Czech Republic); all reagents were analytical grade. Glycerol (Ref. 094580) was from Fluorochem Ltd (Hadfield, Glossop, United Kingdom). Polyacrylamide IEF gels (pH 3–10) were from Electrophoresis Development and Consulting Company (Tübingen, Germany). Subsequently, we used IEFGel 3–10 (Ref. edc-1010, 250 ∙ 110 ∙ 0.5 mm, without slots), IEFGel 3–10 40S (Ref. edc-1008, 250 ∙ 110 ∙ 0.65 mm, 40 slots à 10 μL) and IEFGel 3–10 24S (Ref. edc-1009, 250 ∙ 110 ∙ 0.65 mm, 24 slots à 20 μL). Agarose IEF (Ref. 17046801), Pharmalyte™ 3–10 (Ref. 17045601), electrode strips (Ref. 18100440), EPH EL wicks 104 ∙ 253 mm (Ref. 80112952) and Amersham™ Protran™ Premium 0.45 µm membrane (Ref. 10600003) were from Cytiva (Marlborough, United States). Tween®20 (molecular biology grade, Ref. 39796.01), Albumin Bovine Fraction V (receptor grade, Ref. 11924.02), GEL-FIX™ for Agarose (Ref. 4298201) and Applicator strips 3.5 ∙ 2 (43 slots, Ref. 42899.01) were from Serva Electrophoresis GmbH (Heidelberg, Germany). D-Sorbitol ≥99.5%, BioUltra (Ref. 85529-2506) and Tris(hydroxymethyl)aminomethane ≥99.8%, ACS Reagent grade (Ref. 252859-5006) were from Sigma-Aldrich (St. Louis, United States).
Polyclonal rabbit anti-human kappa free light chains (Ref. A0100) and anti-human lambda free light chains (Ref. A0101) were from Dako/Agilent Technologies, Singapore. These antibodies were used unconjugated for membrane coating at 20 mg/L concentration. The same antibodies were biotinylated using EZ-Link NHS-PEG4-Biotinylation Kit (Ref. 21455, Thermo Fisher Scientific, Rockford, USA) and used for detection (at 4 mg/L concentration). Using the HABA assay (reagents provided in the kit), the calculated average number of biotines per biotinylated antibody molecule were 8.0 for anti-free kappa and 7.4 for anti-free lambda antibody.
Streptavidin-alkaline phosphatase (Ref. SA-5100-1) and 5-bromo-4-chloro-3-indolyl phosphate/nitroblue tetrazolium substrate kit (BCIP/NBT, Ref. SK-5400) were from Vector Laboratories (Newark, CA, United States).
Routine electrophoresis and immunofixation
Serum and urine protein electrophoresis (ELP) was performed on Hydrasys 2 apparatus (Sebia, Evry Cedex, France) using Hydragel 30 β1-β2 kit (Ref. 4141). Immunofixation electrophoresis (IF) was performed using either Hydragel 12 IF Penta kit (Ref. 4342) or Hydragel 4 IF kit (Ref. 4304) depending on electrophoresis result and patient’s history. IEF/AIB results were compared to IF results as well as compound ELP/IF result since IF was not always performed if a known monoclonal component was apparent already on ELP or if ELP as well as previous two IF (the last one conducted within 3 months from the date of examination) were negative.
Isoelectric focusing and affinity immunoblotting
Samples were diluted with 0.1% NaCl/15% glycerol. Serum was diluted 1/60 and urine 1/20 or (if urine total protein was ≤0.1 g/L) 1/10. For agarose IEF, 7 μL of each diluted sample was applied 2 cm from the anode using sample applicator strip. 1.3% agarose gels containing 12% sorbitol and 6.7% (v/v) Pharmalyte 3–10 were prepared in the laboratory 1 day before use. GEL-FIX™ for Agarose was used for agarose gel coating. Anode electrode strip was soaked in 0.25 M acetic acid and cathode strip in 0.25 M NaOH. Basically, IEF was carried out according to Westermeier 24 using the following settings: (1) 150 V, 30 mA, 5 W for 30 min (sample entrance); (2) 1500 V, 15 mA, 8 W for 50 min (focusing); and (3) 1500 V, 15 mA, 10 W for 10 min (a step added for band sharpening).
For polyacrylamide (PAA) IEF, samples were treated as for agarose IEF. 7 µL of samples were applied via sample applicator strip onto IEFGel 3–10; 10 µL were used for IEFGel 3–10 40S and 20 µL for IEFGel 3–10 24S (in the latter two cases, samples were applied into preformed sample slots). Electrodes were placed directly on the gel without using electrode strips. IEF was carried out according to manufacturer’s recommendation. For 0.5 mm thick gels, these were (1) 500 V, 8 mA, 5 W for 30 min (sample entrance); (2) 1650 V, 12 mA, 10 W for 90 min (focusing); and (3) 1800 V, 12 mA, 20 W for 30 min (band sharpening). For 0.65 mm thick gels, higher current and power limits were set as recommended: (1) 8 mA, 10 W; (2) 22 mA, 15 W; and (3) 22 mA, 20 W.
Both agarose and PAA IEF were carried out at 8°C on the Blue Horizon System (Ref. HPE-BH, Serva Electrophoresis GmbH, Heidelberg, Germany). Interelectrode distance was 10 cm.
Affinity immunoblotting and immunodetection were essentially performed as described earlier.18,22,23 Briefly, nitrocellulose membranes were incubated with a solution of rabbit anti-free kappa and anti-free lambda antibodies in Tris-buffered saline (TBS, pH 7.6) for at least 4 h or overnight at room temperature. Next, membranes were washed in TBS, blocked with TBS-3% BSA for 75–90 min, washed twice in TBS, and immediately after separation, placed onto the gel, followed by 1 layer of filter paper moistened in TBS, 5 layers of dry filter paper, a glass plate and a weight. Blotting was performed for 50 min. After brief wash, the proteins on the membrane were fixed in 0.25% glutaraldehyde for 15 min at 4°C. After three washes in TBS, membranes were re-blocked in TBS-0.3% BSA for 15 min and incubated in solution of biotinylated anti-free kappa and anti-free lambda antibodies in TBS-0.3% BSA for 90 min. Next, membranes were washed in TBS, twice in TBST and finally in TBS again and incubated with streptavidin-ALP solution diluted 1/800 in TBS-0.3% BSA. After 50 min incubation and identical washing procedure, staining was performed in the dark using BCIP/NBT kit until a suitable colour developed (30–40 min).
Evaluation of isoelectric focusing/affinity immunoblotting results
One of the authors (D.Z.) performed all evaluations. Results were classified as monoclonal (m), monoclonal + oligoclonal (m + o), oligoclonal (o) or negative (n). Membranes were evaluated after each run. In addition, all membranes were visually inspected 1 month after completion of the study and evaluated in a blinded fashion. Appropriate statistical analyses were performed separately for the first and revised evaluation. An overall result of each separation was categorized as definite (concordant evaluation) or equivocal (discordant evaluation). Subsequently, samples (serum or paired serum + urine) were classified as undoubtedly negative if all runs were devoid of a monoclonal FLC component (both at the initial evaluation and reevaluation); undoubtedly positive if monoclonal component was consistently seen both at the initial evaluation and reevaluation and if at least one of these two evaluations was positive in at least two runs; probably positive if monoclonal component was noted in only one run at both evaluations; and equivocally positive if monoclonal component was only seen at one of the two evaluations. Based on the uncertainty in evaluation, two additional samples with monoclonal FLC lambda component visible in serum and urine at the initial evaluation but only in urine sample separated in agarose (but neither in serum PAA or AGA or urine PAA) at reevaluation were classified as probable FLC lambda. One sample evaluated as positive for both monoclonal FLC kappa and lambda in urine, but negative serum was classified as probable FLC kappa and lambda since such result was thought to be inconclusive. One serum sample with monoclonal FLC kappa and oligoclonal FLC lambda (identical classification both at the initial evaluation and reevaluation) was classified as probable FLC kappa (this was an exceptional sample separated in one gel only; urine sample was not available).
During the study, we switched from polyacrylamide gel without sample slots to a gel with 40 preformed slots because of a tendency of sample spilling into neighbouring lanes when using sample applicator strip in PAA (notably, this was not a problem when using the same applicator strip on agarose gel). Results from these two types of gels were evaluated jointly. Results of separation in PAA gel with 24 slots were evaluated separately because of the substantially higher volume of sample applied.
Serum free light chains, beta2-microglobulin and creatinine
Serum FLC kappa and lambda were measured on an Optilite™ analyser (The Binding Site/Thermo Fisher Scientific) using dedicated kits (Ref. LK016.OPT and LK018.OPT). Beta2-microglobulin and creatinine were measured on Cobas 8000 analyser (module C702, Roche) using appropriate kits (Ref. 08047499190 and 06407137190, respectively). Estimated glomerular filtration rate (eGFR) was calculated according to the CKD-EPI creatinine equation. 25
Minimal residual disease assessment
MRD was assessed using the flow cytometry by panel for highly sensitive MRD detection in multiple myeloma. 26 In brief, the method is based on an optimized eight-colour, two-tube antibody panel for accurate identification of phenotypically aberrant, clonal plasma cells. Data acquisition and analysis was performed in a DxFlex flow cytometer using the CytExpert software (Beckman Coulter).
Samples
Samples sent for routine monoclonal protein detection were used, initially based on the result of routine tests, excluding samples with involved FLC concentration ≥1000 mg/L, FLC ratio ≥100 or ≤0.01 or FLC band readily apparent on serum ELP. Next, consecutive samples were obtained from 21 patients (31 samples) with multiple myeloma (MM) that had been tested for minimal residual disease (MRD) within 12 months (range, 1–12 months) before the beginning of the study and 18 patients (42 samples) with confirmed AL amyloidosis. All samples were used after standard ELP and (if requested or indicated based on patient’s history and electrophoresis result) IF studies. Several additional cases were examined by the IEF/AIB method based on either laboratory indication or clinician’s request. In total, 29 patients (34 samples) not included in the MM-MRD or AL amyloidosis groups were examined.
Statistics
MedCalc® Statistical Software version 22.007 (MedCalc Software Ltd, Ostend, Belgium; https://www.medcalc.org; 2023) was used for statistical analysis. χ2 test or Fisher exact test were performed for categorical comparisons. Kappa statistics was used to assess agreement between methods; McNemar test was applied in order to compare sensitivity of methods for monoclonal FLC detection. Kruskal–Wallis test with post-hoc analysis (Conover) was used to compare continuous variables (FLC, beta2-microglobulin, creatinine and eGFR) among groups with categorically defined IEF/AIB results. Correlations between continuous variables were assessed using Pearson’s or Spearman’s rank correlation coefficient as appropriate.
Ethical approval
The study was approved by the University Hospital Brno Ethics Committee on 13 April 2022 (reference number 03-130422).
Results
Detection limit was verified by analysing serum samples with known monoclonal FLC component. The concentration of the involved FLC was measured using the Freelite™ assay, and samples were diluted to concentrations ranging from 0.01 to 1.0 mg/L. Although results were slightly different using different samples, FLC kappa were generally visible down to 0.05–0.1 mg/L and FLC lambda down to 0.1–0.2 mg/L. Representative experiments are depicted in Supplemental Material, Figure S1.
A total of 107 serum and 86 urine samples were evaluated. First, we compared result on the initial evaluation and reevaluation (Supplemental Material I, Tables SI/1-SI/2). Regarding the monoclonal component, reevaluation yielded different results in 2.0–8.1% for serum and 0–7.5% for urine, with no apparent difference among gels or between kappa and lambda FLC. Kappa statistics revealed very good agreement (>0.8) for all but two comparisons; it was slightly lower (K 0.776) for urinary FLC lambda separated on PAA gel and not reliably evaluable for serum FLC kappa separated on PAA gel with 24 slots because of too low number of positive samples. Judging of oligoclonality was less reproducible; reevaluation revealed different result in 4.0–16.2% of serum samples and 2.3–14.5% of urine samples, more frequently for FLC kappa than FLC lambda in both agarose and PAA gels. We did not analyse oligoclonality further in this study.
Next, we compared results obtained using agarose and PAA gels for serum and urine (Supplemental Material I, Tables SI/3-SI/6), yielding different results in 0–5.4% for serum FLC kappa, 3.3–10.8% for serum FLC lambda, 2.5–3.7% for urine FLC kappa and 10–12.5% for urine FLC lambda. Agreement between methods was mostly good (K values 0.569–0.954), and significant differences in sensitivity for detection of monoclonal FLC were not observed (McNemar test, all p values >0.05).
Comparing results of paired serum and urine analyses, we noted that there was almost perfect agreement for FLC kappa while 12.7–20.9% of samples had monoclonal FLC lambda detectable in serum only; the opposite (monoclonal FLC lambda in urine only) was only rarely observed (0–3.8% of samples). The difference was seen for both agarose (McNemar test, p .0001 and .0004 for original and revised results, respectively) and PAA, although for the latter, it was only significant for revised results (McNemar test, p .0923 and .0127 for original and revised results, respectively). Details are provided in Supplemental Material I, Tables SI/7-SI/8.
IEF/AIB was clearly more sensitive compared to ELP/IF for detection of monoclonal FLC in serum samples (McNemar test, p < .0001 for agarose as well as PAA IEF/AIB compared to IF or ELP/IF; p .03 and p .0002 for PAA24S IEF/AIB compared to IF or ELP/IF, respectively). For urine samples, no significant difference was demonstrated between IF or ELP/IF and IEF/AIB regarding the sensitivity of monoclonal FLC detection (McNemar test, all p values > .05). The proportion of ambiguous IEF/AIB results varied between 3.6% and 11.3% in these comparisons, with no apparent difference between agarose and PAA or between serum and urine. For detailed results see Supplemental Material II.
Overall ELP/IF versus overall IEF/AIB results.
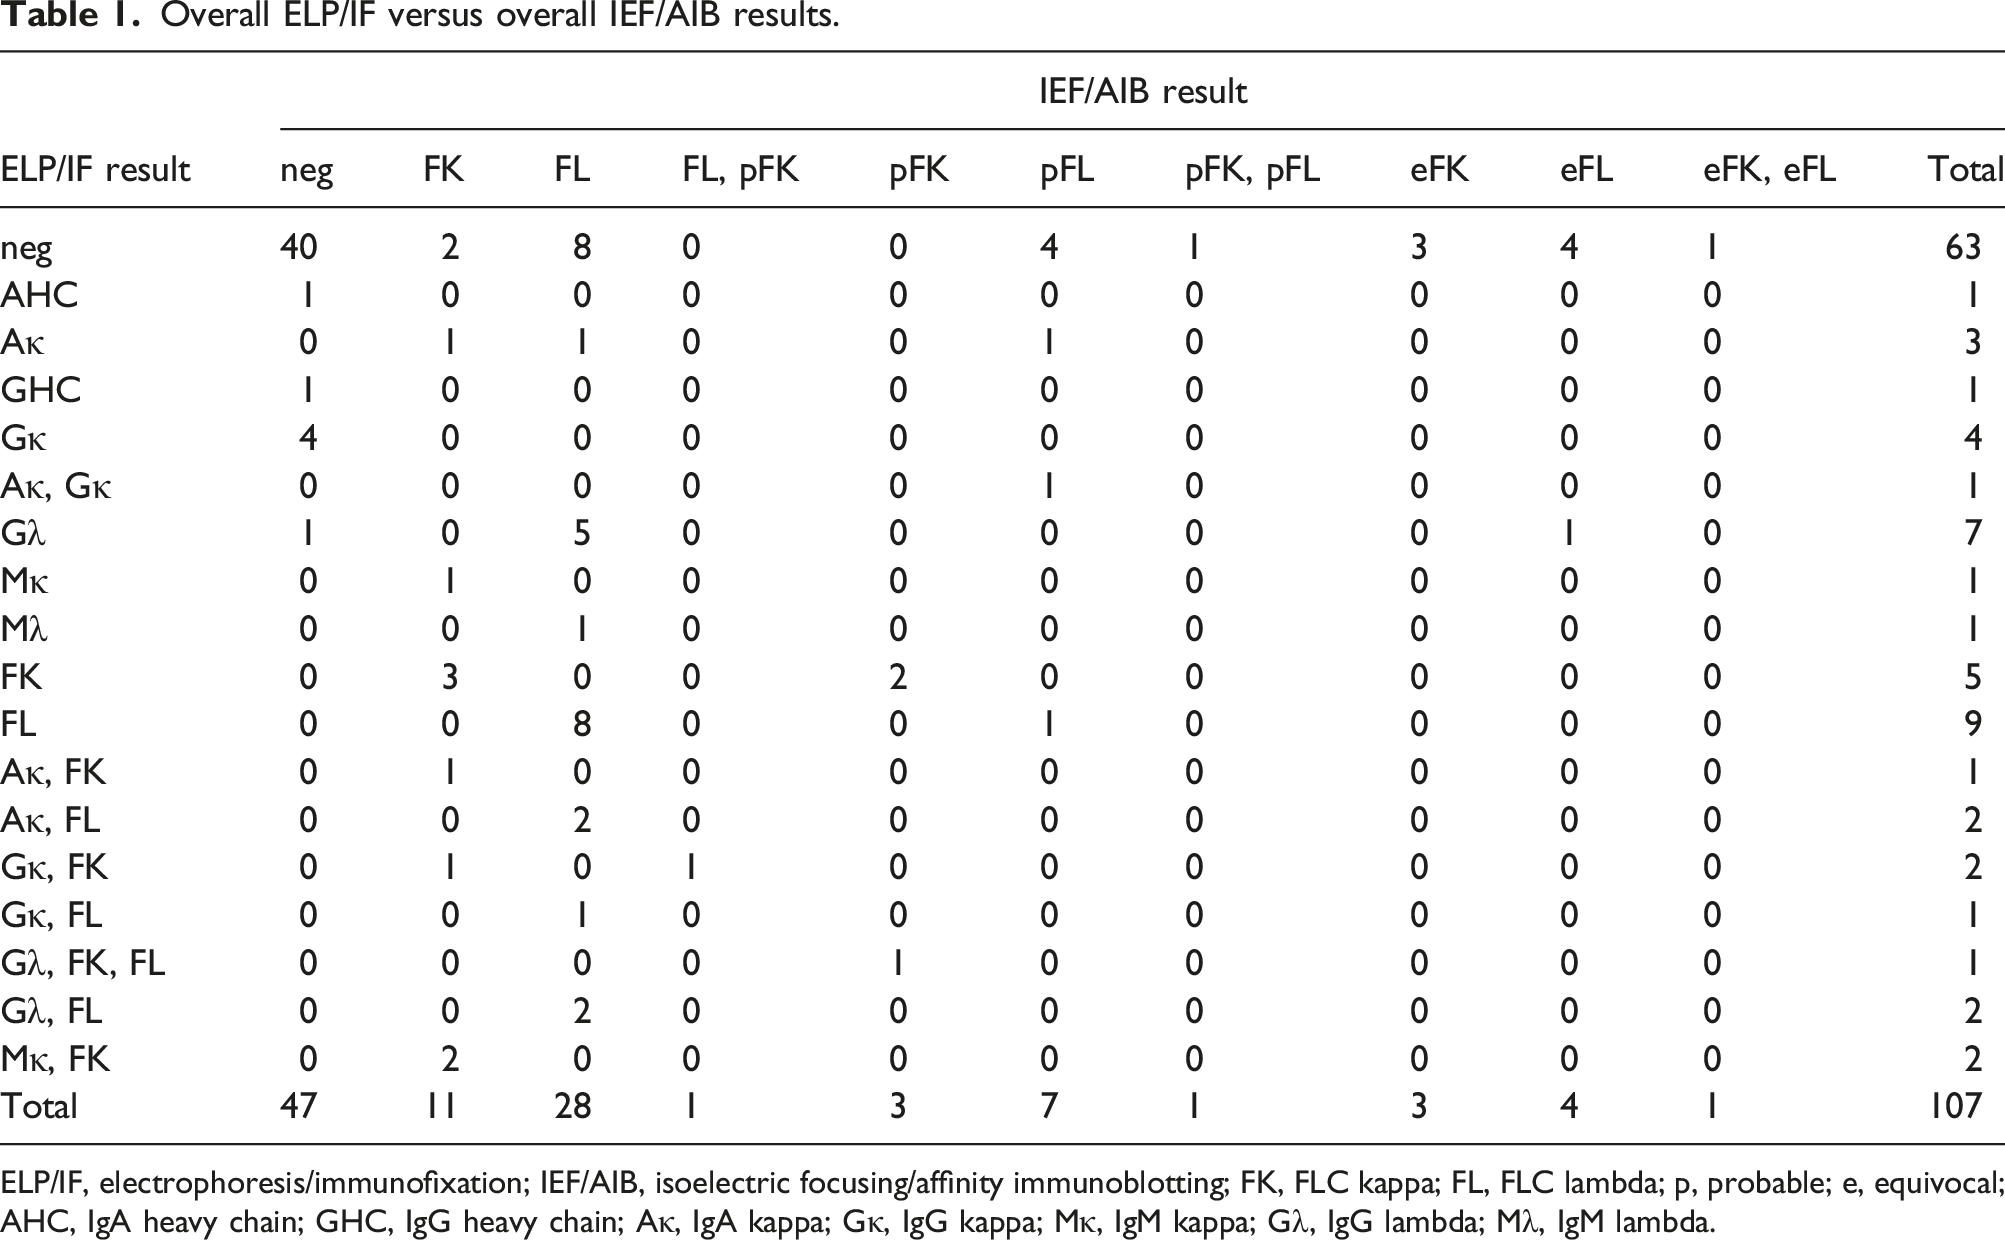
ELP/IF, electrophoresis/immunofixation; IEF/AIB, isoelectric focusing/affinity immunoblotting; FK, FLC kappa; FL, FLC lambda; p, probable; e, equivocal; AHC, IgA heavy chain; GHC, IgG heavy chain; Aκ, IgA kappa; Gκ, IgG kappa; Mκ, IgM kappa; Gλ, IgG lambda; Mλ, IgM lambda.
Considering positivity of FLC monoclonal component only, IEF/AIB was definitely positive in 20/24 (83.3%) ELP/IF-positive samples (the remaining 4 cases were classified as probable) as well as in 19/82 (23.2%) ELP/IF-negative samples. 20/106 (18.9%) samples yielded ambiguous IEF/AIB results. In one sample, there was discrepancy in monoclonal FLC type between ELP/IF and IEF/AIB (see Figure 2), but it was the IEF/AIB method that revealed the original FLC lambda paraprotein. Hence, in 20/83 samples (24.1%), monoclonal FLC component was detected by IEF/AIB that would have been missed by ELP/IF. Comparing overall ELP/IF and IEF/AIB results, IEF/AIB was significantly more sensitive for detection of monoclonal FLC component (McNemar test, p < .0001 if only definite IEF/AIB results are taken into account; p = .0015 if ambiguous IEF/AIB results are regarded as negative).
Taken into account only definite IEF/AIB results, we assessed the concordance of FLC type to the LC of the monoclonal component (in samples with complete MIg only on ELP/IF): 8 concordant (one each of IgAκ and IgMκ on ELP/IF and FLCκ on IEF/AIB, 5 IgGλ and 1 IgMλ on ELP/IF and FLC λ on IEF/AIB), and 1 discordant (IgAκ on ELP/IF and FLCλ on IEF/AIB). Pure FLC component was 100% concordant between ELP/IF and IEF/AIB (FLC kappa 3, FLC lambda 8). In 3 patients with discordant free and bound LC on ELP/IF (2 IgAκ + FLCλ and 1 IgGκ + FLCλ), the FLCλ type was concordant on ELP/IF and IEF/AIB.
In 10 samples evaluated as negative by ELP/IF, we were able to clearly demonstrate monoclonal FLC (FLC kappa in 2 and FLC lambda in 8). A representative example is shown in Figure 1. Sample with negative serum and urine immunofixation but clearly positive monoclonal FLC kappa in serum on both agarose and polyacrylamide (40S) IEF/AIB. FLC kappa concentration was 45.03 mg/L (FLC lambda 6.98 mg/L, FLC ratio 6.45, that is, clearly abnormal), corresponding to a concentration of 0.75 mg/L in a sample diluted 1/60.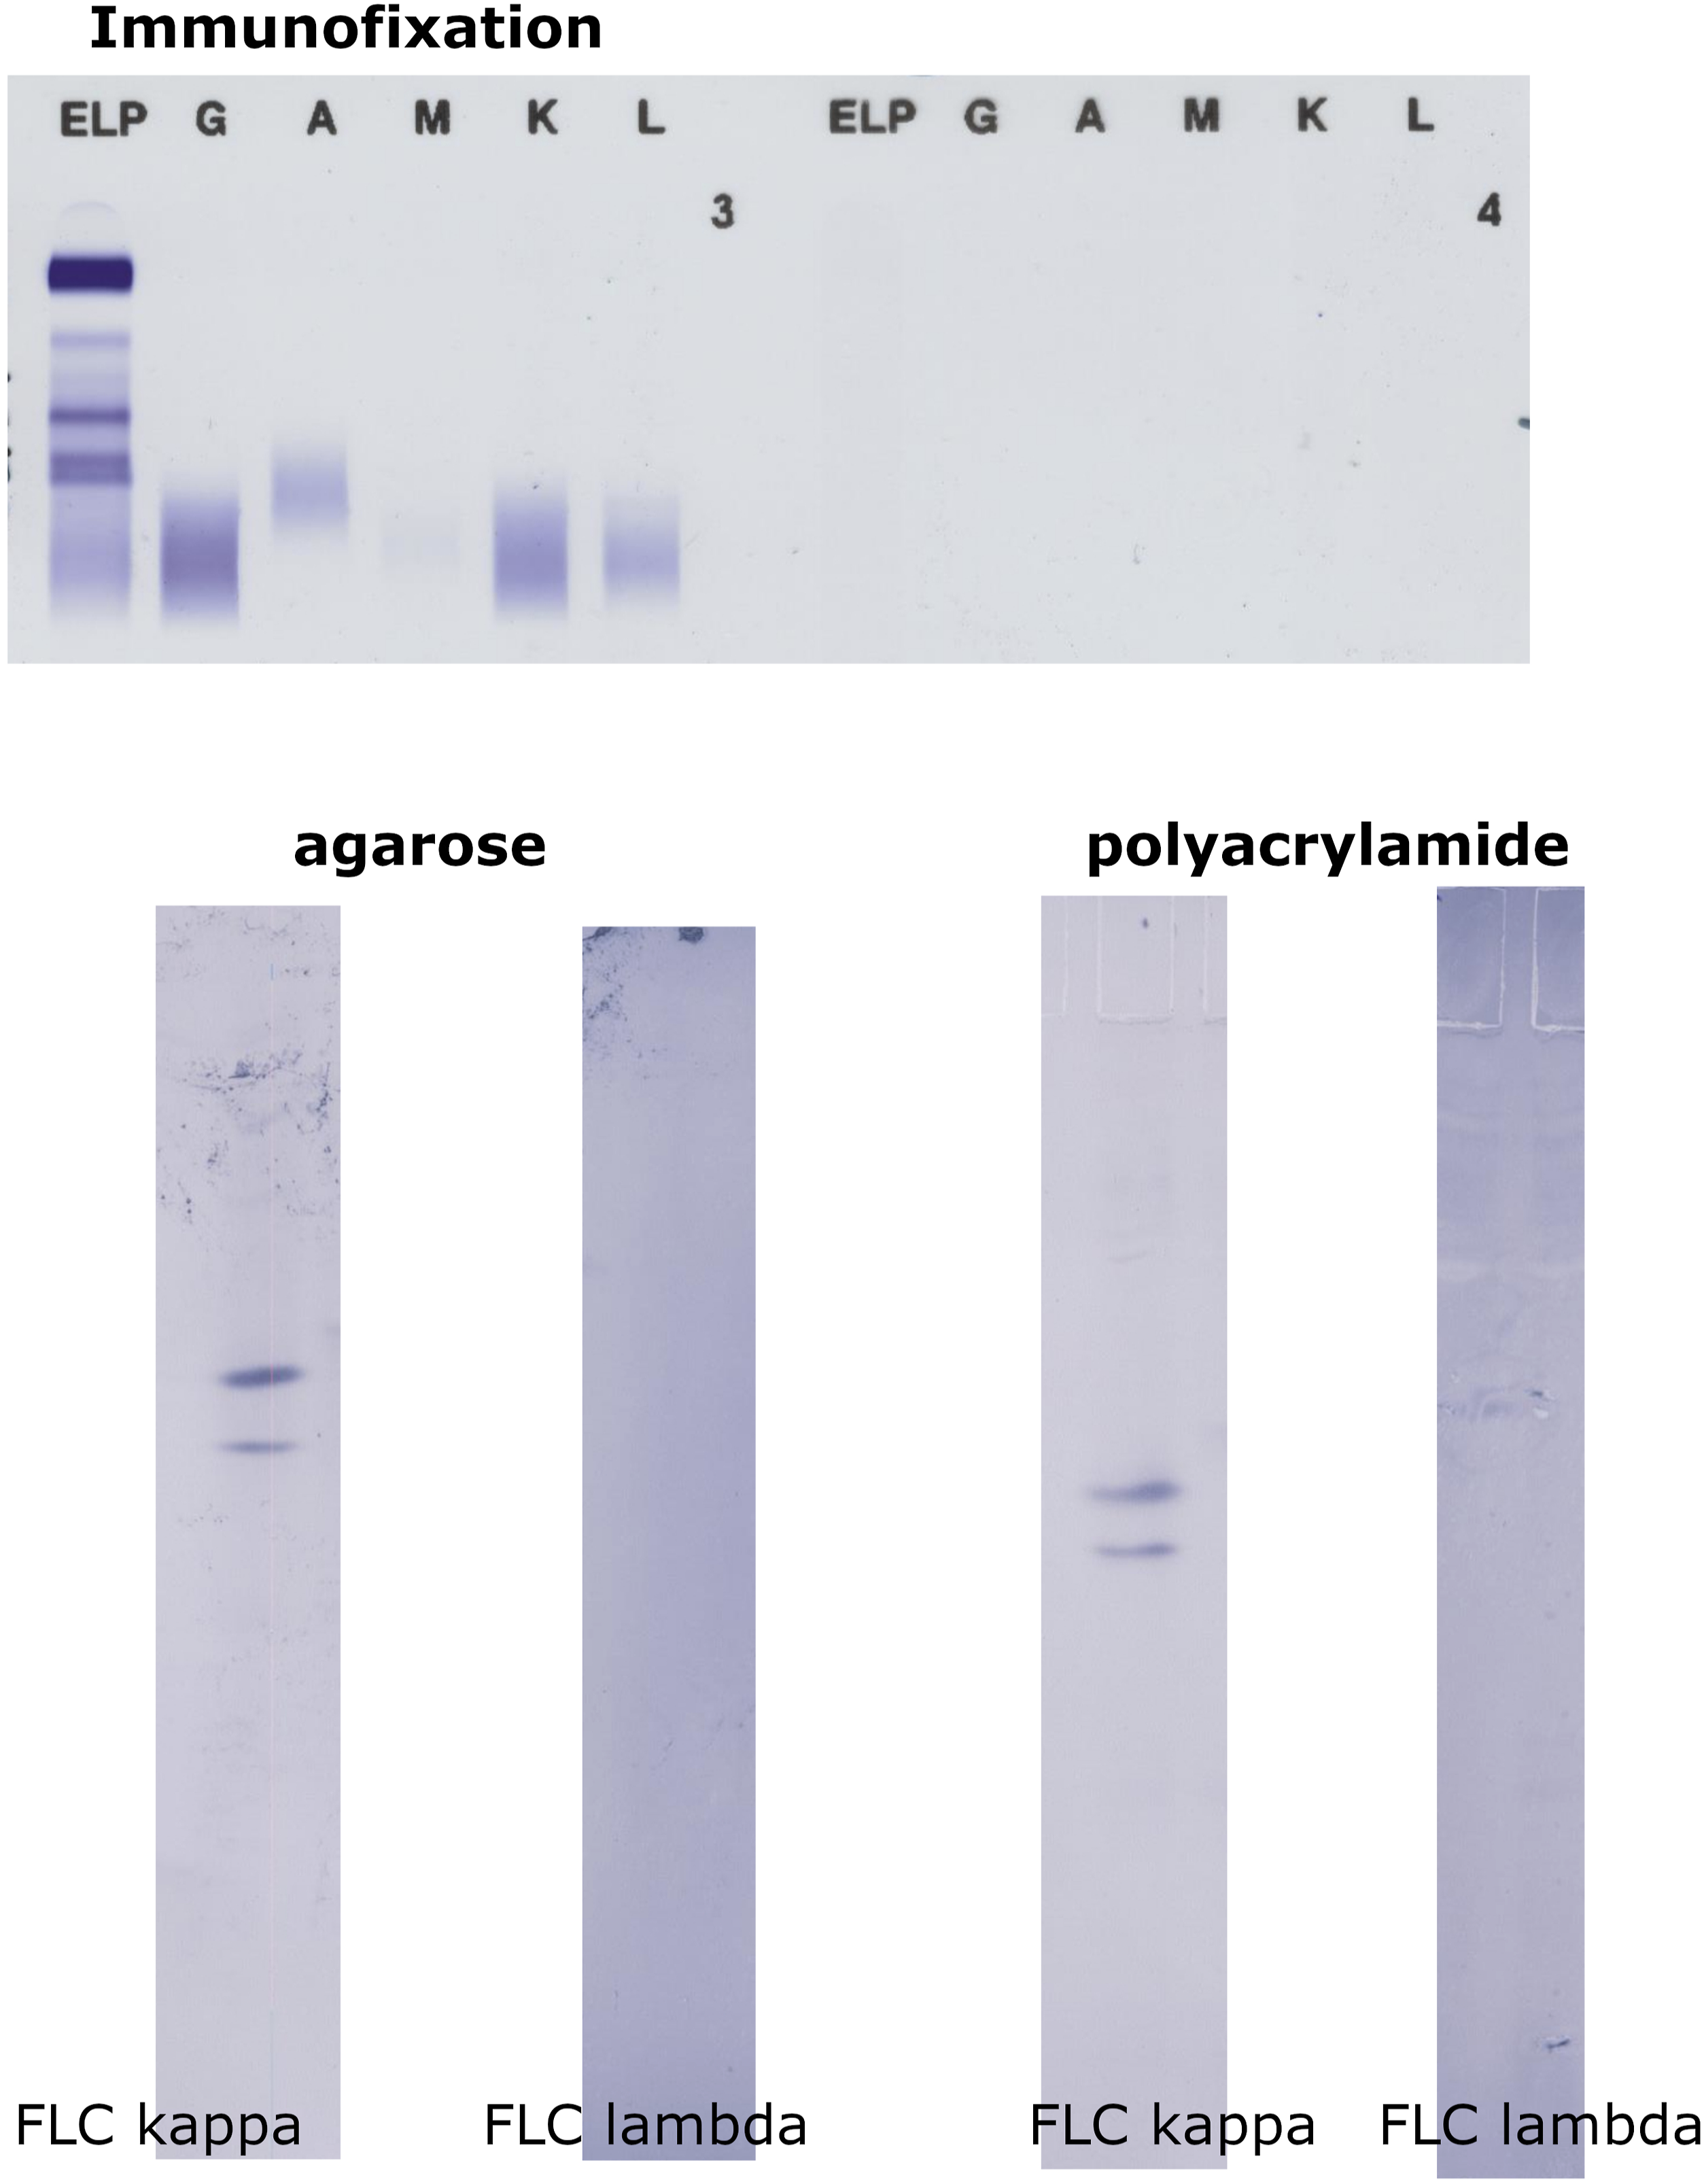
Figure 2 illustrates a more complicated case. The patient had a history of FLC lambda myeloma. On IF, two tiny IgGκ bands were seen in serum (one of them consistent with isatuximab treatment), and FLC kappa band on a polyclonal background is visible in urine. Conversely, all IEF/AIB separations clearly revealed monoclonal FLC lambda in serum (which appeared on serum IF next month and persisted later on). However, the evaluation of the urinary FLC pattern is complicated because of pronounced oligoclonality, and monoclonal FLC kappa (superimposed on an oligoclonal background) were assumed to be present in urine when evaluating agarose IEF/AIB. Hence, the overall IEF/AIB result for this patient is classified as FL and probable FK. PAA24S result was interpreted as monoclonal (FL) in serum and oligoclonal (both FK and FL) in urine, although the interpretation of the urinary finding remains debatable. Results of serum and urine immunofixation and IEF/AIB in polyacrylamide (24S) in a patient with history of FLC lambda MM. While both serum and urine immunofixation and IEF/AIB in urine are difficult to evaluate and interpret, monoclonal FLC lambda can be clearly demonstrated in the serum sample by IEF/AIB. Concentration of serum FLC lambda measured by Freelite™ was 59.23 mg/L (FLC kappa 5.46 mg/L, FLC ratio 0.09, that is, clearly abnormal), corresponding to a value 0.99 mg/L in a sample diluted 1/60. See the text for further details.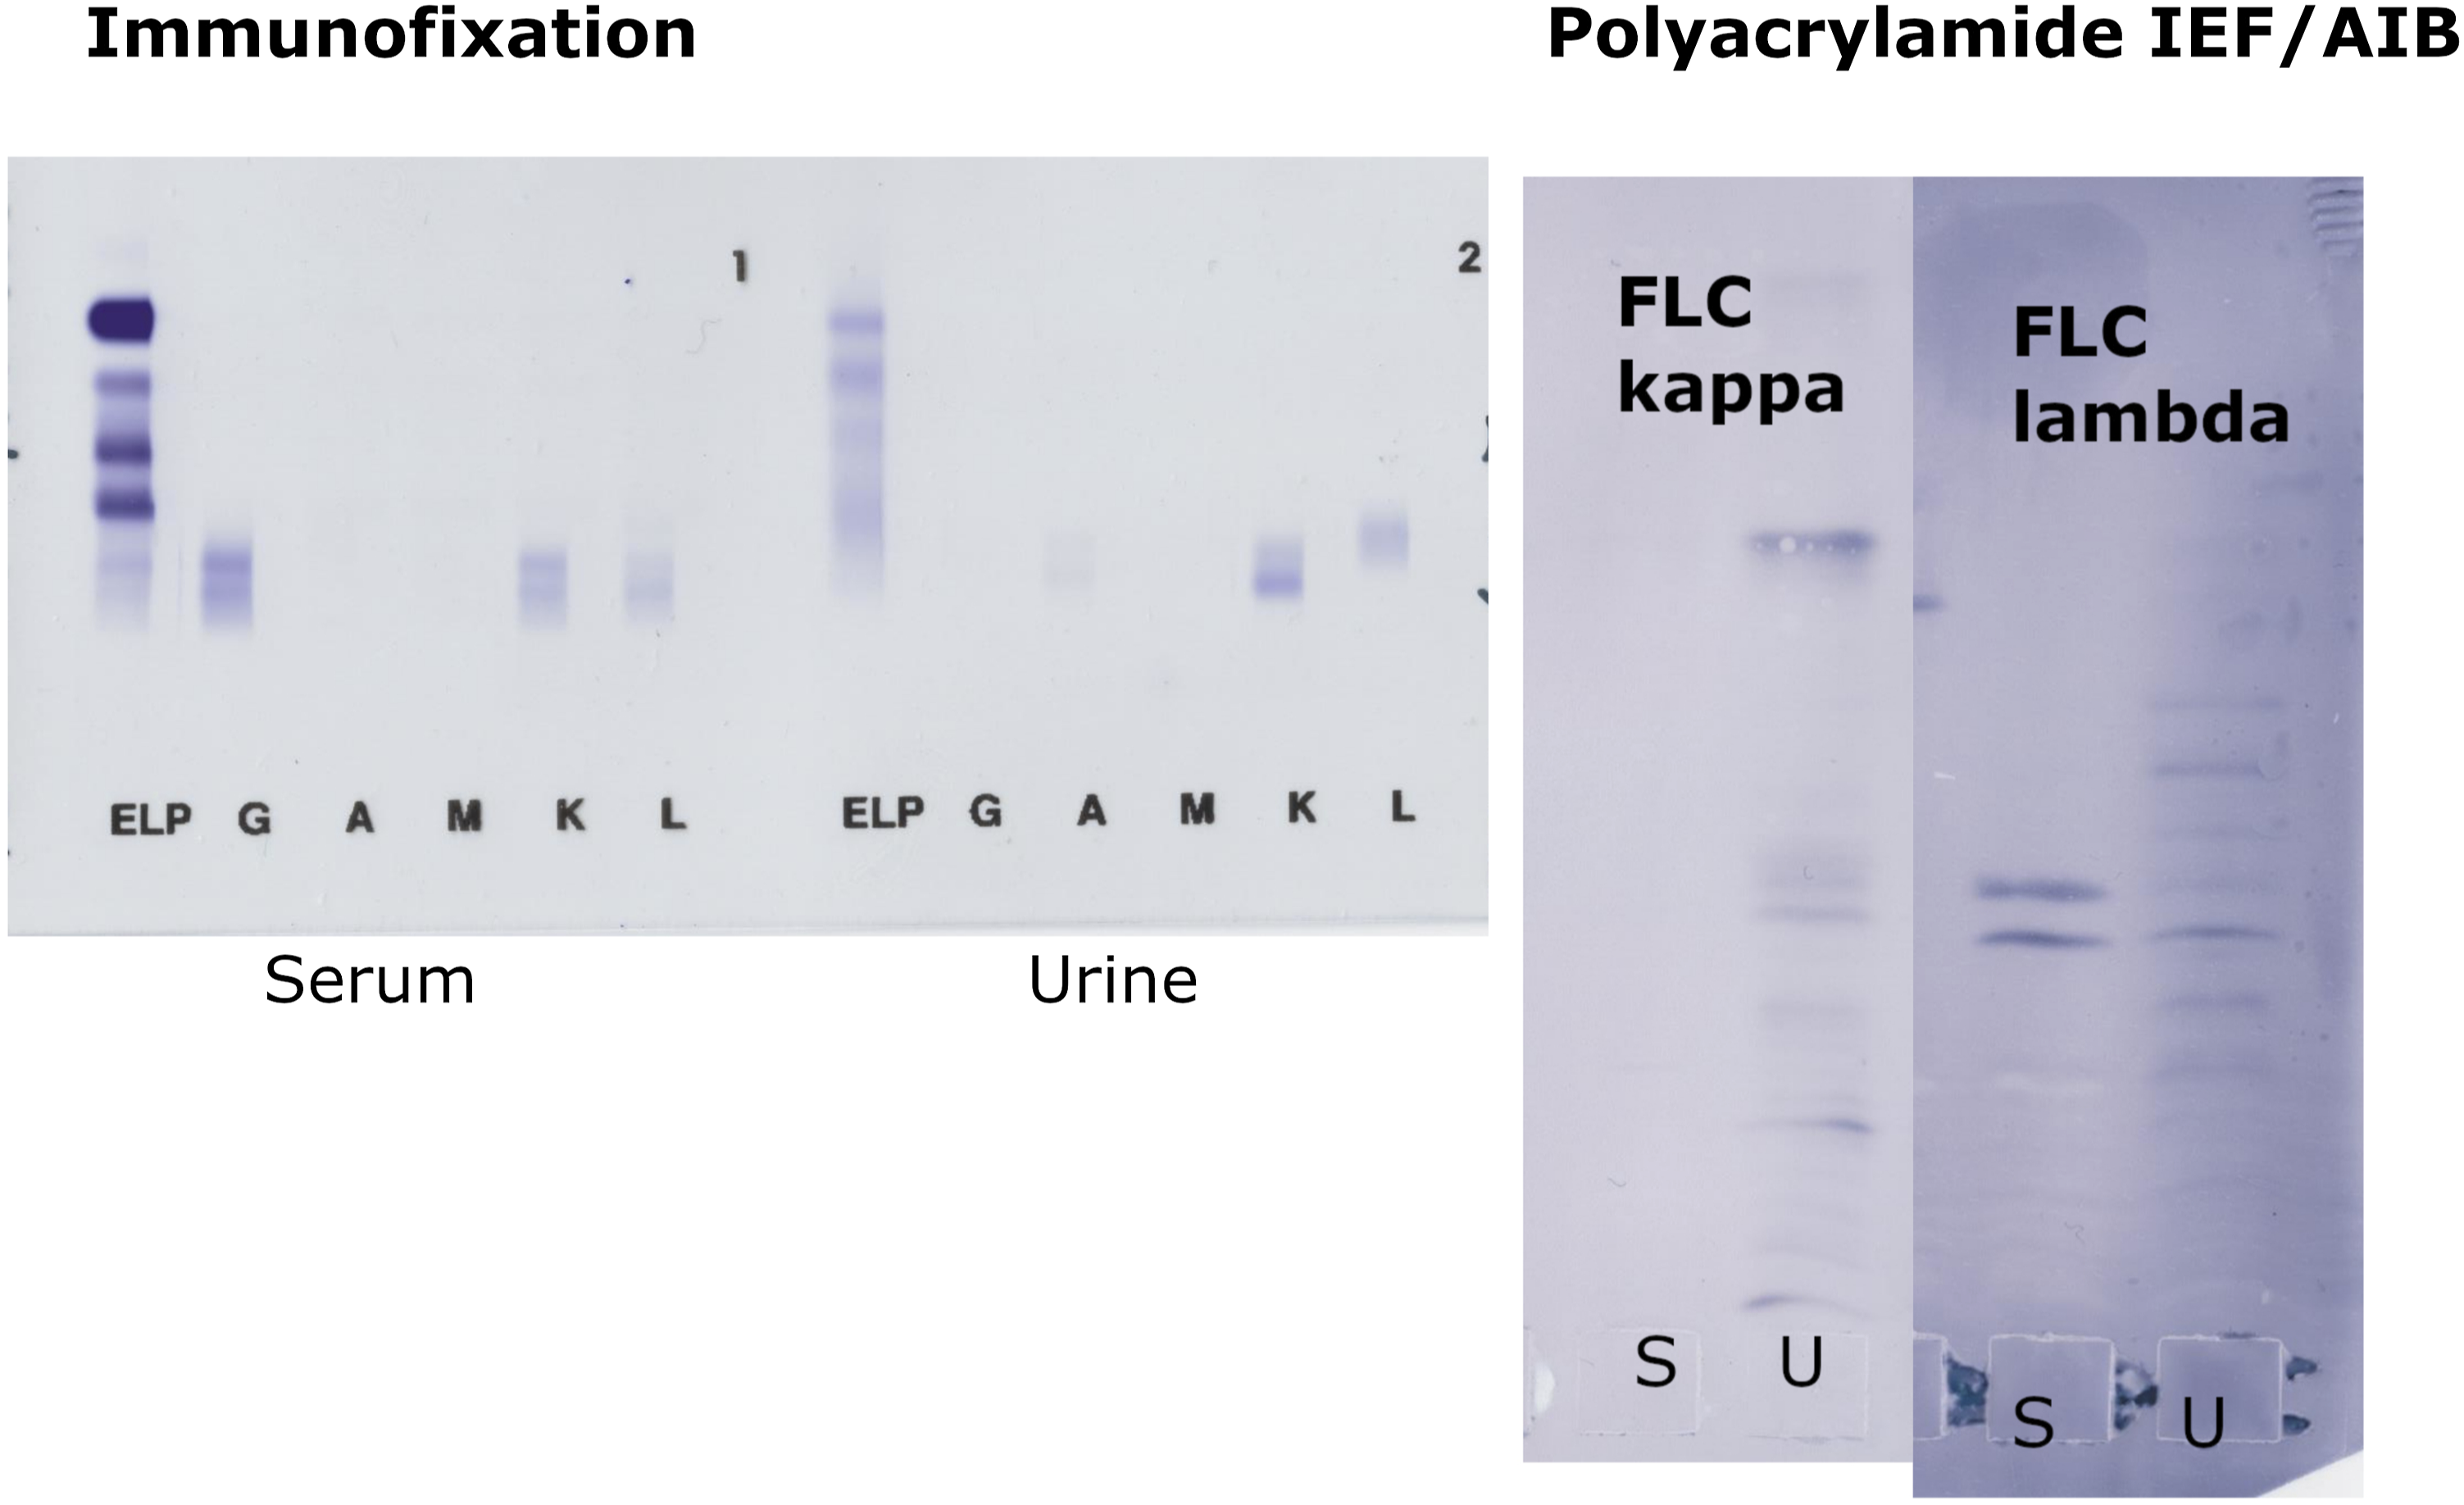
Comparison between isoelectric focusing/affinity immunoblotting results and Freelite™ assays
In 32 samples without FLC M component in serum and urine (both at the initial evaluation and reevaluation in all gels used for the particular sample; oligoclonality was allowed), FLC ratio values were normally distributed with a mean value of 1.52 (SD 0.48; range 0.90–2.82). Serum FLC kappa and FLC lambda concentrations were normally distributed in this group after logarithmic transformation (geometric mean 15.36 mg/L and 10.57 mg/L, range 4.68–105.30 and 2.55–67.91 mg/L, respectively). In a subgroup of 20 patients fulfilling the additional criterion of eGFR >60 mL/min/1.73 m2, FLC ratios, FLC kappa and FLC lambda concentrations were normally distributed after logarithmic transformation. Geometric means, medians and ranges were 1.41, 1.35, 0.90–2.82 for FLC ratio; 14.68, 13.14, 5.17–63.23 for FLC kappa; and 10.43, 11.91, 2.55–29.36 for FLC lambda. The results are shown in Supplemental Material Figures S2 and S3.
When comparing serum FLC concentrations and FLC ratio in samples with definitely negative (n = 47) and definitely positive FLC kappa (n = 11) or FLC lambda (n = 28) results, significant differences among groups were found in both involved FLC concentrations and FLC ratio by Kruskal–Wallis test (p = .003 for FLC kappa and p < .001 for both FLC lambda and FLC ratio) with post-hoc analysis (Conover, p < .05). Figure 3 A–C provide a graphical comparison. Inclusion of a FLC lambda positive case depicted in Figure 2 (excluded from analysis because of possible simultaneous presence of monoclonal FLC kappa in urine) would not change the interpretation. FLC kappa, FLC lambda and FLC ratio values in samples with definitely positive monoclonal FLC kappa or FLC lambda component in serum and/or urine by IEF/AIB compared to definitely negative samples.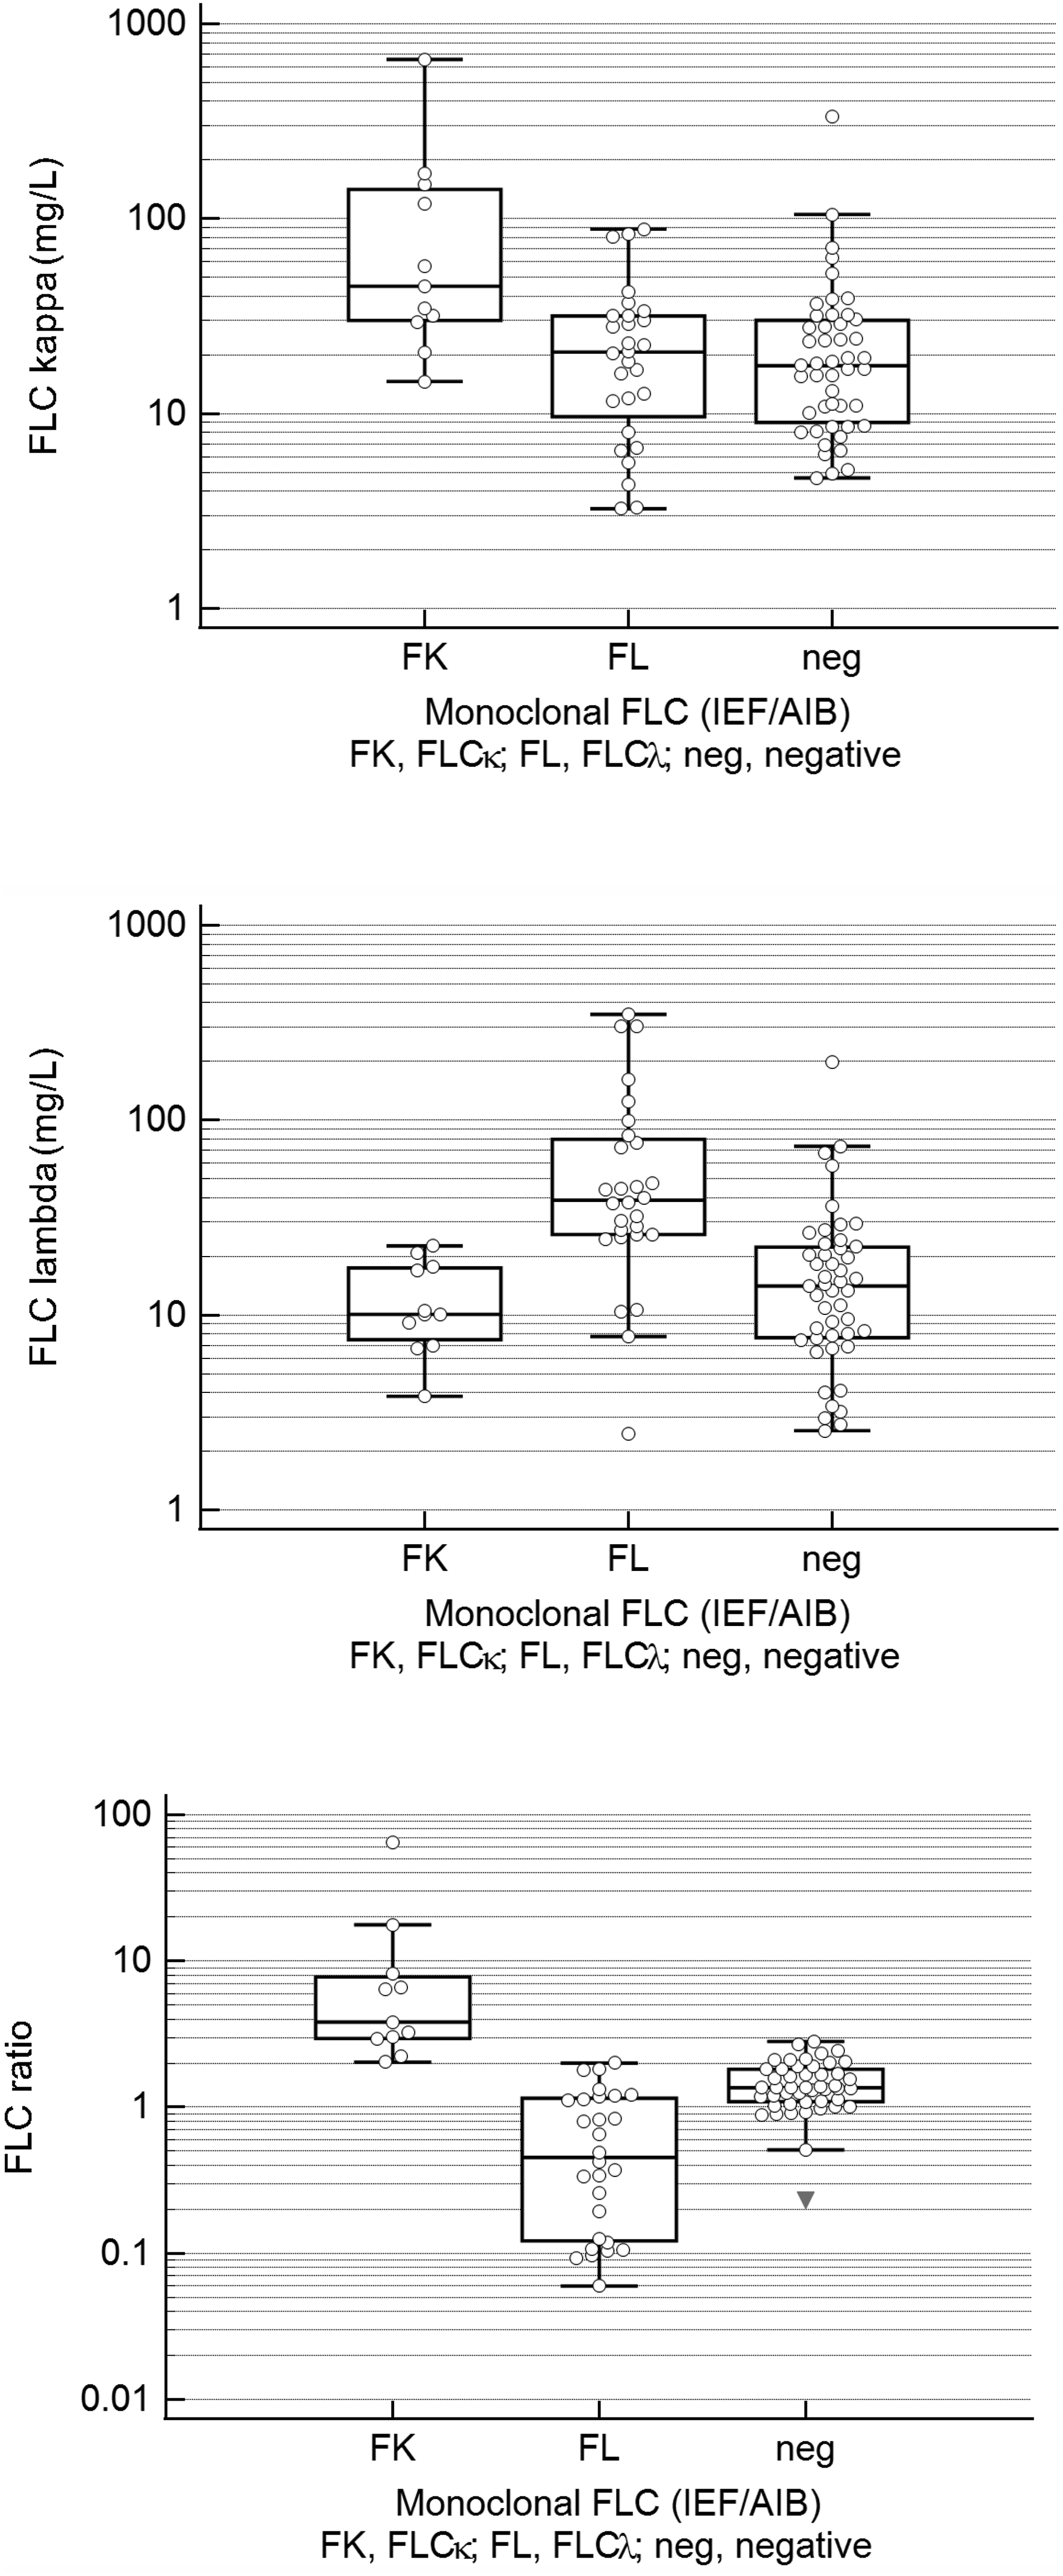
While all samples definitely positive for monoclonal FLC kappa had elevated FLC ratio, this abnormity was also seen in 16 out of 47 (34.0%) IEF/AIB-negative samples and even in 3 out of 28 (10.7%) FLC lambda IEF/AIB-positive samples. Only 10/28 (35.7%) of these samples had ‘true positive’, that is, decreased FLC ratio. It should be critically noted that the only IEF/AIB-negative sample with decreased FLC ratio (0.23) had only serum IEF/AIB analysis performed. This patient had FLC lambda multiple myeloma, leaving the possibility that monoclonal FLC lambda could be detected in urine only.
Although we did not find any significant correlation of FLC kappa and FLC lambda serum concentrations or FLC ratio and serum creatinine levels, and only FLC lambda concentrations correlated significantly with eGFR (Spearman’s ρ-0.232, p .0162) in the whole study group (n = 107), we divided the group of samples with definite IEF/AIB result into those with eGFR >60 mL/min/1.73 m2 and those with eGFR ≤60 mL/min/1.73 m2, and we used renal reference range27,28 for the latter group. Indeed, the number of IEF/AIB-negative samples with increased FLC ratio decreased to 6/47 (12.8%). Yet 17/28 (60.7%) FLC lambda positive samples remained with a normal FLC ratio.
FLC ratio categories in definitely negative or definitely positive IEF/AIB samples.
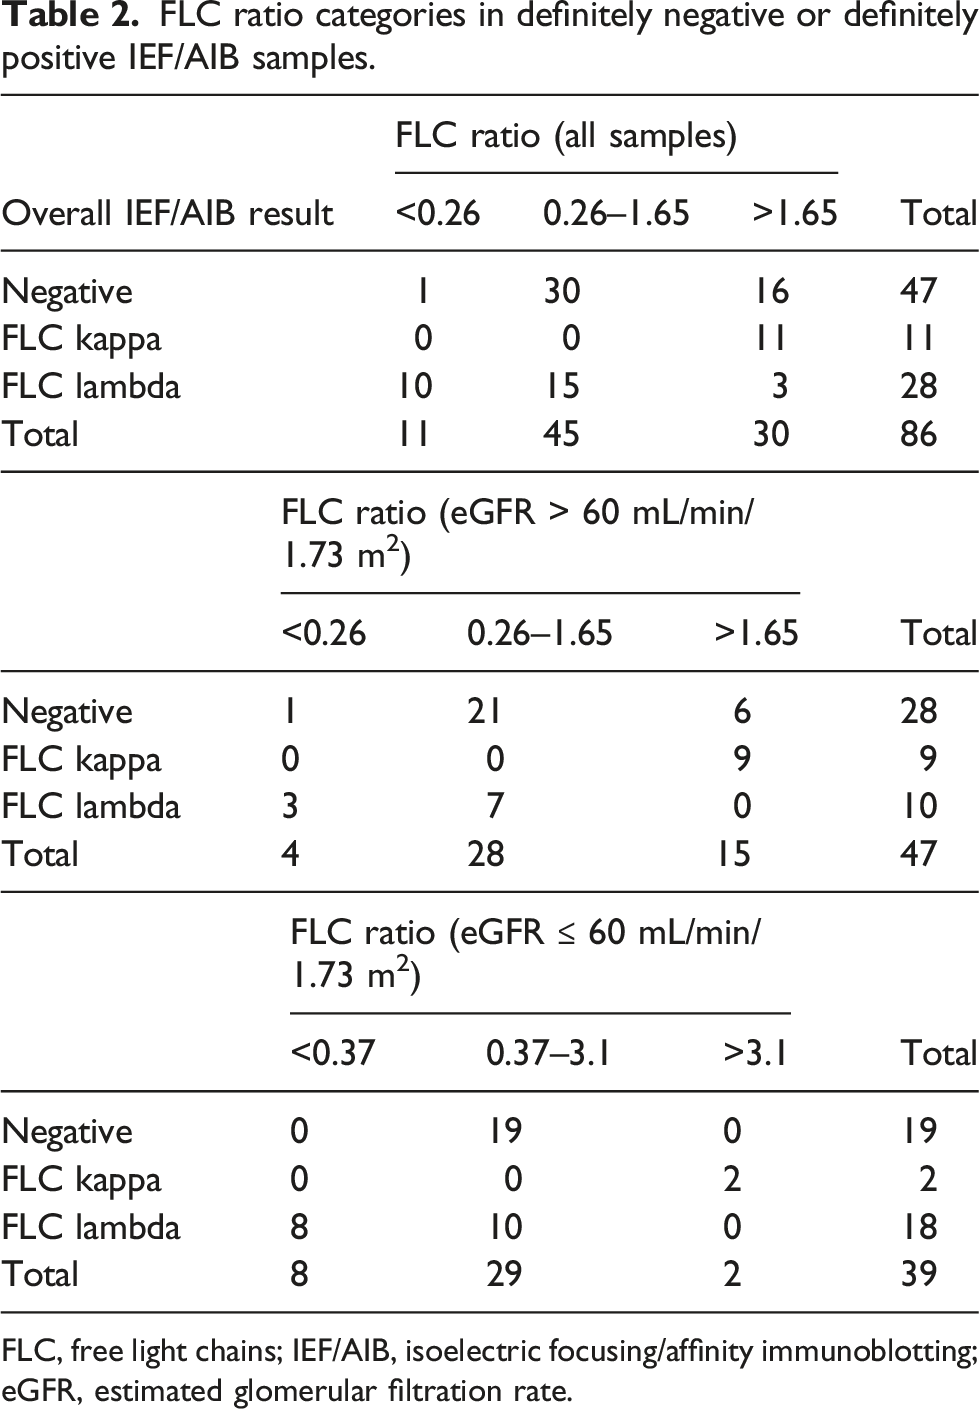
FLC, free light chains; IEF/AIB, isoelectric focusing/affinity immunoblotting; eGFR, estimated glomerular filtration rate.
An example of a patient with only slight elevation of lambda FLC, normal FLC ratio, but positive IEF/AIB results for FLC lambda is given in Supplemental Material, Figure S4.
Comparison of the overall isoelectric focusing/affinity immunoblotting results with beta2-microglobulin, creatinine and estimated glomerular filtration rate
FLC lambda positive samples had significantly higher concentrations of serum beta2-microglobulin (median 4.33 mg/L; interquartile range 3.095–5.465 mg/L) compared to either FLC kappa positive samples (1.99 mg/L; 1.752–3.560 mg/L) or negative samples (2.625 mg/L; 2.180–3.215 mg/L). Serum creatinine concentrations differed significantly only between samples positive for FLC lambda (112 μmol/L; 87–145 μmol/L) and FLC kappa (84 μmol/L; 74–91 μmol/L); values in IEF/AIB-negative samples (95 μmol/L; 77–111 μmol/L) did not differ from either of the monoclonal FLC-positive subgroup. Estimated glomerular filtration rate (eGFR) was significantly lower in FLC lambda positive subgroup (49.8 mL/min/1.73 m2; 35.1–77.1 mL/min/1.73 m2) compared to both FLC kappa positive subgroup (87.6 mL/min/1.73 m2; 75.3–92.9 mL/min/1.73 m2) and IEF/AIB-negative samples (69.0 mL/min/1.73 m2; 50.1–81.3 mL/min/1.73 m2), probably reflecting greater propensity of FLC lambda to cause renal damage. See Supplemental Material III for details.
Minimal residual disease-evaluated myeloma patients
Only 1 of 21 MRD-evaluated MM patients had monoclonal FLC discovered on serum ELP/IF, while this patient, as well as 4 other patients were positive on both agarose and PAA IEF. Four patients were positive for monoclonal FLC by urine ELP/IF as well as agarose IEF/AIB; 3 of them also positive on PAA IEF/AIB. Concerning overall results, IEF/AIB revealed monoclonal FLC in 2 patients negative for monoclonal FLC on ELP/IF.
A total of 7 out of 21 MRD-evaluated myeloma patients were examined at least twice. Four results were concordant, two partly concordant and one discordant. Results of individual patients are listed in Supplemental Material IV.
MRD-evaluated cohort: Relation between MRD status and overall result of ELP/IF and IEF/AIB on first examination.
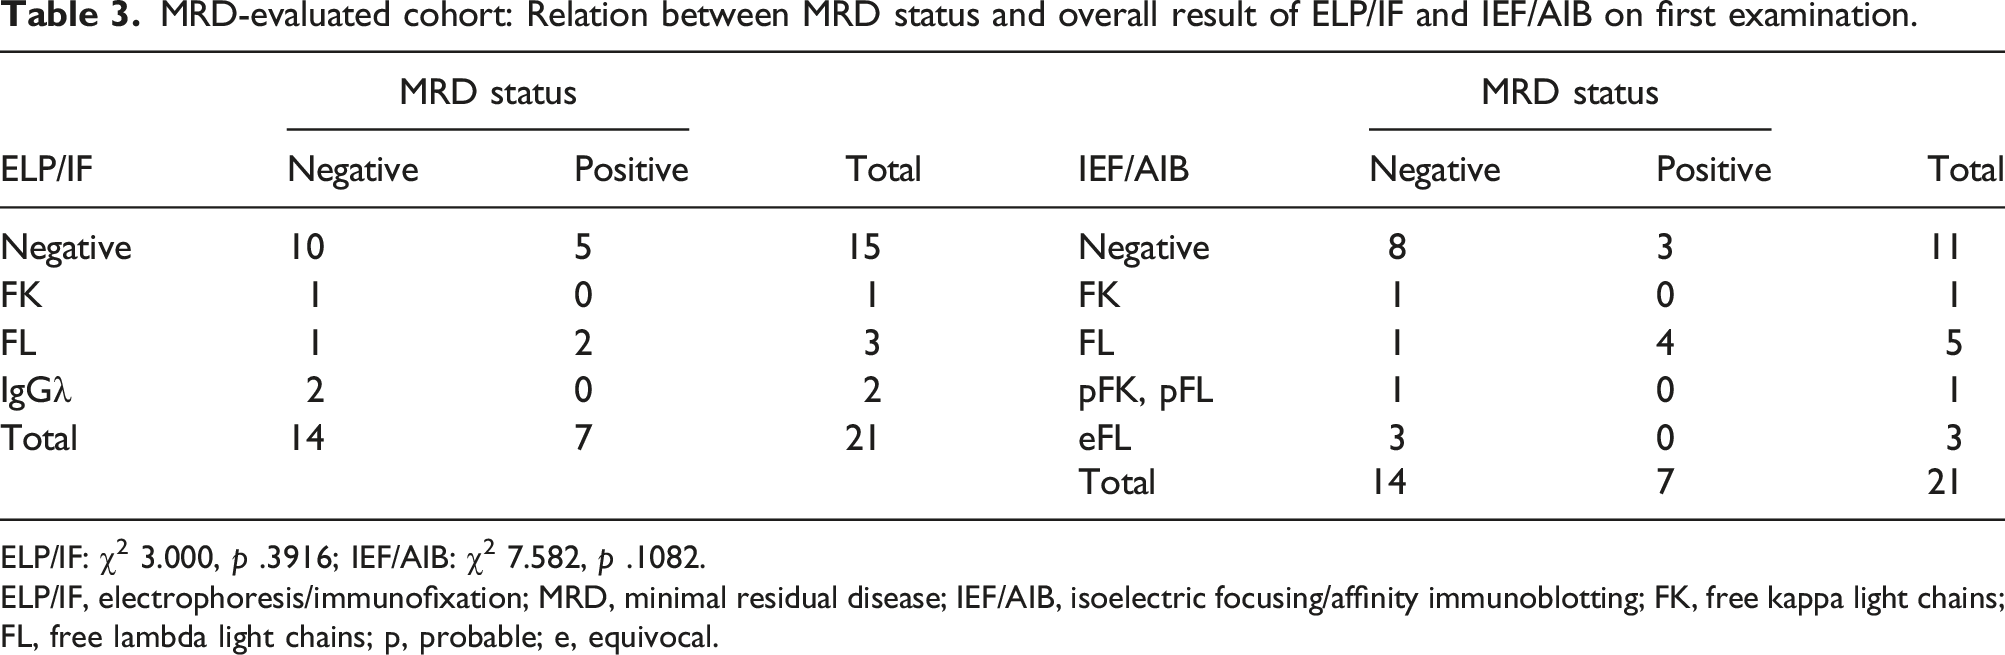
ELP/IF: χ2 3.000, p .3916; IEF/AIB: χ2 7.582, p .1082.
ELP/IF, electrophoresis/immunofixation; MRD, minimal residual disease; IEF/AIB, isoelectric focusing/affinity immunoblotting; FK, free kappa light chains; FL, free lambda light chains; p, probable; e, equivocal.
Considering only definite results of the first examination, 8/10 MRD-negative patients were IEF/AIB negative and 1 each positive for monoclonal FLCκ and FLCλ, compared to 3/7 MRD-positive patients IEF/AIB negative and 4 positive for FLCλ (χ2 4.689, p .0959).
Fisher’s exact test using 2 × 2 table expressing results as negative and positive only resulted in a p value of 1.00000 for ELP/IF and 0.161765 (if only definite results were taken into account) or 0.119582 (if ambiguous results were classified as negative) for IEF/AIB. Considering only FLC results on ELP/IF as positive did not change the interpretation (Fisher’s exact test, p = .574269; K 0.16, that is, poor agreement).
Patients with AL amyloidosis
In none of the 16 AL amyloidosis patients in whom IF was performed from the first study sample were monoclonal FLC detected on serum IF. On the contrary, 9 of these patients (56.2%) were positive for FLC lambda by agarose IEF/AIB, and 8 (50.0%) were positive for FLC lambda by PAA IEF/AIB. In the urine, 3/15 patients were positive for FLC lambda on IF, whereas 4/15 were positive on agarose IEF/AIB (both 2 IF-positive patients and 2 patients with complete immunoglobulin IgGλ only on IF; one patient positive for FLC lambda on IF was missed by agarose IEF/AIB) and 5/15 were positive on PAA IEF/AIB (in addition, 1 IF-negative patient was evaluated as positive for FLC lambda; in the IF-positive sample missed by agarose IEF/AIB, the presence of monoclonal FLC lambda was evaluated as equivocal). Concerning overall results, IEF/AIB revealed monoclonal FLC lambda in all 3 ELP/IF-positive samples as well as in 6/15 ELP/IF-negative samples.
A total of 14 out of 18 AL amyloidosis patients were examined at least twice. Repeated examinations of AL amyloidosis patients provided 10 concordant, 2 partially concordant and 2 discordant results (see Supplemental Material IV).
Discussion
Several reports mentioned the potential benefit of higher resolution protein separation and/or more sensitive detection methods compared to conventional immunofixation electrophoresis.7,21,29,30 Although AIB after native electrophoresis may have even lower detection limit compared to AIB after IEF, 7 IEF has an advantage in the ability to discriminate monoclonal and oligoclonal patterns with greater degree of confidence, and is more sensitive in the detection of oligoclonal patterns that occur frequently in treated patients and may complicate ELP and IF result evaluation.21,31–34 On the other hand, problems with differentiating monoclonal FLC component in an oligoclonal background may appear (Figure 2 and Supplemental Material, Figure S5), which should not be surprising. As it holds true for complete immunoglobulins, 8 oligoclonal FLC consists of several monoclonal FLC (and polyclonal FLC consist of a large number of monoclonal FLC), and recognition of patient’s original monoclonal FLC in an oligoclonal background may only rely on substantially higher intensity of a particular spectrotype and, if available, on comparison of the position of monoclonal FLC with paired serum/urine sample or with a patient’s previous result. Hence, although the choice between agarose and polyacrylamide IEF/AIB seems not to be critical, within-laboratory standardization of the method is mandatory to evaluate such complicated cases.
We speculated that PAA is more advantageous for separating relatively small (compared to immunoglobulins) FLC molecules. However, we were unable to observe substantial differences in performance of agarose and polyacrylamide gels, similar to a previous study comparing performance of both gels for detection of cerebrospinal fluid oligoclonal FLC. 35 We use more concentrated agarose as it proved to give better resolution than conventional 0.8–1.0% gel. 36
The main result of our study is significantly higher sensitivity of IEF/AIB for monoclonal FLC detection in serum samples, compared to conventional ELP/IF. This was particularly relevant for a subgroup of AL amyloidosis patients where serum concentrations of monoclonal FLC are frequently below the detection limit of serum immunofixation electrophoresis. Even considering overall results of serum and urine analysis, IEF/AIB yielded significantly higher proportion of samples with monoclonal FLC.
In our study, monoclonal FLC component present in urine was only rarely missed on IEF/AIB serum analysis (contrary to ELP/IF), and several urine samples displayed patterns that were difficult to interpret. Hence, we suggest that for IEF/AIB FLC test, serum sample is sufficient in many cases, and easier to evaluate.
In the future, IEF/AIB should be directly compared to mass spectrometry techniques for detecting monoclonal FLC37–39 since detection limits for both methods published so far are comparable. It should be noted that there is still enough room for further IEF/AIB method optimization, for example, by using chemiluminescent instead of chromogenic detection. We acknowledge that most routine diagnostic hospital laboratories do not have an easy access to IEF/AIB technique; however, it is relatively inexpensive and typical patterns can be easily recognized. With more experience, the proportion of ambiguous IEF/AIB results (4–11% in our study) may also decrease.
Comparison with MRD status in MM patients yielded rather disappointing results. Follow-up ELP/IF results were completely unrelated to the previously determined MRD status, while there was at least fair agreement between MRD status and follow-up IEF/AIB. Further studies should aim to compare the samples obtained concurrently, or as soon as possible after bone marrow sampling for MRD analysis.
In our definitely IEF/AIB-negative paired serum and urine samples, serum FLC ratio values ranged from 0.90 to 2.82, that is, were higher than the suggested diagnostic range of 0.26–1.65. Presumably false positive results of the FLC ratio were considerably reduced by the use of renal reference range. However, although we applied renal reference range for all patients with eGFR ≤60 mL/min/1.73 m2, the false positive rate still remained relatively high (12.8%). Considering that an apparently healthy person may be given a diagnosis of FLC MGUS based on (even marginally) increased FLC kappa values and ‘abnormal’ (i.e. higher than 1.65) FLC ratio, and, perhaps more importantly, stringent complete response (sCR) requires normal FLC ratio even if the involved FLC concentration is within the reference range, redefinition of FLC ratio diagnostic range for Freelite™ and/or improved definition of FLC MGUS and sCR may be warranted. Also, 61% of patients with clearly detectable monoclonal FLC lambda on IEF/AIB had a normal FLC ratio even if we used renal reference range for all patients with reduced eGFR. We may conclude that the reevaluation of the FLC ratio reference range is important to reduce both false positive and false negative results.
Conclusion
IEF coupled with AIB for FLC is more sensitive than conventional IF procedure. It can be performed in agarose as well as polyacrylamide gels with comparable results. The test might be useful before deciding whether to perform invasive bone marrow assessment to confirm CR and for MRD testing. The unambiguously positive result indicates the persistence of the abnormal plasma cell clone and may obviate the need to perform bone marrow analysis. Moreover, it might lead to the application of more extensive imaging methods (i.e. PET/CT) to detect viable tumour tissue in ossesous or extraosseous compartments. Although mass spectrometry may give better answer, it is still not widely available for routine use, and should be directly compared to IEF/AIB in future studies. On the other hand, equivocal (mainly with problematic differentiation between monoclonal and oligoclonal pattern) or negative results by IEF/AIB should guide the clinician to bone marrow plasma cell analysis or to perform high-sensitivity imaging method. Larger cohort of patients would need to be studied to verify the feasibility of the approach proposed, but our results are promising and could encourage other laboratories to introduce the method. Our study further support the experience that FLC ratio may be misleading, being arbitrarily abnormal (increased) in at least 13% of patients with negative IEF/AIB FLC test results.
Supplemental Material
Supplemental Material - Isoelectric focusing followed by affinity immunoblotting to detect monoclonal free light chains in monoclonal gammopathies: Comparison with immunofixation electrophoresis and free light chain ratio
Supplemental Material for Isoelectric focusing followed by affinity immunoblotting to detect monoclonal free light chains in monoclonal gammopathies: Comparison with immunofixation electrophoresis and free light chain ratio by David Zeman, Martin Štork, Lenka Švancarová, Marek Borský, Michaela Pospíšilová, Zdeněk Adam, Miroslava Beňovská and Luděk Pour in Annals of Clinical Biochemistry.
Footnotes
Acknowledgements
We would like to thank Monika Hradecká for language correction.
Declaration of conflicting interests
The author(s) declared no potential conflicts of interest with respect to the research, authorship, and/or publication of this article.
Funding
The author(s) disclosed receipt of the following financial support for the research, authorship, and/or publication of this article: This work was supported by Ministerstvo Zdravotnictví Ceské Republiky MHCZ-DRO (FNBr, 65269705).
Ethical approval
The study was approved by the University Hospital Brno Ethics Committee on 13 April 2022 (reference number 03-130422).
Guarantor
DZ.
Contributorship
DZ, MŠ, MBe and LP conceived the study. DZ, LŠ, MBo and MP performed laboratory tests. MŠ, ZA, and LP provided patient data. DZ and MŠ wrote the first draft of the manuscript. All authors reviewed and edited the manuscript and approved the final version of the manuscript.
Supplemental material
Supplemental material for this article is available online.
References
Supplementary Material
Please find the following supplemental material available below.
For Open Access articles published under a Creative Commons License, all supplemental material carries the same license as the article it is associated with.
For non-Open Access articles published, all supplemental material carries a non-exclusive license, and permission requests for re-use of supplemental material or any part of supplemental material shall be sent directly to the copyright owner as specified in the copyright notice associated with the article.