
Abstract
Background
The demand for measurement of serum immunoglobulin free kappa (κ) and lambda (λ) light chains has increased. The κ:λ ratio is used to assist in diagnosis/monitoring of plasma cell disorders. The binding site reference range for serum-free light chain κ:λ ratios of 0.26–1.65 was derived from healthy volunteers. Subsequently, a reference range of 0.37–3.1 for patients with chronic kidney disease has been proposed. Elevated free light chain concentrations and borderline raised free light chain ratios also may be found in polyclonal gammopathies and with other non-renal illnesses. This assessment was conducted to validate the established free light chain reference ranges in individuals from primary care.
Method
A total of 130 samples were identified from routine blood samples collected in primary care for routine biochemistry testing and estimated glomerular filtration rate calculation.
Results
The median and range of κ:λ ratios found in each estimated glomerular filtration rate group used for chronic kidney disease classification were higher than previously described. This was the case for individuals with normal or essentially normal renal function with estimated glomerular filtration rates>90, (0.58–1.76) and estimated glomerular filtration rate of 60–90 mL/min/1.73 m2, (0.71–1.93). Individuals with estimated glomerular filtration rate 15–30, (0.72–4.50) and estimated glomerular filtration rate <15 ml/min/1.73 m2 (0.71–4.95) also had higher values when compared to the current renal reference range of 0.37–3.10.
Conclusions
Elevation of free light chain-κ:λ ratios may occur in the absence of a reduced renal function shown by a normal estimated glomerular filtration rate and in the presence of reduced renal function by estimated glomerular filtration rate when comparing results with the established reference ranges. Explanations include choice of analytical systems or the presence of other concurrent non-plasma cell illness.
Keywords
Introduction
Monoclonal free light chains (FLCs) can cause kidney disease in patients with plasma cell dyscrasias, but raised FLC concentrations in serum are also found as a consequence of chronic kidney disease (CKD).
Recently, the relationship between polyclonal FLCs, kappa (κ) and lambda (λ) light chain concentrations and FLC ratios in individuals with CKD was investigated. 1 This resulted in a renal reference range of 0.37–3.1 derived from samples collected from individuals with CKD who were attending a renal unit. 1 This was subsequently shown to help distinguish between raised values found in CKD and raised values due to plasma cell dyscrasias which can cause CKD. 2 The original reference range for light chain kappa and lambda concentrations in serum and their ratio of 0.26–1.65 was derived from work conducted on 282 healthy volunteers. 3 It has subsequently been recognized that polyclonal gammopathies can also be associated with borderline elevations of the FLC ratio with values between 1.66 and 3.0. 4
FLC measurement is conducted on a number of analytical platforms although the reagents predominantly originate with one or two suppliers. FLC ratios have also shown platform dependency. 5 The use of polyclonal antibodies as reagents is also recognized to be a cause of significant batch-to-batch variation in sensitivity and specificity of FLC concentrations (8–45%) and their ratios (17–32%). 6
It is also possible that individuals attending their general practitioner with non-renal illnesses with or without accompanying CKD may also have elevations of FLC concentrations when compared to the standard reference range derived from healthy volunteers due to concomitant activation of their immune systems as a consequence of their illness.7–10
As reference ranges for FLC tests can vary with the population studied, an assessment of the serum FLC concentrations and their ratio in samples collected as part of routine clinical care in primary care was conducted in order to validate the work previously carried out with respect to the established healthy volunteer 3 and CKD1,2 FLC reference ranges.
Material and methods
For the purpose of this paper, samples routinely sent to the laboratory from primary care were categorized solely by estimated glomerular filtration rate (eGFR) level into CKD stages 1–5. Samples whose previous results or supplied clinical information demonstrated that they came from individuals known to have plasma cell dyscrasias were excluded.
Samples were centrifuged at 3000 rpm for 5 min on arrival at the laboratory using a Beckman Spinchron™ DLX centrifuge (Beckman Coulter Ltd, High Wycombe, UK) and analysed for electrolytes, urea and creatinine using a 702 chemistry multichannel analyser (Roche Diagnostics Ltd, Burgess Hill, UK). The creatinine concentrations in serum were measured using the isotope dilution mass spectrometry (IDMS) traceable modified Jaffe reaction. eGFR was calculated using the modification of diet in renal disease (MDRD) study equation modified for an IDMS traceable creatinine concentration. The serum creatinine assay internal quality control (IQC) coefficients of variation (CV) were 4.34%, 2.8% and 2.64% for creatinine concentrations of 58 µmol/L, 175 µmol/L and 480 µmol/L, respectively.
The remainder of the samples was stored frozen at −20℃ prior to FLC analysis. Samples were anonymized prior to FLC analysis.
FLC concentrations were measured using reagents from the binding site (The Binding Site Group Ltd, Birmingham, UK) using a Roche 502 multichannel analyser (Roche Diagnostics Ltd, Burgess Hill, UK). The method was quality controlled using two levels of IQC samples provided by the binding site and through an external quality assurance (EQA) scheme run by the UK National External Quality Assurance Scheme (NEQAS). For FLC assay, the IQC CVs for κ-light chains were 6.49% and 5.60% for concentrations of 14.2 mg/L and 28.6 mg/L, respectively. For λ light chains, the IQC CVs were 4.89% and 4.80% for concentrations of 28.1 mg/L and 56.7 mg/L, respectively. In the UK NEQAS scheme, the FLC methods ran within the Roche method group.
The κ:λ ratios were calculated from the FLC results. Individuals whose κ:λ ratios exceeded the established reference range for healthy individuals or renal reference range were tested using protein electrophoresis to check for any unidentified plasma cell disorders and if identified were excluded.
Statistical comparisons were made using the Mann-Whitney Test. Permission to use the samples was obtained from the hospital’s Caldecott Guardian.
Results
A total of 143 samples were collected. Samples from patients where a raised κ:λ ratio was associated with a monoclonal band on electrophoresis or patients with other blood disorders were excluded leading to a total of 130 samples for analysis, of which 67 were from men.
FLC κ and λ concentrations rose with declining eGFR, although the rise in κ light chain concentration was proportionately greater than that of λ light chain concentration (Figure 1).
Median κ to λ FLC ratio (a), kappa (b) and lambda (c) concentrations plotted against the patients’ eGFR categories showing a greater rise in κ light chain concentrations.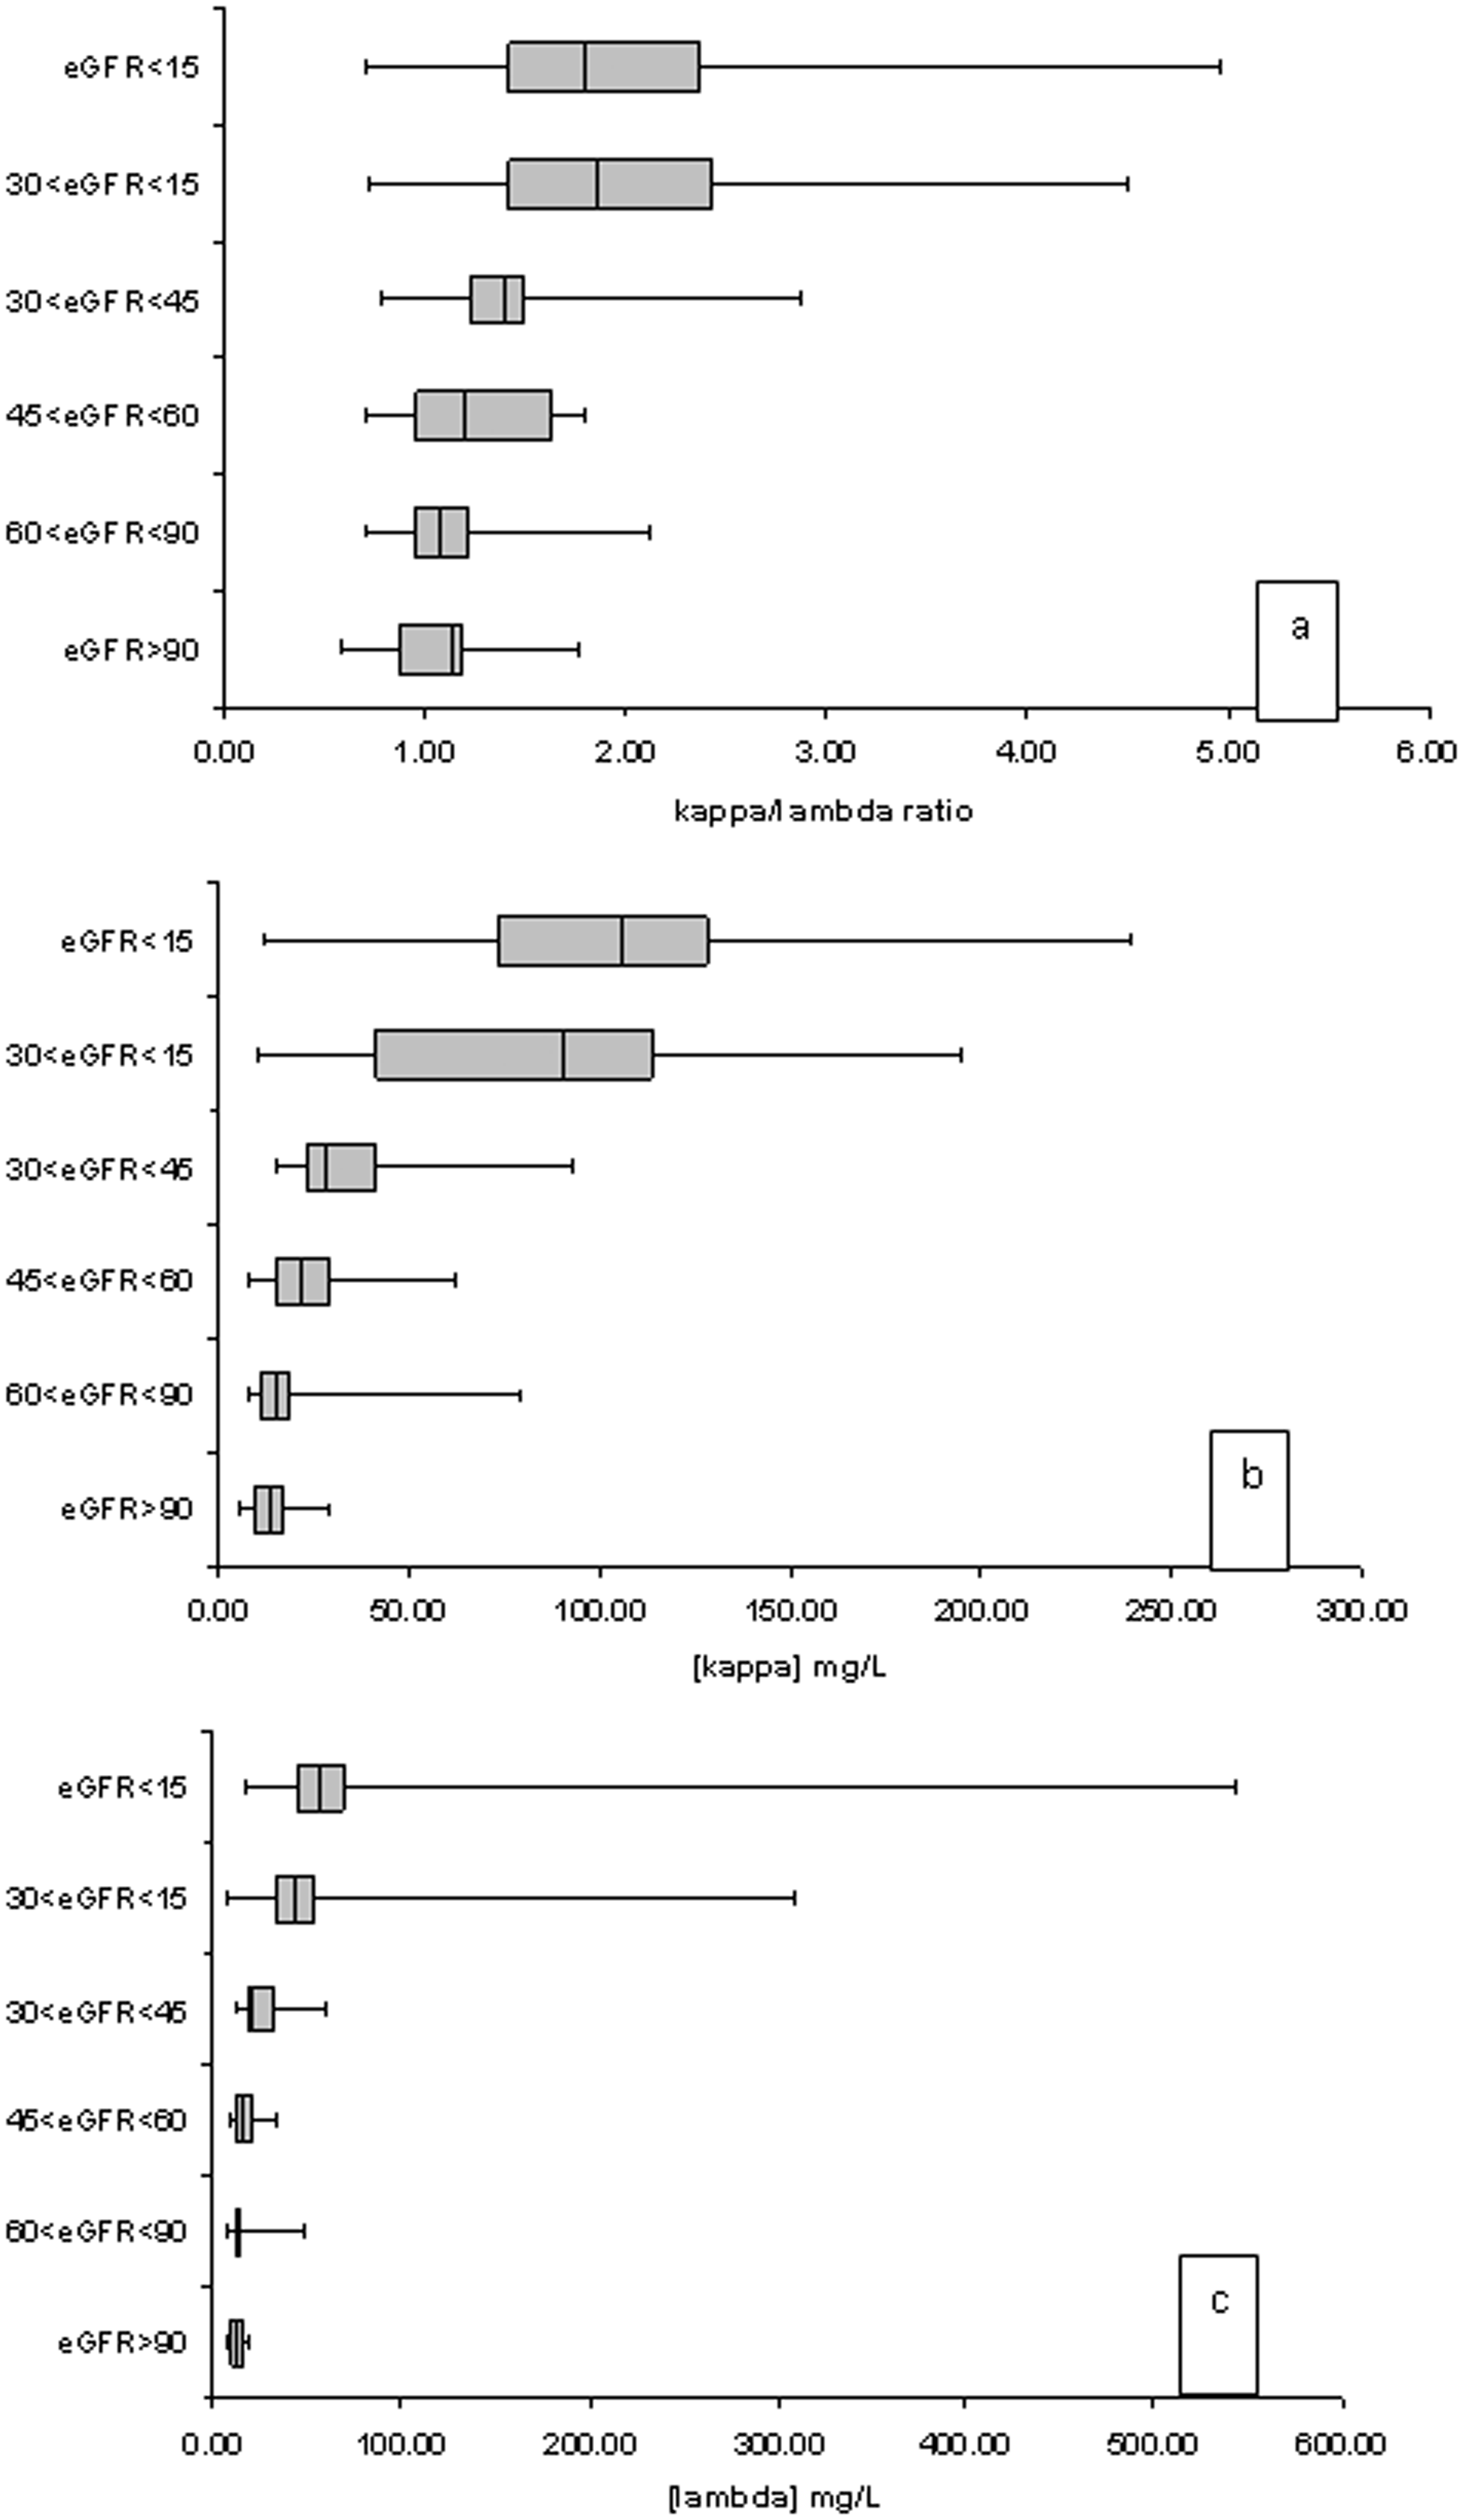
Older individuals were more likely to have eGFR results that could be consistent with CKD 4 or CKD 5. Of patients with these eGFRs categories, 53.2% were aged over 80 (Figure 2) compared to just 15.4% of patients with eGFRs consistent with CKD stages 1 and 2. No statistically significant relationship was observed between κ:λ ratio and age or gender.
Distribution of ages of patients with eGFR suggested CKD stages.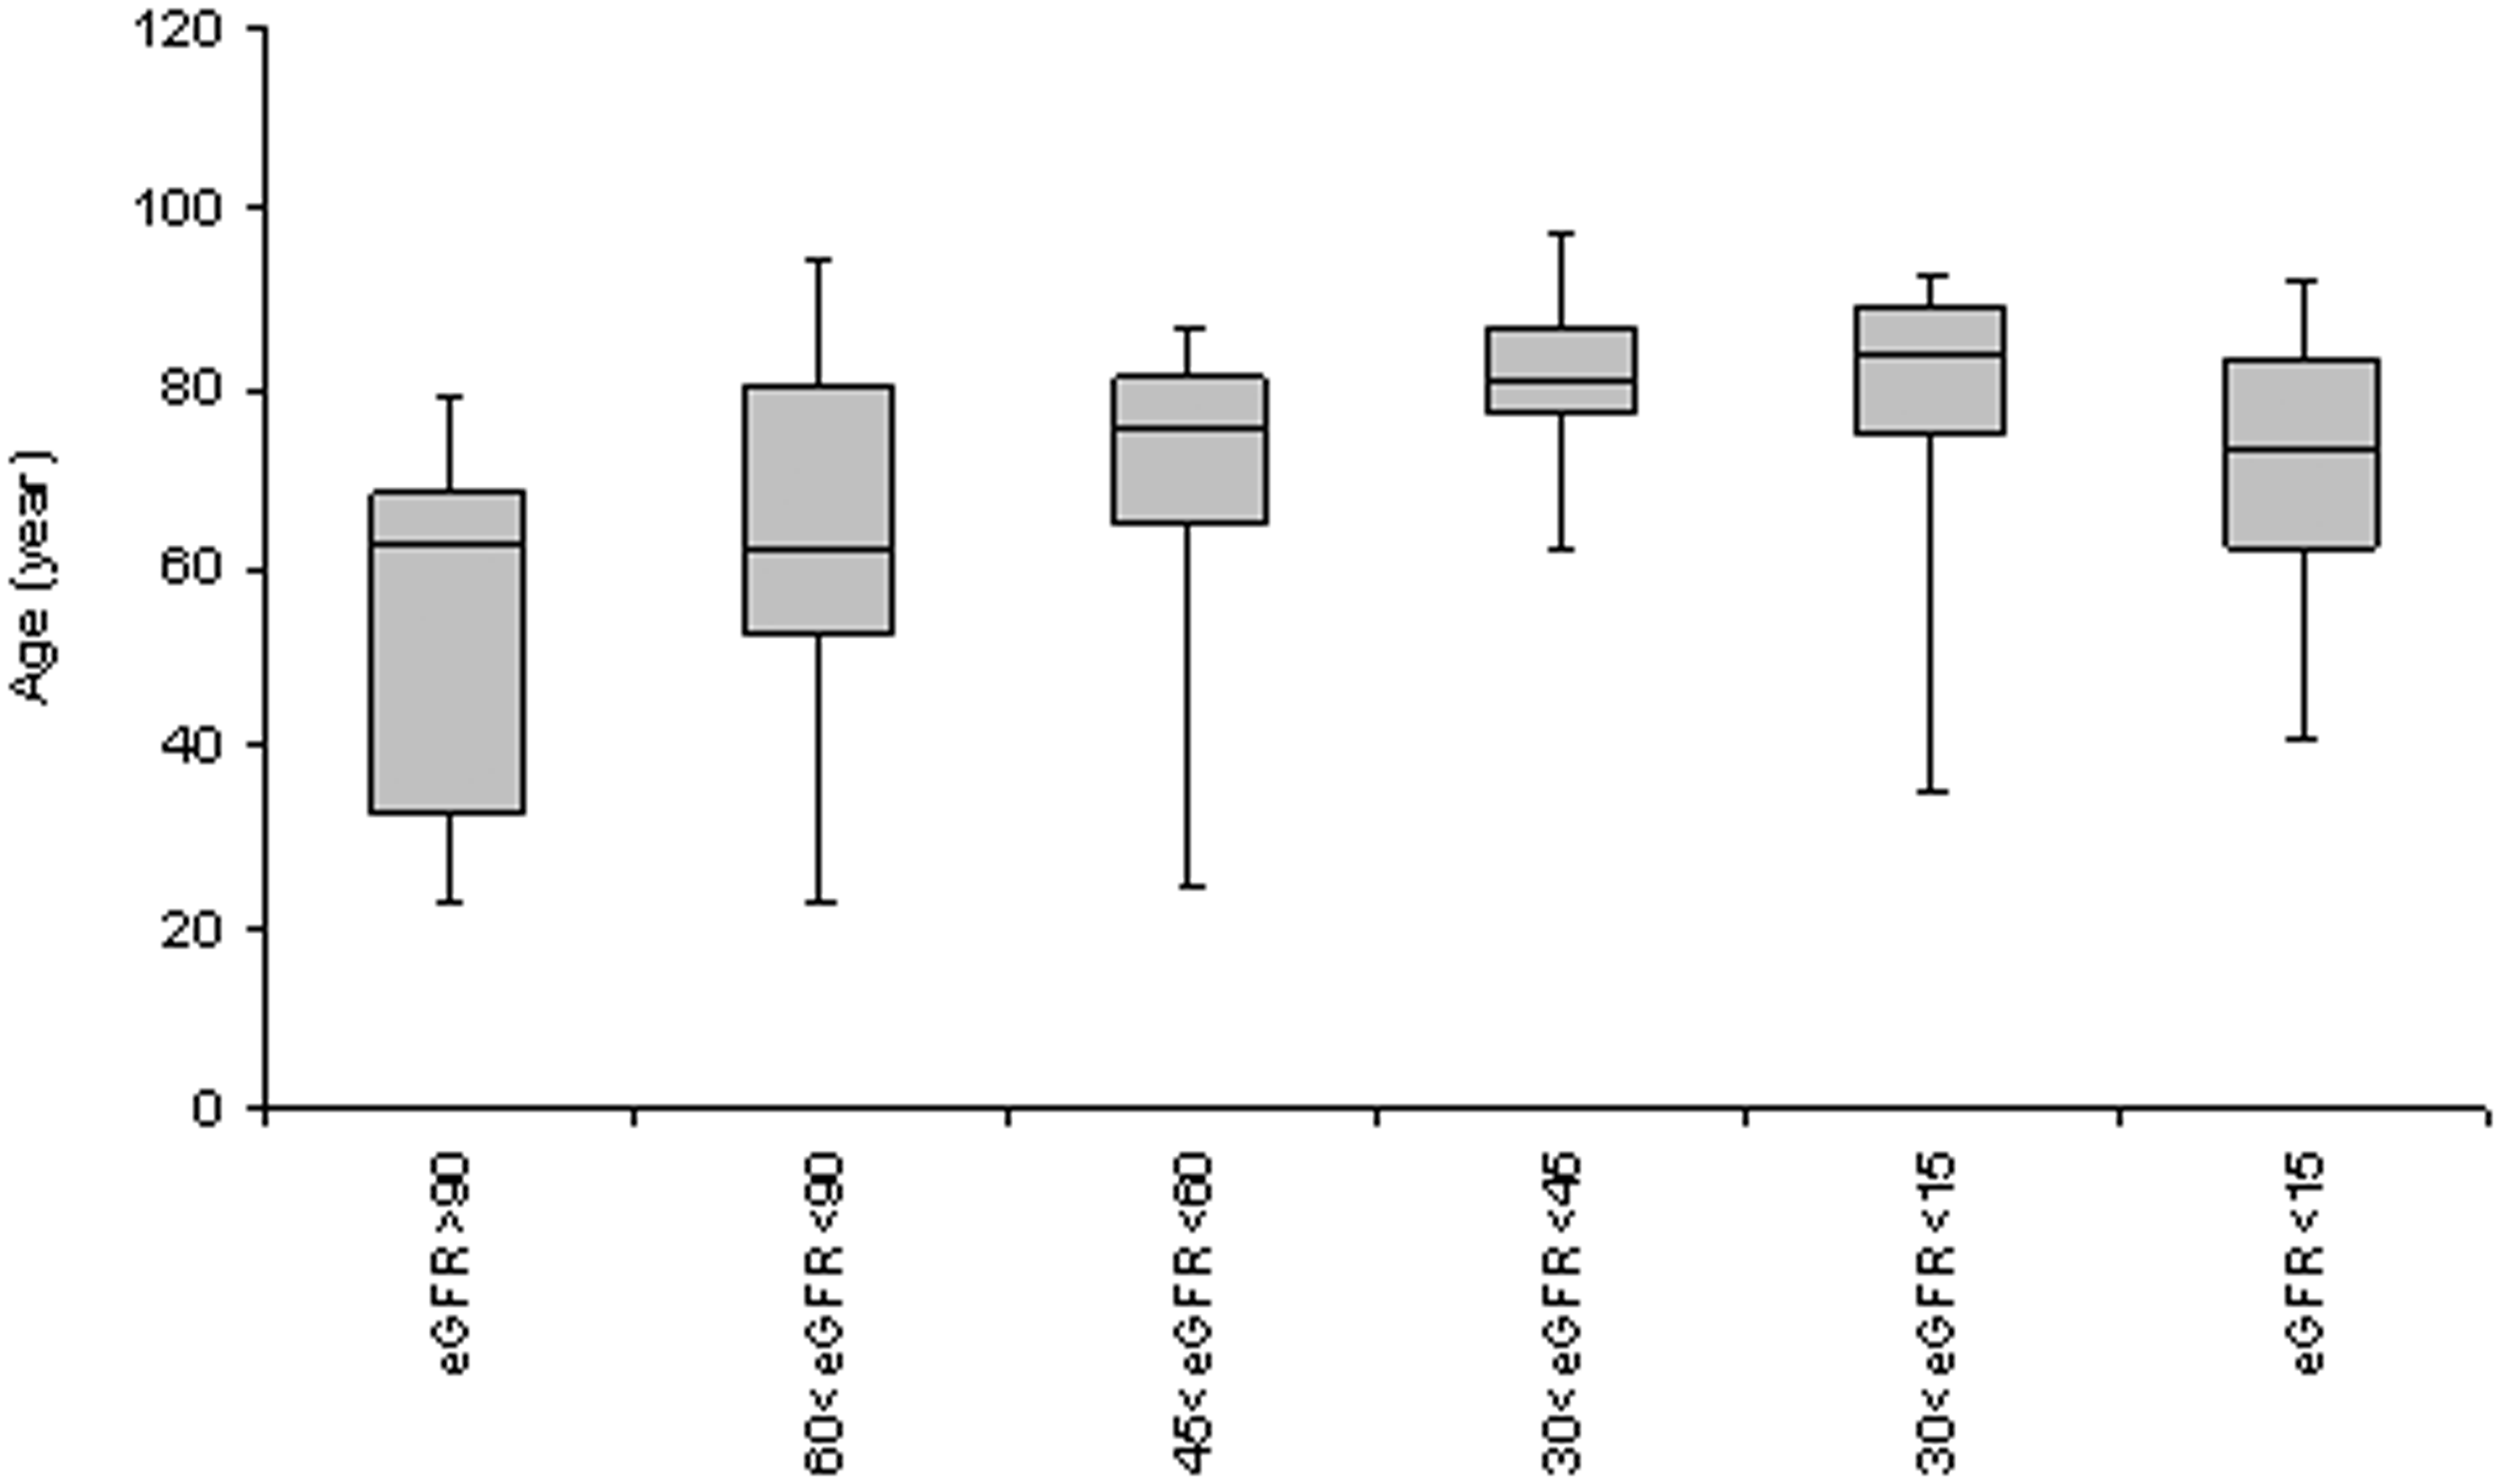
Free Light Chain Concentrations and Ratios by eGFR group.
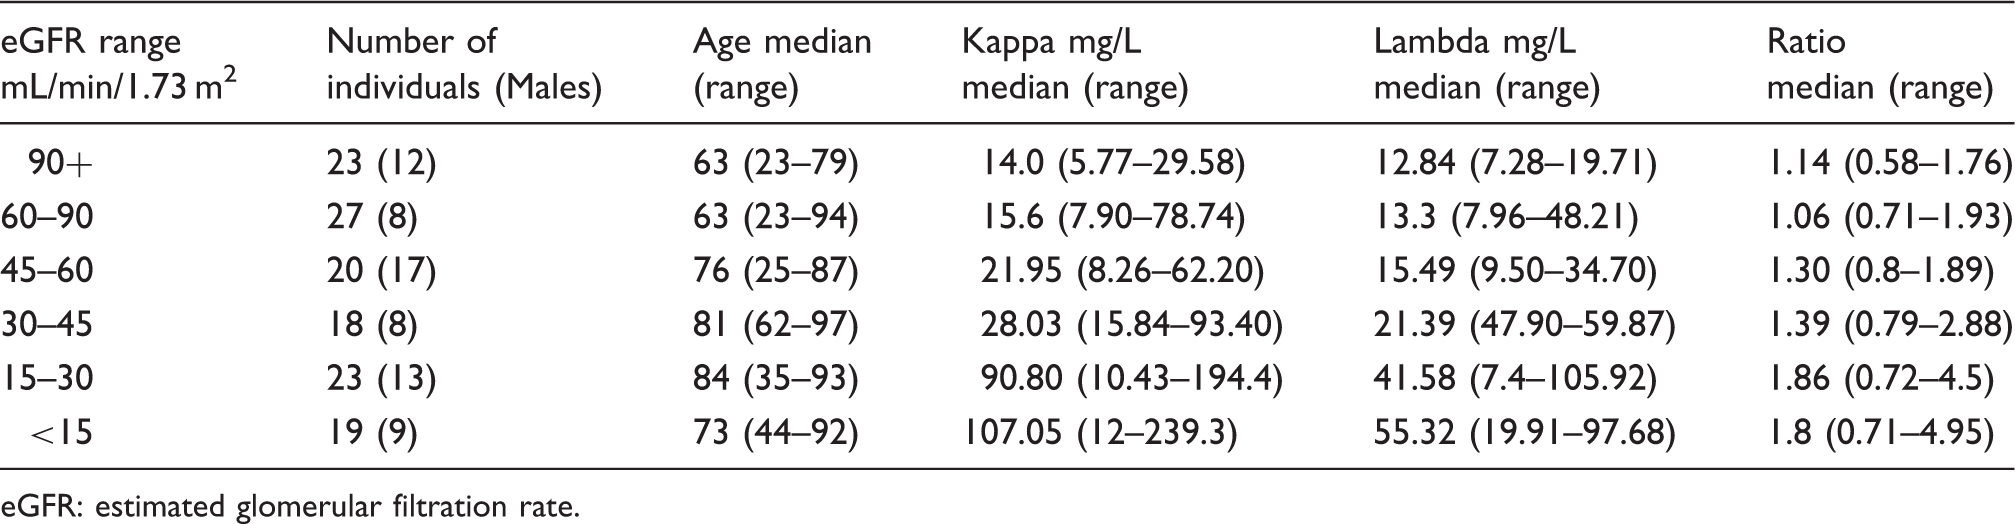
eGFR: estimated glomerular filtration rate.
Table 1 also shows that individuals with eGFRs consistent with normal renal function (>90 mL/min/1.73 m2), (0.58–1.76) and for effectively normal renal function in the 60–90 mL/min/1.73 m2 eGFR group (0.71–1.93) had higher ratios when compared with the original healthy volunteer range (0.26–1.65). 3 Individuals with eGFRs consistent with CKD 4, (0.72–4.5) and CKD 5 (0.71–4.95) also had higher values when compared with the proposed renal reference range of 0.37–3.1. 1
Discussion
The absence of a relationship between κ:λ ratio and age or gender is the same as the findings of the original study of FLCs which found that there was no age or gender dependence for serum concentrations of κ or λ-FLC. 2
In this study, it was found that the medians and ranges of κ:λ ratios in each of the eGFR groups were higher than previously described.1,3 The reasons for these differences are likely to include the known variation across analytical platforms of κ and λ light chain measurements. 5 The UK NEQAS FLC EQA performance for distributions from February to August 2014 demonstrated that both the Roche Cobas systems used with binding site reagents and the Dade-Behring II system also used with binding site reagents had a marked positive bias particularly for κ chain concentrations when compared with Siemens reagents used on Siemens systems. The Roche systems also had a slight positive bias compared with the Dade-Behring II system. The Dade-Behring II system was used in the original study that reported a renal reference range. 1 In addition, the known variation in specificity and sensitivity of reagents between lots of reagents 6 may also have contributed to the differences in κ:λ ratios observed. It is likely therefore that choice of equipment and reagents will significantly influence the results found in individuals studied.
A further possible explanation for the higher κ:λ ratios found in individuals with normal eGFR results is that as samples were collected as part of routine care from patients in primary care, there is the possibility of a greater proportion of individuals with subclinical activation of their immune systems due to concurrent illness not present in the healthy volunteer groups previously studied. Although there is evidence for polyclonal FLC involvement in the evolution of a number of common clinical conditions including asthma, rhinitis, food allergy or chronic obstructive pulmonary disease (COPD), the changes in FLC concentration so far described do not result in κ:λ ratios out with the established reference range.9,10 Individuals with polyclonal gammopathies are also recognized to have borderline raised κ:λ ratios up to 3. 4
Light-chain monoclonal gammopathy of undetermined significance (MGUS) has also been described and might possibly be an explanation for some of the elevated FLC ratios found, but as the estimated prevalence of this condition is 0.8% of the older, greater than 50 years of age adult population, it is unlikely to be the actual explanation for the values found.
Additionally, the finding of raised FLC ratios in individuals with impaired renal function has recently been shown as specific to the binding site FLC reagents as it was not found with Siemens N Latex FLC reagents in a recent study. 11 In another recent study which also used Siemens N Latex FLC reagents, a proportionately similar rise in κ and λ light chain concentrations was observed with CKD stage with the result the rise in the κ:λ ratio with decreasing eGFR found in this study, and others1,3 was not observed. 12
One difference in performance between the binding site and Siemens FLC methods has been shown to occur due to FLC dimerization and the formation of multimers. This is thought to be due to differences in the antibody reagent as the binding site uses polyclonal antibodies, while Siemens uses a mixture of monoclonal antibodies. 13 Dimerization may magnify the nephelometric signal, and this may be more likely with the possibility of non-specific binding with polyclonal antibodies. 14
The results of this assessment confirm higher FLC κ:λ ratios in individuals with reduced eGFR who do not have known plasma cell disorders when measured by binding site reagents. This is an observation that has not been confirmed in studies using Siemens reagents. It is therefore not clear whether the rise in the κ:λ ratio with CKD is a pathophysiological phenomenon requiring a specific renal reference range or a consequence of a specific assay formulation. Further studies are required to determine which method is likely to be closest to the true result.
The finding of higher FLC concentrations and their ratios in samples collected in primary care was also consistent with the evidence suggesting FLC involvement in common clinical conditions.
Further work is required for the interpretation of borderline elevations of serum FLC κ:λ ratios in patients in the outpatient and primary care setting as these may have non-specifically raised ratios due to conditions which do not necessarily indicate plasma cell disease or are a consequence of the method of analysis and are not necessarily a consequence of decreased renal function.
Conclusions
Higher serum FLC κ:λ ratios in individuals with reduced eGFR who do not have known plasma cell disorders when measured using the binding site reagents were confirmed. The obtained FLC κ:λ ratios may be dependent on the choice of analytical equipment and batch of reagents. Further studies are needed to assess the effect of common clinical conditions on FLC concentrations in a primary care population.
Footnotes
Acknowledgement
We would like to thank the WUTH laboratory staff for their help and assistant with this project.
Declaration of conflicting interests
The author(s) declared no potential conflicts of interest with respect to the research, authorship, and/or publication of this article.
Funding
This project was not funded by external bodies. It was carried out as part of the routine laboratory work to confirm the reliability of a previously published FLC reference ranges.
Ethical approval
Caldecott Guardian Wirral University Teaching Hospital NHS Foundation Trust.
Guarantor
WD Neithercut.
Contributorship
WDN: Study design, major contribution to the manuscript.
JF: Analyser’s calibration and QC.
LG: Analysis of specimens and the manuscript initial draft.
MS: Data acquisition, retrieving specimens, preparing samples, reviewing manuscript.