
Abstract
Background
Acute kidney injury (AKI) is a global health issue known to cause avoidable harm and death. Improvement in its prevention and management is therefore considered an important goal for the health-care sector. The work here aimed to develop a tool which could be used to robustly and reliably measure, monitor, and compare the effectiveness of health-care interventions related to AKI across the Welsh NHS, a mechanism which did not exist previously.
Methods
Using serum creatinine (SCr) as a biomarker for AKI and a validated national data-set collected from the all Wales Laboratory Information Management System, work involved applying Donabedian’s framework to develop indicators with which to measure outcomes related to AKI, and exploring the potential of statistical process control (SPC) techniques for analysing data on these indicators.
Results
Rate of AKI incidence and 30-day AKI-associated mortality are proposed as valid, feasible indicators with which to measure the effectiveness of health-care interventions related to AKI. The control chart, funnel plot, and Pareto chart are proposed as appropriate, robust SPC techniques to analyse and visualise variation in AKI-related outcomes.
Conclusions
This work demonstrates that routinely collected large SCr data offer a significant opportunity to monitor and therefore inform improvement in patient outcomes related to AKI. Moreover, while this work concerns utilisation of SCr data for improvement in AKI strategies, it is a proof of concept which could be replicated for other routinely collected clinical laboratory data, to improve the prevention and/or management of the conditions to which they relate.
Keywords
Background (context and rationale)
Acute kidney injury (AKI) is a global health issue known to cause avoidable harm and death. Improvement in its prevention and management is therefore reported as an important goal for the health-care sector, and a clinical and research priority. 1 By utilising routine clinical laboratory data, this work aimed to develop objective indicators and a tool with which to reliably (i) ascertain a baseline for potential improvement in the prevention and management of AKI and (ii) measure subsequent improvement in the prevention and management of AKI following the introduction of any change(s) in practice.
The work in this paper follows a National Confidential Enquiry into Patient Outcome and Death 2 which identified significant systemic deficiencies in the management of AKI across the UK and led to the development of new laboratory and clinical strategies. For the National Health Service in Wales (NHSW), this involved the implementation of an automated laboratory-based electronic alerting system for AKI, based on the assumption that this would aid early recognition and intervention, and thereby improve patient outcomes. 3 The improvement science literature states that without measurement, improvement is not possible. 4 It also states that with quality improvement (QI), improvement is the goal of measurement. 5 Without measurement, it is impossible to determine if, and to what extent, interventions and changes in practice improve quality. If the effectiveness of health-care interventions related to AKI in Wales was to improve, then the improvement needed to be measurable.
In addition to its clinical and primary application, the aforementioned AKI alert system, which had been implemented by all laboratories in NHSW, also had the potential to be applied as a centralised system of data collection, to systematically collect national data on AKI. While this new large data source may have already been utilised to better understand the epidemiology of AKI, including by describing AKI identified in different patient populations and health-care settings,6–12 and exploring its association with various risk factors,13–17 it also offered further opportunity in the QI arena. To demonstrate this additional benefit, the work described here aimed to develop a tool which could be used to robustly and reliably measure, monitor, and compare the effectiveness of health-care interventions related to AKI across the entire Welsh NHS. A mechanism like this did not exist prior and may therefore offer a significant opportunity to inform strategies aimed at improving the prevention and/or management of AKI in Wales.
Methods (type of study, patients, materials, and techniques)
Development of data-set
List of fields included in national AKI data-set developed by the authors.
WLIMS, Welsh Laboratory Information Management system; SCr, Serum Creatinine; RV, Reference Value; WDS, Welsh Demographic Service; LSOA, Lower Super Output Area; WIMD, Welsh Index for Multiple Deprivation.
Process developed by the authors to extract raw data on AKI alerts from the WLIMS. CSV, comma-separated values (a text file format); WLIMS, Welsh Laboratory Information Management system; WDS, Welsh Demographic Service; WIMD, Welsh Index for Multiple Deprivation.
Inclusion and exclusion criteria developed by the authors to validate and cleanse extracted data. Data fields indicated by italics.
SCr, Serum Creatinine; SAKI, Suspected AKI; ABS, Absolute.
Formulation of quality indicators
While several classifications for quality of care exist, Donabedian’s framework
19
is the most widely accepted. It classifies quality indicators as structural, process, or outcome and theoretically hypothesises that ‘good’ structure increases the likelihood of ‘good’ process, which in turn increases the likelihood of ‘good’ outcome. Given there is limited evidence linking structure to outcomes,
20
a combination of outcome and process indicators is however recommended in practice by most.21,22 Hence, while the omission of a process-based indicator in the work here may not have been ideal, the National Institute for Health and Care Excellence (NICE) advises that these types of indicators should only be measured if linked by scientific evidence to improved outcome.
23
Studies indicate that if the occurrence of what is being measured is common, and measurement of whole system performance is possible, outcome indicators are the most powerful detectors of differences in quality.5,24 The following outcome-based indicators were therefore selected as valid, reliable, and feasible, to measure the effectiveness of health-care interventions related to AKI. For a given time period, these could be calculated as follows: AKI incidence rate (per 1000 population at risk) = [∑(Incident AKI episodes)/∑(Population at risk)]*1000. 30-day AKI-associated mortality rate (% of AKI episodes) = [∑(Incident AKI episodes resulting in death within 30 days)/∑(Incident AKI episodes)]*100.
AKI incidence could be used to measure the effectiveness of interventions employed for patients at risk of developing AKI and therefore to measure improvement from strategies related to the prevention of AKI. Acute kidney injury-associated 30 day mortality could be used to measure the effectiveness of interventions employed in patients post-confirmed AKI and measure any systematic improvement following the implementation of strategies related to AKI management. It is also important for health-care providers to be aware of the number of patients developing AKI and who therefore require post-AKI care. 25
Stratification of data
To overcome potential ‘Simpson’s Paradox’, the disappearance of trends in groups of data when groups are inappropriately combined,
26
and which can affect the results of comparative and non-comparative analyses, the data were split. This enabled analysis of the data by the following strata: 1. Clinical setting of AKI (all-cause, hospital acquired [HA]-, or community acquired [CA]-), 2. severity of AKI (Stages 1, 2, and/or 3), 3. local health board (for which there are 7 in Wales), 4. hospital (for which there are 19 in Wales), 5. clinical speciality (for which there are 86 listed in the WLIMS), and 6. for HA-AKI only: • Ward location (for which there are >1000 listed in the WLIMS) and 7. For CA-AKI only: • Primary care cluster (for which there are 64 in Wales) and/or • GP practice (for which there are approximately 400 in Wales).
While lower level data have the potential to provide more granular information in some cases, Mainz suggests outcome indicators become less useful as the number of data points reduces and the perspective narrows. 21 Moreover, while not negating any potential benefits from stratifying by other possible ‘variables of interest’, the ‘national’ tool developed here is predominantly intent on measuring clinically important outcomes, mostly at the provider level.
Statistical process control methodology
Developed from traditional quality management theory and seminal work of Deming, 4 statistical process control (SPC) methods are central to most QI methodology and through scientific analysis of data on quality indicators over time, enable the identification and investigation of variation in quality. They can therefore be used to evaluate the impact of, and identify opportunities for, QI. To analyse data on the two indicators described above, the authors explored and compared a number of such techniques, including control charts, funnel plots, and Pareto charts.
Results (main numerical data and statistical information)
Figure 2 includes screenshots of the prototype tool developed in Microsoft Excel software. The tool includes a series of interactive control charts, funnel plots, and Pareto charts which dynamically display data depending on selections made by the end-user using the dropdown menus pictured. Screenshots of prototype tool developed by the authors.
Control charts
Although a simple run chart may have offered an alternative SPC method for monitoring data on the effectiveness of health-care interventions related to AKI in Wales over time, Figure 3 shows control charts developed by the authors to plot data on the two quality indicators described above. While these example charts plot national all-cause AKI incidence and mortality rates, similar could also be produced for other variables which may be of interest, including any combination of the stratums listed earlier. Moreover, while Figure 3 is based on monthly time series data, also possible are similar plots based on the analysis of quarterly time series data. Sample control charts developed by the authors to monitor the effectiveness of health-care interventions related to AKI: (a) AKI incidence rate per month; (b) 30-day AKI-associated mortality rate per month; (c) AKI incidence rate for a selected variable of interest versus all Wales AKI incidence rate.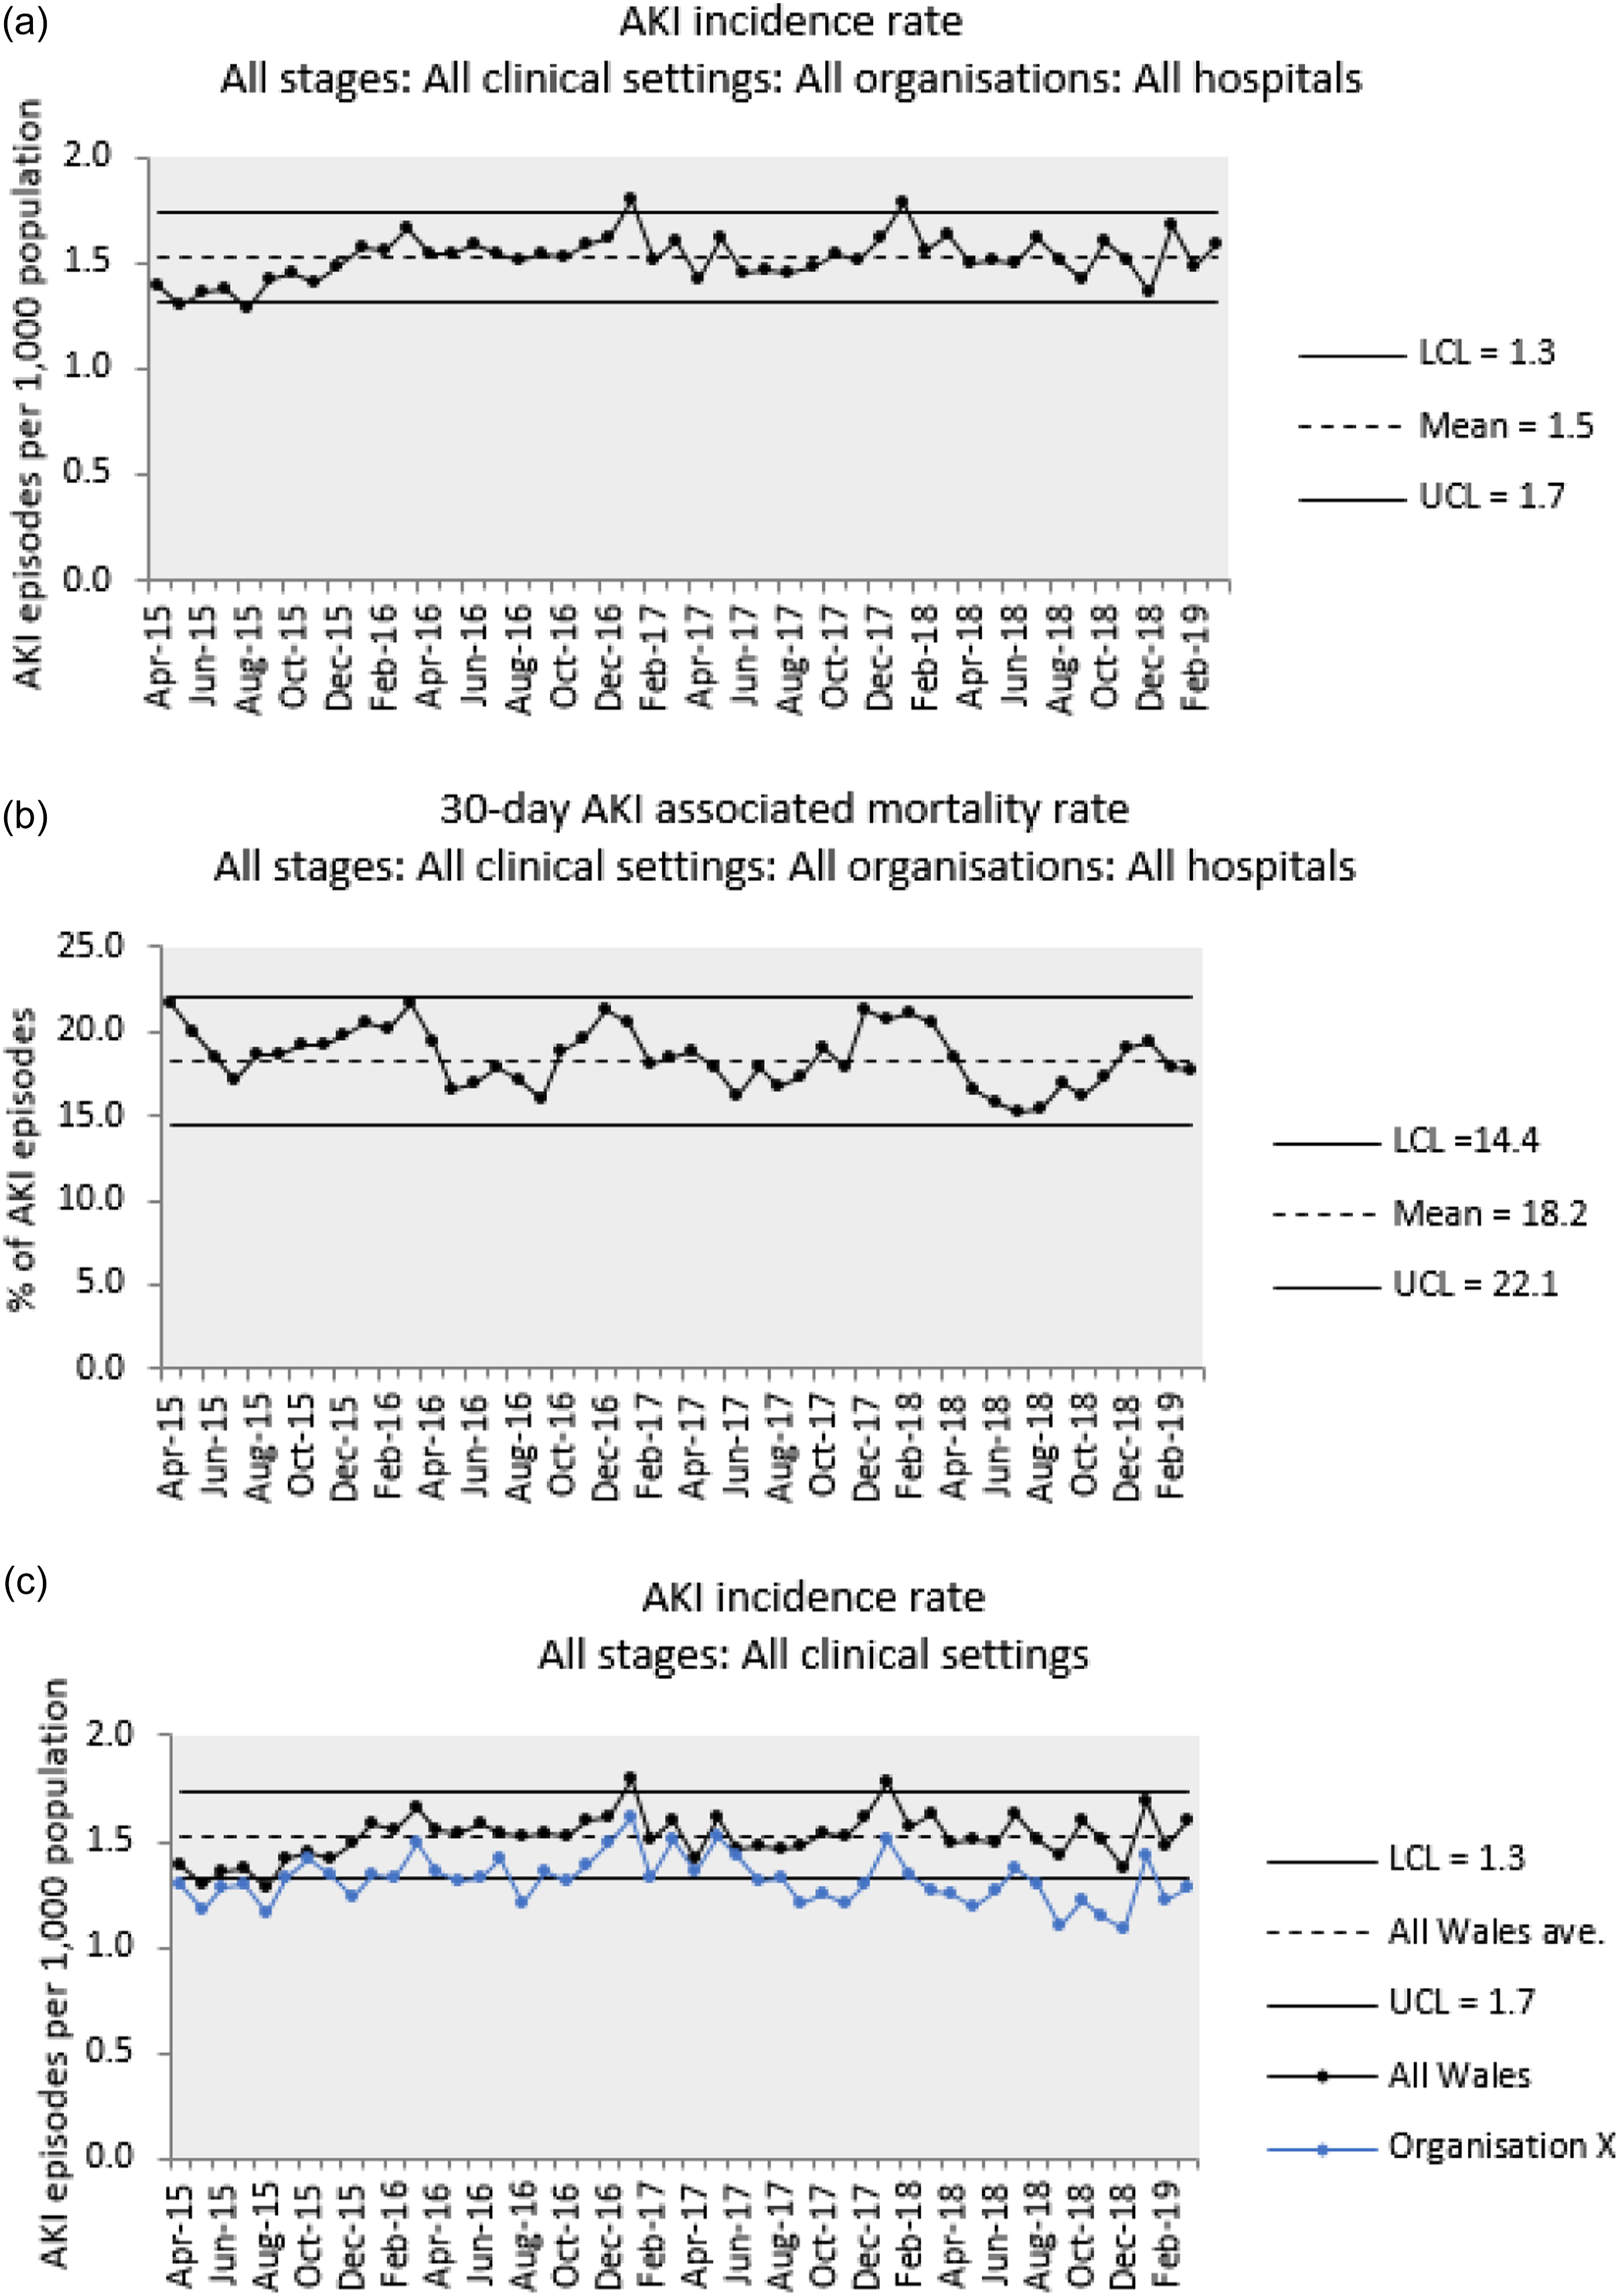
Funnel plots
Although overlaying data for a selected variable of interest onto the national mean using a control chart may have offered a method for comparing data on the effectiveness of health-care interventions related to AKI (Figure 3(c)), this is not suitable for comparing multiple data series simultaneously. Figure 4 shows funnel plots developed by the authors to plot data on the two outcome indicators described above. While these example charts compare the rates of HA-AKI incidence and mortality at different local health boards and hospitals, similar could also be produced for other variables which may be of interest. This could, for instance, include plotting by ward location or clinical speciality within individual hospitals, or for CA-AKI, plotting by primary care cluster and/or GP practice either for all of Wales or within individual local health boards. Moreover, while Figure 4 is based on data for a quarterly time period, similar plots based on the analysis of longer or shorter time periods, such as years, months, or seasons, are also possible. Sample funnel plots developed by the authors to compare the effectiveness of health-care interventions related to AKI: Comparison of HA-AKI incidence rates at local health boards (a) and hospitals (b). Comparison of 30-day HA-AKI-associated mortality rates at local health boards (c) and hospitals (d). The upper and lower bounds of the Poisson distribution for the funnel plots presented in (c) and (d) were calculated using Visual Basic programming routines made available by Pezzullo (StatPages, 2021). These show how control limits can be estimated for hypothetical population sizes starting from zero and results in more ‘smoothed’ looking funnels compared to those in (a) and (b).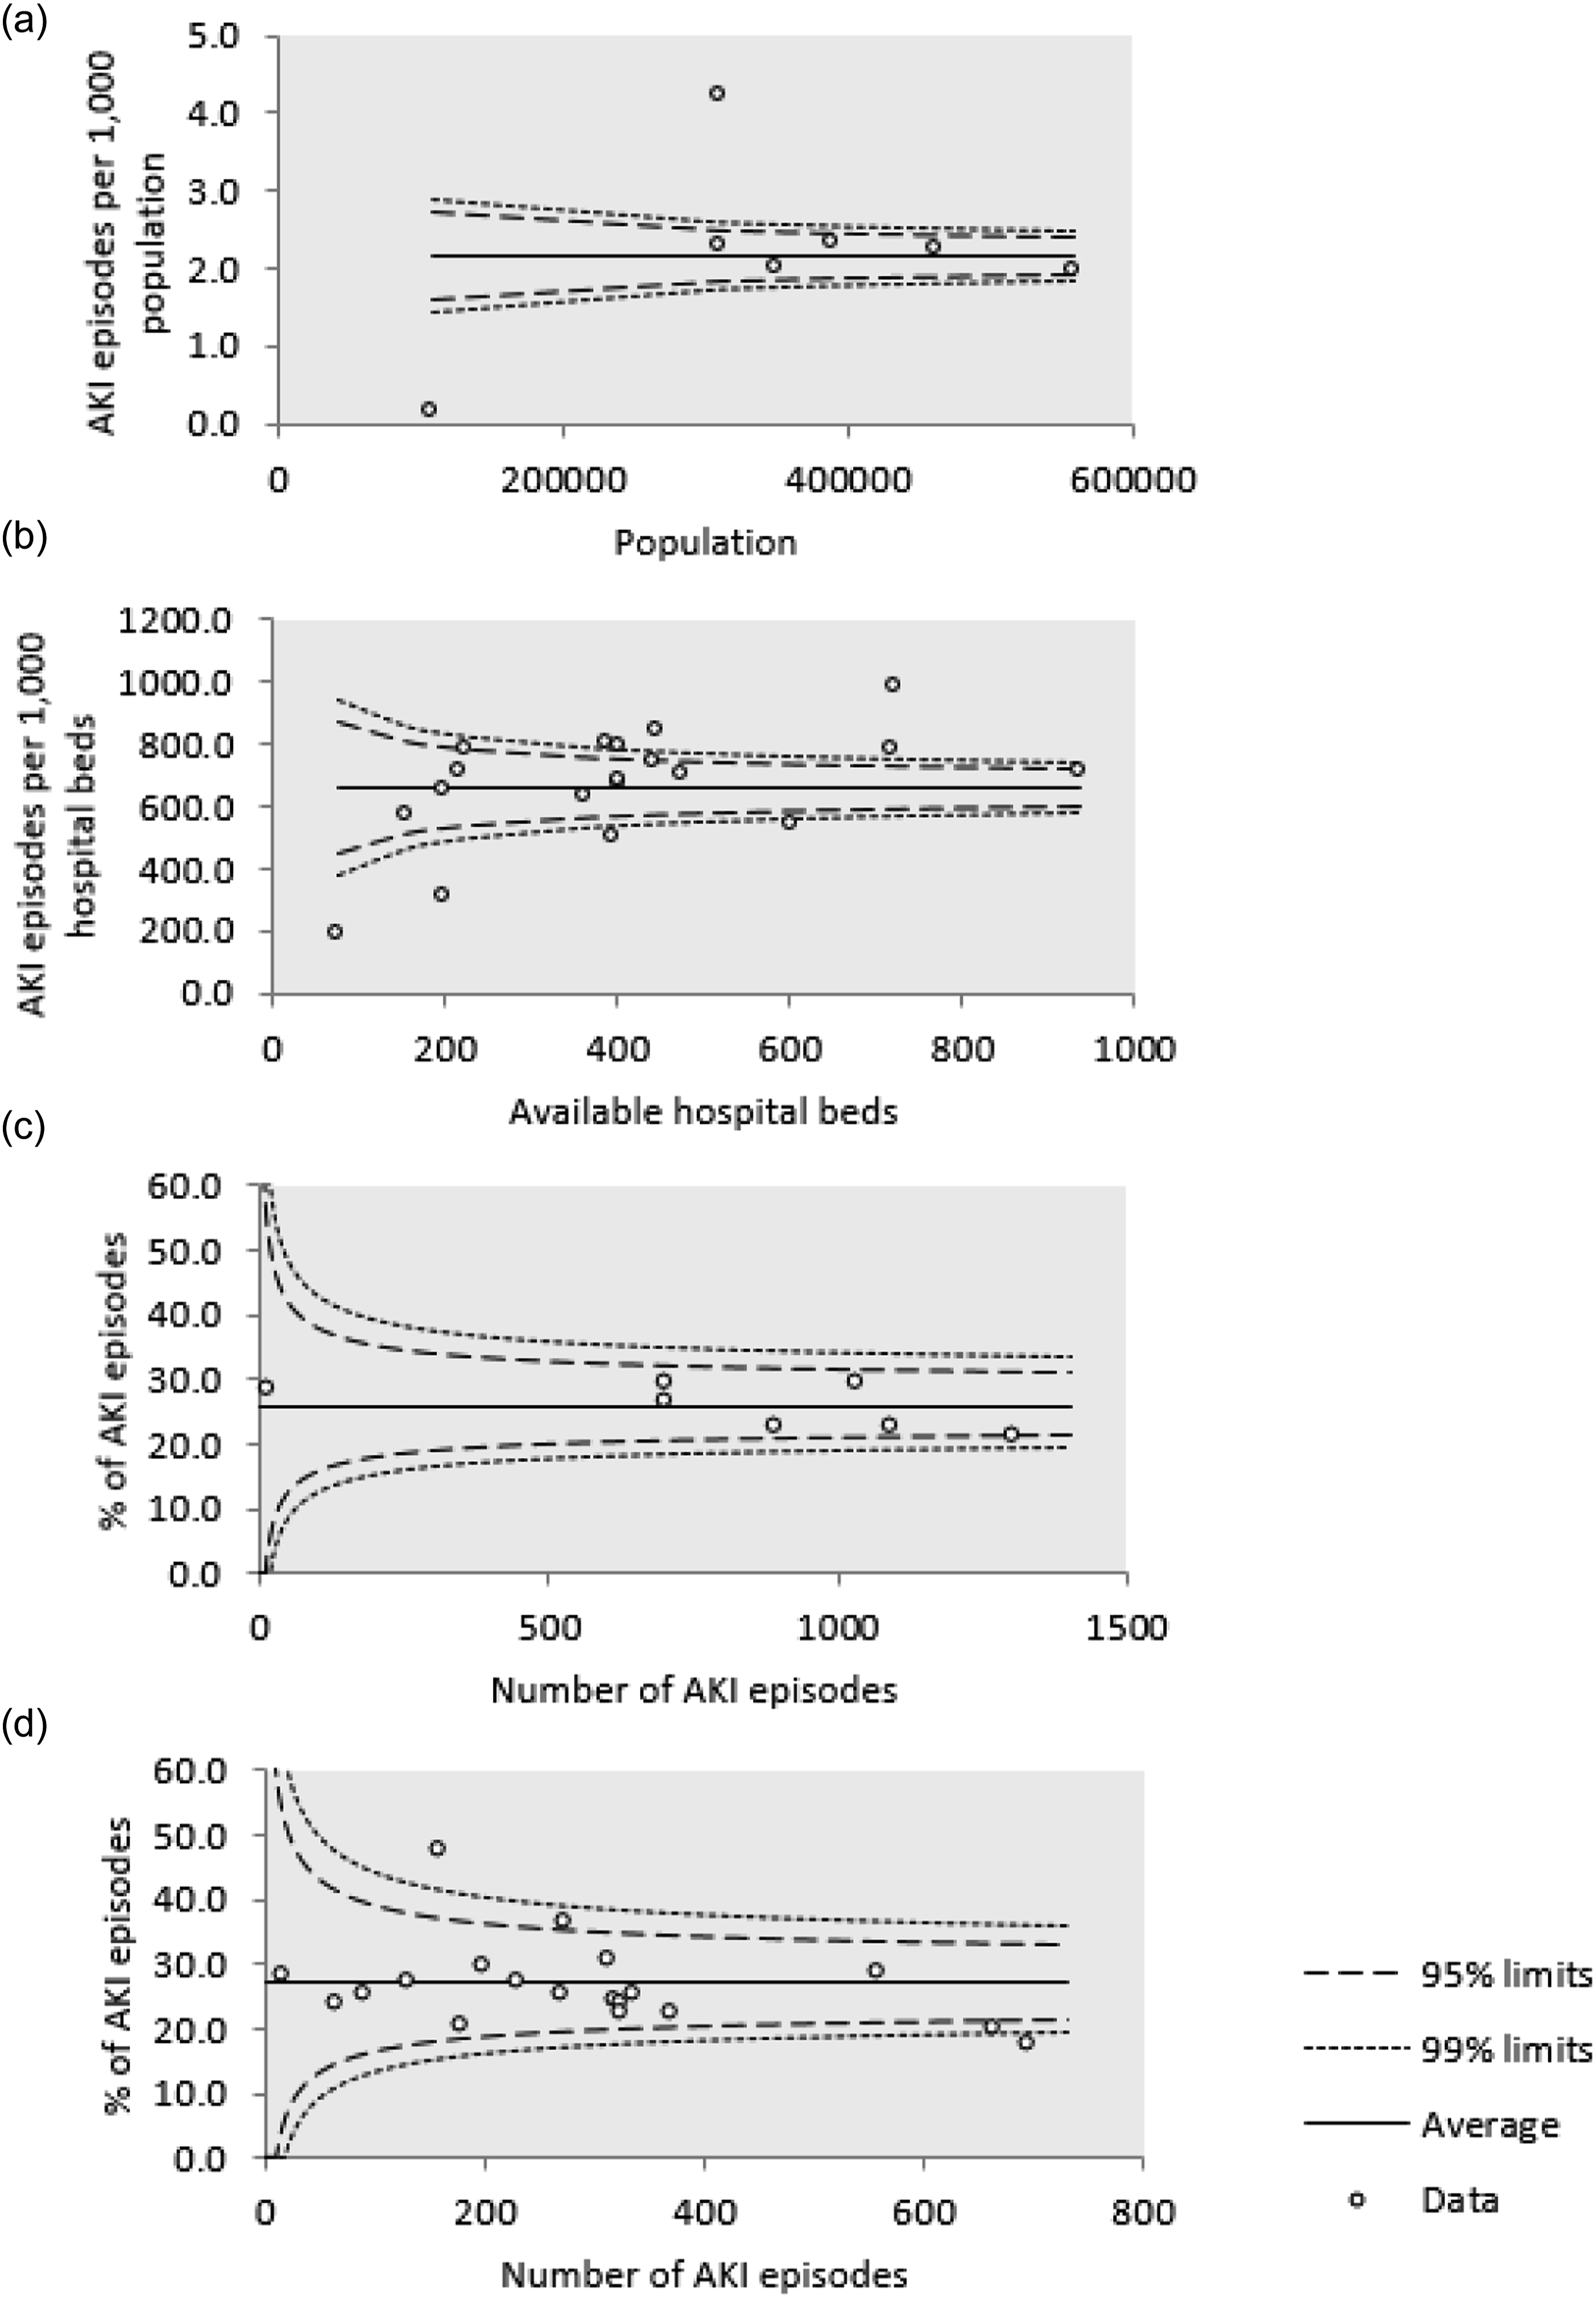
Pareto charts
Based on the ‘Pareto principle’ and ‘law of the vital few’,
27
Pareto charts plot the frequency and cumulative frequency of an event against a selected variable of interest, and can be used to identify factors associated with the most, or highest proportions of an event. Figure 5 shows Pareto charts developed by the authors to plot data on the two outcome indicators described above. While these example charts rank national HA-AKI incidence and mortality by clinical speciality, similar could also be produced for other ‘relevant’ variables which may be of interest, and which do not necessarily relate to location of care. This could, for instance, include plotting by demographic factors such as patient age, gender and/or socioeconomic status, and/or other lower level data such as day and time of presentation. Moreover, while Figure 5 is based on data for a quarterly time period, also possible are similar plots based on the analysis of longer or shorter time periods, such as years, months, or seasons. Sample Pareto charts developed by the authors to investigate potential variables associated with variation in AKI-related outcomes: (A) Number and % of HA-AKI incident episodes by clinical speciality; (B) number and % of 30-day HA-AKI-associated deaths by clinical speciality.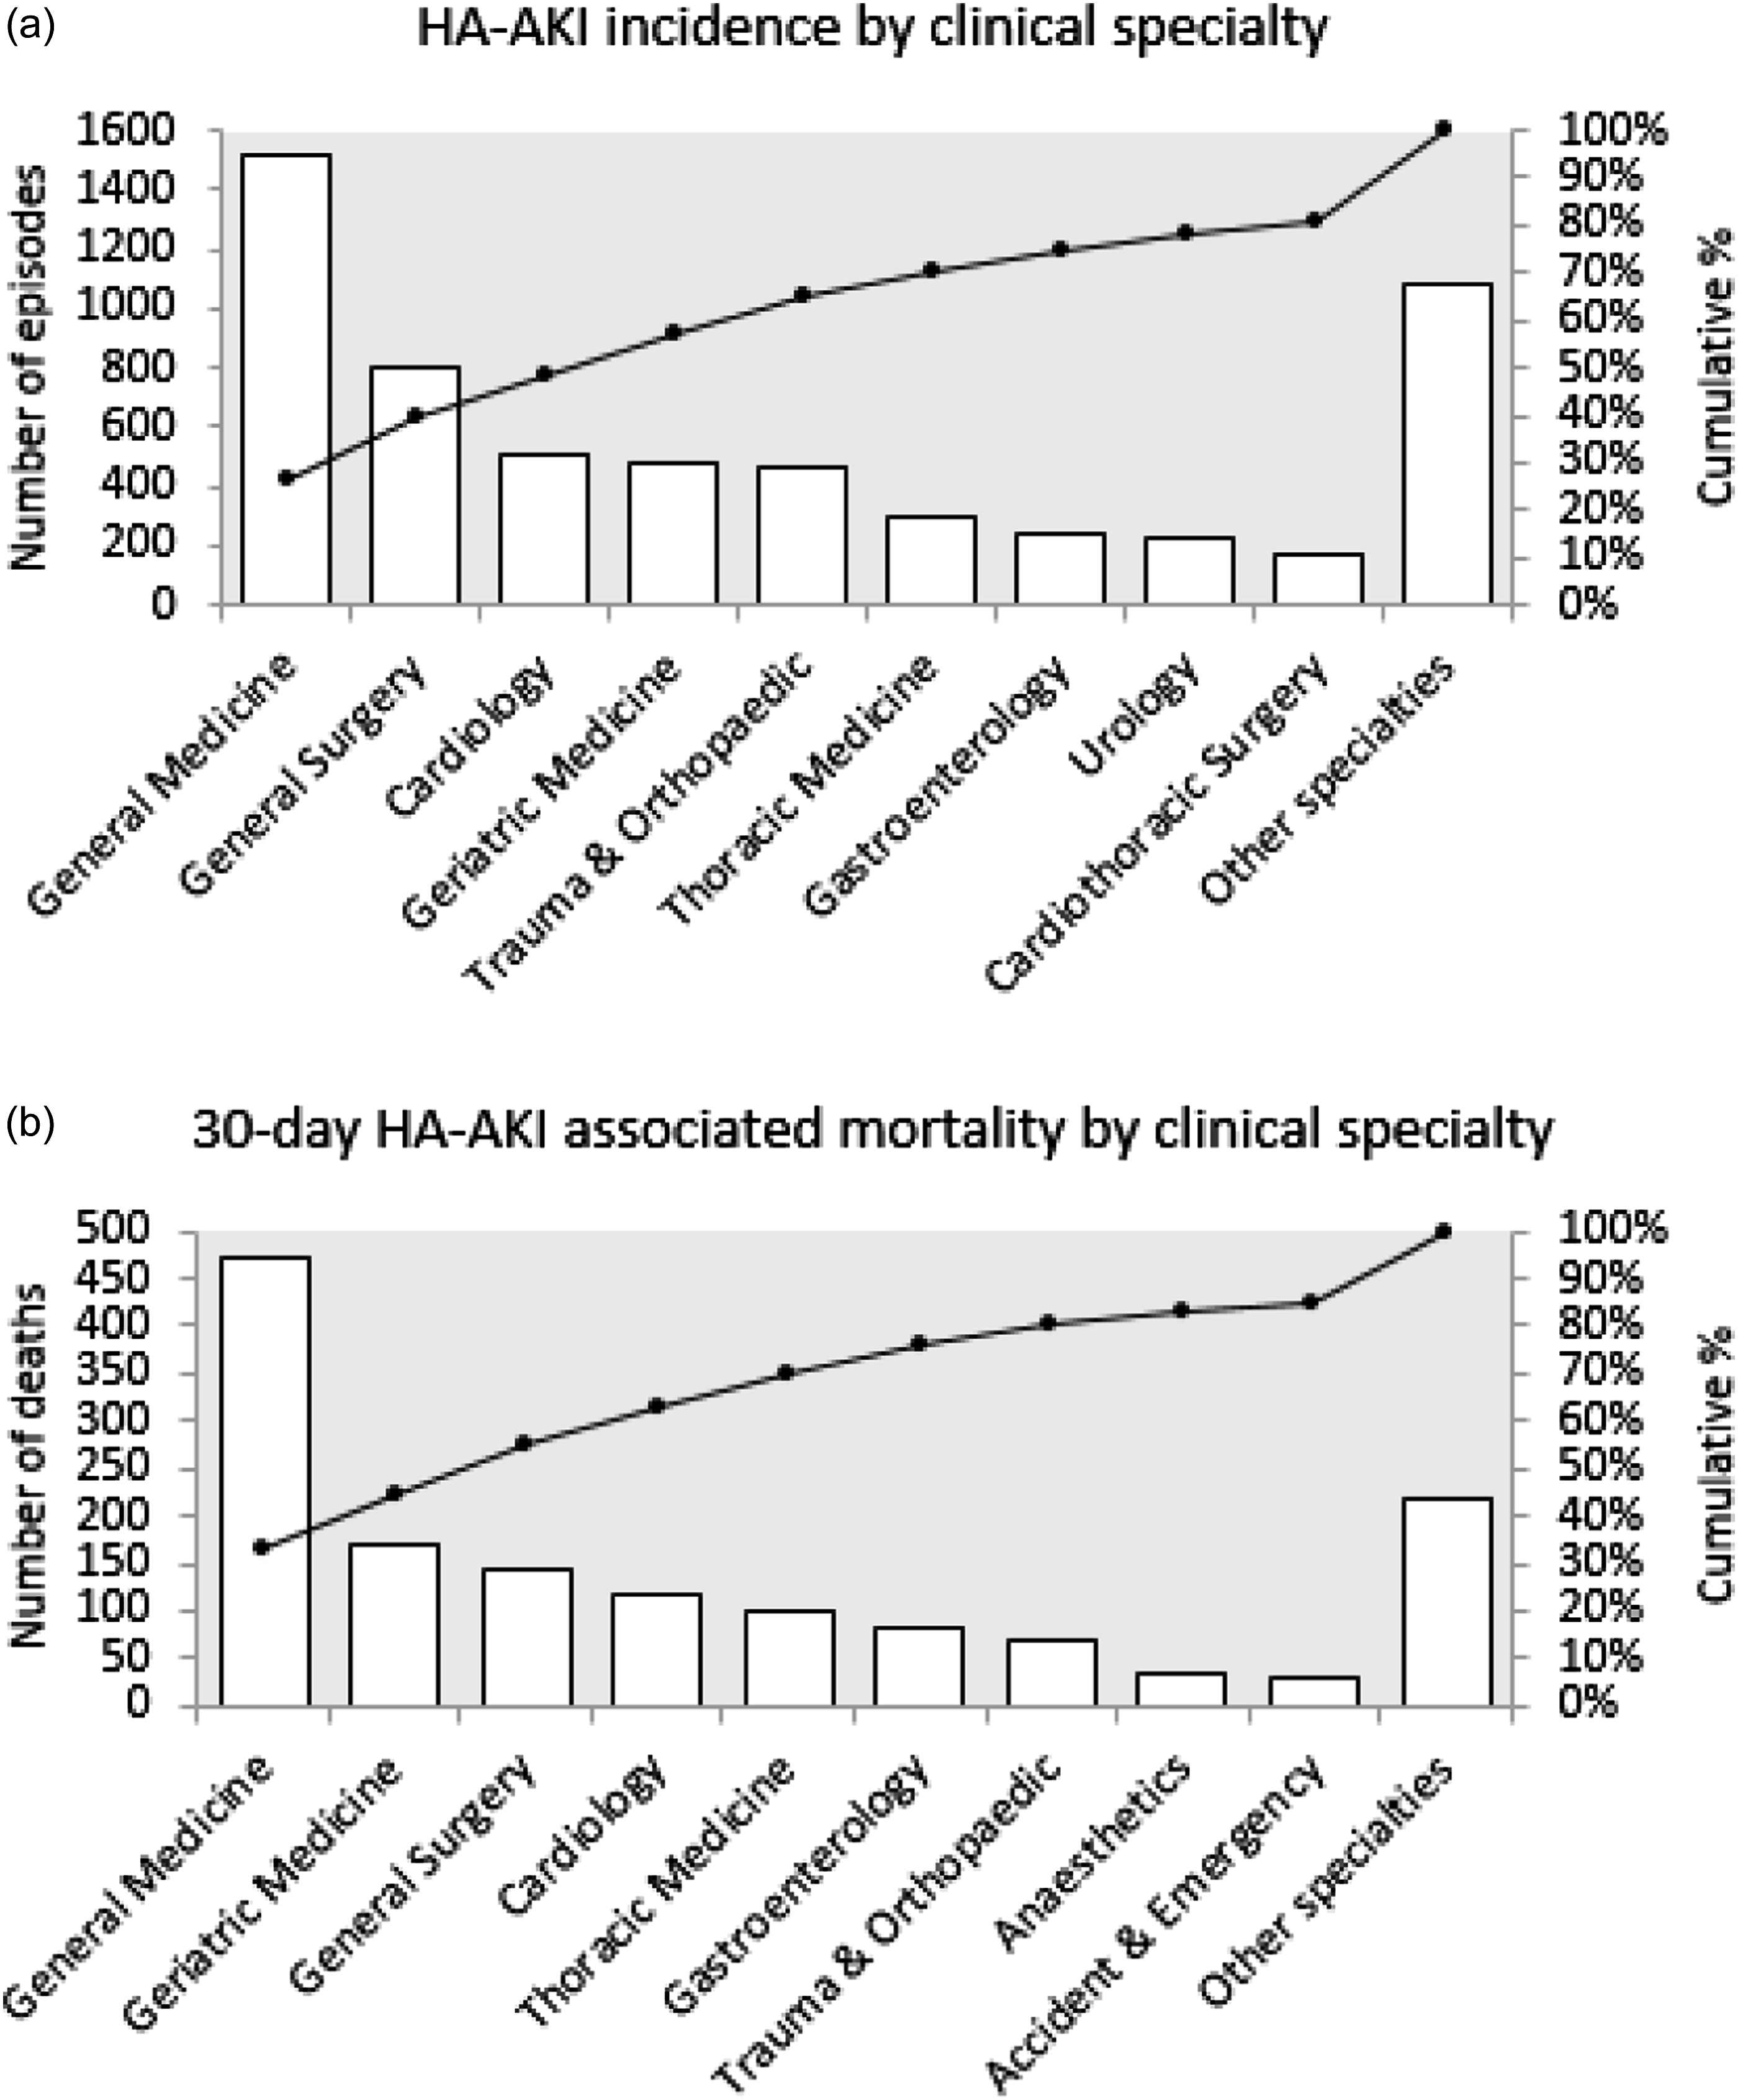
Conclusions (main objective and verifiable conclusions)
The tool presented in this paper has used routine clinical laboratory data to develop a mechanism which could be used to robustly and reliably inform QI in health-care interventions related to AKI across the NHS in Wales. The tool proposes the adoption of: 1. The following outcome indicators to measure the effectiveness of health-care interventions related to AKI: • Rate of AKI incidence, for patients at risk of developing AKI and therefore to measure the impact of strategies to improve the prevention of AKI and • rate of AKI-associated mortality, in patients who develop AKI and therefore measure the impact of strategies to improve the management of AKI, 2. The following SPC techniques to analyse and graphically illustrate variation in the effectiveness of health-care interventions related to AKI: • The control chart, to identify variation in rates of AKI incidence and AKI-associated mortality over time, • the funnel plot, to identify variation in rates of AKI incidence and AKI-associated mortality between different health-care providers, and • the Pareto chart, to identify potential causes of variation in rates of AKI incidence and AKI-associated mortality.
With capacity to identify areas of differing relative outcomes, the tool has potential to facilitate the sharing of good and/or best practice to areas where differences in outcomes exist. While the tool could be used to identify areas with most need and/or potential for QI, and therefore target interventions where they may have greatest impact, the tool could also be used to evaluate the impact of any intervention as an ongoing local self-assessment of effectiveness. To demonstrate this potential, the authors refer to the published Holmes et al. (2020) study. 28 Analysing the data of 132,599 patients with reported AKI, the described study evaluated whether implementation of the aforementioned national AKI alerting system was associated with changes in the number of patients in Wales developing AKI and/or changes in their outcome following AKI. By employing techniques and indicators similar to those applied by the tool presented in this paper, the published study is an example of the potential to evaluate further national and/or local QI initiatives.
While this work has centred on the utility of routine SCr data for QI in health-care interventions related to AKI, the authors present the work as a wider proof of concept which could be applied elsewhere. This includes scalability to other LIMS systems and populations, including at the national and/or more local level such as NHS Trust, Health Board, Clinical Commissioning Group, and/or hospital site. The work here is not only transferrable to health-care systems outside Wales, but it is also applicable to other common preventable and/or reversible health conditions which are not necessarily acute or related to the kidney, but which like AKI, are identifiable by routine laboratory biomarkers. Whereas this work utilises SCr as a biomarker for AKI and often subsequent chronic kidney disease, there are a number of other routinely undertaken laboratory-based quantitative investigations to which the authors anticipate an approach similar to that presented here could be applied. For instance, given non-alcoholic fatty liver disease (NAFLD) is speculated as becoming a major disease burden on NHS resources, 29 collecting, analysing, and presenting data on the aspartate aminotransferase (AST): alanine aminotransferase (ALT) ratio, which is used to identify suspected liver fibrosis and which can lead to chronic and serious liver disease, could help monitor the effectiveness of clinical interventions developed to reduce its incidence and/or its deterioration to a chronic condition. Another example could include Haemoglobin A1c (HbA1c), which is used to identify patients at risk of developing diabetes mellitus at a stage which could reverse their deterioration in glucose homeostasis. Replicating the concept presented here for these routine clinical laboratory data could help inform improvement in the prevention and management of the conditions to which they relate. Also, whereas this work has used internal benchmarks to identify variation in outcomes, defined as means derived from within the data-set itself, other work could use benchmarks which are based on external criteria as points of comparison. This could, for instance, include plotting against minimum care standards which, unlike for AKI, may exist for other conditions.
From a theoretical standpoint, the potential application of big data bioinformatics for health care is well documented,30,31 and this work adds to the growing body of evidence of its utility. In highlighting the potential benefits of centralised laboratory-based data-sets which span the entire health-care system for supporting service improvement, the current work builds on data published by Shine and Barth 32 and in the specific field of AKI, Sawhney and Fraser. 33 It also adds to the wider conversation regarding the emerging role of large databases, not only for epidemiological research and QI but other areas also, including disease surveillance and pandemic management, 34 intelligent population-based commissioning, 35 and population-specific reference ranges. Moreover, while the focus here may have been QI, it is likely data-sets and methods similar to those described in this paper could also inform policymaking and resource allocation for AKI. And while the work described may involve some collaboration and availability of staff to provide data and maintain SPC charts, by utilising data that are already routinely collected for clinical purposes, the proof of concept presented requires minimal additional resource. It therefore offers a cost-effective method for driving and measuring the impact of service improvements and therefore aligns with a value-based health-care approach.
As with all research, the conclusions of this work must be qualified by its limitations. These mostly relate to the AKI alert system which it has applied. Because the system is information technology driven and lacks linkage to other data-sets, it therefore lacks intelligence and does not apply any clinical context. The nature of its algorithm is also such that any patient without a measurement of SCr recorded in the previous 365 days is not included in the data-set developed for this work. The coding of certain parameters within WLIMS, such as clinical speciality, could have an effect on the data analysis and become apparent at the lower levels of granularity. Other issues which can also impact the reliability of implementing SPC methods in the health-care setting include variability in catchment populations and therefore case mix across the service, and variation in data quality and missing data across the service. Despite the described limitations, the authors maintain the view that once validated, and therefore able to be considered reliable, this approach offers a significant opportunity to utilise large data to inform potential QI in care.
Footnotes
Declaration of conflicting interests
The author(s) declared no potential conflicts of interest with respect to the research, authorship, and/or publication of this article.
Funding
The author(s) received no financial support for the research, authorship, and/or publication of this article.
Ethical approval
Work was approved under NHS Wales Service Evaluation Project Registration (Ref: CT/428/14).
Guarantor
Jennifer Holmes.
Contributorship
AOP and JG set up the programme of work. JH developed the data-set and conducted the analysis under supervision of AOP and JG. JH and JG wrote the manuscript. AOP and RH reviewed the manuscript.