
Abstract
Introduction
The pneumatic tube system (PTS) is an automated and fast modality of transportation of biological samples, but it has been reported to induce preanalytical errors.
Aim
To study the influence of transportation by PTS on biochemistry tests which are particularly sensitive to haemolysis and atmospheric pressure variation.
Materials and methods
We compared laboratory results of arterial blood gas, sodium, potassium, chloride, lactate dehydrogenase, aspartate aminotransferase, alanine aminotransferase, glucose and haemolysis index of samples conveyed simultaneously by PTS and by courier.
Results
We recruited 30 patients from the sampling room and 40 patients from the intensive care unit. Transport through PTS resulted in a significant increase in aspartate aminotransferase and potassium without exceeding the limits of acceptability. Potassium was significantly more increased for samples transported in a higher speed line (p = .048) but without exceeding the limits of acceptability. No significant impact was noted on haemolysis indices. The pO2 variations due to PTS transportation exceeded the limit of acceptability with significant intra-individual variations.
Conclusion
Our PTS is validated for biochemistry tests results. It reduces turnaround times without affecting sample quality. However, the interpretation of arterial blood gas results should be careful for samples transported by PTS.
Introduction
Improving turnaround time is essential for laboratory quality management. 1 Thus, pneumatic tube systems (PTS) are frequently used to control the time of biological samples transportation in hospitals. PTS is an automated and fast delivery system from phlebotomy site or clinical departments to laboratories. 2 It significantly saves time to report results and ensures better organization in hospital structures. 3
However, this mode of transport can lead to errors in the preanalytical phase.2,4 Depending on the system configuration, the transported samples can be subject to physical forces such as sudden acceleration/deceleration waves, changes in direction, long distances, high speeds, temperature changes, atmospheric pressure changes generated by the vacuum system and blood movement in tubes and vibrations. 5 These forces can potentially affect the quality and integrity of the samples essentially by causing haemolysis2,4 and changes in blood gas parameters. 6
The characteristics of the PTS vary from one system to another. Verification should be performed on each PTS and during eventual modification of system parameters. 7 The requirements of ISO 15189 standard imply managing effectively this preanalytical device.
The aim of this study was to investigate the influence of PTS transport on biochemical tests, particularly those sensitive to haemolysis and atmospheric pressure variation.
Materials and methods
This is a cross-sectional study carried out in the Clinical Chemistry Laboratory. We recruited unselected adult volunteers from the sampling room and patients from the medical intensive care unit. Demographic and clinical data was not collected.
Materials
In the sampling room, three tubes were collected for each subject. All samples were taken by the same experienced phlebotomist by a single puncture at the elbow fold with needle collection device and collected on lithium heparinate tubes. In order to minimize as much as possible any other known factors of haemolysis, the tourniquets were loosened from the beginning of filling and the tubes were stirred by slow flips. All subjects were informed about the purpose of the study and had given oral consent. For each of the patients hospitalized in the intensive care unit, two duplicate arterial samples were taken by the nurses of the department at the femoral artery, in syringes containing heparin (heparin sodium 5000UI). Strict anaerobic conditions were respected.
The samples were immediately transported in two paths, through the PTS and on foot at room temperature, to the laboratory from the same pneumatic line.
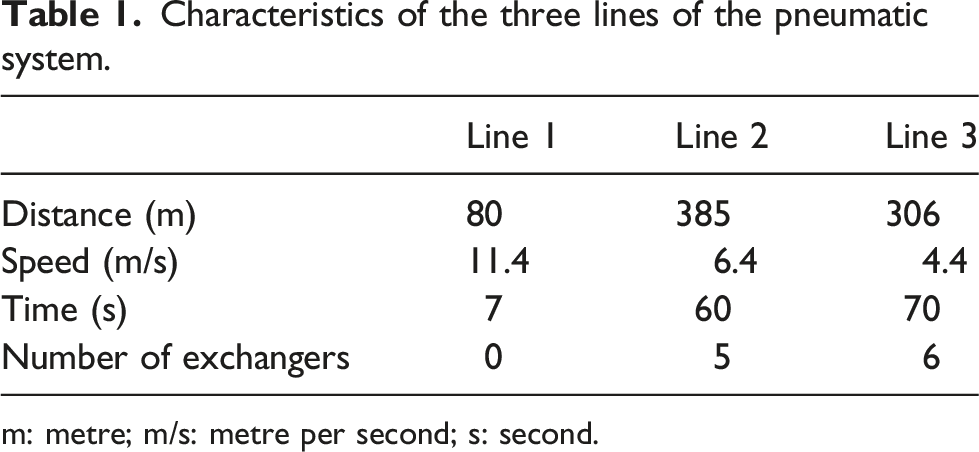
The PTS studied (Aerocom ®) is a bidirectional network of tubes in which sample transport vectors (cartridges or capsules) are transported between transmitting and receiving stations located, respectively, in clinical departments and laboratories. The PTS is composed of a main station ‘the turbine’ (which generates a flow of compressed air to ensure the movement of cartridges), 23 peripheral stations, six exchangers and sensors. A computer system manages the PTS and ensures the traceability of all shipments. Due to the RFID (Radio Frequency Identification) electromagnetic chips on the cartridges, their movements are detected by sensors installed at each station. We conducted our study on three lines of the PTS whose characteristics are summarized in Table 1. • Line 1: (from the sampling room to our laboratory) was chosen for the largest number of samples received on this line. • Line 2: (from the cardiovascular surgery department to our laboratory) was analysed for its longest length travelled. • Line 3: (from the medical intensive care unit to our laboratory) for blood gas samples. Characteristics of the three lines of the pneumatic system. m: metre; m/s: metre per second; s: second.
For the three lithium heparinate tubes collected for each subject, one tube was transported by line 1, one tube by line 2 and the third by foot. Line 2 has a longer distance and transport by line 1 has a higher speed.
For syringes, one was transported by line 3 and the other by courier.
The time elapsed between taking and receiving samples at the laboratory when transported by courier was noted. The variation of the temperature of the PTS in relation to the ambient temperature was controlled using a temperature logger, introduced into the cartridge.
Methods
Samples transported by PTS stored at room temperature while awaiting the couriered samples to mimic routine conditions. The samples were analysed simultaneously under the same conditions (at the same time, and on the same centrifuges and analyzer).
The choice of parameters studied was explained by the frequency of their prescription, their sensitivity to the influence of pressure variations that may occur in the PTS or to the influence of haemolysis on their concentrations.
These parameters were: - Arterial blood gas (blood acidity (pH), oxygen partial pressure (pO2) and carbon dioxide partial pressure (pCO2) on the ABL800 Flex® Radiometer analyzer. - Sodium, potassium, chloride, lactate dehydrogenase (LDH), aspartate aminotransferase (AST), alanine aminotransferase (ALT) and blood glucose were run on Roche Cobas C501 chemistry analyser (Roche Diagnostics GmbH, Mannheim, Germany). - The haemolysis index (HI) is a semi-quantitative indicator that assesses the degree of potential interference due to haemolysis.
2
It was determined for lithium heparinate tube samples, on Roche Cobas C501 chemistry analyser (Roche Diagnostics GmbH, Mannheim, Germany). HI is approximately equivalent to haemoglobin concentration of 1000 mg/dL. Manufacturer HI cut-offs were used.
Statistical analysis
The statistical analysis was performed with the Statistical Package for Social Sciences ® (SPSS) software (version 20.0). The hypothesis of the normality of the distribution was evaluated by the Shapiro–Wilk test. Data was presented as mean ± standard deviation (SD) or as median and interquartile range (IQR) when parameters were Gaussian or non-Gaussian distributed, respectively. We used Student's T-test or Wilcoxon's non-parametric test (for normal or non-normal distribution parameters, respectively) for the comparison of the matched samples of the two transport modalities (by courier and by PTS) and the two different lines of the PTS (by line 1 and line 2) for the triplet samples to study the effect of distance travelled and speed on biochemical tests. A difference between the results was considered significant for a p-value < .05.
For each parameter, we calculated the bias (%) (the average percentage of differences) according to the formula and taking into account courier transport values considered as reference values (C) and pneumatic transport values (P): Bias (%) = [(P-C)/C] x 100
The limit of acceptability for interpreting the results was the total acceptable limit variation (TALV). We compared the biases (%) obtained compared to TALV to assess clinical impact. Thus, the variation induced by the PTS routing was considered significant if exceeding the TALV. The TALV was calculated for each parameter and was expressed as a percentage (%) (Appendix 1).
The TALV takes into account two criteria: - Analytical variability limit = ± 2.77 CVa (CVa = mean coefficient of variation (CV) of intermediate fidelity (%) (all levels combined)). - The limit biological variability = ± 0.5 CVb (CVb = intra-individual CV): expressed according to the tables of Ricos et al. (2014 version)
8
For pO2, we compared the mean variation between the 2 transport routes with the acceptability standard proposed by the French Society Of Clinical Biology (SFBC) (CVb not determined). 8
Results
In total, we recruited 30 patients from the sample room and 40 patients from the medical intensive care unit.
The temperature variation during the transfer from the clinical unit to the laboratory did not exceed 0.5°C (27.18 ± 0.19 °C to 27.3 ± 0.18 °C; p = .78). The transport time via PTS was significantly shorter than the courier's transport time (54 s ± 18 s vs 8 min 28 s ± 4 min 15 s; p < .001).
Comparison of biochemical parameters transported by courier and by two pneumatic system lines of different characteristics.
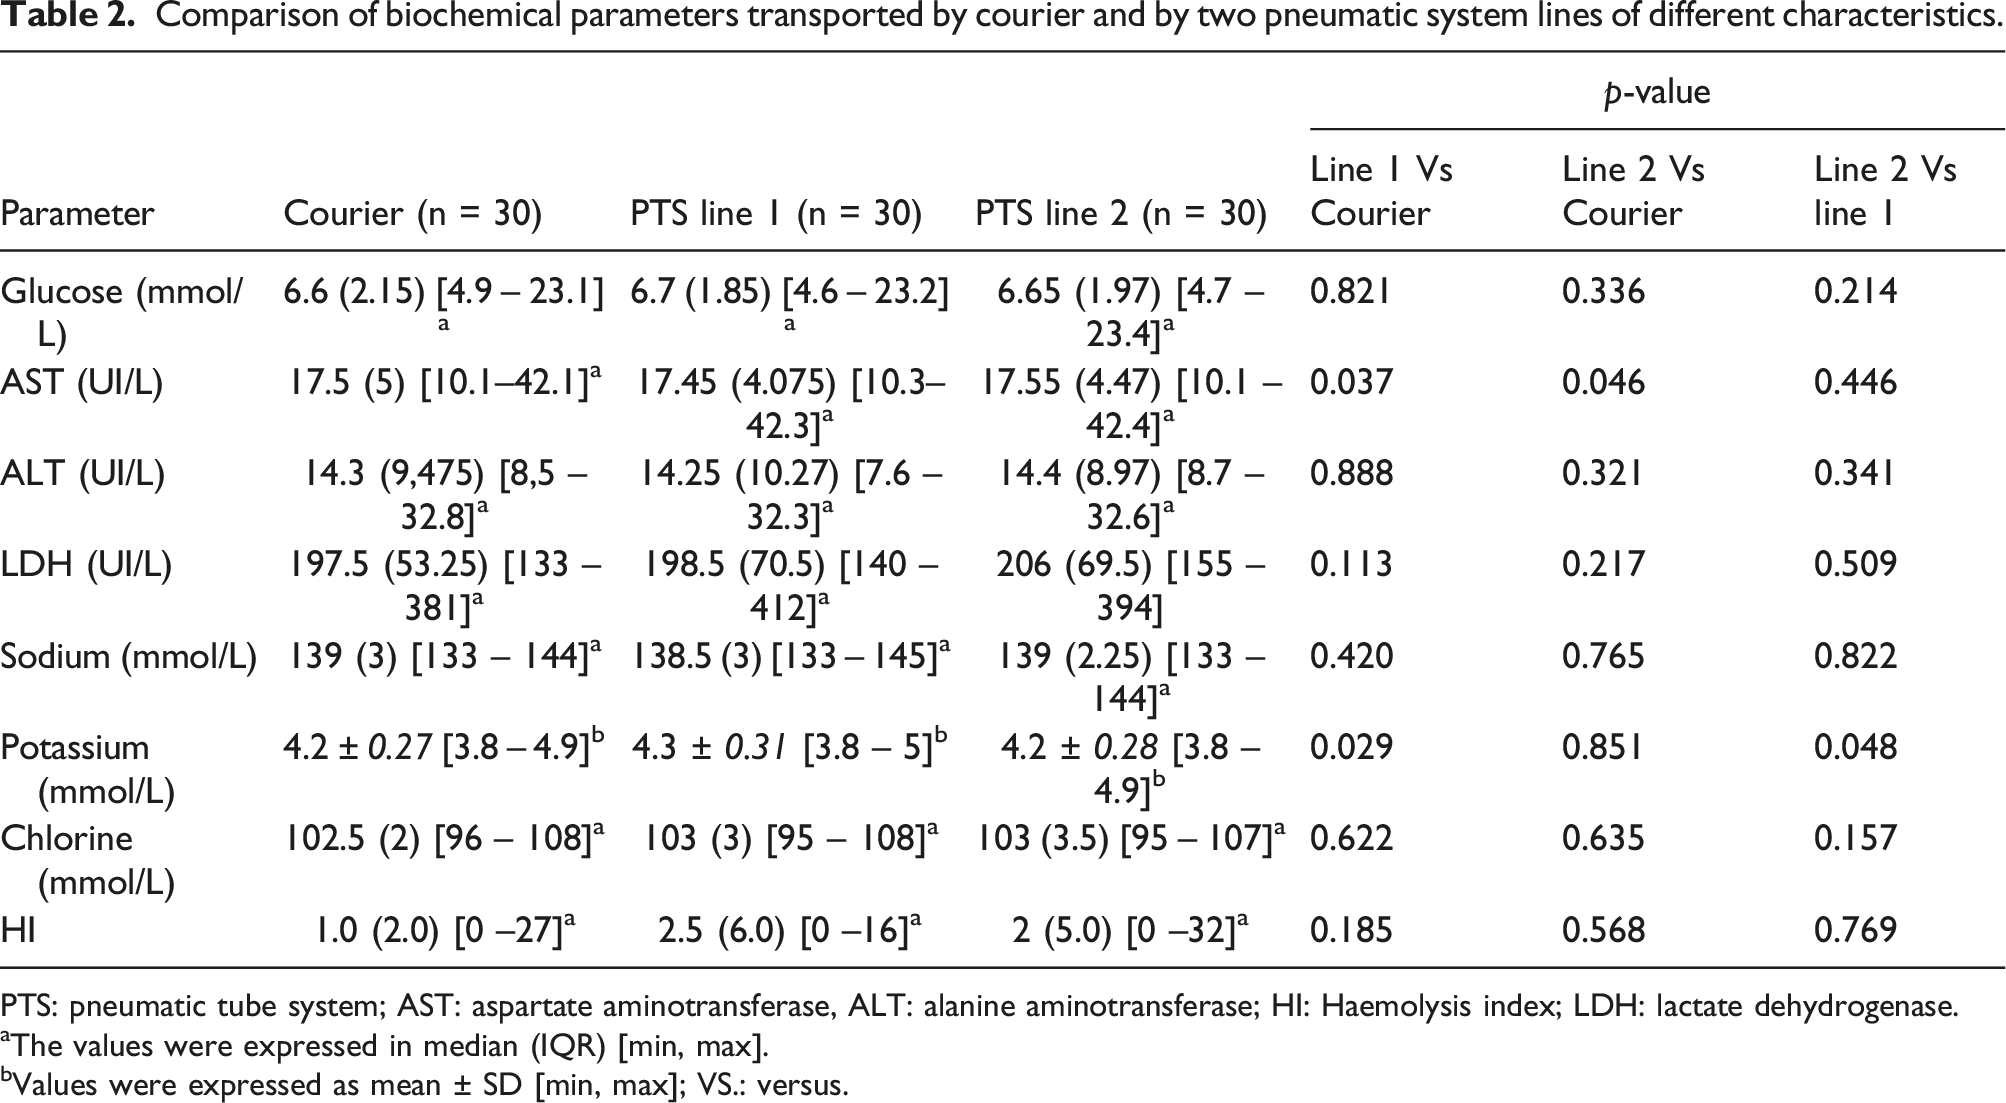
PTS: pneumatic tube system; AST: aspartate aminotransferase, ALT: alanine aminotransferase; HI: Haemolysis index; LDH: lactate dehydrogenase.
aThe values were expressed in median (IQR) [min, max].
bValues were expressed as mean ± SD [min, max]; VS.: versus.
Median bias relative to the calculated total acceptable limit variation (TALV).
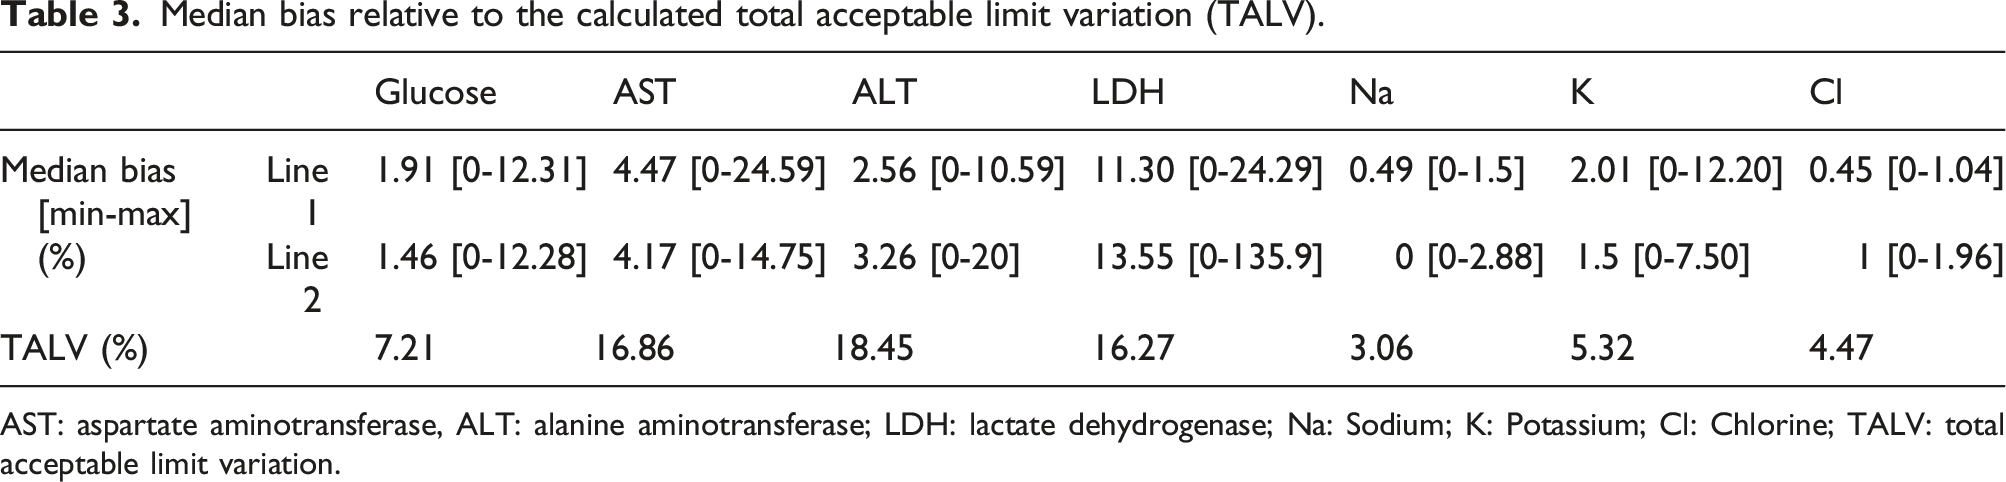
AST: aspartate aminotransferase, ALT: alanine aminotransferase; LDH: lactate dehydrogenase; Na: Sodium; K: Potassium; Cl: Chlorine; TALV: total acceptable limit variation.
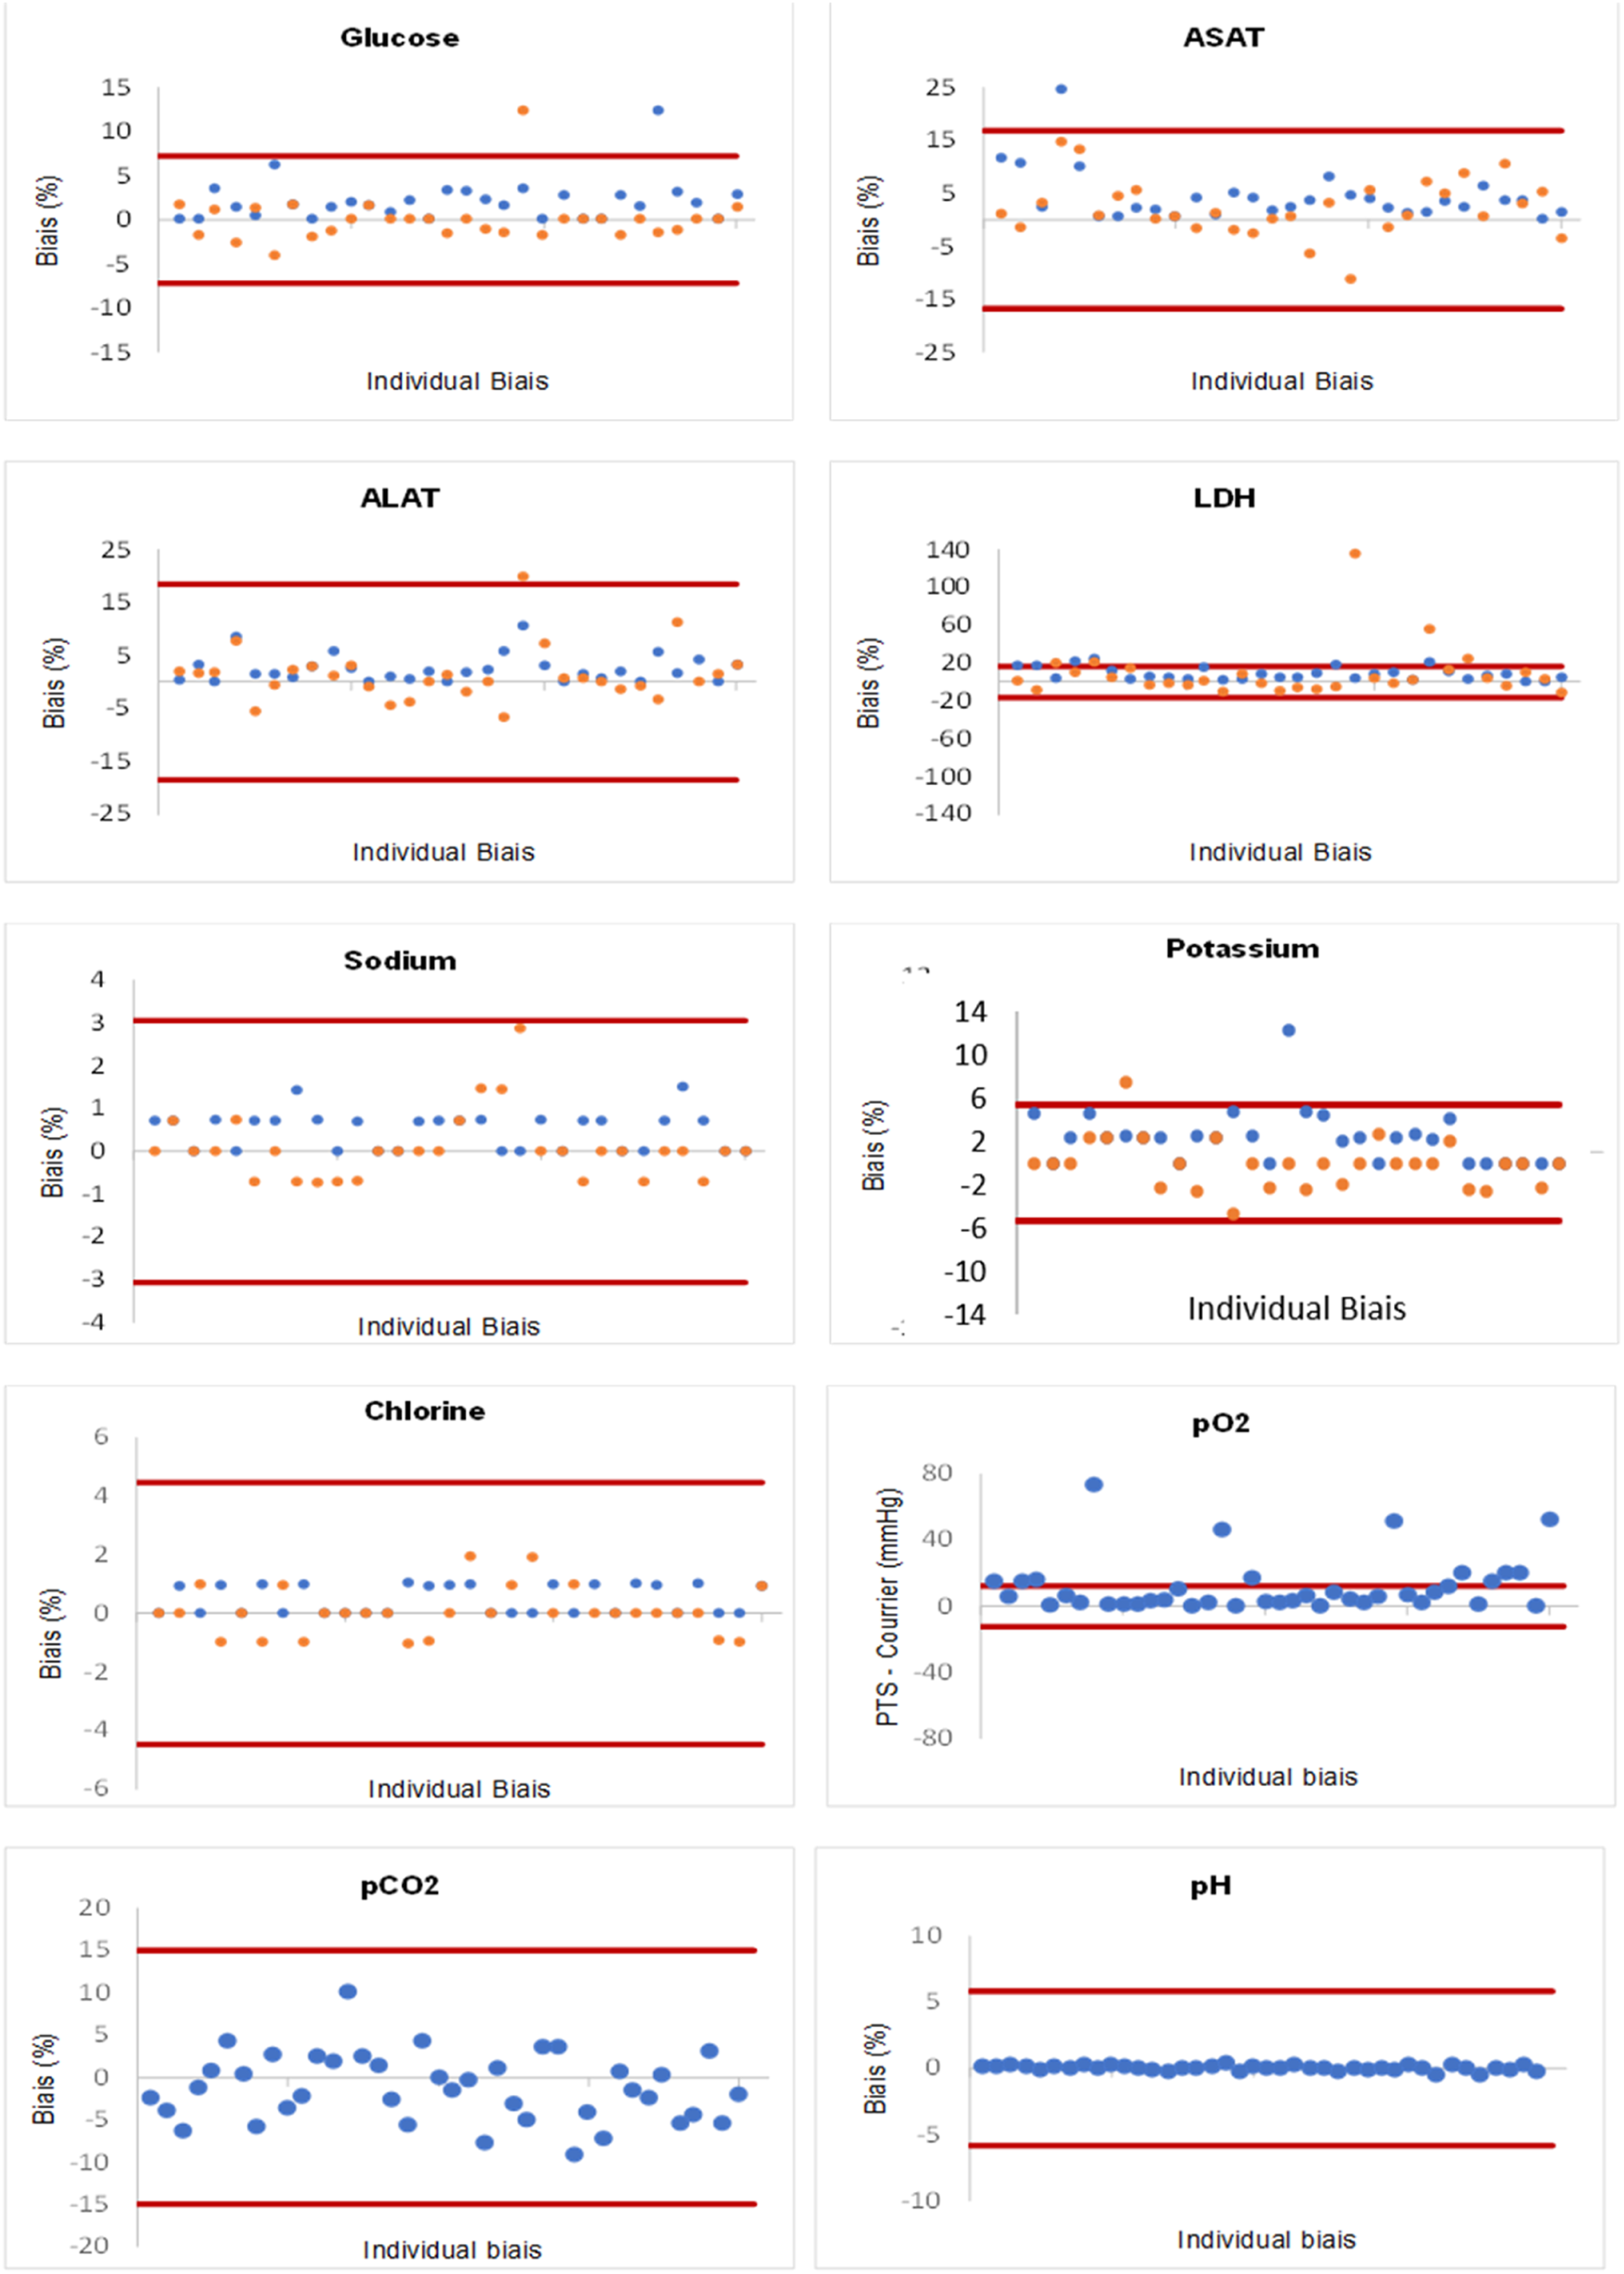
Representation of parameter variations according to acceptable limits. Note. The minimum and maximum acceptable limits of total acceptable limit variation (TALV) (for pO2 according to the SFBC acceptable limits) are marked by red lines. Each dot is an individual patient bias. The dots in blue correspond to the biases in line 1. The dots in yellow correspond to the biases in line 2; AST: aspartate aminotransferase; ALT: alanine aminotransferase; LDH: lactate dehydrogenase; pH: blood acidity; pO2: oxygen partial pressure; pCO2: carbon dioxide partial pressure.
The median and IQR differences in HI were: 1.0 (2.0) for the walking route, 2.5 (6.0) for line 1 and 2.0 (5.0) for line 2 (Table 2). HI increased slightly by pneumatic transport (the two lines) compared to pedestrian transport but the difference was not statistically significant (Table2, Figure 2). For all samples, HI did not exceed the limits described for glucose, ALT, AST, potassium, sodium and chloride. LDH is the most sensitive parameter to haemolysis with possible interference for HI that exceeds 15 (arbitrary unit). The frequencies of the samples with an HI that exceeded the limit for the LDH were 4.93%, 3.7% and 6.66% for the pedestrian track, line 1 and line 2, respectively. For samples with HI that exceeded the limit for LDH, haemolysis was associated in only one patient with a significant change in LDH (Bias = 22%) after transport by PTS. Hemolysis index stratified by transportation modality. Note. PTS: pneumatic tube system; HI: Haemolysis index; The values were expressed in median (IQR) [min, max].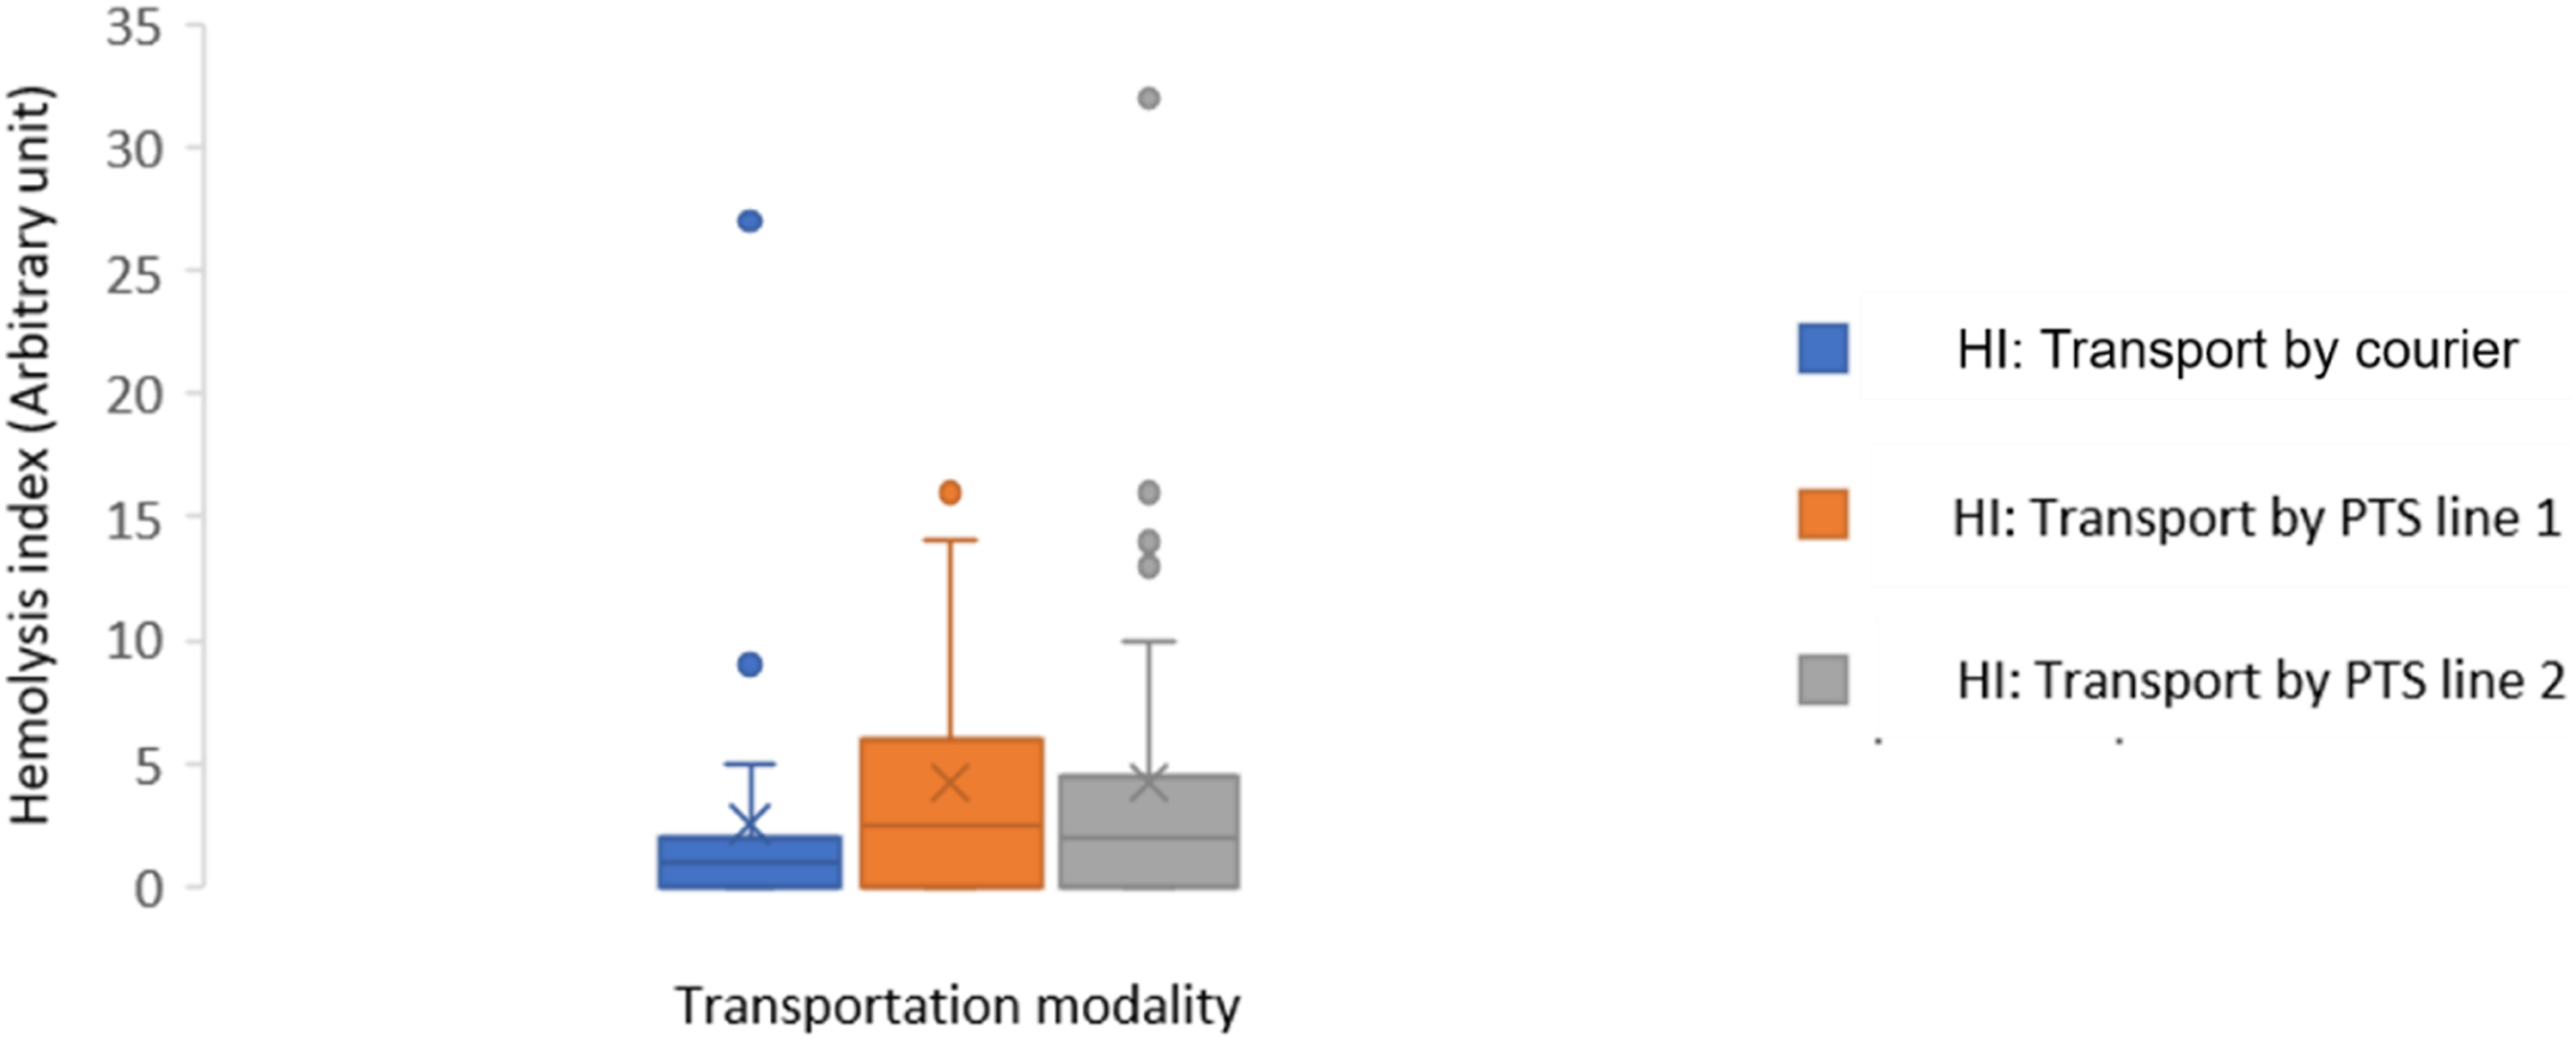
Comparison of blood gas parameters between transport modalities (PTS Versus Courier).
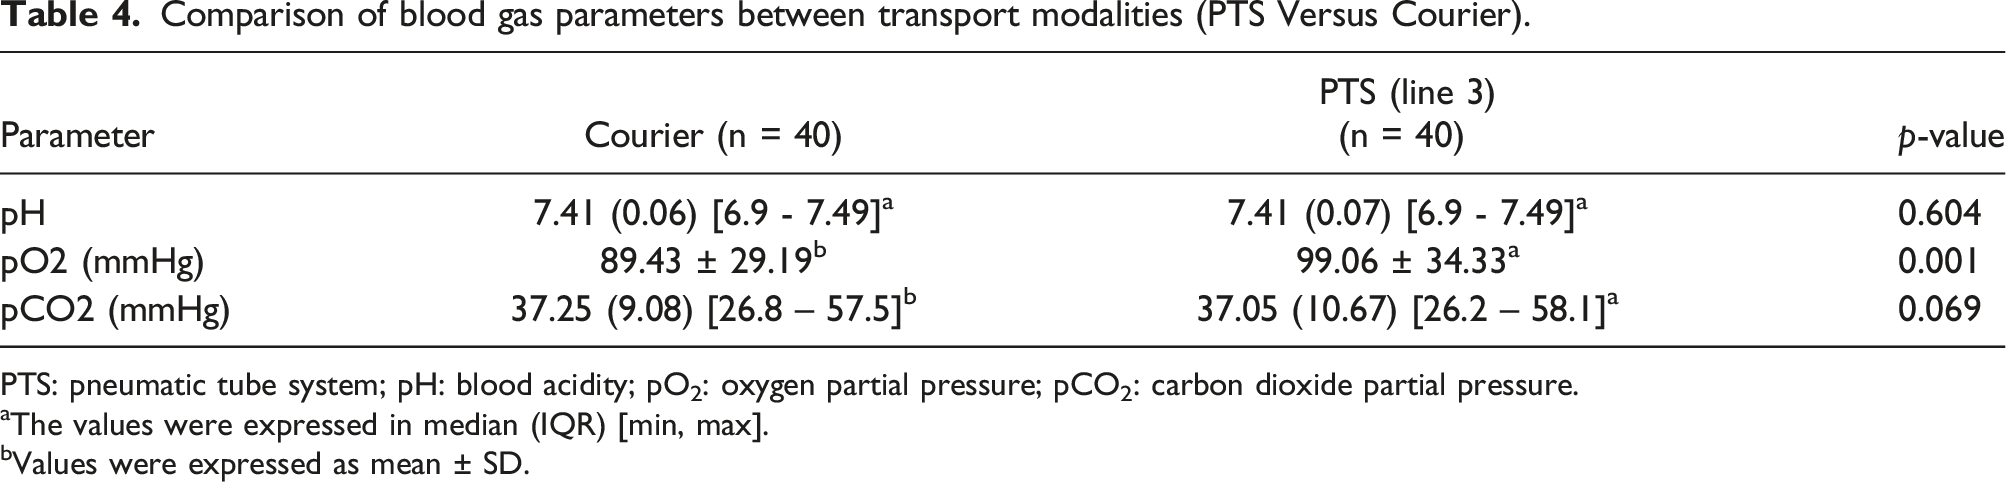
PTS: pneumatic tube system; pH: blood acidity; pO2: oxygen partial pressure; pCO2: carbon dioxide partial pressure.
aThe values were expressed in median (IQR) [min, max].
bValues were expressed as mean ± SD.
Discussion
The installation of the PTS at our University Hospital Center managed the problems of staff shortage and organized the internal logistics of the hospital. Our study reconfirmed the effectiveness of the PTS by reporting a considerably shorter delivery time compared to the transport on foot. This has been reported in almost all publications on PTS.3,4 To study the effect of transporting blood samples by PTS under conditions close to practice, we recruited unselected patients.
Previous studies have shown that samples transported by PTS have a significantly higher haemolysis frequency.2,9 Several factors could induce haemolysis by pneumatic transport, such as the level of filling of the tubes and the technical characteristics of the PTS. 4 Rapid transport of blood samples in the PTS can cause red blood cell degradation following rupture of the erythrocyte membrane associated with the release of haemoglobin and other intracellular components of erythrocytes into plasma.2,4 In our study, HI had low values and the difference between the 2 modes of transport was not significant (Figure 2). Potassium, LDH and AST results were not influenced by changes in HI induced by PTS except the LDH result of one sample. These results are consistent with those of Fernandes' study. 10 In our study, PTS transport induced minimal variations in the results of biochemical tests (Table 2) including those most likely to be affected by pneumatic transport (LDH, potassium, AST).11,12 These variations did not exceed the TALV (Table 3).
For LDH, previous studies have shown that this is the parameter most frequently influenced by PTS.13,14 In our study, PTS did not significantly influence LDH levels
It has been described that transport by PTS would have increased potassium levels.15,16 This increase in potassium has been explained by the increase in the plasma concentrations of intra-erythrocyte compounds following cell lysis. 17 In our study, the mean potassium level increased significantly when the samples were transported via line 1, but the median bias was acceptable (Table 2). This increase was not related to changes in HI. All HI determined did not exceed 32 (Manufacturer HI cut-off for potassium is 90) (Figure 2). In addition, by comparing the effect of transport by the two lines of PTS of different characteristics, the average potassium level increased significantly when the samples were transported by line 1 with a higher speed. The comparison between the two lines showed a statistically significant difference (Table 2). Indeed, the physical stress induced by PTS has been shown to be closely related to acceleration, deceleration and changes in direction. The acceleration vector (velocity) could increase haemolysis and could be considered a quality objective. 9 Evliyaoğlu et al. found that the HI values slightly increased as the transport rate and distance of the PTS increased. 18 Thus, in our study, the variation in velocity would have an effect on potassium levels but this variation would not have an impact on clinical interpretation.
Transport by PTS resulted in a statistically significant increase in AST but not exceeding the TALV (Table 3). The maximum variation of +3.5 IU/L did not impact the clinical interpretation of this test. This effect was described in several studies.2,12 Moreover, for the studies of Poznanski et al. 13 and Steige H and Jones JD, 11 the variations between courier and pneumatic transport were not significant. The variation of AST levels induced by PTS transport would be independent of the characteristics of the lines. Comparison between the two lines did not show a statistically significant difference (Table 2).
Regarding the determinations of glucose, ALT, sodium and chloride, no significant differences were found (Table 2). Our results were consistent with the results of the other studies.2,4 These tests are not very sensitive to hemolysis.
In our study, transport by PTS had no effect on pH and pCO2 measurements (Table 4). For pO2, the values of the pneumatically transported samples were significantly higher than the values obtained by courier (Table 4). Variations exceeded the limit of acceptability with significant intra-individual variations (Figure 1). These results were consistent with previous studies.19,20 The study by Peter et al. 20 showed that the effect of PTS on pO2 induced significant intra-individual differences up to 40 mmHg for pO2 measurements compared to the transport by courier. This variation could be explained by contamination by ambient air due to the effect of pressure. 20 Given the pO2 of the ambient air is approximately 160 mmHg, it is likely that the rapid transit and agitation of the sample through the PTS caused the pO2 in the syringes to be balanced with the air in the PTS cartridge. In our study, we eliminated the air bubbles and sent the syringes tightly closed. However, it is possible that “microbubbles” in the syringes combined with the effects of the pressure of the PTS caused these changes in the pO2 values. 19 In contrast, Poznanski et al. 13 found no difference in results on pH, pCO2 and pO2 measurements between the two modalities of transport. The transport speed of the cartridges containing the samples was constant and low (3.6 m/s) with controlled deceleration prior to arrival at destination and wide use of padding to minimize agitation during transport. 13 This speed was lower than the transport speed by line 3 of our study (4.4 m/s). Thus, the increase in pO2 by PTS in our study could be caused by the relatively high transport speed.
Conclusion
The evaluation of the pneumatic transport modality showed that our PTS is validated for biochemical results. It reduces turnaround times without affecting the quality of the sample.
In addition, the interpretation of arterial blood gas results should be careful for pneumatically transported samples. This modality of transport could induce significant biases for pO2 exceeding the limits of acceptability. This increase could be explained by the subsequent ambient air contamination to errors of the preanalytical phase. The preanalytical phase is the most vulnerable part of the entire analytical process and is considered one of the biggest challenges for the laboratory.
Footnotes
Acknowledgements
We would like to thank Mme Islem Baddel and Mme Nessrine Ben Salem for providing help in collecting samples and in laboratory assays.
Data Availability Statement
The data supporting the findings of this study are available upon reasonable request. As the data are generated and owned by the authors, there is no specific external publication or reference associated with the dataset.
Declaration of conflicting interests
The author(s) declared no potential conflicts of interest with respect to the research, authorship, and/or publication of this article.
Funding
The author(s) received no financial support for the research, authorship, and/or publication of this article.
Ethical approval
Rihab Makhlouf declares as first author.
Guarantor
RM.
Contributorship
Dr. RM was responsible for study design and conception, data analysis, interpretation, analysis and redaction of the manuscript. Dr SF and Mme ZL participated in study design and conception and redaction of the manuscript. Dr. FAM, Dr DJ, Mr LF, Dr KC and Dr. AE helped draft the manuscript. All authors read and approved the final manuscript.
Consent to participate
Participants provided oral consent.
Consent for publication
All relevant bodies and authors gave consent for publication.
Total acceptable limit variation (TALV)
CVa: analytical coefficient of variation; CVb: Biological coefficient of variation; TALV: Total acceptable limit variation; NA: non-applicable.
Parameter
Mean CVa
Analytical variability limit
CV within subject
8
TALV
Glucose
2.40
6.65
5.60
7.21
ASAT
5.67
15.70
12.30
16.86
ALAT
5.67
15.70
19.40
18.45
LDH
5.67
15.70
8.60
16.27
Sodium
1.10
3.05
0.60
3.06
Potassium
1.73
4.80
4.60
5.32
Chlorine
1.60
4.43
1.20
4.47
pH
2.00
5.54
3.50
5.81
pO2
2.00
5.54
NA
NA
pCO2
5.33
14.77
4.80
14.97