
Abstract
Background
The most common way to validate a pneumatic tube system is to compare pneumatic tube system-transported blood samples to blood samples carried by hand. The importance of measuring the forces inside the pneumatic tube system has also been emphasized. The aim of this study was to define a validation protocol using a mini data logger (VitalVial, Motryx Inc., Canada) to reduce the need for donor samples in pneumatic tube system validation.
Methods
As an indicator of the total vibration, the blood samples are exposed to under pneumatic tube system transportation; the area under the curve was determined by a VitalVial for all hospital Tempus600 lines using a five-day validation protocol. Only the three lines with the highest area under the curves were clinically validated by analysing potassium, lactate dehydrogenase and aspartate aminotransferase. A month after pneumatic tube system commissioning, a follow-up on laboratory data was performed.
Results
Mean area under the curve of the six lines ranged between 347 and 581. The variability of the area under the curve was between 1.51 and 11.55%. In the laboratory data follow-up, an increase in lactate dehydrogenase haemolysis was seen from the three lines with the highest area under the curve and the emergency department, which was not detected in the clinical validation. When the Tempus600 system was in commission, a higher mean area under the curve was measured.
Conclusion
A three-day validation protocol using VitalVials is enough to determine the stability of a Tempus600 system and can greatly reduce the need for donor samples. When in commission, the stability of the pneumatic tube system should be verified and lactate dehydrogenase haemolysis should be routinely checked.
Introduction
Alongside with greater automation of the laboratory and an ongoing focus on reducing turnaround time (TAT), pneumatic tube systems (PTSs) have gained footing and are now basic inventory in most larger hospitals due to their fast and efficient transportation of blood samples to the laboratory.1–3
Total quality management (TQM) in laboratory medicine is well established, with its primary focus on the analytical phase; however, most errors occur in the preanalytical phase, such as in vitro haemolysis due to inappropriate sample transportation. 4 In the last decade, centralization of laboratory testing facilities has led to the expansion of PTSs in hospitals. Due to the physical impact and vibration stresses on the vials in the PTS, the link between blood sample transportation and haemolysis has shown to be a greater problem after PTS transport than when the blood samples are hand carried. This increases the risk of more samples being rejected due to haemolysis, with consequences of unnecessary specimen collection and increased TAT as well as the risk of falsely high concentrations of parameters sensitive to haemolysis such as potassium.5–9
The architecture of each PTS is unique when it comes to manufacturer, materials, length, number of vertical drops, twist and turns and turning radius as well as sending speed, which makes the effects of transportation on sample integrity difficult to predict prior to commissioning.10,11 Hence, the potential risk of blood sample quality being compromised when transported by PTS and the necessity to validate each PTS before transportation of blood samples have repeatedly been emphasized.8,11 Still, it remains up to each laboratory to define its own validation procedure and protocol, since no gold standard has yet been defined. Most studies describing PTS validation compare results between blood samples carried by hand vs. transported by PTS.1,9,12,13 As a result, the use of mini data loggers that mimic blood sample movement in the PTS has gained popularity since they provide repeatable measurements while reducing the time and effort required for PTS validation.5,6,14–16
Our hospital began the construction of a new laboratory in 2017, as part of a larger construction project. The new laboratory is located in the corner of our hospital, making the distance from the laboratory to the primary clinical departments 400–700 m long, and requiring the extension in the length of six previously installed PTS lines by 300 m. In addition to the new laboratory with the six extended PTS lines needing to be validated, the hospital will undergo a great expansion in the next few years, resulting in the installation of more than 40 new PTS lines. Validating 40 new individual PTS transport lines by comparing hand-carried blood samples to blood samples transported by PTS would be extremely time consuming, expensive and laborious, as well as a major logistical challenge.
The aim of this study was therefore to establish a protocol for PTS validation using mini data loggers and QC software, in order to reduce the need for donor blood samples and to validate an entire hospital PTS.
Materials and methods
Blood sampling
Blood samples were drawn from 10 healthy volunteers (four tubes per person), in 4 mL lithium heparin tubes from Greiner (Greiner bio-One, Austria). Blood samples were drawn from the antecubital vein by the same experienced phlebotomist. All blood tubes were fully filled as indicated by the black line on the tubes defined by the manufacturer. Three blood samples per healthy volunteer were transported by PTS – one blood sample in each of the three selected lines with the highest AUC – and the fourth blood samples were hand carried to the laboratory for analysis.
Biochemical parameters
Blood samples were centrifuged at 3100 g for 5 min prior to being analysed. Potassium (ISE indirect Na-K-Cl Gen.2, 2016–11, V.10.0, Roche Diagnostics), aspartate aminotransferase (AST; ALTPM 2018–09, V.09, Roche Diagnostics) and lactate dehydrogenase (LDH; LDI2 vers. 2, 2015–05, V. 6.0, Roche Diagnostics) concentrations were analysed on a Cobas 8000 (Roche Diagnostics). The assays were quality assured with internal and external certified quality control material.
Haemolysis index (HI) was calculated from absorbance readings at 570 nm and 600 nm on a Cobas 8000 (Serum Index Gen.2, Roche Diagnostics) and interference levels were defined as plasma haemoglobin concentration greater than 90 mg/dL for potassium, 20 mg/dL for AST and 15 mg/dL for LDH (Roche Diagnostics).
Retrospective data
Data on the number of rejected blood samples for potassium and LDH due to haemolysis were retrospectively pulled from the hospital LIS (laboratory it-system, Labka II, Denmark). Attention was paid to these two biochemical parameters as they are sensitive to haemolysis, potentially leading to increased numbers of rejected samples due to haemolysis when transported by PTS. Data was extracted from the six hospital departments from where the PTS lines start (lines A–F, Table 1). Data was extracted from one month prior (30 full days) before commissioning of the extended PTS lines (number of data: potassium = 3408, LDH = 1670) and compared with data extracted from the first month of PTS commissioning of the extended PTS lines (number of data: potassium = 3337, LDH = 1698). Data on AST in the retrospective evaluation was left out because the clinical departments with direct PTS lines to the laboratory do not use this biochemical parameter very often.
Characteristics of the six extended PTS lines, including the location of the department (floor), the length of the line, mean transit speed and mean within- and between-day variability (CVw and CVb, %) for cumulative acceleration measurements. Line A, D and E are shaded, as they are the lines with the highest baseline AUC and were selected for clinical validation.
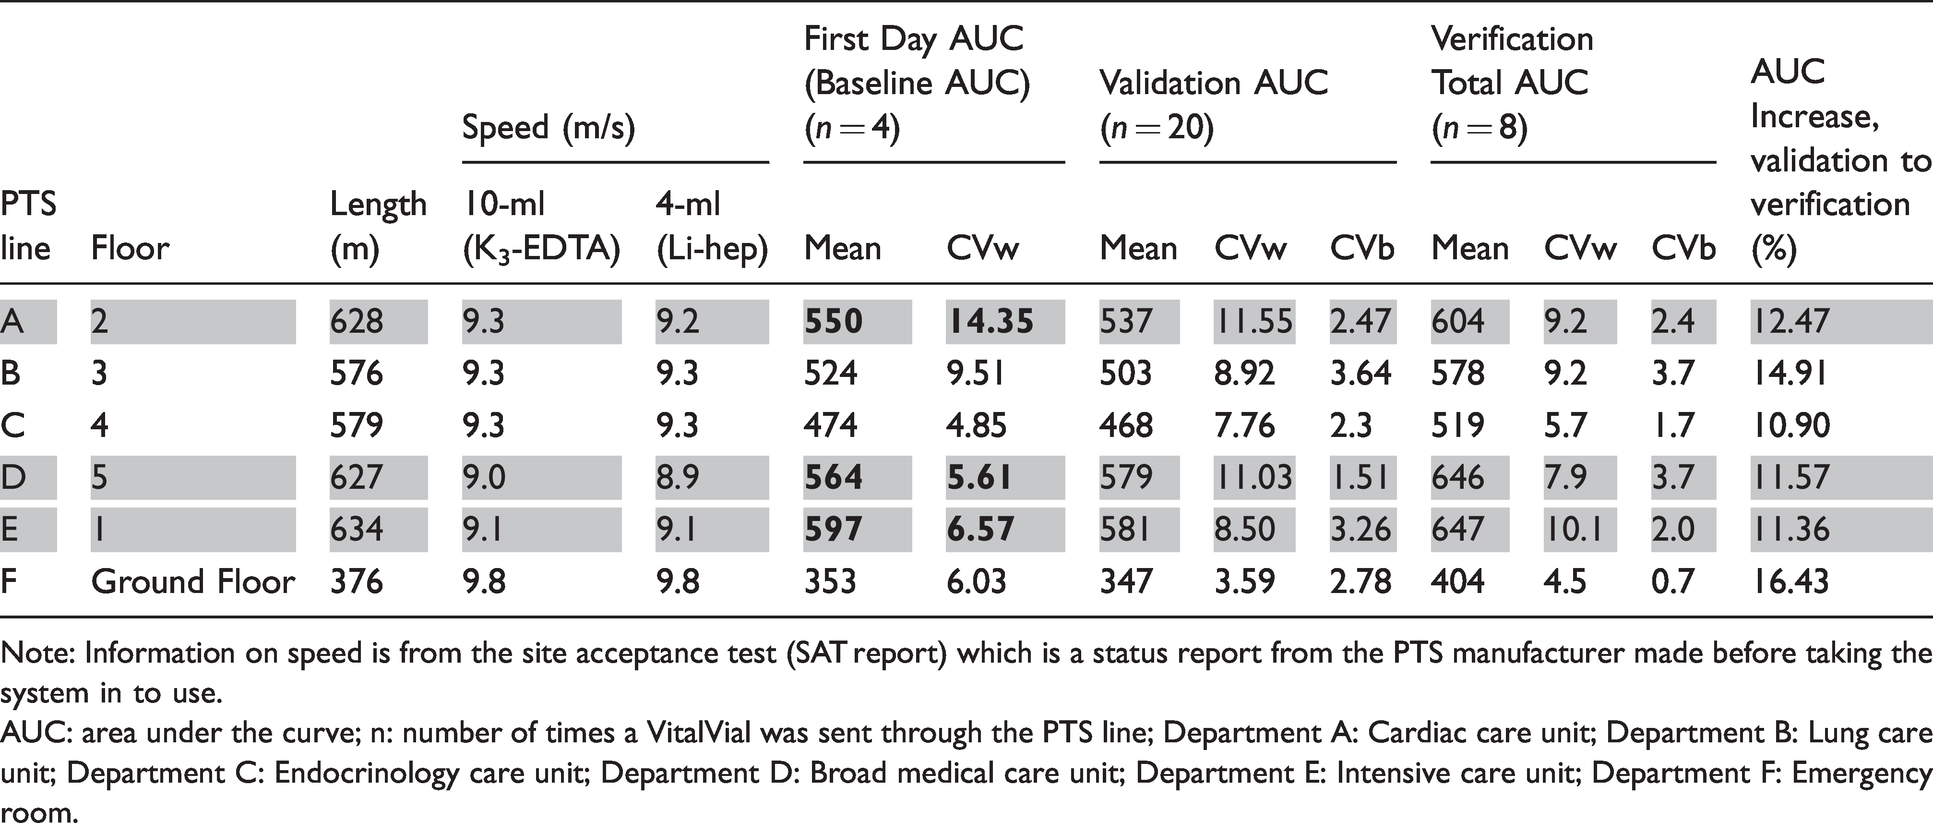
Note: Information on speed is from the site acceptance test (SAT report) which is a status report from the PTS manufacturer made before taking the system in to use.
AUC: area under the curve; n: number of times a VitalVial was sent through the PTS line; Department A: Cardiac care unit; Department B: Lung care unit; Department C: Endocrinology care unit; Department D: Broad medical care unit; Department E: Intensive care unit; Department F: Emergency room.
Mean and standard deviation AUC prior to line extension were examined from previous use of the VitalVials, representing overall acceleration for the lines from April to December 2019.
The pneumatic tube system
The PTS is a Tempus600 transport pipeline (Sarstedt A/S, Bording, Denmark). This system is computer controlled and transports blood tubes unidirectionally in flexible pressurized pipelines from a transfer station in a medical unit to the laboratory for analysis. One sample is loaded at a time and transported in pipelines 2.5 cm width. When a blood sample arrives to the laboratory, it drops into a bulk loader directly connected to a band solution transporting the samples to the analysers. Individual characteristics of the six extended lines are outlined in Table 1.
Data logger and data analysis of acceleration data
A mini data logger (VitalVial™, Motryx Inc., Halifax, Canada) embedded in gel in a 10 mL evacuated container (K3-EDTA) from BD (Becton Dickinson, USA) was used to log 3-axis acceleration data up to ±24 g. The VitalVials are weight-matched to within 10% of a comparable 10 mL blood sample, weighing ∼20 g.
VitalVials were sent through each PTS line as if they were blood samples and connected to the VitalApp software (Motryx Inc., Halifax, Canada) for automated data processing and analysis.
The VitalApp processes the acceleration data from the VialVial by calculating the AUC – a cumulative measure of acceleration forces that specimens experience in a single transit as developed in Streichert et al. 5 The VitalApp calculates the average AUC for all transits across each Tempus line and the within- and between-day variability (CV%) for the AUC for each line during the validation period. The VitalApp calculates the AUC variability as the standard deviation divided by the mean, which is then expressed as a percentage (CV% = (SD/x̄)×100).
Validation protocol
For the validation period, a 4 × 5 experimental protocol was used to establish within-day and between-day variability within each line. On the first day of validation, an initial baseline AUC for each of the six extended PTS lines was determined. This was done by sending the VitalVial through each PTS line four times. This procedure was repeated the following four days resulting in a total of 20 acceleration profiles per PTS line for within- and between-day variability analysis.
The three PTS lines with the highest baseline AUC (day one) were picked for additional clinical testing, as they represent the lines that likely exhibit the highest cumulative stresses on blood samples (Table 1). Clinical validation for those three lines was conducted the following day (day two) and consisted of blood samples, being transported by the three selected PTS lines and compared with a hand-carried blood sample. All blood samples were analysed on the same Cobas 8000 (Roche Diagnostics). The percentage change of the analytes between the three lines and hand was accepted if not exceeding 0.75 × CVwithin % (Minimum performance) as described by Fraser. 17 The CVwithin % from Westgaard was used for these calculations. When transported by PTS, potassium could therefore not change more than 3.45%, LDH not more than 6.45% and AST not more than 9.23% from hand carried in order for the PTS line to be accepted for blood sample transportation. The validation protocol workflow is illustrated in Figure 1.
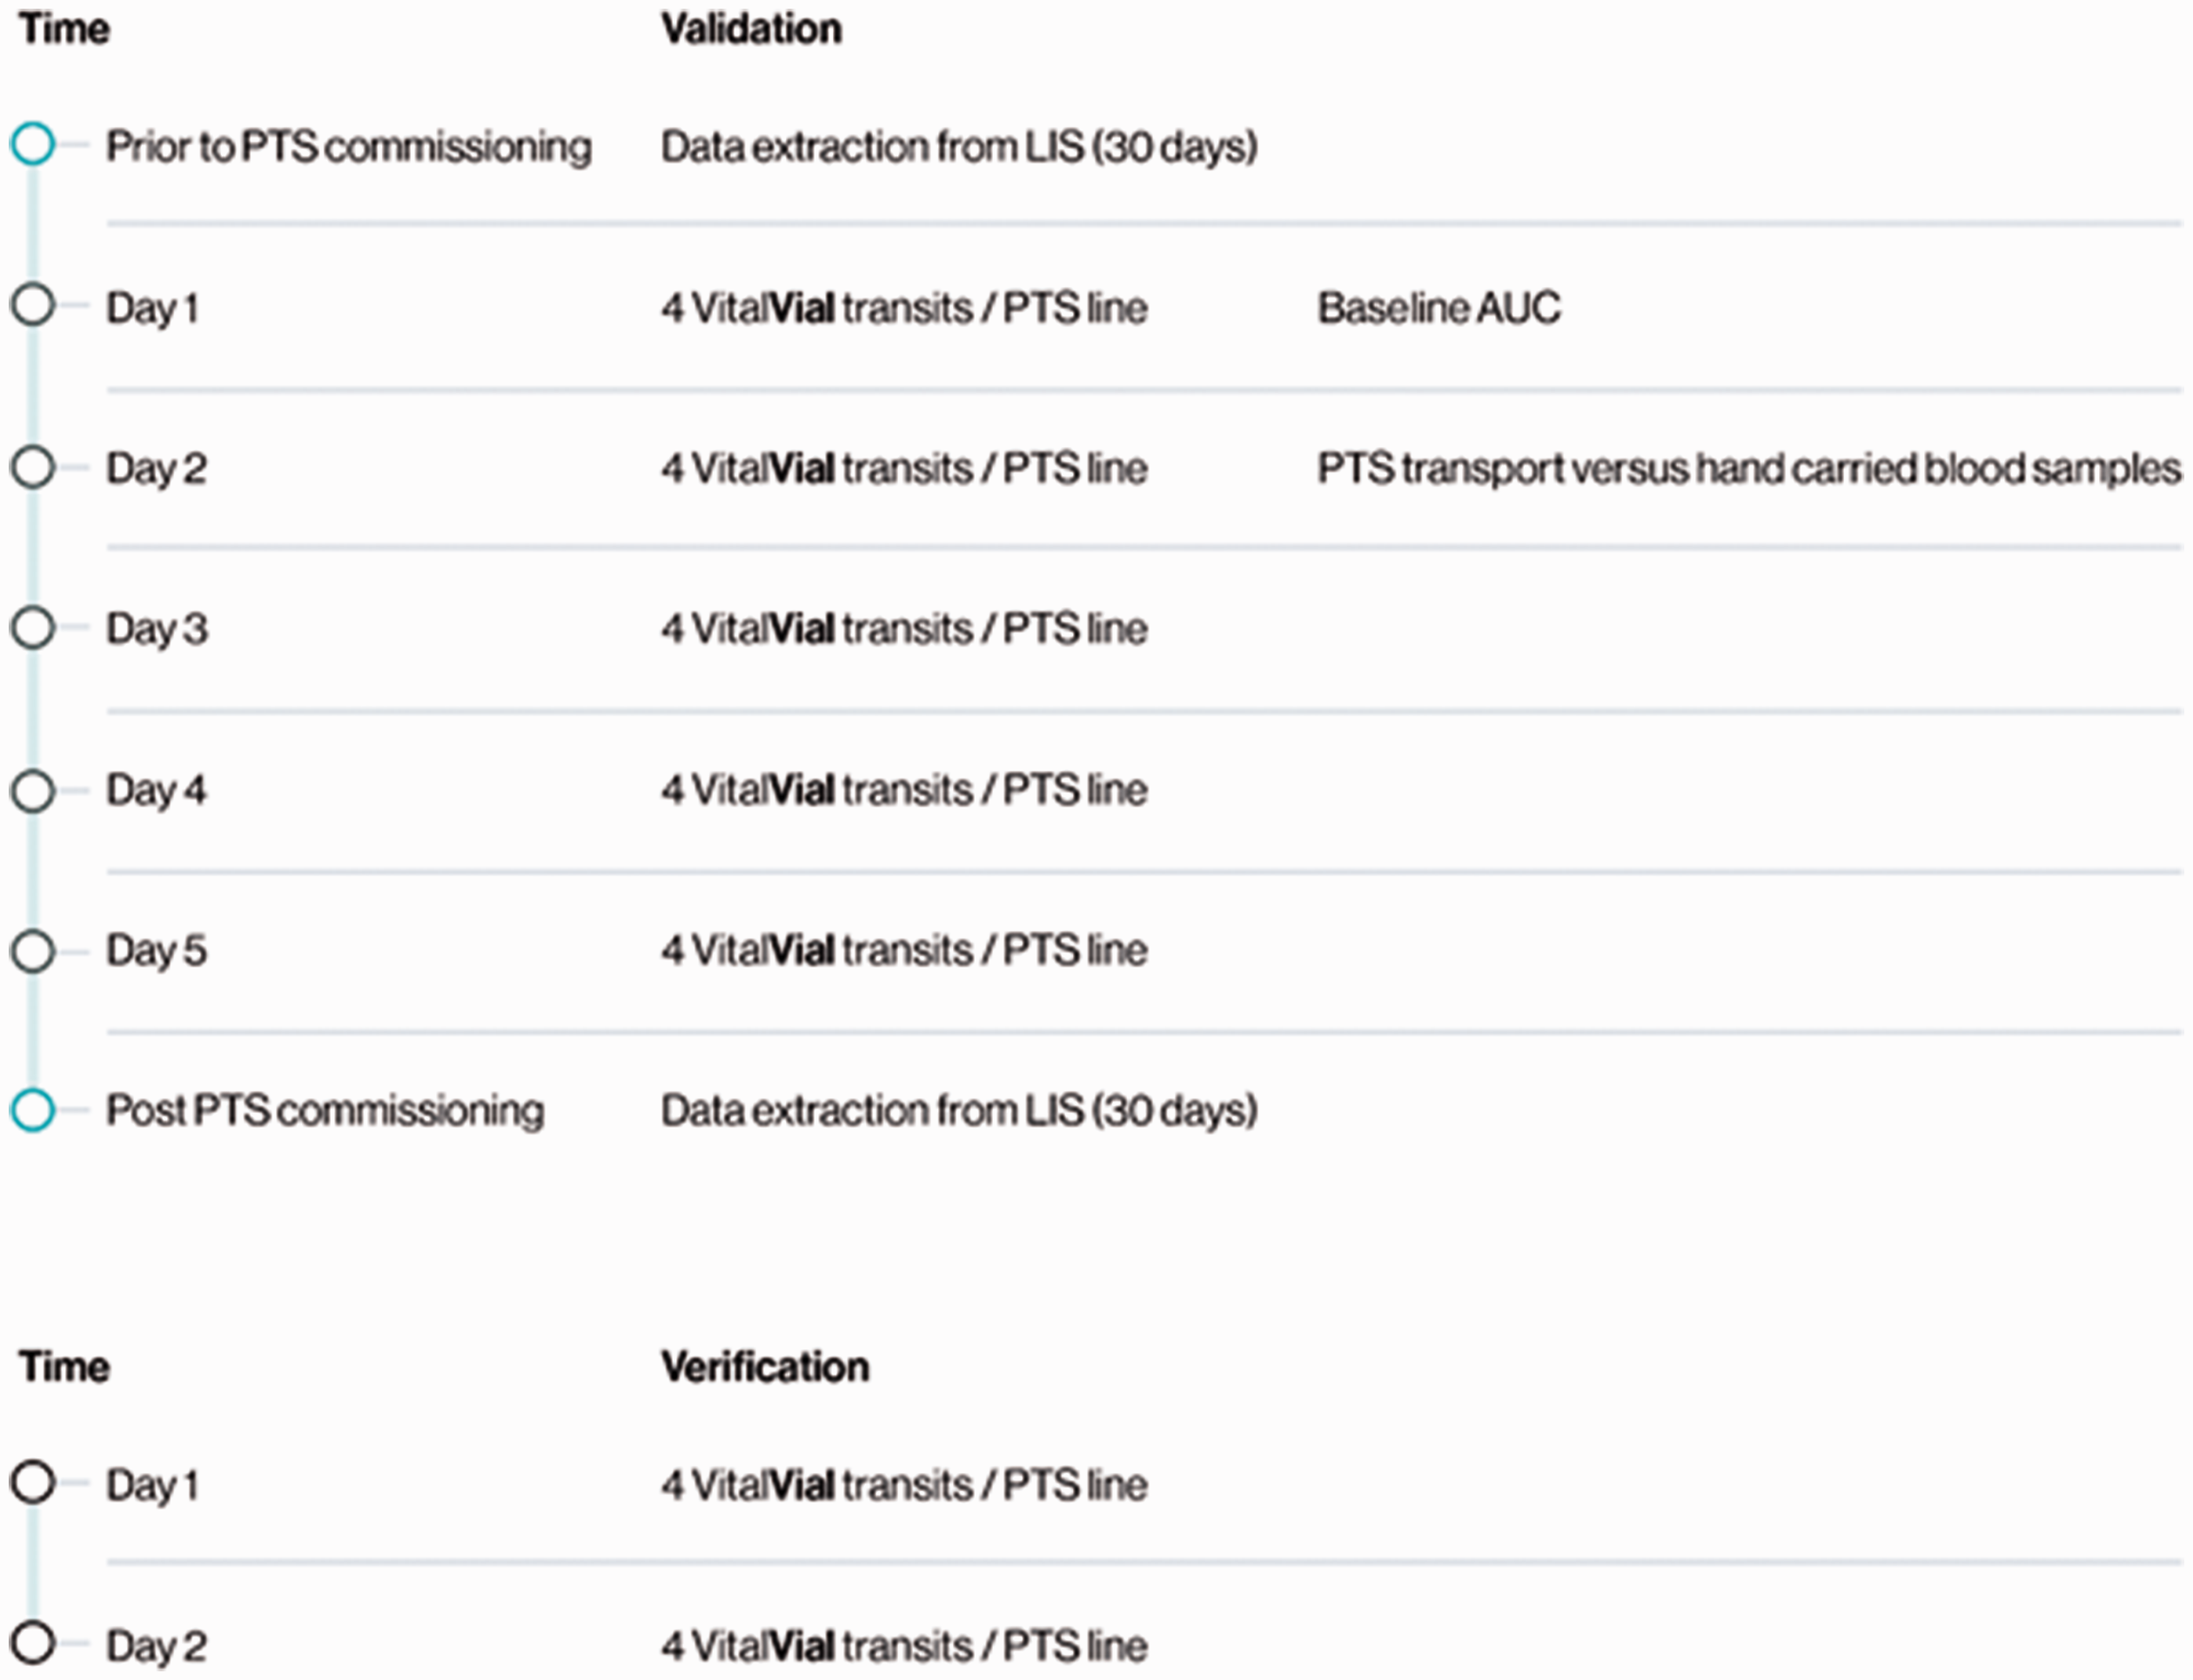
An illustration of the validation and verification protocol. Validation with the VitalVials was carried out over a five-day period with four VitalVial transits per day per PTS line. In total, 20 VitalVial transits were performed on each of the six PTS lines. Baseline AUC for each line was established upon the first four VitalVial transits. The three PTS lines with the highest AUC were selected for additional clinical testing. Verification after commissioning was carried out over a two-day period.
Verification protocol
Because the validation of the PTS was carried out in an empty system, a verification of the AUC for the six lines was performed approximately one month after commissioning of a full operational PTS. The verification consisted of 4 × 2 experimental protocol where four VitalVials were sent each day for two days resulting in eight acceleration profiles per PTS line (Figure 1). Again, the within- and between-day variability were examined to ensure that the variability remained stable in the operating system.
Statistics
Statistics on biochemical parameters were performed using Microsoft Excel (Office 365, 2016). Analysis of differences in mean were done by an unpaired t-test. Prior to that, an F-test was performed to determine data homogeneity (data were normally distributed). One-way analysis of variance (ANOVA) was performed in order to test for differences between groups. To test for a significantly difference in numbers of haemolysed samples, a Chi2-test (χ2) was performed. A P value <0.05 was considered significant.
Ethical considerations
This study complied with all national regulations and institutional policies. Informed consent was obtained from the healthy volunteers included in this study and all blood samples were fully anonymized.
Results
Evaluation of the pneumatic tube system: AUC and acceleration profiles
The VitalApp automatically processed the data after upload and reported the baseline AUC of each PTS line as the average of four VitalVial transits on the first day of validation (Table 1), which was between 353 and 597. Line E had the highest AUC on the first day, followed by line D and line A; this pattern remained consistent throughout the rest of the validation and verification period (Table 1). Except for line D, the mean and total AUC at the last day of validation was on average 2.5% lower than on the first day of validation. Verification of the PTS when operating and in commission showed an increase in AUC between 10.9 and 16.4% (mean 12.9%) for all six lines (Table 1). Line F had the greatest change from validation to verification, with an increase in AUC of 16.4%.
Throughout the validation and verification periods, the within-day variability greatly exceeded the between-day variability of the AUC. During the validation period, the within-day variability of the AUC for the six lines ranged between 3.59% and 11.55%, whereas the between-day variability ranged between 1.51% and 3.64%, (Table 1, Figure 2). Likewise, during the verification period, the within-day variability ranged between 4.5% and 10.1% and the between-day variability ranged between 0.7% and 3.7% (Table 1).
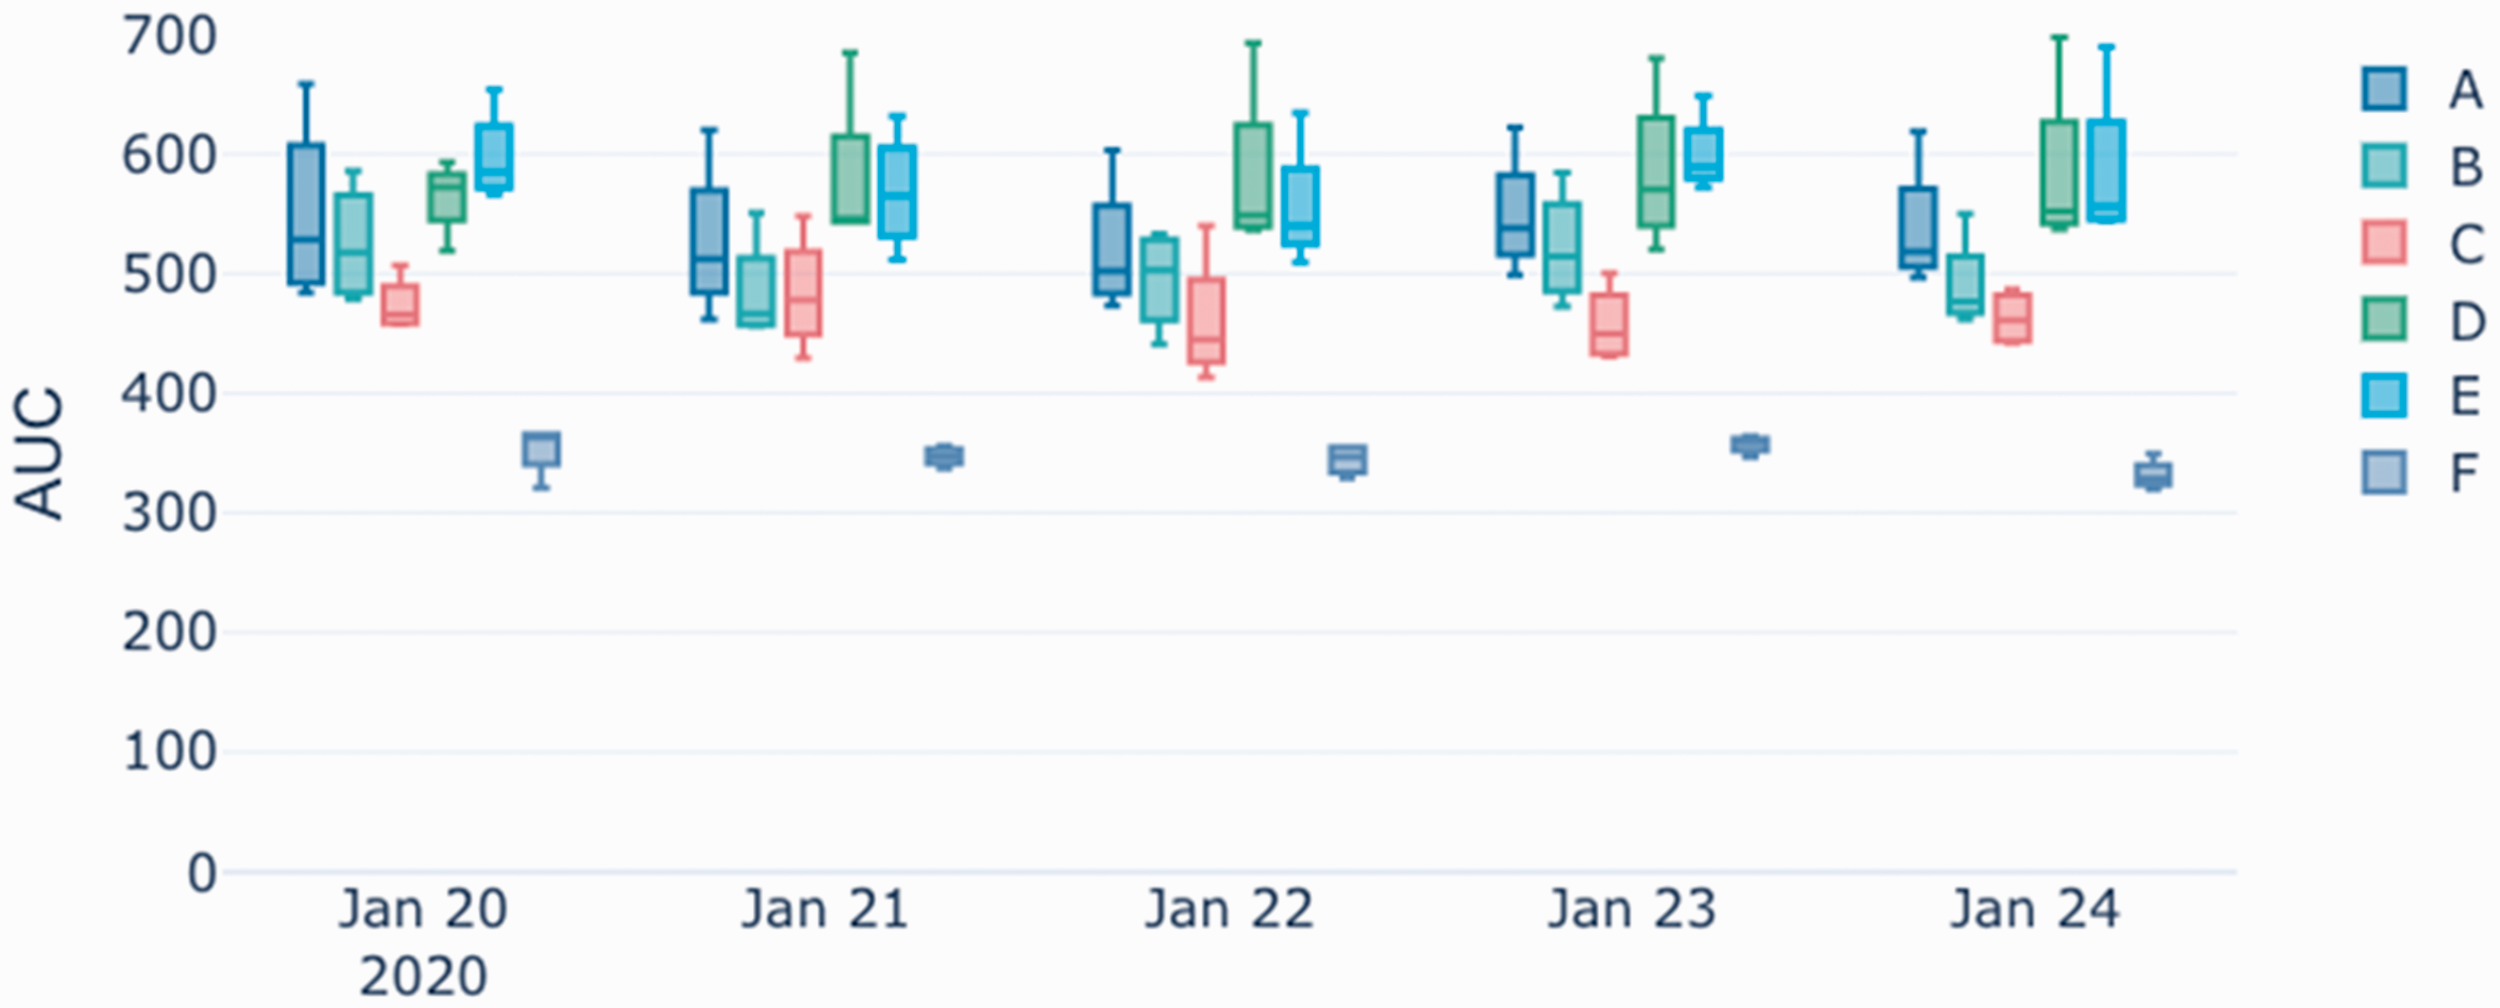
Cumulative acceleration (AUC) per day for different pneumatic tube lines (A through F) as measured during the validation period, 20–24 January 2020. (Black and white provided for print version).
For all PTS lines and in all VitalVial transits through the validation and verification period, maximum g-forces reached >30 g, often at landing or arrival to the laboratory, compared with hand carried which reached maximum g-forces of 14 g (Figure 3).
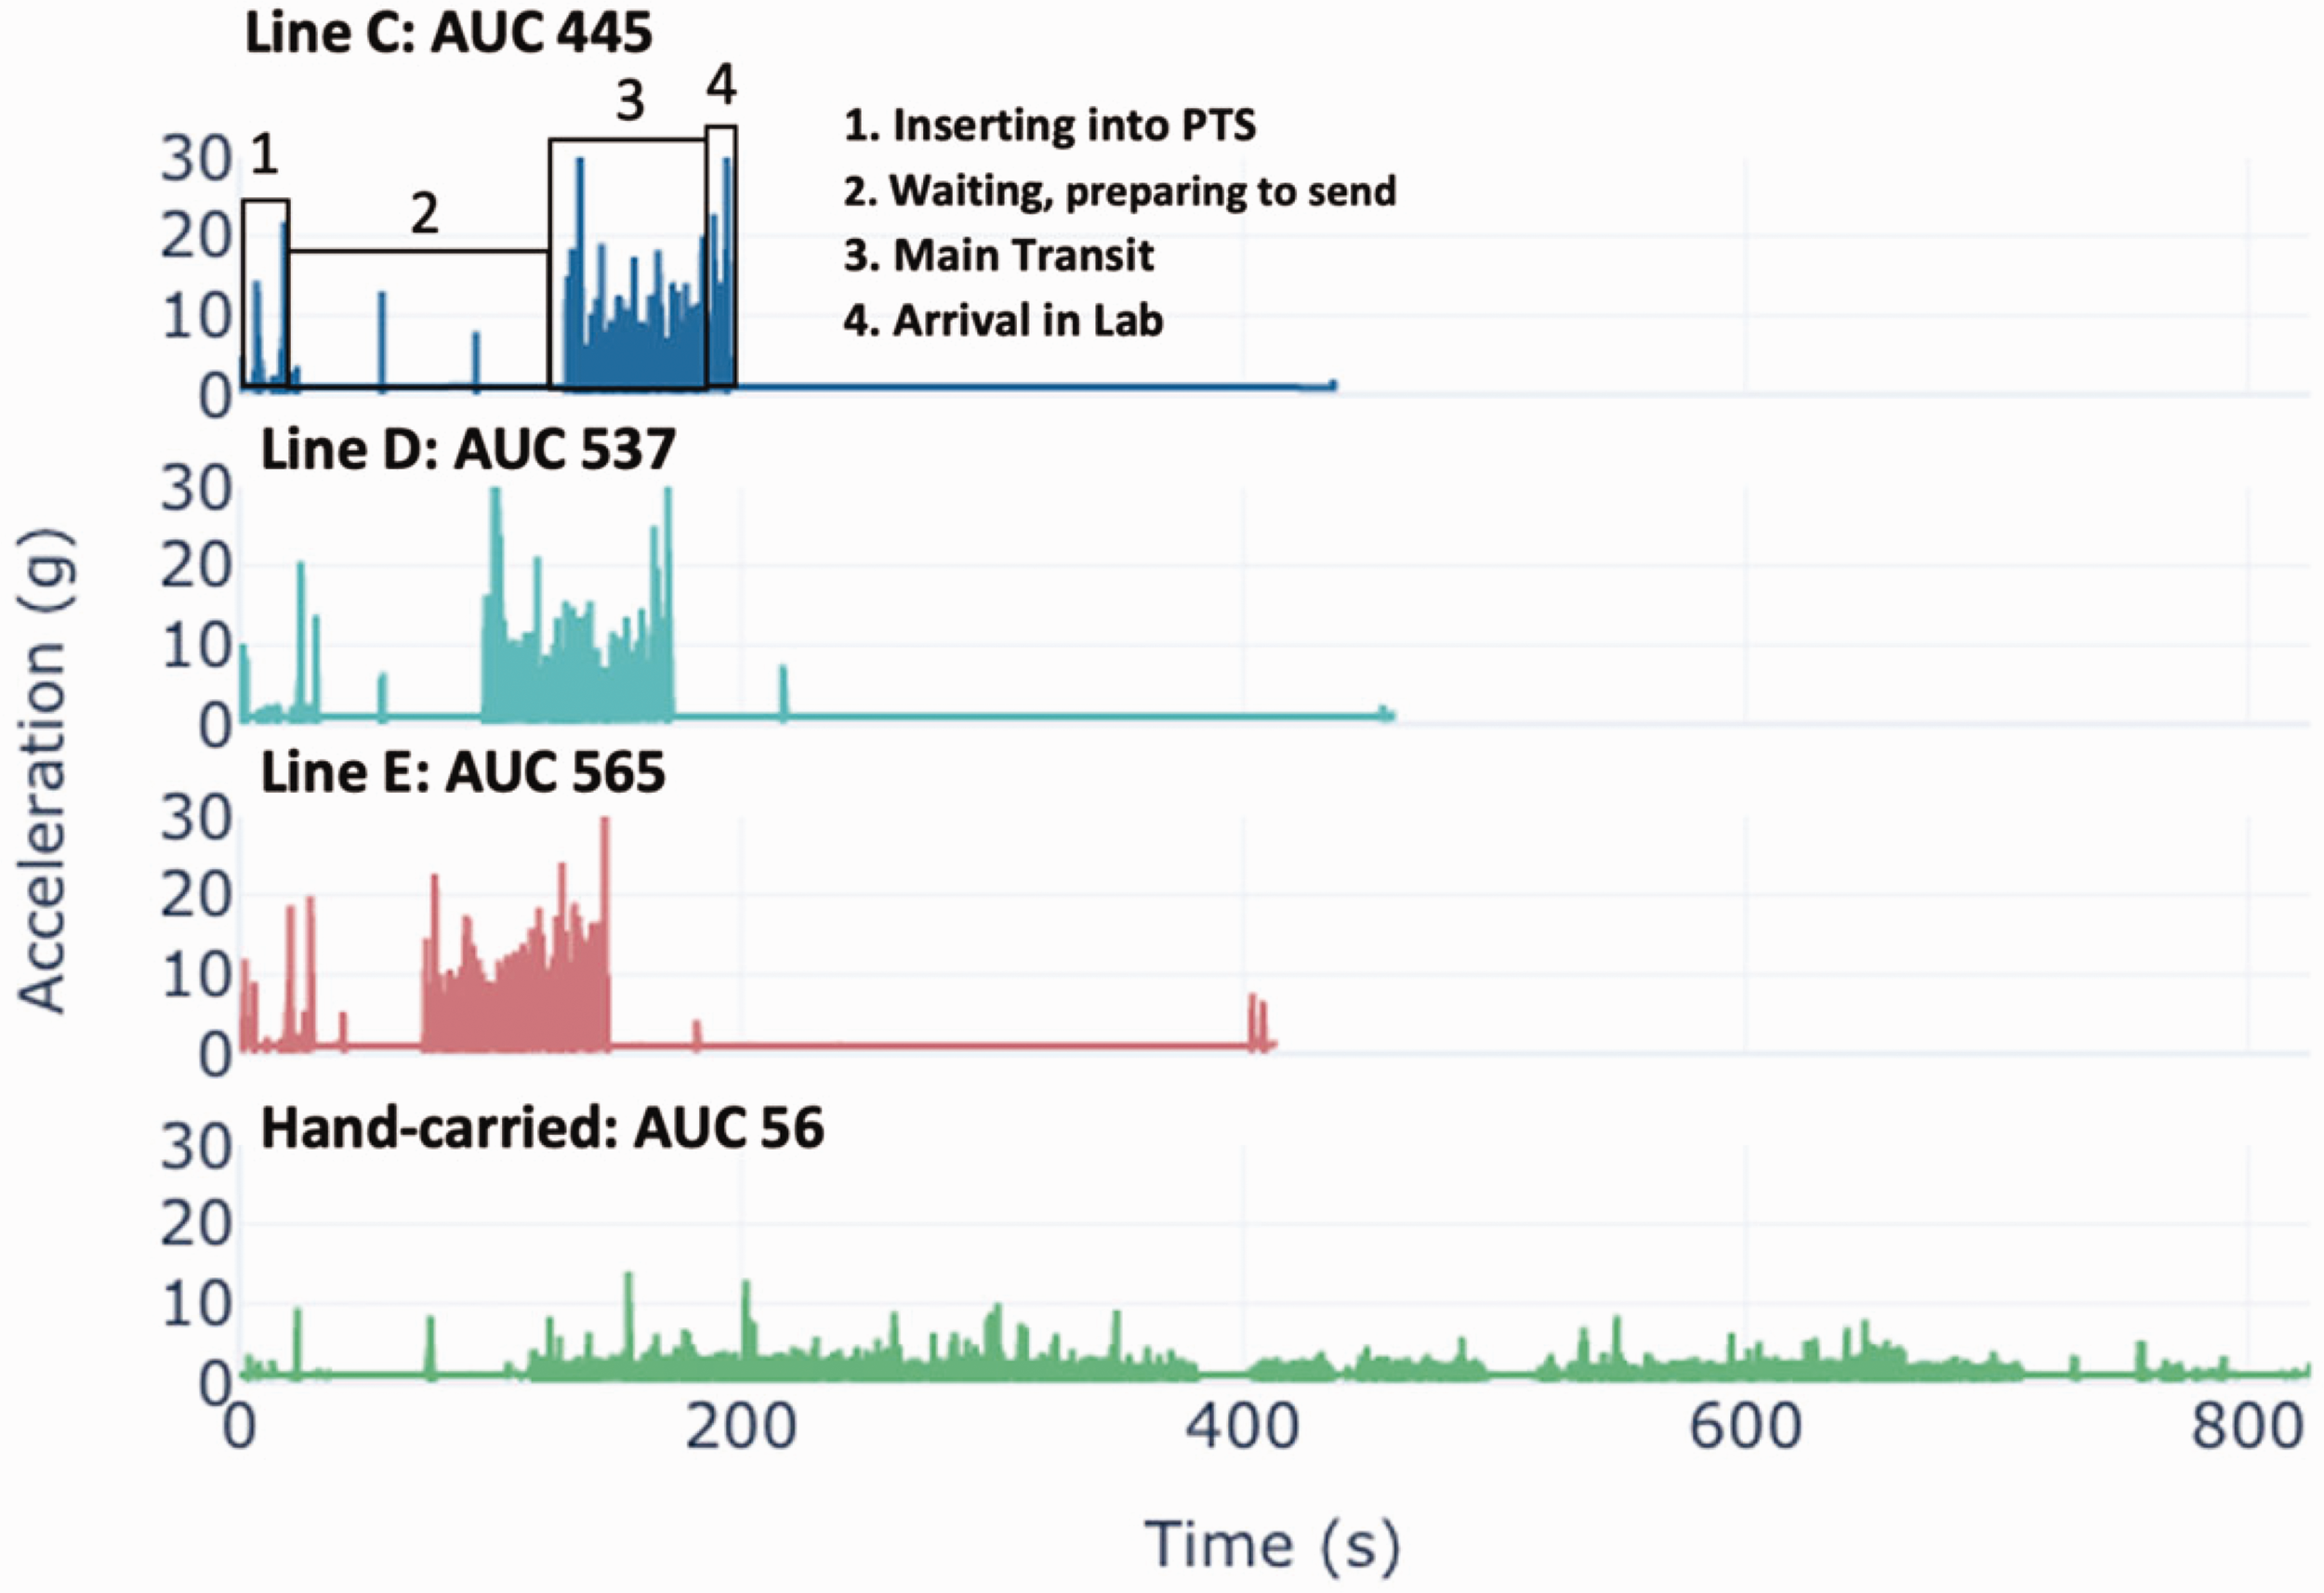
Example of acceleration timeseries for three of the extended PTS lines, with the AUC for each transit noted. The first transit is annotated with the main portions of the trip. An acceleration timeseries mimicking the accelerations blood samples are induced to if transported by hand to the laboratory is presented for comparison.
PTS-transported blood samples vs. hand-carried blood samples
Lines A, D and E had the highest AUC on day 1 (Table 1) and were therefore selected for comparing clinical parameters of blood samples transported via PTS and by hand.
One hand-carried sample was haemolysed when analysed for LDH. As LDH is really sensitive to haemolysis (H-index = 15 mg/dL), this rejection indicates that haemolysis most likely was already taking place during the venesection. The same hand-carried sample was not rejected when analysed for AST (H-index = 20 mg/dL) or potassium (H-index = 90 mg/dL). Since the rejection due to haemolysis could not be explained by the PTS transportation, this sample was excluded from the calculations leaving nine samples for evaluation.
When analysed for LDH, one out of nine samples were rejected due to haemolysis from lines A and E (11.1%), whereas none from line D were rejected (0%). The number of rejected AST blood samples were identical to that of LDH, whereas no potassium blood samples were answered with ‘haemolysis’ from any of the three lines.
A significant difference in H-index was observed between the four groups (P = 0.02). Differences were both present between hand-carried blood samples and blood samples transported with line A (P = 0.04), line D (P < 0.01) and line E (P < 0.01). No difference in H-index was observed between the three PTS lines.
The mean concentrations of LDH, AST and potassium were not significantly different between the three lines or when compared with the hand-carried blood samples (Table 2). There was no percentage change in the concentration of potassium between line A, line D or line E compared with hand-carried samples. Both AST and LDH met the acceptance criteria for maximum percentage change compared with hand-carried samples and showed small numeric differences in the mean analyte concentrations (Table 2, Figure 4).
Analyte concentrations and cumulative acceleration for samples transport by hand and by the three selected PTS lines. Shaded variables are those with significant differences, P < 0.05.
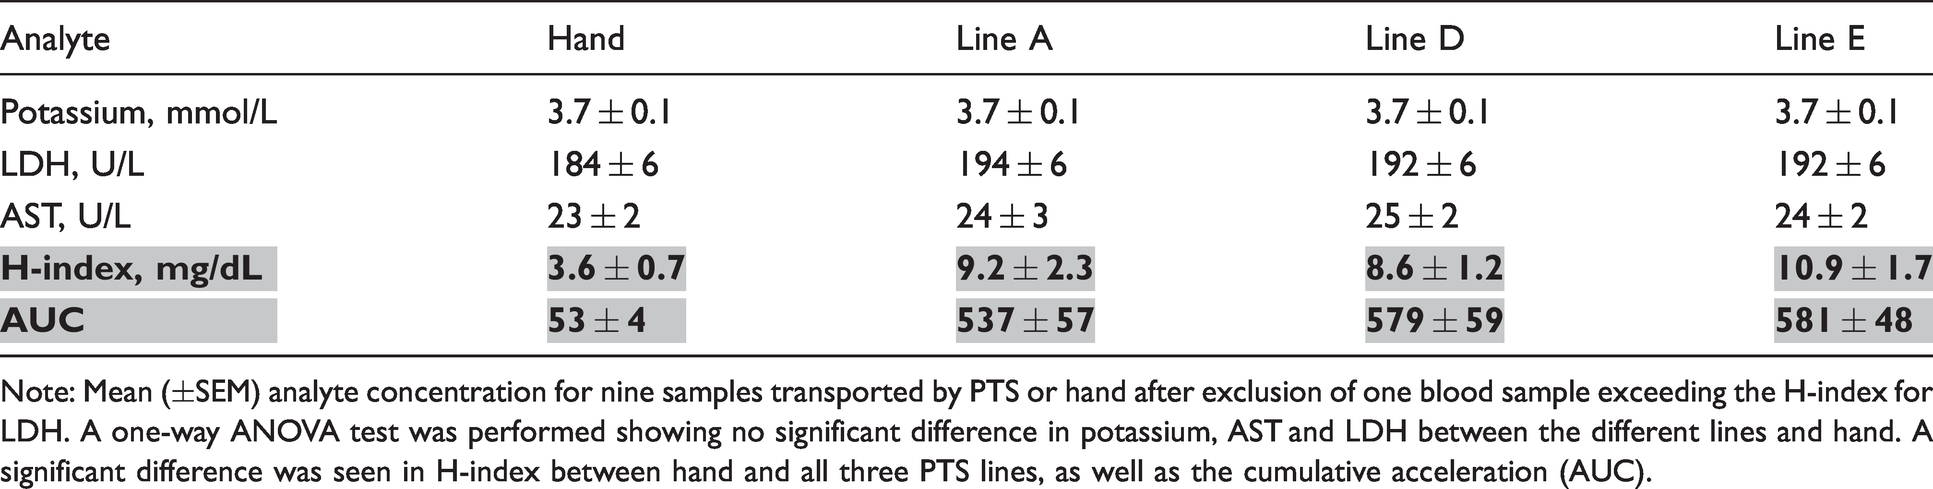
Note: Mean (±SEM) analyte concentration for nine samples transported by PTS or hand after exclusion of one blood sample exceeding the H-index for LDH. A one-way ANOVA test was performed showing no significant difference in potassium, AST and LDH between the different lines and hand. A significant difference was seen in H-index between hand and all three PTS lines, as well as the cumulative acceleration (AUC).
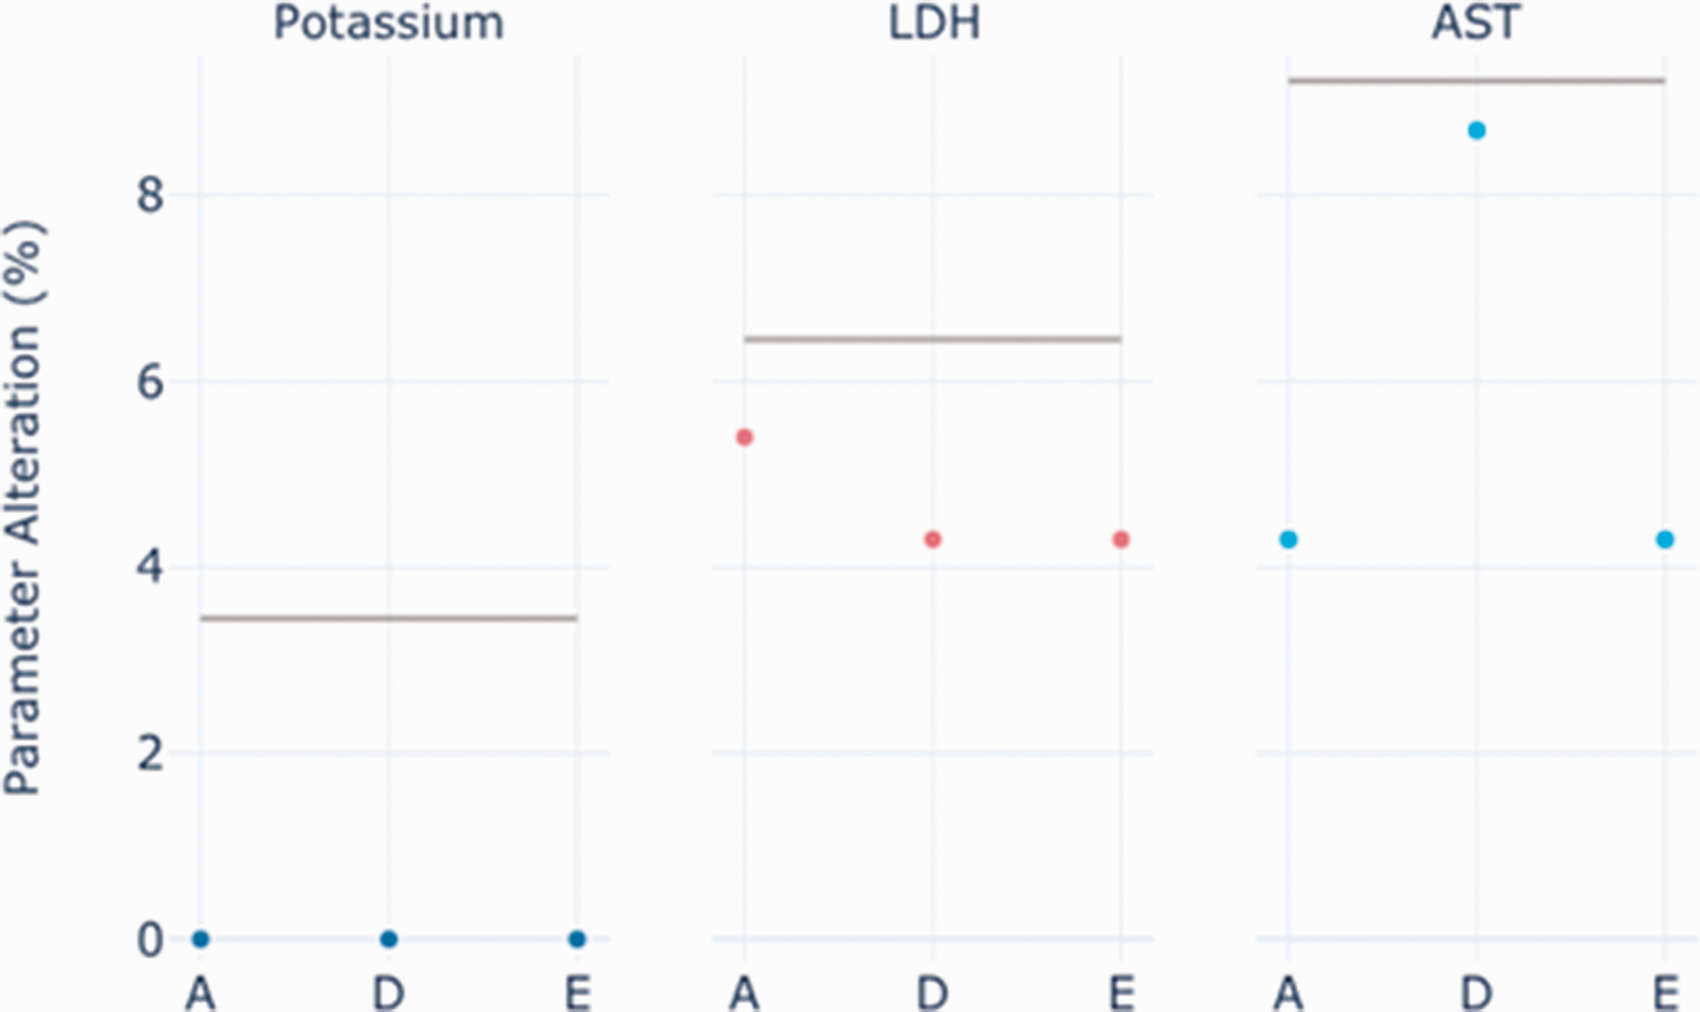
The percentage change in analyte concentrations (potassium, LDH and AST) between blood samples carried by hand and transported by PTS line A, D and E. The horizontal grey lines represent the maximum accepted % change of the analytes corresponding to the minimal performance (0.75×CVwith-in); potassium = 3.45%, LDH = 6.45% and AST = 9.23%.
Retrospective data: Changes in biochemical parameters and haemolysis rate
Data queried from LIS prior to and following line extension showed that mean potassium concentrations increased significantly from lines B and D (Table 3), while the change in mean potassium concentration decreased significantly from line C. It was not possible to obtain data on potassium from line E, the intensive care unit, because of point-of-care testing, meaning that no potassium samples are sent by PTS for analysis. Mean concentration of LDH before and after PTS commissioning increased significantly from lines E and F, while the concentration decreased significantly from line A. Interestingly, changes in LDH concentrations were not seen from the same lines as from where changes in potassium concentrations were seen.
Per cent change in mean value of total vibration (AUC) as well the concentration and the number of samples haemolysed for potassium and LDH before and after commissioning of the extended PTS lines. Bolded numbers show significant differences.
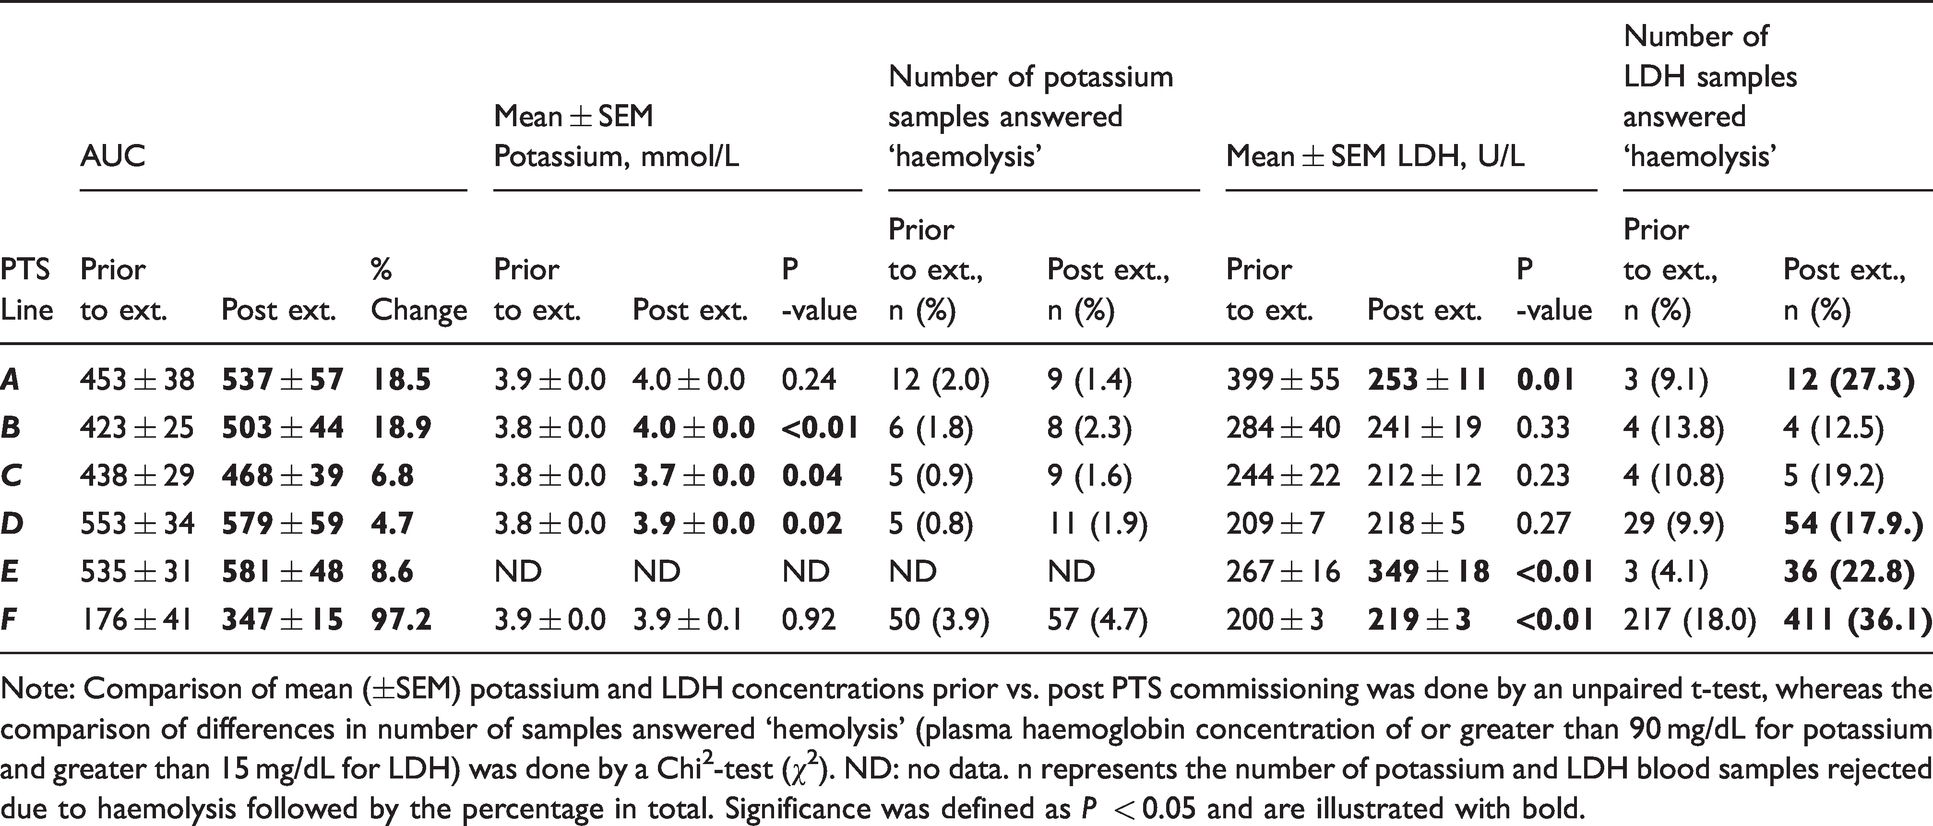
Note: Comparison of mean (±SEM) potassium and LDH concentrations prior vs. post PTS commissioning was done by an unpaired t-test, whereas the comparison of differences in number of samples answered ‘hemolysis’ (plasma haemoglobin concentration of or greater than 90 mg/dL for potassium and greater than 15 mg/dL for LDH) was done by a Chi2-test (χ2). ND: no data. n represents the number of potassium and LDH blood samples rejected due to haemolysis followed by the percentage in total. Significance was defined as P < 0.05 and are illustrated with bold.
There was no change in the number of rejected potassium samples after the line extension. However, the number of LDH blood samples rejected due to haemolysis did increase tremendously from lines A, D, E and F after the line extension, with an average increase of 15.7% (Table 3).
Discussion
In this study, the accelerometer-derived AUC metric was used to validate a PTS system, as it has been shown to represent the cumulative vibration blood samples experience in PTS transport, and be a close indicator of specimen integrity.5,15 By calculating the AUC for each transit in each PTS line, we were able to identify the lines at high risk of causing damage to the blood samples, and in that way chose which lines to clinically validate by comparing blood samples transported by PTS with hand-carried blood samples. Besides the H-index for the hand-carried blood samples being significantly lower than PTS-transported blood samples, no statistically significant change in the concentrations of potassium, LDH or AST was observed. Because no significant and only small changes in analyte concentration were detected, which were within the acceptance criteria (0.75 × CVwithin) , 17 the PTS lines were approved for blood sample transportation. Because the PTS lines with the highest vibration did not show any concerning changes in analyte concentration, the remaining three PTS lines would not be expected to and were therefore also accepted for blood sample transportation.
Previous studies have shown a clear positive correlation between the AUC and changes in concentration of potassium, LDH and AST.5,15,16 In our study, the mean AUC ranged from 53 (hand) to 581 (line E). Within this AUC spectrum, the concentration of potassium was unaffected. Although not statistically significant, a percentage change in the concentration of LDH and AST was still seen between blood samples carried by hand and transported by the three PTS lines that were clinically validated, but with no clear correlation between AUC and changes in concentration of the haemolysis-sensitive parameters. The AUC of these three lines were very similar to each other with the difference in the mean AUC being only 44 between line E and line A, and it is possible that the difference in AUC was too small to show a clear correlation or cause considerable change in biochemical parameters.
Each PTS line is unique when it comes to length, speed, twist and turns, connections, etc. which are all characteristics that will influence the vibrations the blood samples are subject to under PTS transport.5,11,16 How much different line characteristics contribute to the cumulative vibrations (AUC) in the PTS is not well understood. Besides line F, where the AUC increased 97% post extension, the remaining five lines did only increase between 4.6 and 18.9% after the extension of 300 m (thus being doubled in length) which really emphasizes how unpredictable the vibrations in a PTS can be and why they must be directly measured. 5 Nevertheless, the functioning of the PTS was consistent, demonstrated by the low between-day variability of the AUC for all the extended lines.
In a recent study, Farnsworth et al. 15 concluded that the AUC within a single route can vary 4–39%, with the between-day variability being greater than the within-day variability. Because few studies exist 6,15,16 and all use devices of varying sensor details (smartphones, mini-data loggers) to investigate their PTS with few AUC measurements, we found it essential to validate and test the stability of the system over more than just a few days. Accordingly, we designed a five-day validation protocol. Surprisingly, we found the opposite tendency with the within-day variability for the AUC being greater than the between-day variability, however, both were steady. The between-day variability did not change between day 3 and day 5, indicating that a three-day validation protocol might be enough to determine the stability of a Tempus600 PTS. Exactly what the ideal variability of a PTS line should be before it is considered to be stable, cannot be answered from this study. More investigation is needed, and it should be taken into consideration that this likely varies between different system manufacturers.
The fact that the AUC increased between 12 and 16% in our study between the validation of a non-operating system and the verification of an operating system might indicate that not only the architecture of the individual PTS line contributes to the cumulative vibrations, but sample load might also play a role. This would also explain why the within-day variability was greater than the between-day variability in this study. Every sample transit through even the same PTS line experiences differences in factors such as timing, sample load as well as the arrival of other samples. This hypothesis deserves further investigation and demonstrates that verification or ongoing quality assessment of the PTS when in operation must be considered to ensure that the system still operates within the intended safe ranges that initially were approved for specimen transport.
The LDH haemolysis rate did significantly increase for four of the extended PTS lines and beyond what was predicted from the clinical validation. However, the extreme increase in LDH haemolysis rate was seen from those PTS lines with the highest AUC and from line F, the emergency department (ED). In general, the ED is known for having higher haemolysis rates than other clinical departments due to a greater occurrence of preanalytical errors associated with in vitro haemolysis. 18 In vivo haemolysis should also be considered as a contributing factor when addressing haemolysis rates. However, in this case, the general increase in the number of haemolysed LDH samples from those specific PTS lines seems too big and systematic not to be associated with the PTS. A potential cause to this unexpected increase in LDH haemolysis rate could be due to that on average 12.9% increase in AUC that was found between validation and verification. That extra increase in transport vibration might be the straw breaking the camel’s back, making the H-index >15 mg/dL, resulting in the extreme increase in LDH haemolysis.
The significant changes in LIS data means increasing for some of the lines, whereas decreasing from others were interpreted as a result of patient characteristics. In this protocol, addressing and focusing on changes in haemolysis rates, rather than changes in mean concentration from LIS data, is more useful.
An AUC around 500 as well as maximal g-forces exceeding 15 g has been mentioned to be associated with changes in biochemical parameters and haemolysis.5,14 In our study, we detected g-forces above 30 g for all VitalVial transits through all PTS lines (data not shown but an example can be seen in Figure 3). This discrepancy could be due to sensors in previous studies not being able to measure g-forces higher than 15 g (e.g. smartphone = 8–10 g). One could also emphasize that it is not the single maximum g-force that plays a significant role in haemolysis, since most laboratories centrifuge blood samples at much higher g-forces than those detected in a PTS. The direct relation between g-forces, AUC and changes in biochemical parameters and haemolysis still warrants future research.
We would still use this protocol in future PTS validation, in that it provides unique information regarding the stability of the system which is not gained by a one-time comparison between samples carried by hand and transported by PTS. Our clinical validation did not allow us to predict the increase in LDH haemolysis rate once the system was in commission, although the data loggers did provide an early-warning of increased AUC after commissioning. Furthermore, the data generated from the data loggers can be valuable when troubleshooting the PTS and trying to solve high haemolysis rates.
This study does have some limitations. Our clinical validation was carried out with blood samples from few (n = 9) and healthy donors. Blood samples from healthy donors may not reflect blood from true patient populations; samples from neonatal, oncology and haematology patients have been shown to be more prone to haemolysis. 19 While our hospital does not have these clinical departments, hospitals with such departments ought to consider this susceptibility when validating their PTS lines. The data logger is weight-matched and embedded in a 10 mL tube, whereas most blood samples are drawn in smaller tubes, weighing less. Due to these physical differences between the VitalVial and real blood samples, the AUC serves as a proxy for the actual forces a real blood sample is subjected to under PTS transport.
Conclusion
In this study, we have demonstrated how a vial-embedded data logger measuring 3-axis accelerations expressed as AUC can be used as a cornerstone to validate an entire hospital PTS without having to use blood samples to clinically validate every PTS line. This method reduced the need for donor samples, was less time consuming and was in alignment with the recommendation that the actual force inside every PTS line must be measured.5,11 Because the between-day variability did not change between day 3 and day 5, a three-day validation protocol could be used in the future when validating new hospital PTS lines. Based on the findings of this study, we furthermore conclude that the validation must be supported by a verification or an ongoing quality assessment to make sure that the PTS remains stable when operating, and the rejection rate due to haemolysis for sensitive parameters should be monitored through LIS data extraction.
Footnotes
Acknowledgements
The assistance of both Mette Kongstad and Christina Mercebach was greatly appreciated.
Declaration of conflicting interests
The author(s) declared the following potential conflicts of interest with respect to the research, authorship, and/or publication of this article: FB and JvdH are both employees of Motryx Inc.
Funding
The author(s) received no financial support for the research, authorship, and/or publication of this article.
Ethical approval
Not applicable.
Guarantor
IS.
Contributorship
IS and HPS designed the study. IS conducted the study. IS conducted the statistical analysis. FB and JvdH analysed the mini-logger data and made the figures. IS wrote the article in cooperation with HPS, FB and JvdH. IST, FB, JvdH and HPS reviewed and accepted the final version of the article.