
Abstract
Background
Neuroendocrine neoplasms (NENs) are a heterogeneous group of rare diseases with varied aggressiveness originating from endocrine cells belonging to the diffuse endocrine system and most often produce and secrete chromogranin A (CgA). CgA in plasma is therefore used to screen, diagnose, and monitor for NENs in both adults and children with sporadic or familial NENs.
Methods
Plasma CgA was measured using the Brahms Kryptor assay in 268 healthy children/adolescents; 85 children were tested as part of a familial cancer screening program and 183 additional children younger than 20 years of age underwent screening for allergies. Repeated measurements (month – years) was used to calculate the intra-individual variation. The dataset was analysed in R using the referenceInterval package.
Results
The plasma CgA concentration decreased with age and was 32–118 µg/L for children aged 0–3 years, 18–85 µg/L for children aged 4–13 years, and 6–79 µg/L for adolescents aged 14–19 years. Earlier reported CgA reference intervals for adults have upper limits from 88 to 102 µg/L while no lower limits have been reported. The median for the three groups were 78, 51, and 39 µg/L, respectively. The median intra-individual variation was 14% (25%-centile 9.4%/75%-centile 21%).
Conclusions
The reference interval will be useful when screening, diagnosing, and monitoring children for NENs respecting the limitations plasma CgA has.
Introduction
Neuroendocrine neoplasms (NENs) represent a heterogeneous group of rare diseases that worldwide have an increasing incidence rate from 1.5 cases/100,000 person in 1973 to 7.4 cases/100,000 in 2012. 1 NENs range from indolent to rapidly progressive and arise from cells belonging to the diffuse neuroendocrine system in primarily the stomach, intestine, rectum, pancreas, lung, adrenals, and thyroid among others.2,3 NENs are characterized by their ability to produce, store, and release bioactive transmitters and hormones into the bloodstream4–6 and were initially divided into characteristic syndromes based on the biological role of the hormone/bioactive transmitter secreted. However, many NENs do not secrete bioactive molecules and NENs are now classified into functional and nonfunctional NENs. 7
The management of these multifaceted diseases requires one or multiple marker(s) found in most endocrine cells irrespective of their organ of origin. Chromogranin A (CgA) is an acidic, hydrophilic protein present in chromaffin granules of many of the neuroendocrine cells8,9 and are involved in regulated secretory pathways of, for example, peptides, hormones, and neurotransmitters in endocrine cells 10 and neuroendocrine tumours. 6 Elevated plasma chromogranin A concentrations are seen in non-malignant conditions 11 such as chronic atrophic gastritis, 12 Helicobacter pylori infection, 13 liver cirrhosis and chronic hepatitis, 14 pancreatitis, 15 and inflammatory bowel diseases. 16 Drugs that inhibit gastric acid secretion are the main iatro-genic cause of increased plasma CgA concentration. 17 Elevated CgA plasma concentrations are seen in patients with neuroendocrine tumours (e.g. pheochromocytoma, parathyroid adenoma, thyroidal C cell disorder, carcinoid tumour, oat cell lung carcinoma, and pancreatic islet cell tumours 18 ) or in solid tumours in which there are areas with neuroendocrine differentiation; this is seen in, for example, colorectal adenocarcinoma, 19 gastric and pancreatic cancer, 15 and prostate adenocarcinoma. 20
Even though the plasma CgA concentration can reflect non-malignant conditions as described above, the measurement of CgA in plasma has proven a prudent tool for diagnosis and management of neuroendocrine tumours for both diagnostic and prognostic purposes. 18 It is therefore widely used for monitoring patients with active or cured neuroendocrine diseases. Even though neuroendocrine tumours are rare in children, plasma CgA is used as a screening-, monitoring-, and diagnostic tool in these patients.21–23 CgA is also measured in children as part of cancer screening in members of families with familial endocrine neoplastic syndromes, for example, VHL, MEN, and others. However, little is known about the plasma CgA levels during childhood and adolescence, and currently a plasma CgA reference interval for children and adolescents has not yet been established. Furthermore, measurements of CgA have unfortunately not been standardized. After translation, the CgA protein undergoes post-translational processing including enzymatic cleavage resulting in the secretion of multiple CgA derived fragments.24,25 The pattern of CgA fragments in circulation not only varies between cell/tissue types but also the functional state of the cell/tissue as well as the degree of neoplastic transformation if present.24,26,27 The choice of a diagnostic CgA assay today requires balancing assay performance as well as ability to achieve short turnaround times. We believe the Brahms Kryptor automated platform meets these needs,26,28,29 and therefore wanted to establish a reference interval for CgA in plasma from the perinatal period to late adolescence.
Materials and methods
Sample collection and sources
Three different sample sources were used for the development of the paediatric/adolescent CgA plasma reference interval. The first source was blood samples from individuals (<20 years old) who from 01-10-2019 to 10-03-2020 were tested for allergen-specific immunoglobulin Es (IgEs) for food and inhalation allergens using the ImmunoCAP™ Phadiatop test (Thermo Fisher Scientific, Uppsala, Sweden) at Odense University Hospital. Samples from this group of patients were chosen because these diseases have not been associated with elevated CgA. After the testing for the allergen-specific IgEs had been performed, the residual serum was stored for later CgA measurements. The second source was CgA measurements from individuals aged 4–19 years old belonging to families with familial endocrine neoplastic syndromes who had CgA measured once as part of their cancer surveillance from 23-03-2013 to 27-08-2019. The third source was the first CgA measurements from individuals with two or more plasma CgA. Only the first measurement was used to avoid skewing the reference interval as the rest of the multiple measurements from one individual are not independent observations. Instead, the interdependency of the results from repeated CgA measurements from individuals who fulfilled the inclusion criteria allowed for an approximation of the intra-individual variation of CgA in plasma (mean and CV%) from date of the first to that of the last CgA measurement.
For all three data sources, only CgA measurements above the limit of detection and below 2 times the upper reference limit for adults (approx. <180 µg/L) 29 were included from the study. If just one CgA measurement was outside this limit all CgA the measurements from that individual were excluded since this could be a sign of neuroendocrine disease. All samples were obtained by venous puncture and collected in vacuum serum gel tubes (Becton Dickinson Vacutainer®), centrifuged within 2 h of sampling and serum stored at −80°C until plasma CgA analysis. Because the samples were blinded and only age and plasma CgA concentrations were recorded, the study was approved by the local institutional review board as a quality assurance study.
Age expressed as a number of years in the text will indicate an age-range from the age to the age +0.99 years, for example, 0 ≈ 0.00 – 0.99 years and 4–13 ≈ 4.00 – 13.99 years. This does not apply for age when as the result of a calculation.
Chromogranin A assay
CgA was measured using the Kryptor (BRAHMS, ThermoFisher, Hennigsdorf, Germany) sandwich immunoassay. The assay uses Time-Resolved Amplified Cryptate Emission (TRACE™) technology for detection and uses two monoclonal antibodies directed towards the central domain of human CgA (CgA 124–301). 29 The results are reported in µg/L. The assay measuring range was 13–3000 µg/L. The within-run CV% was 7.0% at 32 µg/L and 2.6% at 115 µg/L and the between run CV was 12.6% 52 at µg/L and 7.1% at 132 µg/L.
Statistical analyses
The dataset was analysed in R using the referenceInterval package and the data visualized using ggplot2 (https://CRAN.R-project.org/package=referenceIntervals or ggplot2), plotting the measurements, median, and 2.5%/97.5%-centiles using the LOESS (locally estimated scatterplot smoothing) non-parametric regression method. The Kruskal Wallis Test was calculated with a significance level (α): 0.05, an effect size (offsets): 0.3. This was followed by a post-hoc Dunn’s test using a Bonferroni corrected alpha of 0.017 to test for the significance of variation between the groups.
Results
Sample population
From 23-03-2013 to 27-08-2019 plasma CgA was measured in 174 samples from 91 individuals undergoing screening for neuroendocrine disease. CgA was measured only once in 65 patients while it was measured more than once in 26 individuals. The CgA concentration was outside the inclusion limits in three individuals with only one measurement (two tests below level of detections and one >180 µg/L) and in three of those with multiple measurements (one result below level of detections and two >180 µg/L). A total of 183 samples were included from children (<20 years old) undergoing screening from 01-10-2019 to 10-03-2020 for allergen-specific IgEs for food and inhalation allergens.
In total, one CgA measurement from 268 individuals aged 0–19 years were included in the reference interval population. The age distribution was slightly uneven with more than 20 persons in the 0, 1, 17, 18, and 19 years-old age groups and less persons in the other age groups (Figure 1). The histogram shows the number of CgA measurements from the reference interval population based on the age of the individuals in 1-year intervals. CgA was measured in 268 blood samples from 268 persons aged 1 month to 19 years. The contribution of each of the three sample sources is indicated. Tested for allergen-specific IgE = samples taken from children 0–19 years old who were being tested for allergen-specific IgEs related to food and inhalation allergies (n = 183). Monitored once = samples collected from individuals who underwent CgA measurement once as part of the monitoring program for familial endocrine neoplastic syndromes (n = 62). 1st of multiple CgA measurements = the first CgA measurement as part of monitoring program for familial endocrine neoplastic syndromes (n = 23).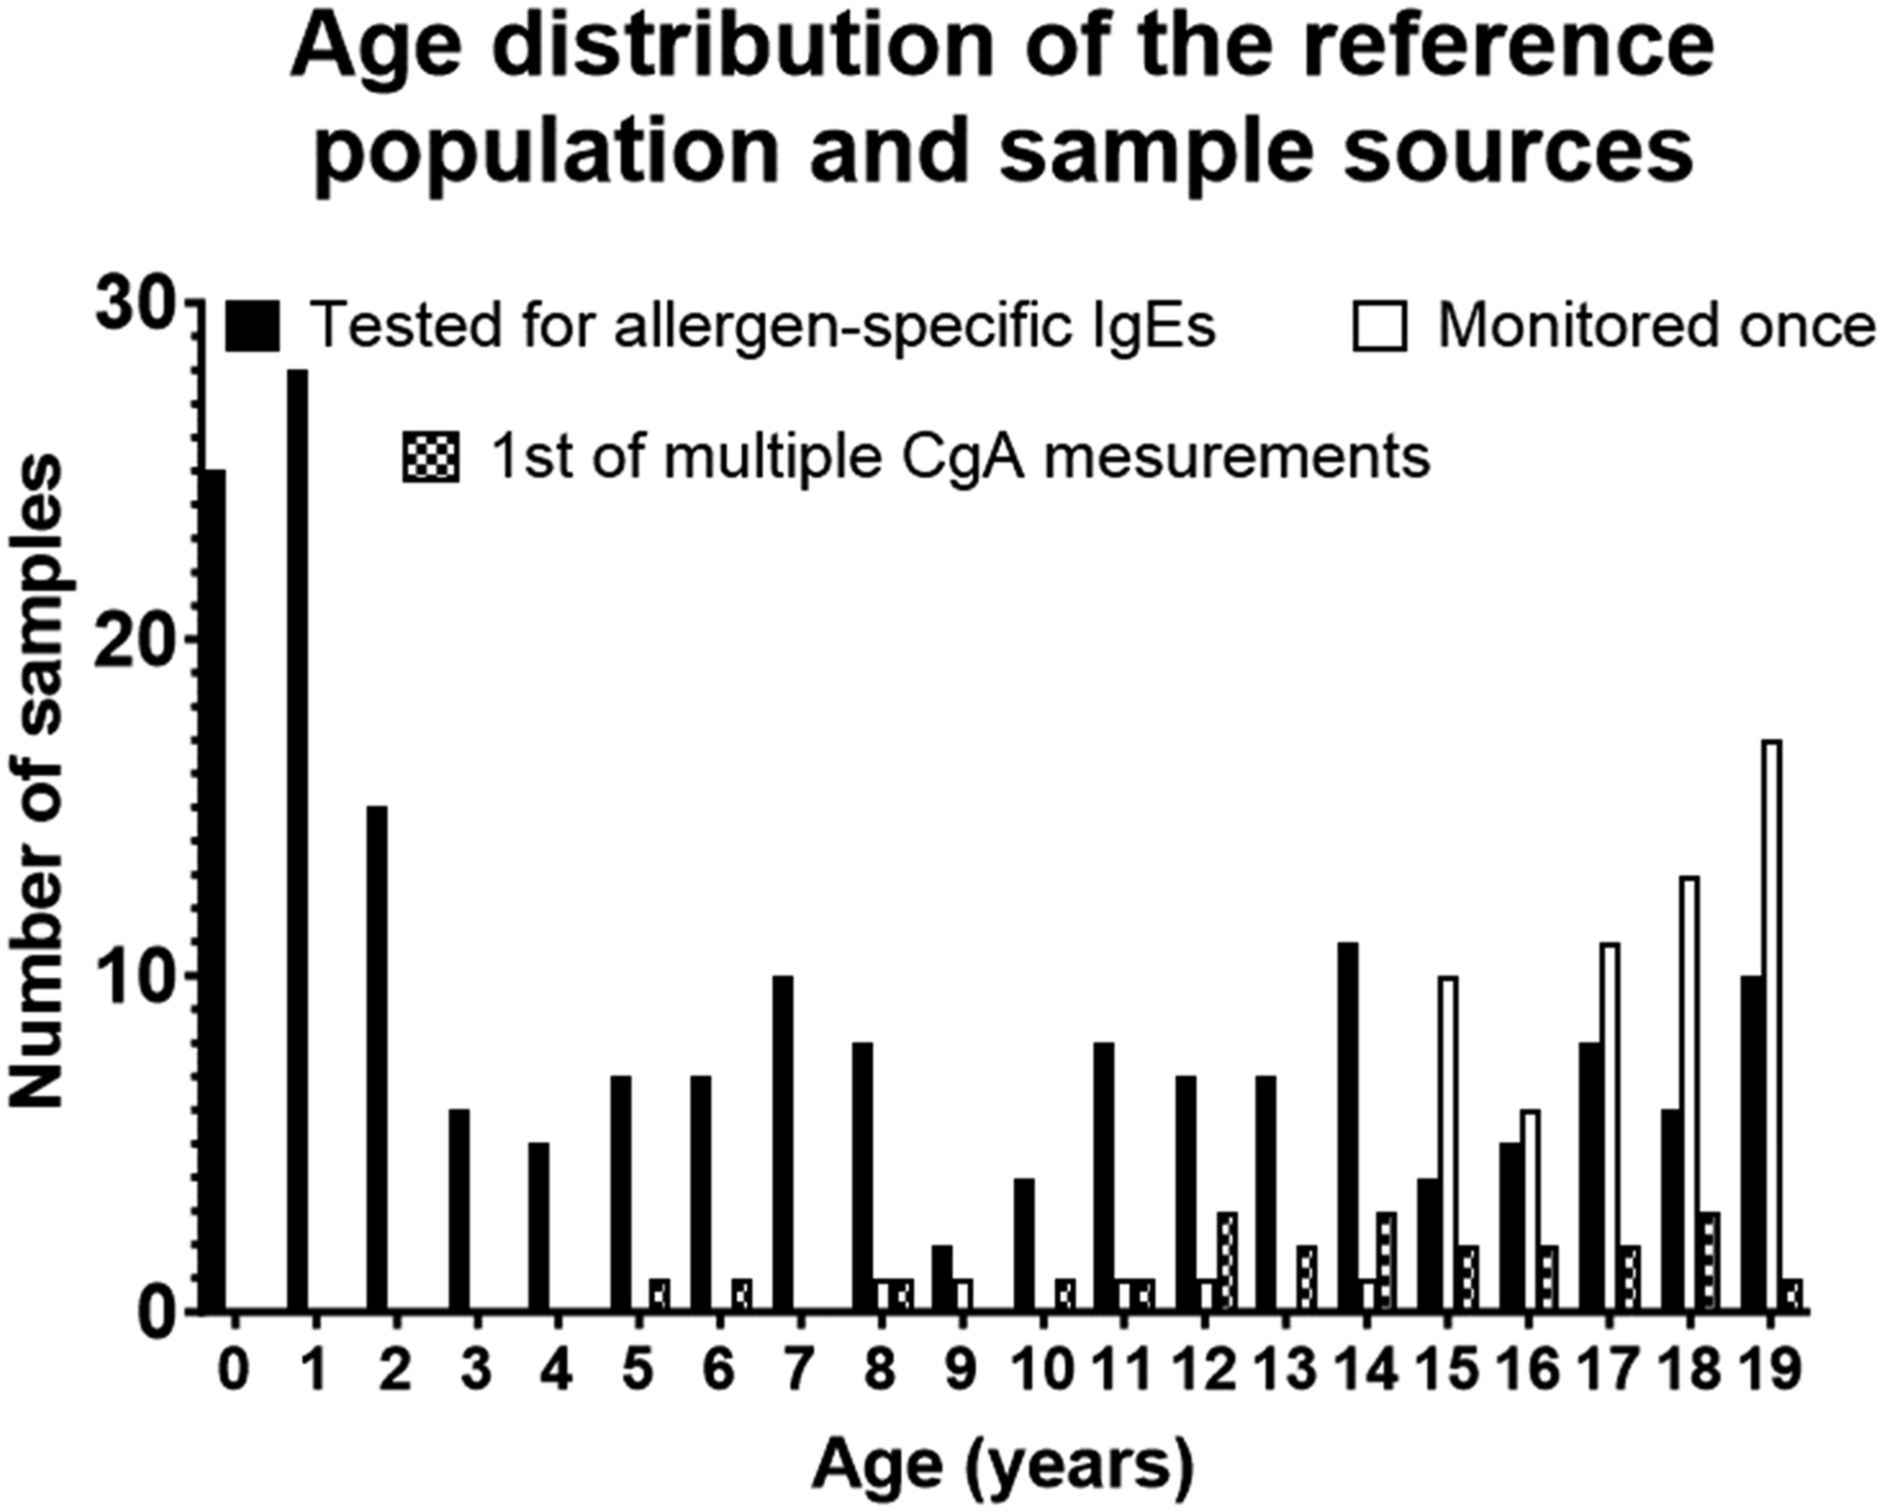
The scatterplot of the CgA plasma concentration against the age of the individual at sample collection showed that the CgA concentration decreased with increased age (Figure 2). The age-dependency of plasma chromogranin A (CgA) in the studied population (n =268 individuals aged 0–19 years). Each point represents one CgA measurement. The median line represents the median with confidence interval indicated by the shaded area calculated using LOESS smoothening method. The upper and lower lines represent 5- and 95-percentiles, respectively. The 5- and 95-percentile lines were smoothed using polynomial function, with 4 degrees of freedom settings. Open circle (○) = samples collected from children 0–19 years who were tested for allergen-specific IgEs related to food and inhalation allergies (n = 183). Open triangle (∆) = samples from individuals who had one CgA measured once as part of monitoring program for familial neoplastic syndromes (n = 62). Plus (+) = the first CgA measurement as part of monitoring program for familial neoplastic syndromes (n = 23).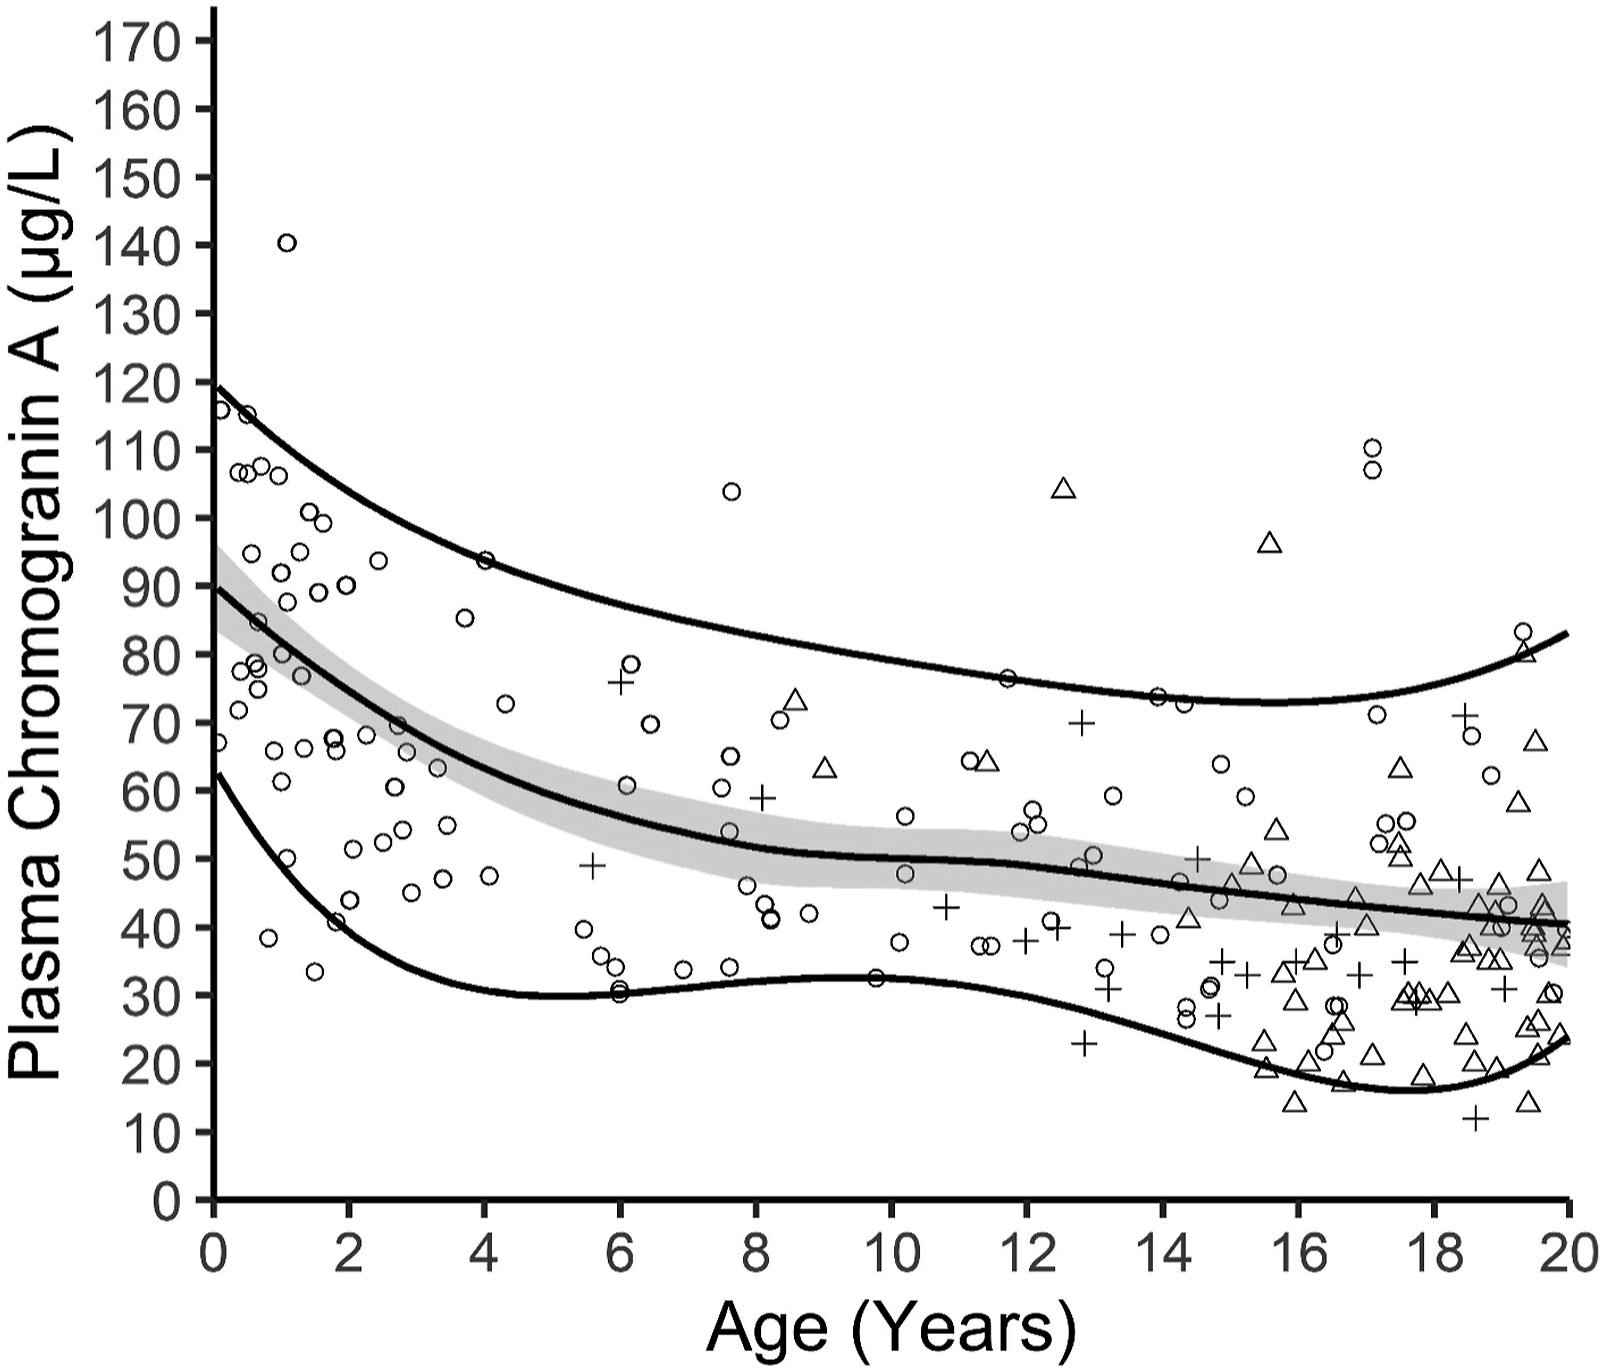
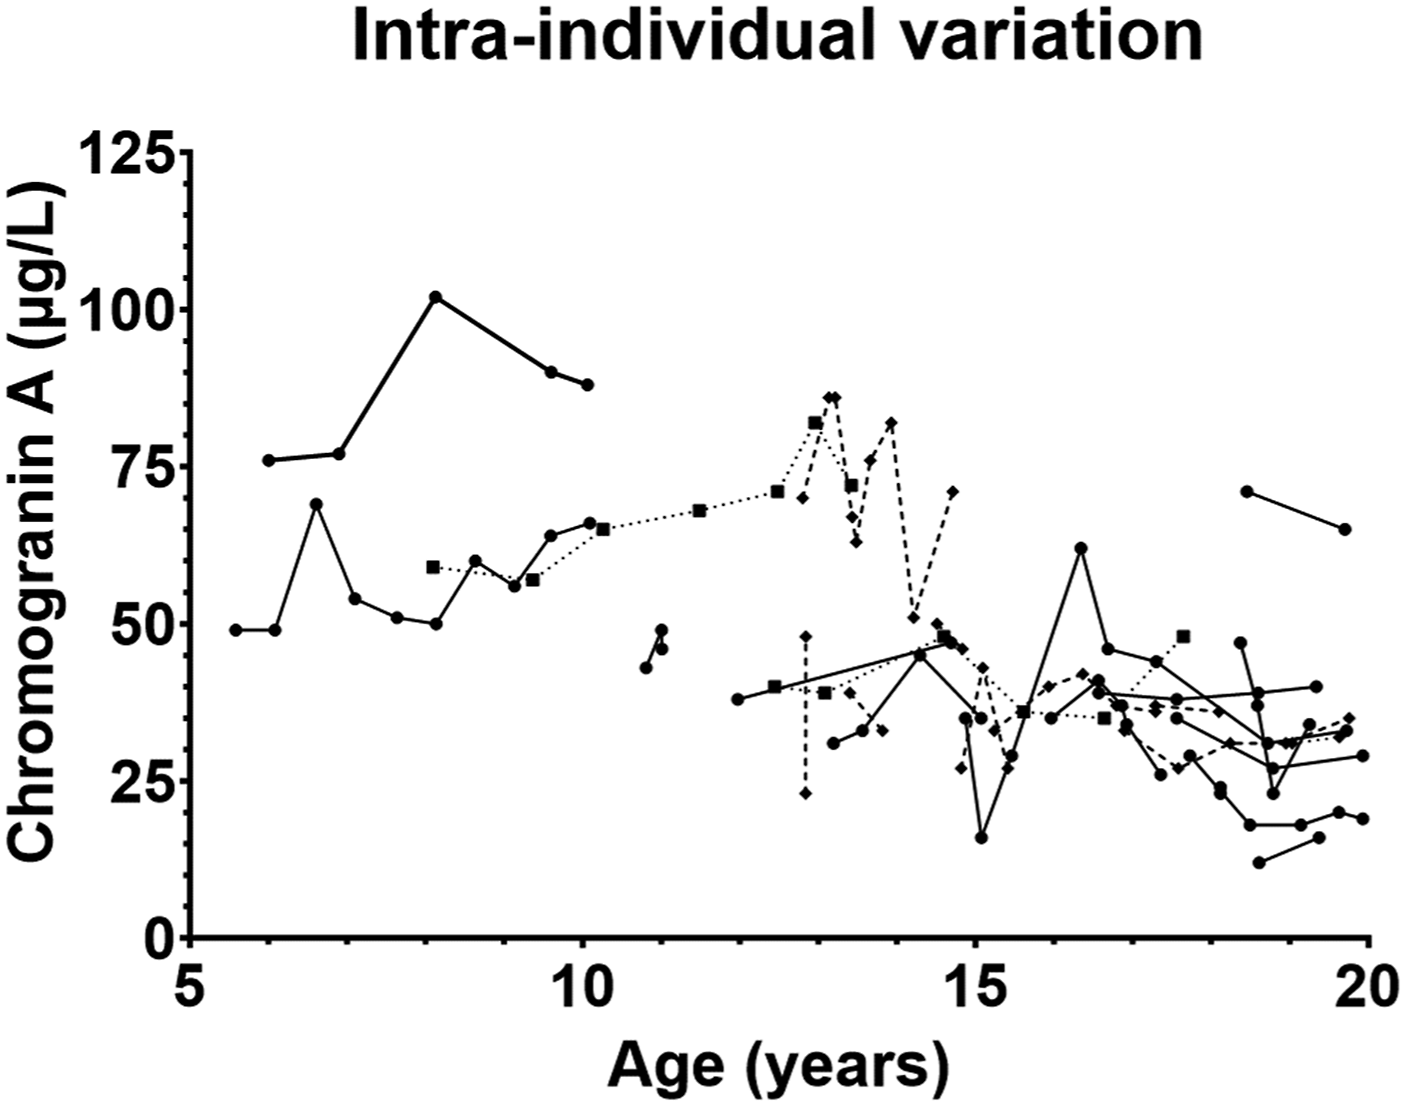
Even though a graphic representation of age dependent paediatric reference intervals and plotting of the actual measurements gives a more detailed and easier interpretation of the test results, many/if not most hospital laboratory LIS’s can display numeric outputs. Visual inspection of the age dependent CgA measurements and focussing on the median and the 2.5-percentile and the 97.5-percentile (Figure 2) suggested the age dependent CgA concentration could be divided into three subgroups: infants/children aged 0–3 year, children aged 4–13 years, and adolescents aged 14–19 years. There seemed to be a marked decrease in the 97.5%-percentile and median CgA concentrations from the 0–3-year group to the 4–13-year group, and a small decrease from the 4–13-year group to the 14–19-year group. In contrast, the 2.5 percentile was roughly the same for 0–3 and 4–13-year groups but then it seemed to decrease in the 14–19-year group. Plotting of the distribution of the CgA measurements in the three groups support the division into three age groups (Figure 3). The reference interval population was therefore divided into these three age groups. The Shapiro–Wilk test for normality showed that the 0–3 years group passed the normality test while the 4–13 years group and the 14–19 years group did not (Table 1). Therefore, only non-parametric tests were used for the further analyses. The same age-dependent trend for a modest decline in the CgA concentration was in part also seen in the dataset used for calculating the intra-individual variation (Figure 4). The CgA concentrations in the three subgroups of reference populations. Based on visual inspection of the age dependent variation in CgA concentrations the reference population was divided in three age groups (0–3 year, 4–13 years, and 14–19 year) and the measurements in each were plotted. The median for each age group is marked by a line. Basic characteristics of the three reference intervals for plasma chromogranin A (µg/L). Chromogranin A (µg/L) was measured in 268 children aged 1 month to 19 years using the Brahms Kryptor chromogranin II assay. The dataset was divided in three age groups and examined using both parametric and non-parametric data analyses. Age-specific reference intervals were calculated using the referenceInterval package in R. na = not available. The adult reference limits are from references.29,30 The Kryptor reference interval is from the assay kit insert. Intra-individual variation. Twenty-three individuals had two or more CgA measurements (median 4 samples (range 2–10 samples per individual). Each measurement from the same individual is plotted and connected with either a solid line, a dotted line, or a striped line. The appearance of the line was chosen to allow for visual separation of the time-course for each individual.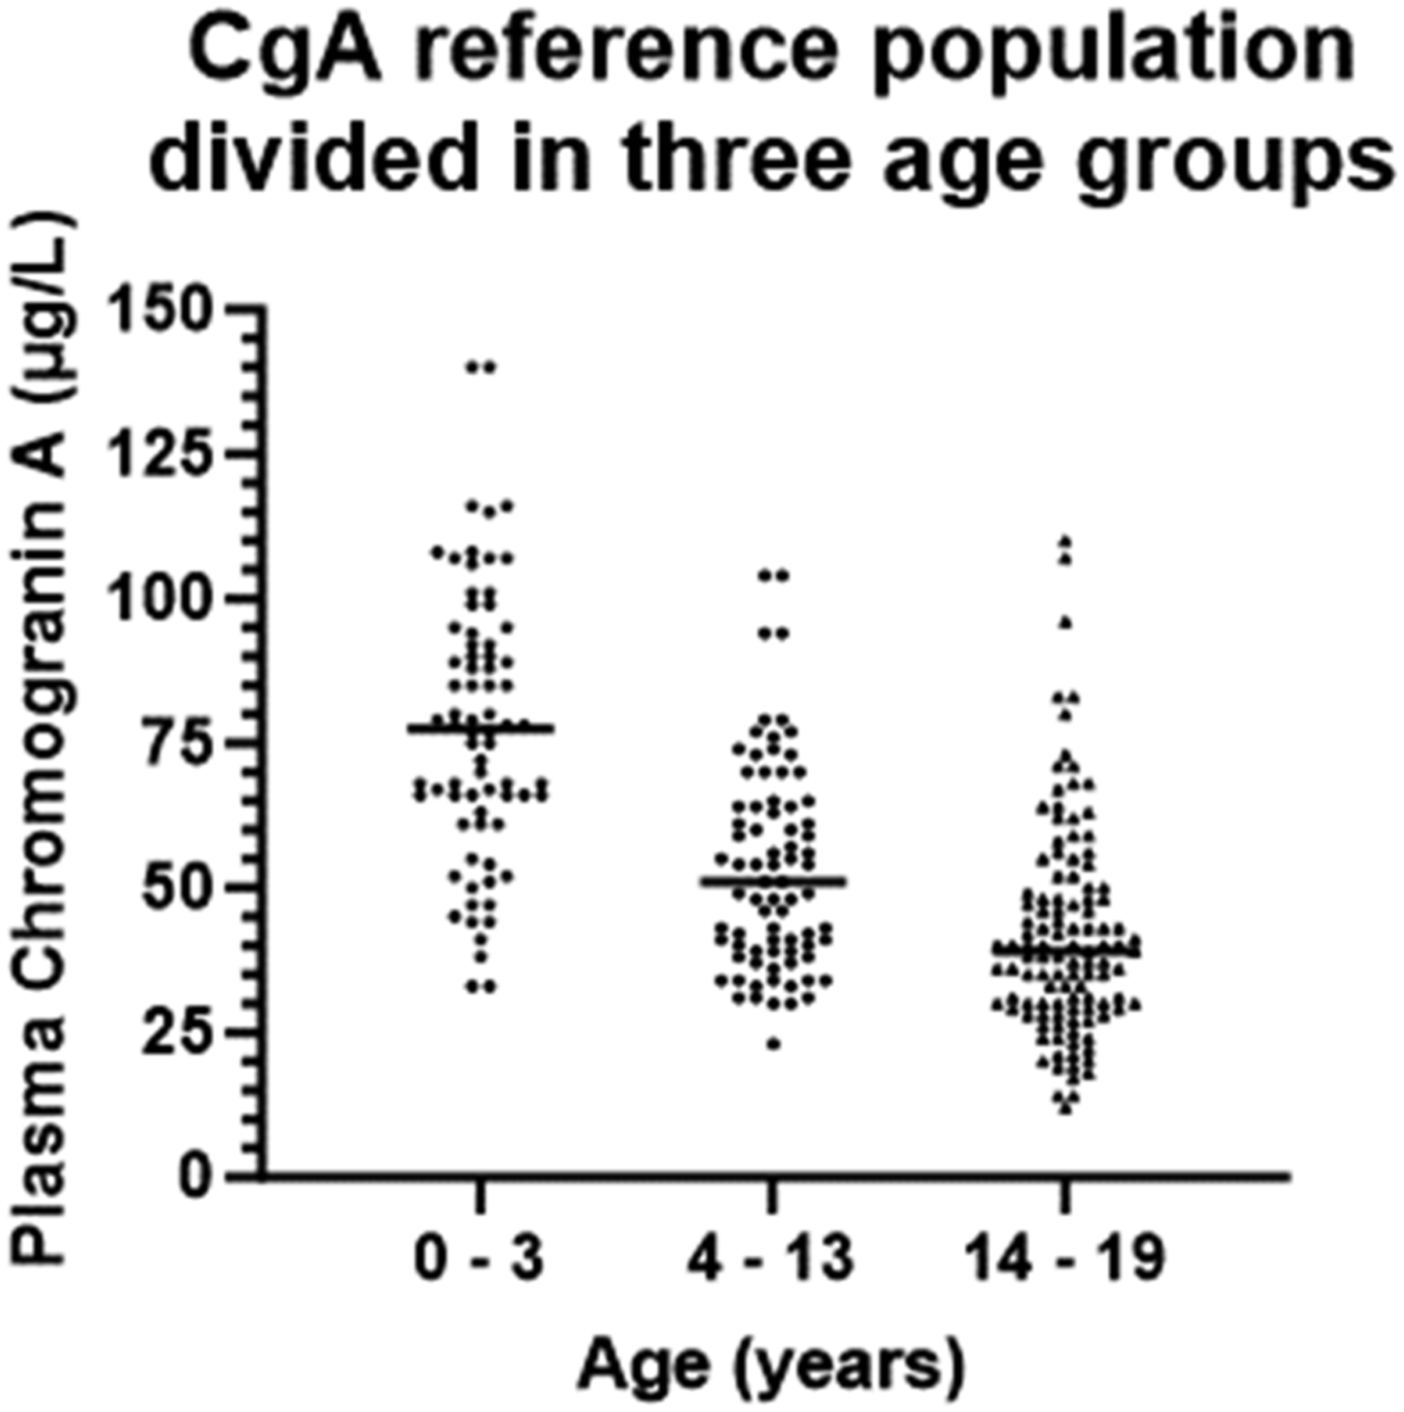
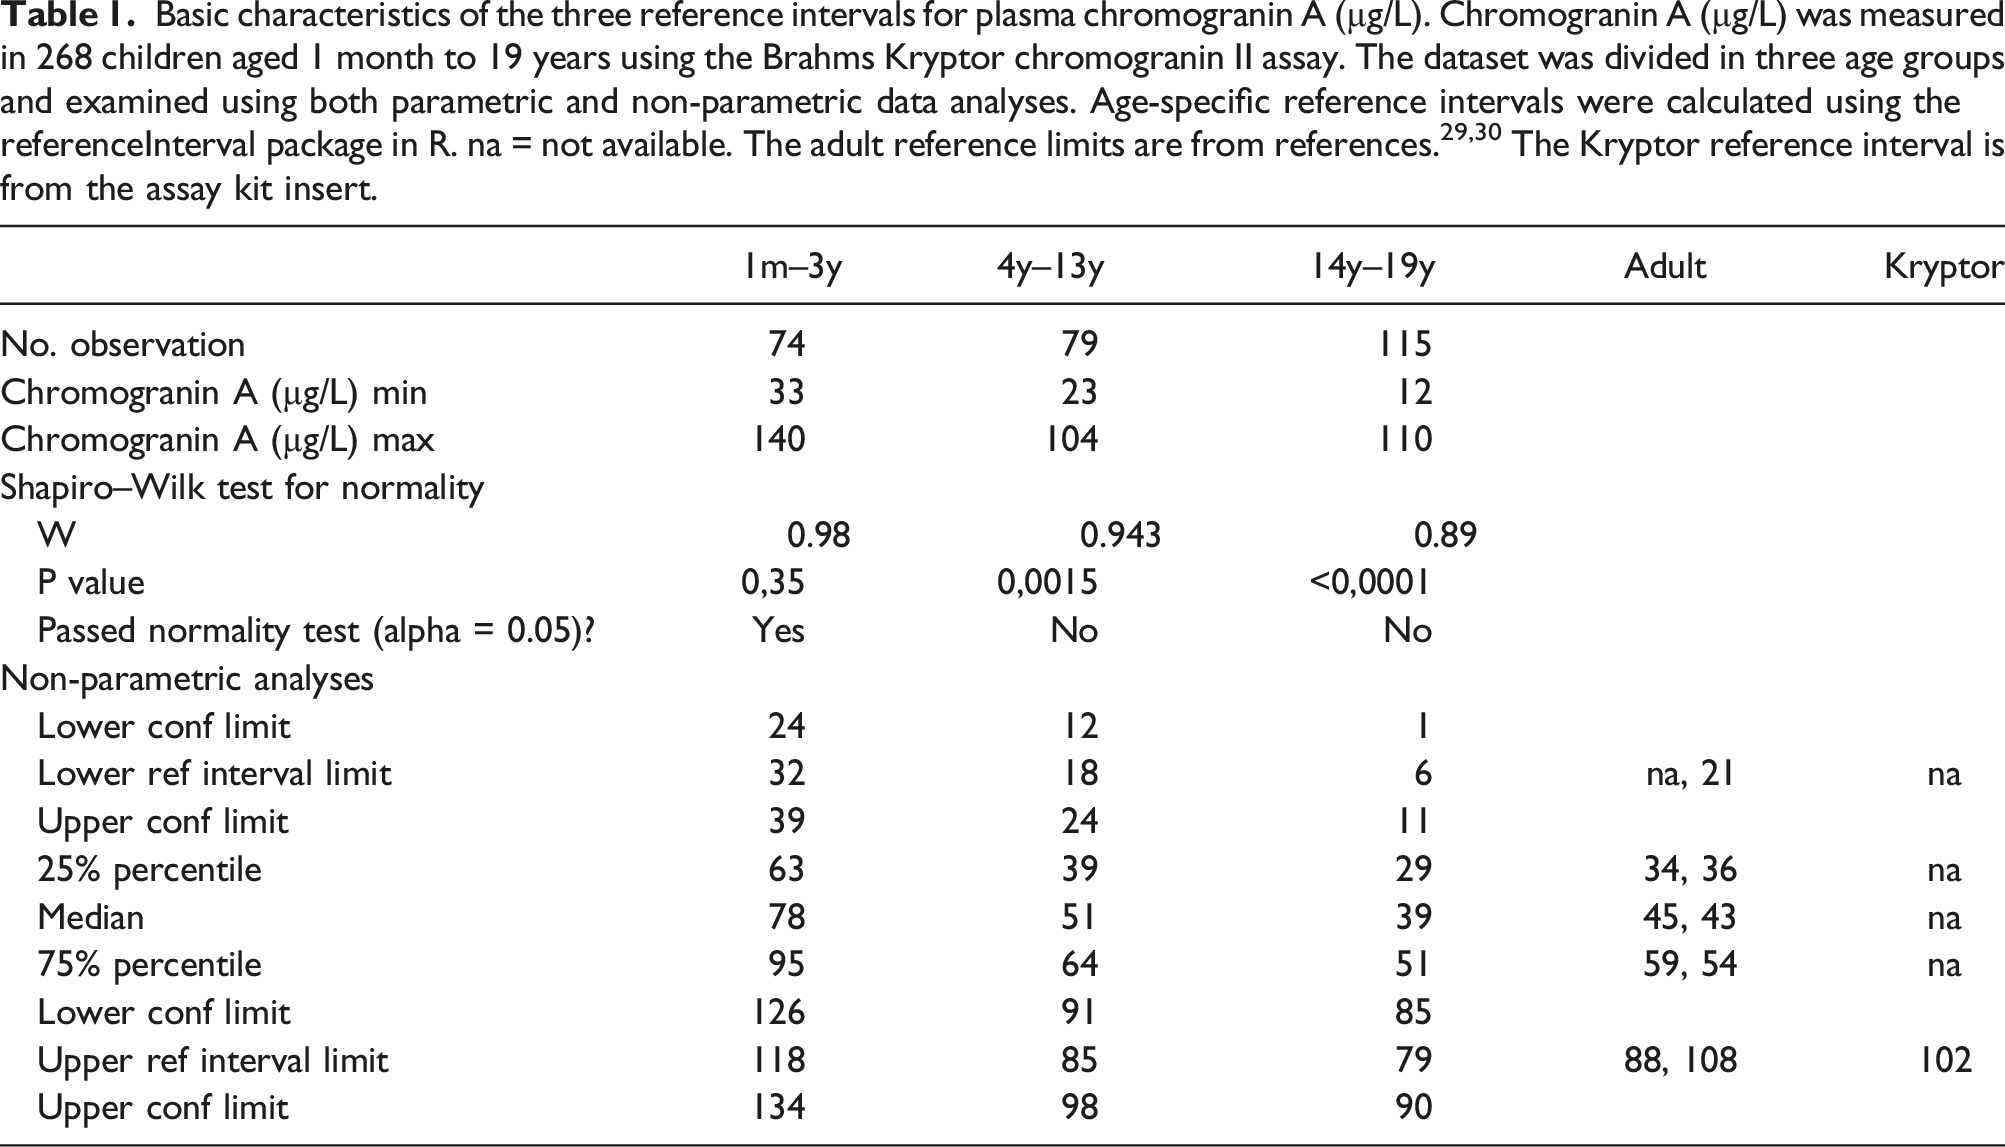
The Kruskal–Wallis H test indicated that there was a significant difference in the dependent variable between the different groups, χ2(2) = 94.7, P < .001, with a mean rank score of 203 for the 0–3 years group, 135 for the 4–13 years group, and 90 for 14–19 years group. The post-hoc Dunn’s test using a Bonferroni corrected alpha of 0.017 indicated that the mean ranks of the following pairs were significantly different: 0–3 years group and the 4–13 years group, the 0–3 years group and the 14–19 years group, and the 4–13 years group and the 14–19 years group. The references intervals for the three age groups were therefore subsequently calculated using non-parametric analyses (Table 1).
Intra-individual variation
Chromogranin A was measured twice or more in 23 children/adolescents with median age 17 years (range 5–19 years) at the time of first chromogranin A measurement. This meant that all individuals had passed the 0–3 years old age group within which there was a major age-dependent decline in CgA concentration and they were therefore all included in the analysis. The total number of measurements was 164, median 4 measurements/individual (range 2–10 measurements/individual). The median time from first to last measurement was 2.2 years (1 month–5.3 years). The median intra-individual variation was 14% (range 2%–50%). The course of the variation in the CgA concentration for each individual showed that most individuals (n = 19) had stable or even declining values (in part mirroring the age dependent changes reported above). In four individuals the CgA concentration seemed slightly increased but the intra-individual variation was less than 15% (Figure 4) which was considered within the normal intra-individual variation (reported to be 10%, 31 16%, 32 and 29% 33 ) and the data was therefore not excluded.
Discussion
The reference interval for plasma CgA in children and adolescents aged 0–19 years will be useful when plasma CgA is used for diagnostic purposes 34 in patients suspected of neuroendocrine tumours and for monitoring members of neuroendocrine tumour syndrome families. Since it is difficult to recruit children for studies of biological and intra-individual variation, we used the clinical samples obtained from the familial endocrine neoplastic syndrome screening programs to calculate the intra-individual variation. Using clinical samples meant that there were greater variation and less structure in the number of samples and the period over which they were collected than what is seen in the studies examining the intra-individual variation in adults. Despite the inherent limitation of our sample collection method, the intra-individual variation = 14% found for children 0–19 years in this study is comparable to that found in healthy adults ranging from 10%, 31 16% 32 to 29%, 35 and that observed (22% 36 to 29% 33 ) for adult patients with endocrine neoplastic syndromes. This also emphasizes, given the width of both the paediatric and adult reference intervals, the value of using the person as his/her own reference for following the longitudinal trend instead of just comparing test results to reference intervals.
To generate the paediatric CgA reference interval, we used blinded samples only including information on sampling date and the persons age, but without further information about health status etc. Therefore, we cannot rule out that the samples stem from persons who could suffer from one of the many non-malignant or malignant conditions associated with elevated plasma levels of CgA. 11 To validate this approach for generating reference intervals, we compared the reference interval of the 14–19 years group in our study to that found for adults using the same assay (Table 1) and found that the medians, 25%/75%-percentiles, lower and upper reference limits were comparable to those previously reported for adults (29,30 and Kryptor CgA kit insert) (Table 1). We have been unable to find other reports where plasma CgA has been measured in children using the Brahms Kryptor assay. There are some reports of CgA in children 37 but given the considerable differences between different CgA assays, 38 it is difficult to compare the levels and reference ranges we have found to those reported elsewhere. However, Hsiao found that CgA did not vary with age though they only included 23 children aged 1 month to 18 years, and the sample size is too small to be used for an age specific reference interval. Pancreastatin is a peptide derived from CgA 8 and displayed age-related changes comparable to our observations in a study of neuropeptides in normal children. 39
The division of the dataset into three age groups can be questioned given the relatively small number of samples and the uneven age distribution of those included. Therefore, to corroborate the age-dependent variation found for CgA in this study, it was compared to the age dependent variation in other markers (normetanephrine, metanephrine, 3-methoxytyramine, and 3-O-methyldopa) for catecholamine and histamine producing endocrine cells. 40 The age-dependent decrease in CgA found in this study mirrors the variation seen in normetanephrine, 3-methoxytyramine, and 3-O-methyldopa: Steadily decreasing concentrations were seen during first three to 4 years, followed by fairly constant levels from 3–4 years to 14–18 years of age, which was again followed by a minor decrease in levels in late adolescence 14/15–19 years.41,42 In contrast, the age-dependent variation in metanephrine differed from that of the other markers.41,42 CgA, normetanephrine, 3-methoxytyramine, and 3-O-methyldopa are synthesized within the same endocrine cells and stored in the same secretory granules within these cells. 43 We therefore believe that the age dependent variation for the markers reflects the biology of the cells, and that this supports the subdivision in the three chosen age groups. Unfortunately, the design of current study excluded collecting additional information and/or measurements of other hormones in the samples and therefore it is not possible to further address the biology associated with age-dependent changes in plasma CgA.
Using a combination of three different patient sources (individuals 0–19 years old) tested for allergen-specific IgEs for food and inhalation allergens, individuals aged 4–19 years old belonging to families with familial endocrine neoplastic syndromes who had CgA measured once, and the first CgA measurement from individuals who had 2 or more CgA measurements as part of their surveillance for endocrine neoplastic syndromes) it has been possible to establish reference intervals and intra-individual variation for CgA for persons aged 1 month to 19 years. Due to the method used for collecting data and the number of samples established, reference intervals have some limitations, and we encourage more research to be done. Therefore, we sought to corroborate the found reference intervals and variations by comparing the age-dependent variation to that of other markers released from the same endocrine cells and the reference intervals and variation found for CgA adults. Both comparisons supported the data in this study and until bigger studies of CgA in children and adolescents are available the reported reference intervals will be useful when screening and monitoring children for endocrine neoplastic syndromes used with respect for the limitations that CgA has as a screening, monitoring, and diagnostic tool. 18
Footnotes
Acknowledgements
The authors thank Vivi Snedevind Møller for expert technical assistance and Mathilde Harder for administrative support.
Author contributions
Conceptualization, SL and LFH; methodology, SL and LFH; software, LFH; validation, SL, FFH, and LFH; formal analysis, SL, FFH, and LFH; investigation, SL, FFH, and LFH; resources, LFH; data curation, SL and LFH; writing—original draft preparation, SL and LFH; writing—review and editing, SL, FFH, and LFH; visualization, FFH an LFH; supervision, LFH; project administration, LFH; funding acquisition, LFH. All authors have read and agreed to the published version of the manuscript.
Declaration of conflicting interests
The author(s) declared no potential conflicts of interest with respect to the research, authorship, and/or publication of this article.
Funding
The author(s) disclosed receipt of the following financial support for the research, authorship, and/or publication of this article: The research was supported by Odense University Hospital and a generous gift of chromogranin A assays from ThermoFisher, for which we are greatly thankful.
Ethical approval
Institutional Review Board Statement: The study was approved by the local institutional review board as a quality assurance study March 16th, 2020.
Guarantor
LFH.