
Abstract
Background
Relationships between the subclasses of high-density lipoprotein (HDL) or low-density lipoprotein (LDL) and the risk of atherosclerotic cardiovascular disease have been studied, and using various methods, such as ultracentrifugation, electrophoresis, and nuclear magnetic resonance, for analysing lipoprotein subclasses. We established a method for HDL and LDL subclasses using anion-exchange high-performance liquid chromatography (AEX-HPLC) with a linear concentration gradient of sodium perchlorate (NaClO4).
Method
In the AEX-HPLC, the subclasses of HDL and LDL were separated, and detected using a post-column reactor with an enzymatic cholesterol reagent, that contained cholesterol esterase, cholesterol oxidase, and peroxidase as major ingredients. LDL subclasses were divided based on the absolute value of first-derivative chromatogram.
Result
Three HDL subclasses, HDL-P1, HDL-P2, and HDL-P3, and three LDL subclasses, LDL-P1, LDL-P2, and LDL-P3, were separated by AEX-HPLC, and detected in order. The major components of HDL-P2 and HDL-P3 were HDL3 and HDL2, respectively. The linearity was determined for each lipoprotein subclass. The coefficients of variation of cholesterol concentration of the subclasses for within-day assay (n = 10) and between-day assay (n = 10) ranged between 3.08–8.94% and 4.52–9.97%, respectively. Cholesterol levels in HDL-P1 of diabetic patients were positively correlated with oxidized LDL levels (r = 0.409, p = 0.002). Moreover, cholesterol levels in LDL-P2 and LDL-P3 were positively correlated with oxidized LDL levels (r = 0.393, p = 0.004 and r = 0.561, p < 0.001, respectively).
Conclusion
AEX-HPLC may be highly suitable as an assay to clinically assess lipoprotein subclasses.
Keywords
Introduction
High levels of low-density lipoprotein cholesterol (LDL-C) and low levels of high-density lipoprotein cholesterol (HDL-C) have been established as risk factors for atherosclerotic cardiovascular disease (CVD), including coronary heart disease (CHD).1,2 The guidelines presented by many medical societies or associations for managing dyslipidemia focus on LDL-C levels because of their strong association with CVD risk.3–5 Diabetes also is a risk factor for CVD, and induces dyslipidemia, which is characterized by reduced high-density lipoprotein (HDL) level and elevated small dense low-density lipoprotein (LDL) and very low-density lipoprotein (VLDL) levels.6–8
Relationships between the HDL or LDL subclasses and the risk of CVD have been reported.9–14 Various methods have been used for analysing lipoprotein subclasses, such as ultracentrifugation, 9 electrophoresis, 12 nuclear magnetic resonance (NMR), 11 gel-permeation chromatography, 13 and ion mobility analysis. 14 A comparative study on these method has reported that the increases in coronary arterial stenosis in three years with patients of follow-up coronary angiographies were associated with smaller LDL (LDLIIIb) levels by gradient gel electrophoresis, intermediate-density lipoprotein (IDL), smaller LDL (LDL4), and larger HDL (HDL2) levels by vertical spin ultracentrifugation, small LDL levels by NMR, or smaller LDLs (LDLIIIa and LDLIIIb) levels by ion mobility analysis. 10 Cholesterol levels in smaller HDL3 analysed by vertical spin ultracentrifugation has been reported to be inversely associated with the incidence of CHD.99 High cholesterol levels in the small LDL subfraction detected by gradient gel electrophoresis have been reported to be related to an increase in coronary artery stenosis and incident CHD. 12 In some studies using NMR, the incidence rate of type 2 diabetes has been reported to increase with high levels of small HDL or LDL subclasses, and low levels of large HDL or LDL subclasses.15–17
We previously developed a method for lipoprotein analysis by anion-exchange high-performance liquid chromatography (AEX-HPLC) on a diethylaminoethyl ligand column and an eluent containing sodium perchlorate (NaClO4). 18 We first tried to separate lipoprotein classes in human serum by AEX-HPLC using a linear-gradient manner and found two HDL peaks, a broad LDL peak, an IDL peak, and a broad VLDL peak. 19 We subsequently developed a new method to measure cholesterol levels in HDL, LDL, IDL, VLDL, chylomicrons (CM), and lipoprotein(a) [Lp(a)] using AEX-HPLC with a step gradient.19,20 The developed method can separate major lipoprotein classes, and is suitable for accurate evaluation of lipoprotein levels in healthy and patient serum.
With further refinement, we have presently developed a new analytical method for each subclass of HDL and LDL using a linear concentration gradient of NaClO4. In this study, we aimed to analyse how many subclasses in HDL or LDL can be separated by this novel method and to estimate the levels of serum HDL and LDL subclasses in patients with type 2 diabetes.
Materials and methods
Samples
Two serum samples (samples 1 and 2) obtained from a healthy male (age, 45 years; total cholesterol (TC), 178 mg/dL; triglyceride (TG), 147 mg/dL, HDL-C, 57 mg/dL; LDL-C, 96 mg/dL) and a hyperlipidemic male (age, 66 years; TC, 166 mg/dL; TG, 167 mg/dL; HDL-C, 49 mg/dL; LDL-C, 95 mg/dL), respectively, were used to separate each lipoprotein subfraction by ultracentrifugation. Serum (sample 3) obtained from a healthy male (age, 52 years; TC, 195 mg/dL, TG, 78 mg/dL; HDL-C, 64 mg/dL; LDL-C, 110 mg/dL) was used for linearity. Serum (sample 1) and serum (sample 4) obtained from a healthy male (age, 56 years; TC, 175 mg/dL; TG, 116 mg/dL; HDL-C, 40 mg/dL; LDL-C, 116 mg/dL) were used for precision tests. Serum samples obtained from 53 outpatients with type 2 diabetes at Kohnodai Hospital, National Center for Global Health and Medicine, were used to compare cholesterol levels of lipoproteins with oxidized LDL (ox-LDL) levels. Twenty-nine of the 53 diabetic patients were treated by administration for dyslipidemia. Written informed consent was obtained from all patients for this study. This study was approved by the Research Ethics Committee of the National Center for Global Health and Medicine (No. NCGM-G-003443-00). The clinical and biochemical characteristics of patients studied are shown in Table 2. A commercially available lipoprotein(a) [Lp(a)] sample (Biomedical Technologies Inc., MA, USA) was purified by ultracentrifugation and immuno-affinity chromatography on anti-apolipoprotein(a) Sepharose.
Measurements
The enzymatic cholesterol reagent used for AEX-HPLC was a commercially available kit (HLC-test Lipopropak, Tosoh Co., Tokyo, Japan). Ox-LDL, TC, TG and creatinine levels were measured using the following kits; Ox-LDL ELISA Daiichi (Sekisui Medical Co., Tokyo, Japan), Cholestest CHO (Sekisui Medical Co., Tokyo, Japan), Cholestest TG, (Sekisui Medical Co., Tokyo, Japan), and Pureauto S CRE-L, (Sekisui Medical Co., Tokyo, Japan), respectively. The estimated glomerular filtration rate (eGFR) was calculated from creatinine levels. 21 Blood glucose and HbA1c (NGSP%) levels were measured using the instruments, HLC-723G11 (Tosoh Co., Tokyo, Japan) and GA09 (A and T Co., Tokyo, Japan), respectively.
Chromatography
The HDL and LDL subclasses were separated using AEX-HPLC with a linear concentration gradient of NaClO4. We applied a column [4 mm inner diameter (I.D.) × 15 mm length] containing 2.5 μm non-porous gel with diethylaminoethyl ligand (DEAE-NPR, Tosoh Co., Tokyo, Japan) and three eluents with different NaClO4 concentrations to precisely separate HDL and LDL subclasses. The three eluents were passed through three pumps (DP-8020, Tosoh Co.) for gradient elution. The compositions of eluents are as follows: Eluent 1 [50 mmol/L Tris-HCl + 1 mmol/L ethylenediaminetetraacetic acid disodium salt (EDTA-2Na), pH 7.5], Eluent 2 (50 mmol/L Tris-HCl + 250 mmol/L NaClO4 + 1 mmol/L EDTA-2Na, pH 7.5), and Eluent 3 (50 mmol/L Tris-HCl + 400 mmol/L NaClO4 + 1 mmol/L EDTA-2Na, pH 7.5). The pattern of NaClO4 concentrations for separation of the lipoprotein classes were 25–92.5 mmol/L linear gradient for 0–17 min, 92.5–190 mmol/L linear gradient for 17–58.5 min, 190 mmol/L for 58.5–61 min, 190–400 mmol/L linear gradient for 61–62 min, 400 mmol/L for 62–63.2 min, 400–25 mmol/L linear gradient for 63.2–64.2 min, and 25 mmol/L for 64.2–71.2 min. One cycle of measurement was 71.2 min. HDL (2–17 min), LDL and IDL (17–44.5 min) were eluted using the linear-gradient mode. VLDL (44.5–61 min) was eluted using linear and constant gradient modes. The column was washed from 61 to 63.2 min to elute the lipoproteins other than HDL, LDL, IDL, and VLDL (Supplemental Table 1). The flow rate was 0.5 mL/min. The eluents were allowed to flow into the photometer after 4.5 min. An auto sampler (AS-8021, Tosoh Co., Tokyo, Japan) was used to inject the serum samples (injection volume, 4.7 μL). The eluate from the column was mixed with an enzymatic cholesterol reagent that contained cholesterol esterase, cholesterol oxidase, and peroxidase as the major components (HLC-test Lipopropak, Tosoh Co., Tokyo, Japan). Flow rate of the enzymatic cholesterol reagent was set at 0.25 mL/min using a pump. The mixed solution reacted at 45°C for 2.1 min in a post-column reactor (Teflon tube, 0.25 mm I.D. × 32 mm length). The eluate after reaction was monitored at 600 nm using a photometer. The absorbances was measured every 0.4 s and depicted as voltage (absorbance 1 = 1 V). The absolute values of first derivative (mV/s) calculated by the difference in voltage (absorbance) detected every 0.4 s were used to separate LDL subclasses. Serum samples (100 μL) were mixed with 50 μL stock solution (760 g/L sucrose and 1.5 g/L EDTA-2K) and stored at −80°C until use.
In this study, cholesterol concentrations of each lipoprotein class and subclass in the chromatograms of serum samples were calculated as the proportion of the peak area of each lipoprotein class and subclass to the total area reflecting TC level. TC levels of serum samples were calculated as the total area of lipoprotein peaks of serum samples to the total area of chromatogram peaks of the pooled control serum with known concentration of TC (213 mg/dL).
Ultracentrifugation
Serum lipoproteins were ultracentrifuged as previously reported. 22 Densities of fractions of VLDL, IDL, LDL1, LDL2, LDL3, HDL2, and HDL3 were set as d < 1.006 g/mL, 1.006 < d < 1.019 g/mL, 1.019 < d < 1.035 g/mL, 1.035 < d < 1.045 g/mL, 1.045 < d < 1.063 g/mL, 1.063 < d < 1.125 g/mL and 1.125 < d g/mL, respectively. The VLDL sample was separated based on the flotation rates. The flotation rates of VLDL1 and VLDL2 were set at 60–400 and 20–60 s, respectively, in a solution of 1.745 mol/L sodium chloride (d = 1.063 g/mL). An ultracentrifugate (CS120FNX, Himac Technologies Co., Tokyo Japan), a fixed-angle rotor (S110AT, Himac Technologies Co., Tokyo, Japan) and a swing-bucket rotor (S110AT, Himac Technologies Co., Tokyo, Japan) were used.
Linearity and precision tests
Serum sample 3 serum was used for linearity testing. The sample was diluted using 5% bovine serum albumin, and 7.1-μL aliquots were injected. Samples 1 and 4 were used for within-day and between-day assays, with an injection volume of 4.7 μL. Precision tests for within-day and between-day assays were performed 10 times a day and once a day for 10 days, respectively.
Statistical analysis
Statistical analyses were performed using the Stat Flex v.7 software (Artec Inc., Osaka, Japan). Correlations between cholesterol concentrations of each lipoprotein class and subclass determined by AEX-HPLC, and ox-LDL levels in patients with type 2 diabetes were evaluated using the Spearman rank correlation coefficient and equiprobable ellipses. The Mann–Whitney U test was used to determine statistically significant differences (p < 0.05) between two groups of patients with type 2 diabetes divided on the basis of ox-LDL levels.
Results
Chromatogram of lipoproteins from AEX-HPLC analysis
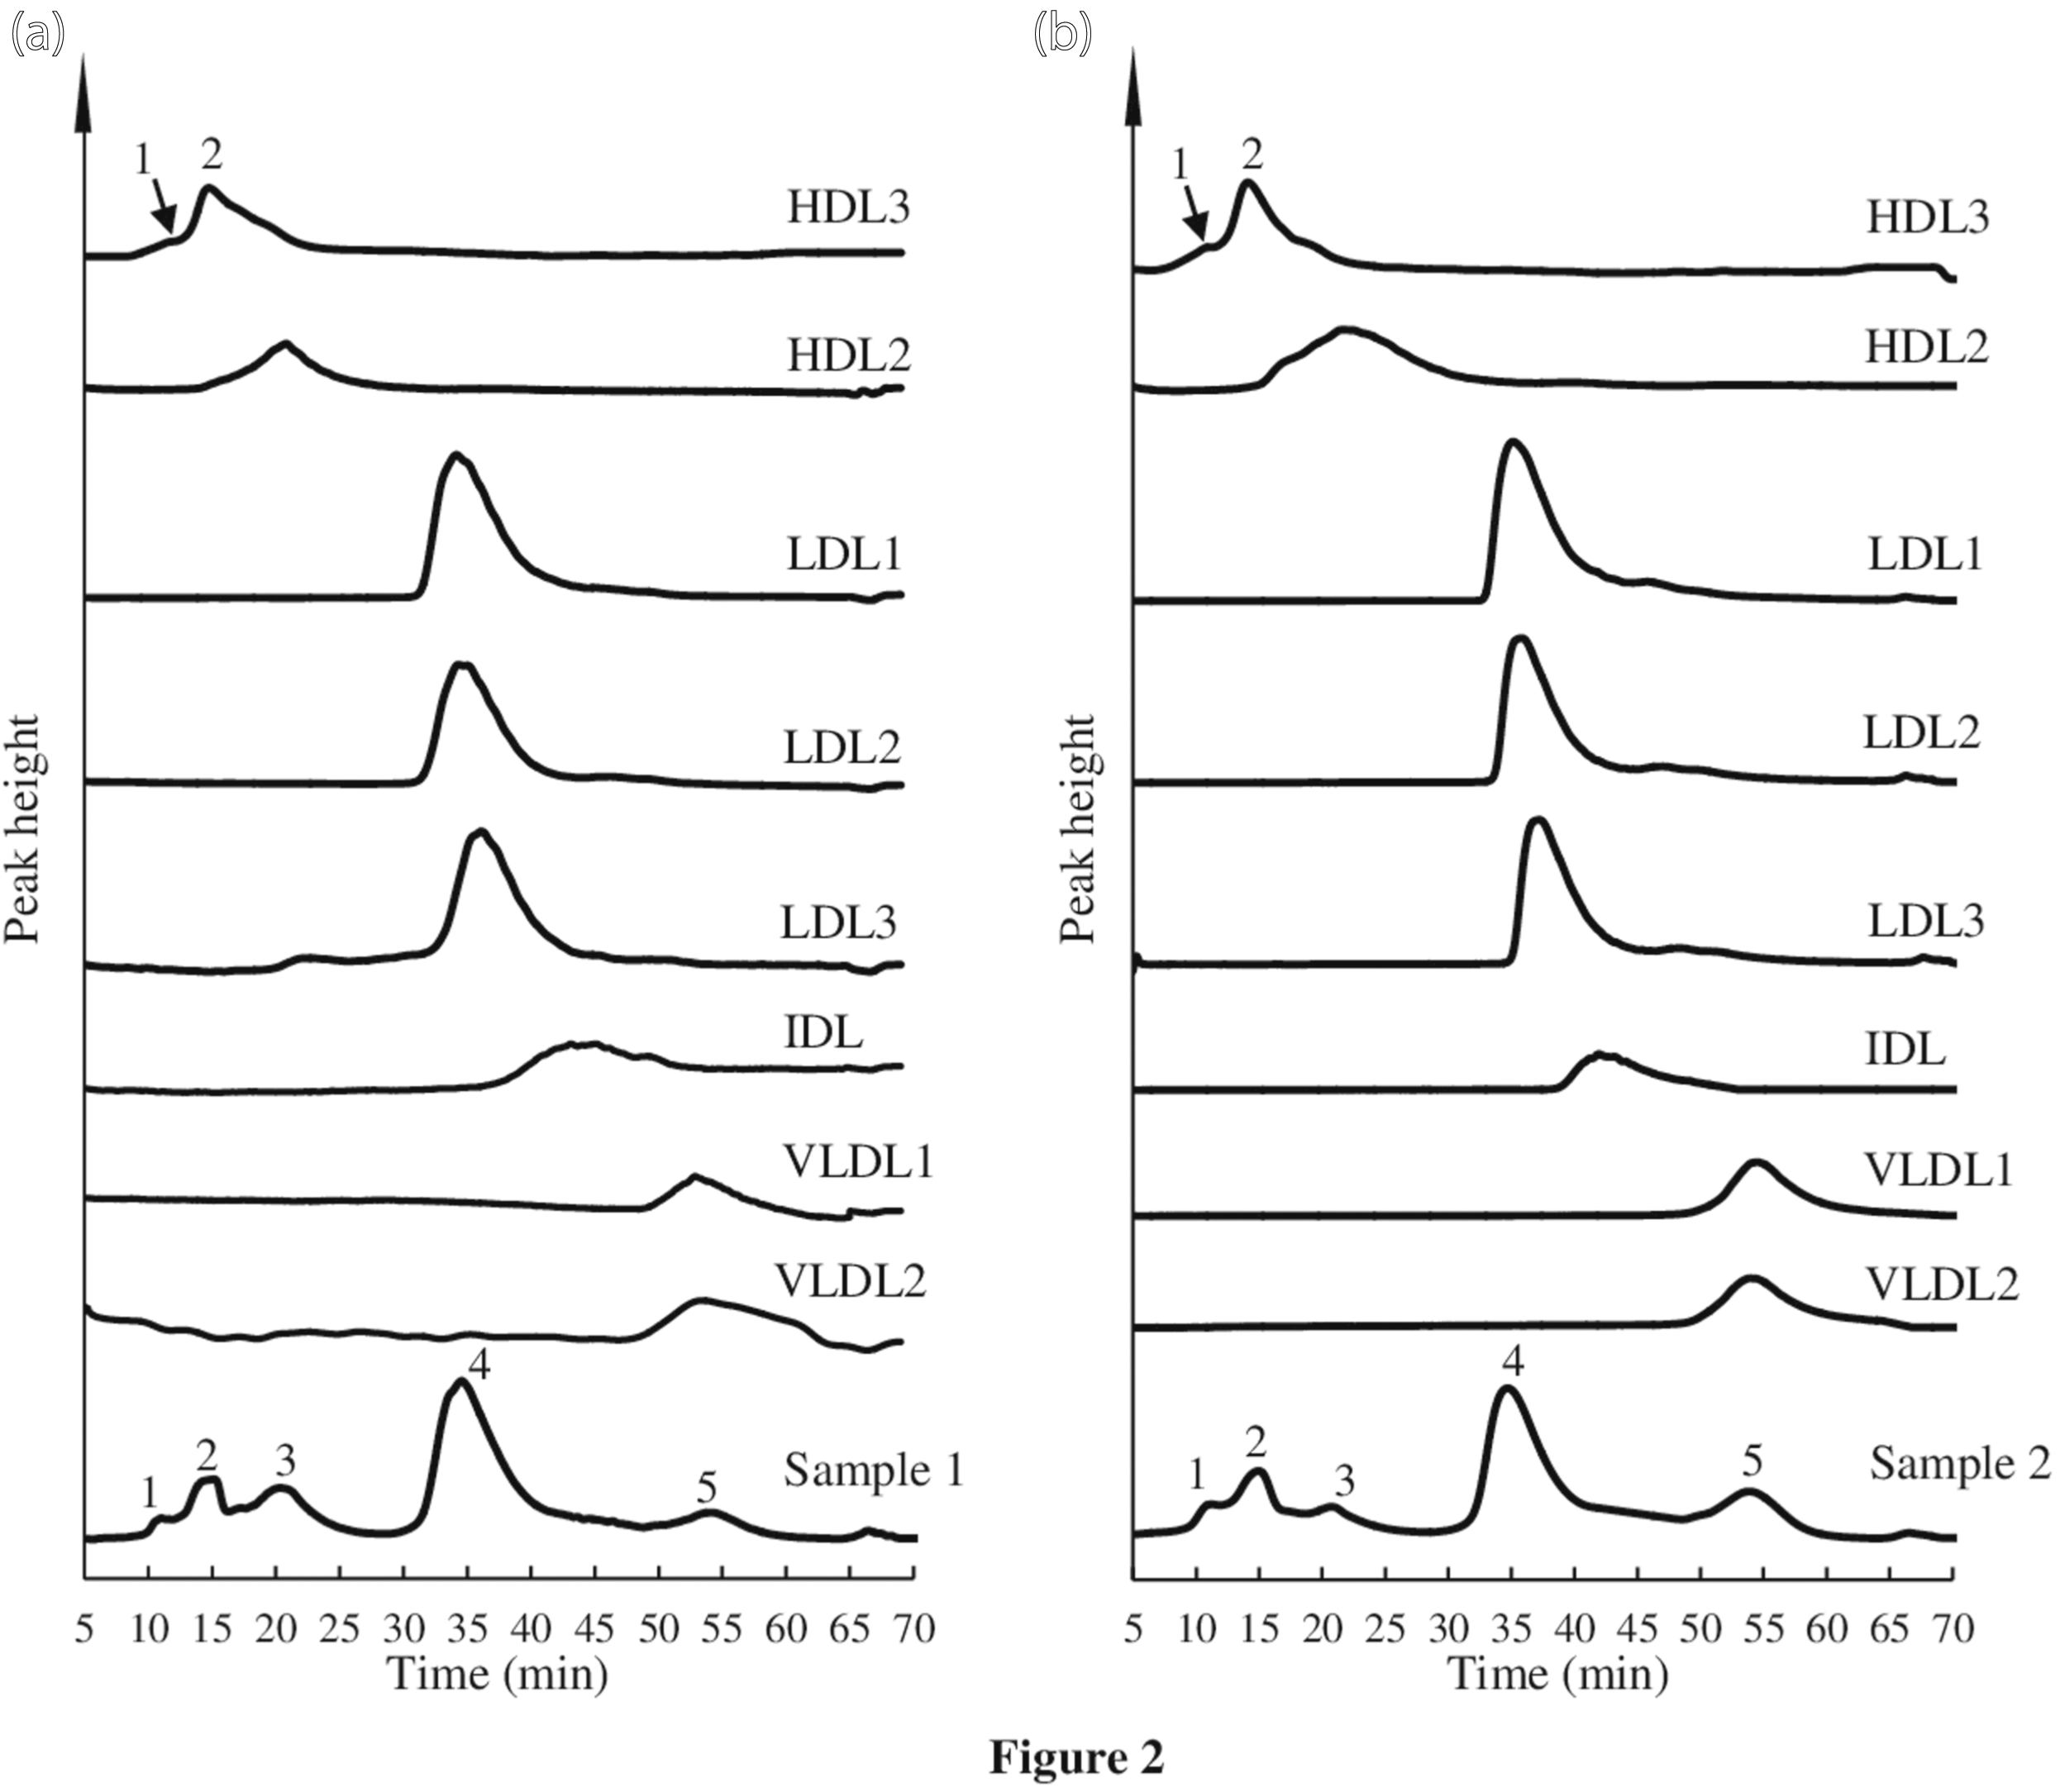
Five peaks were observed in the chromatograms of samples 1 and 2 (Figure 1(a) and 2(a) and 2(b), respectively). The retention times of samples 1 and 2 were 11.15, 15.19, 20.26, 34.69, and 53.99 min, and 11.09, 15.23, 20.98, 34.88, and 53.99 min, respectively. The lipoprotein fractions obtained by ultracentrifugation were analysed to identify the five peaks of the chromatograms of samples 1 and 2. The fractions of HDL3, HDL2, LDL1, LDL2, LDL3, IDL, VLDL1, and VLDL2 of samples 1 and 2 were detected at 14.88, 20.83, 34.17, 34.23, 36.18, 43.10, 52.85, and 52.90 min, and 14.95, 21.53, 35.12, 35.82, 37.07, 42.67, 54.55, and 53.71 min, respectively (Figure 2). The retention times of peaks 2 and 3 in the chromatograms of samples 1 and 2 were similar to those of fractions HDL3 and HDL2, respectively. Peaks 1 of samples 1 and 2 was found at a faster time than that of HDL3 and HDL2. Peaks 1, 2, and 3 were designated as HDL-P1, HDL-P2, and HDL-P3, respectively. The result indicated that HDL3 and HDL2 were the major components of HDL-P2 and HDL-P3, respectively. A small peak in the chromatogram of HDL3 fraction of samples 1 and 2 was observed before the main peak, and the retention time of peak 1 (HDL-P1) in serum samples 1 and 2 was similar to the elution time of the small peak. The total cholesterol concentrations of HDL-P1, HDL-P2, and HDL-P3, 57.3 and 40.5 mg/dL for samples 1 and 2 were similar to the HDL-C values measured by the homogeneous assay (57 and 44 mg/dL, respectively). The LDL1, LDL2, and LDL3 fractions were eluted in order, and the elution times were very similar. The retention time of peak 4 in the chromatogram of samples 1 and 2 was the similar to those of LDL fractions. The major component of peak 4 was LDL. Peak 4 in the chromatogram of sample 1 had two shoulder-peaks before and after the top of peak 4. Therefore, we assumed that LDL may be divided into three subclasses and attempted to separate them using the absolute value of the first derivative of chromatographic absorbance. The divided points of the shoulder peaks were decided by the time of valley bottom in the absolute value of the first derivative. Figure 1(b) shows the chromatogram and absolute value of the first derivative of LDL subclasses in sample 1. Tailing was observed in the LDL peak, and the IDL fraction was eluted at this tailing position (Figure 2). However, IDL did not appear as a peak in the chromatogram of the serum samples. These results indicated that peak 4 contained LDL and IDL. The LDL subclasses in peak 4 were designated LDL-P1, LDL-P2, and LDL-P3. The IDL fraction was thought to be included in LDL-P3. VLDL1 and VLDL2 were eluted at a time similar to that of peak 5 in the chromatogram of samples 1 and 2. The result indicated that VLDL1 and VLDL2 were present in the VLDL peak. We separated the three HDL subclasses, three LDL subclasses, and one VLDL using AEX-HPLC with a linear concentration gradient of NaClO4. Chromatogram of healthy sample and gradient pattern. (a): Chromatogram of sample one and gradient pattern of changes in NaClO4 concentration are indicated by solid and dotted lines, respectively. The times of gradient pattern in Supplemental Table 1 were delayed by 4.5 min taking account of the volume of stainless-steel tube between the pump and column and the Teflon tube reactor. The retention times of HDL-P1, HDL-P2, HDL-P3, LDL (LDL-P2), and VLDL were 11.15, 15.19, 20.26, 34.69, and 53.99 min, respectively. (b): Chromatogram showing the range between 31–38 min (A) and the absolute value of the first derivative of chromatographic absorbance are indicated by solid and dotted lines, respectively. The three LDL subclasses were divided by two vertical lines. The vertical lines are defined by derivative values. The relation time of LDL peak top was 34.69 min. LDL-P1, LDL-P2, and LDL-P3 were divided by the two vertical lines at 34.03 and 35.52 min. Chromatogram of samples 1 and 2, and the lipoprotein fractions obtained by ultracentrifugation. (a): Retention times of peaks 1 and 2 of HDL3, HDL2, LDL1, LDL2, LDL3, IDL, VLDL1, and VLDL2 were 11.42, 14.75, 20.83, 34.17, 34.23, 36.18, 43.10, 52.85, and 52.90 min, respectively. Retention times of sample 1 are shown in Figure 1. Peaks 1, 2, 3, 4, and 5 in sample 1 corresponded to HDL-P1, HDL-P2, HDL-P3, LDL (LDL-P2), and VLDL, respectively. (b): Retention times of peaks 1 and 2 of HDL3, HDL2, LDL1, LDL2, LDL3, IDL, VLDL1 and VLDL2 were 11.77, 14.95, 21.53, 35.12, 35.82, 37.07, 42.96, 54.55 and 53.71 min, respectively. Peaks 1, 2, 3, 4, and 5 in sample 2 corresponded to HDL-P1, HDL-P2, HDL-P3, LDL (LDL-P2), and VLDL, respectively. Retention times of HDL-P1, HDL-P2, HDL-P3, LDL (LDL-P2), and VLDL were 11.09, 15.23, 20.98, 34.88, and 53.99 min, respectively.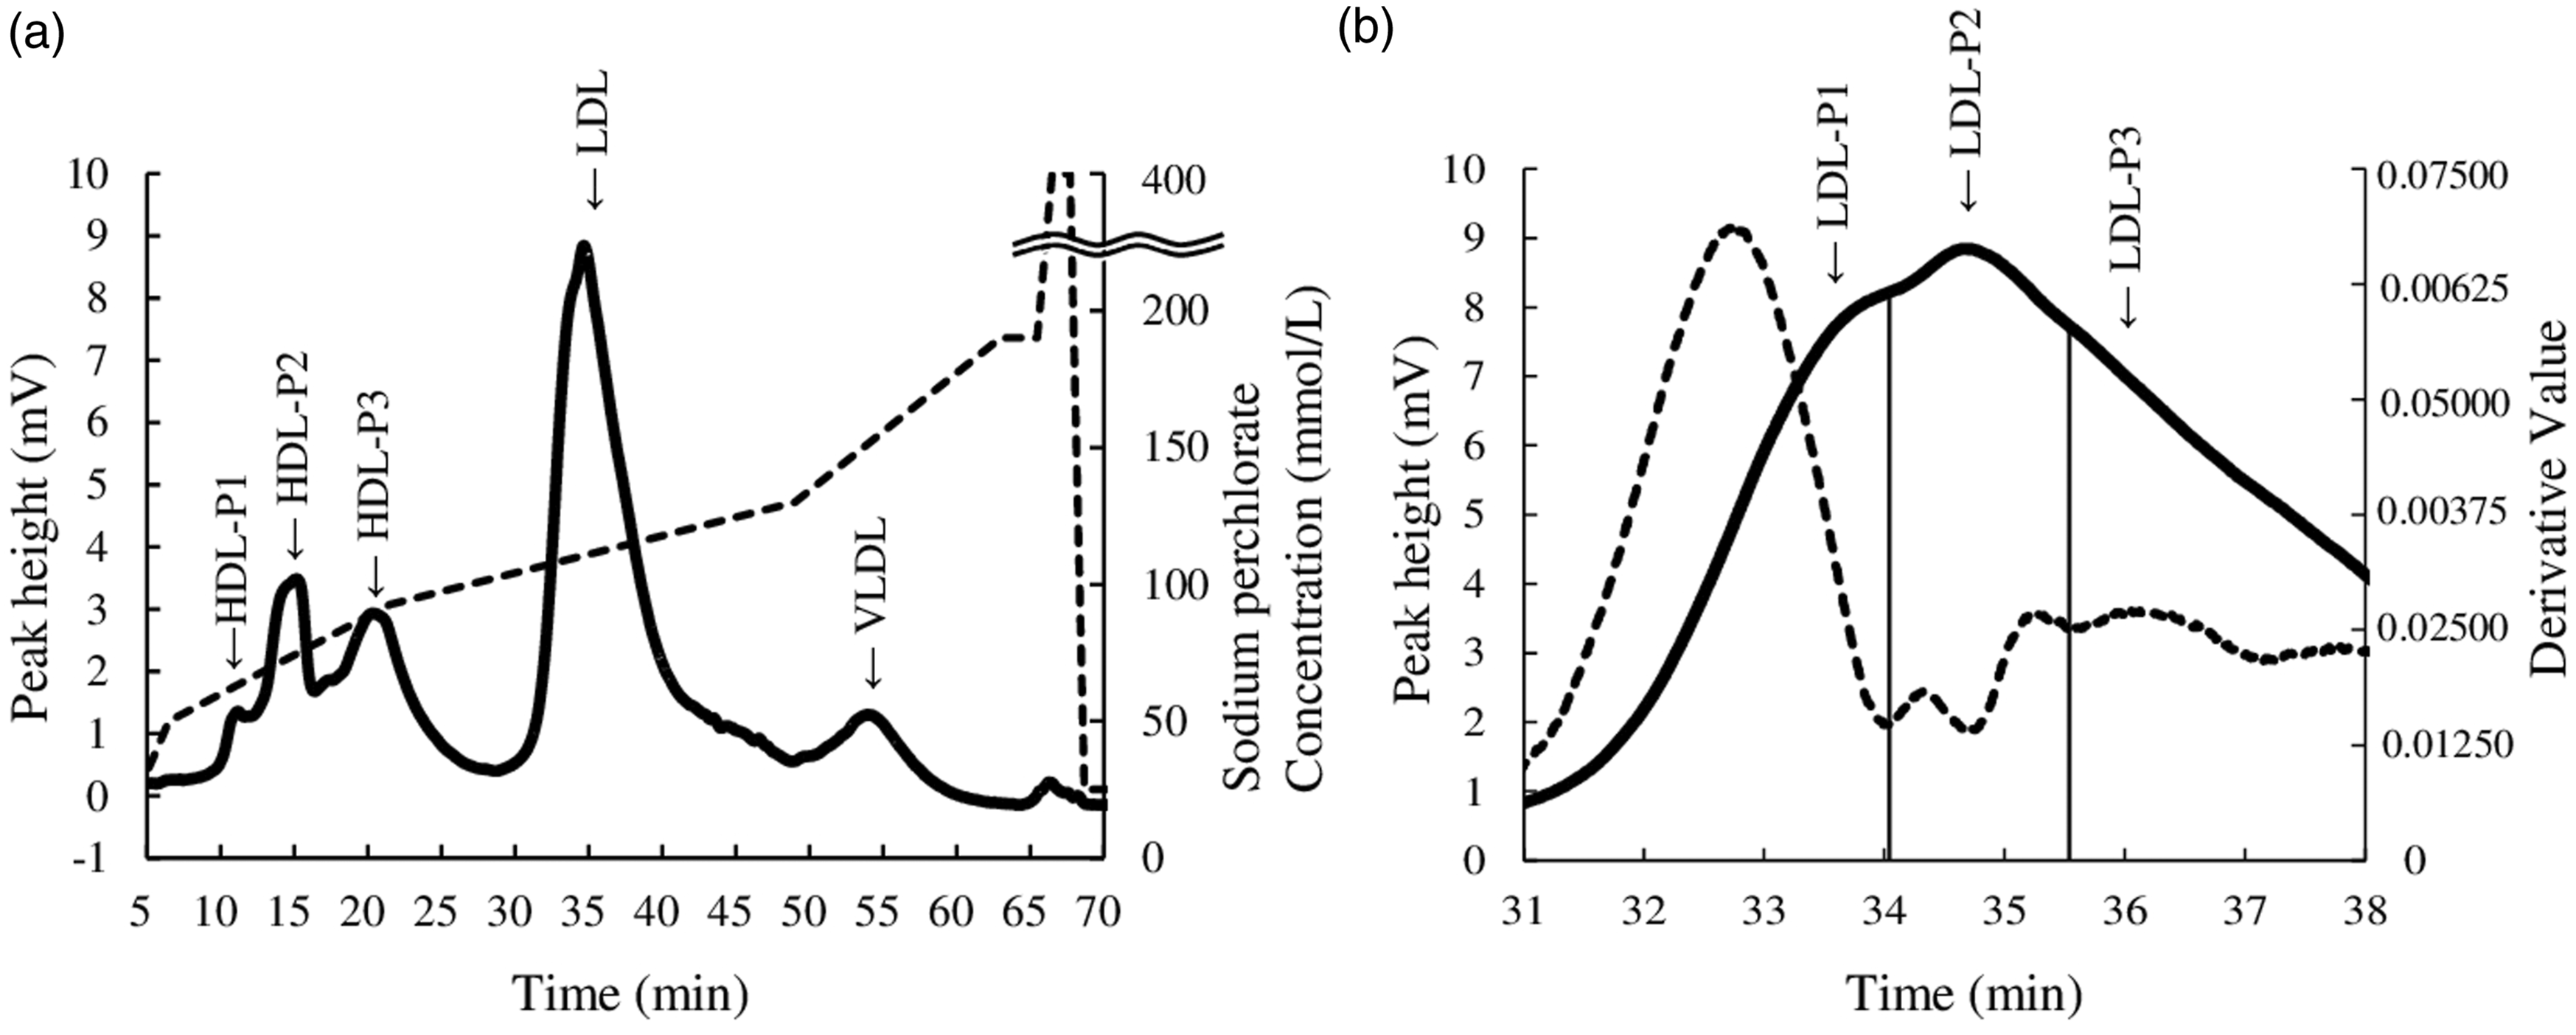
A commercially purified Lp(a) sample was analysed to confirm the eluted time. The retention time of Lp(a) was 65.58 min (Supplemental figure 1). The Lp(a) peak was eluted after the retention time of VLDL, and the time was during the column washing process. Previously, we observed the Lp(a) peak after the elution of VLDL. 19
Linearity and precision of AEX-HPLC
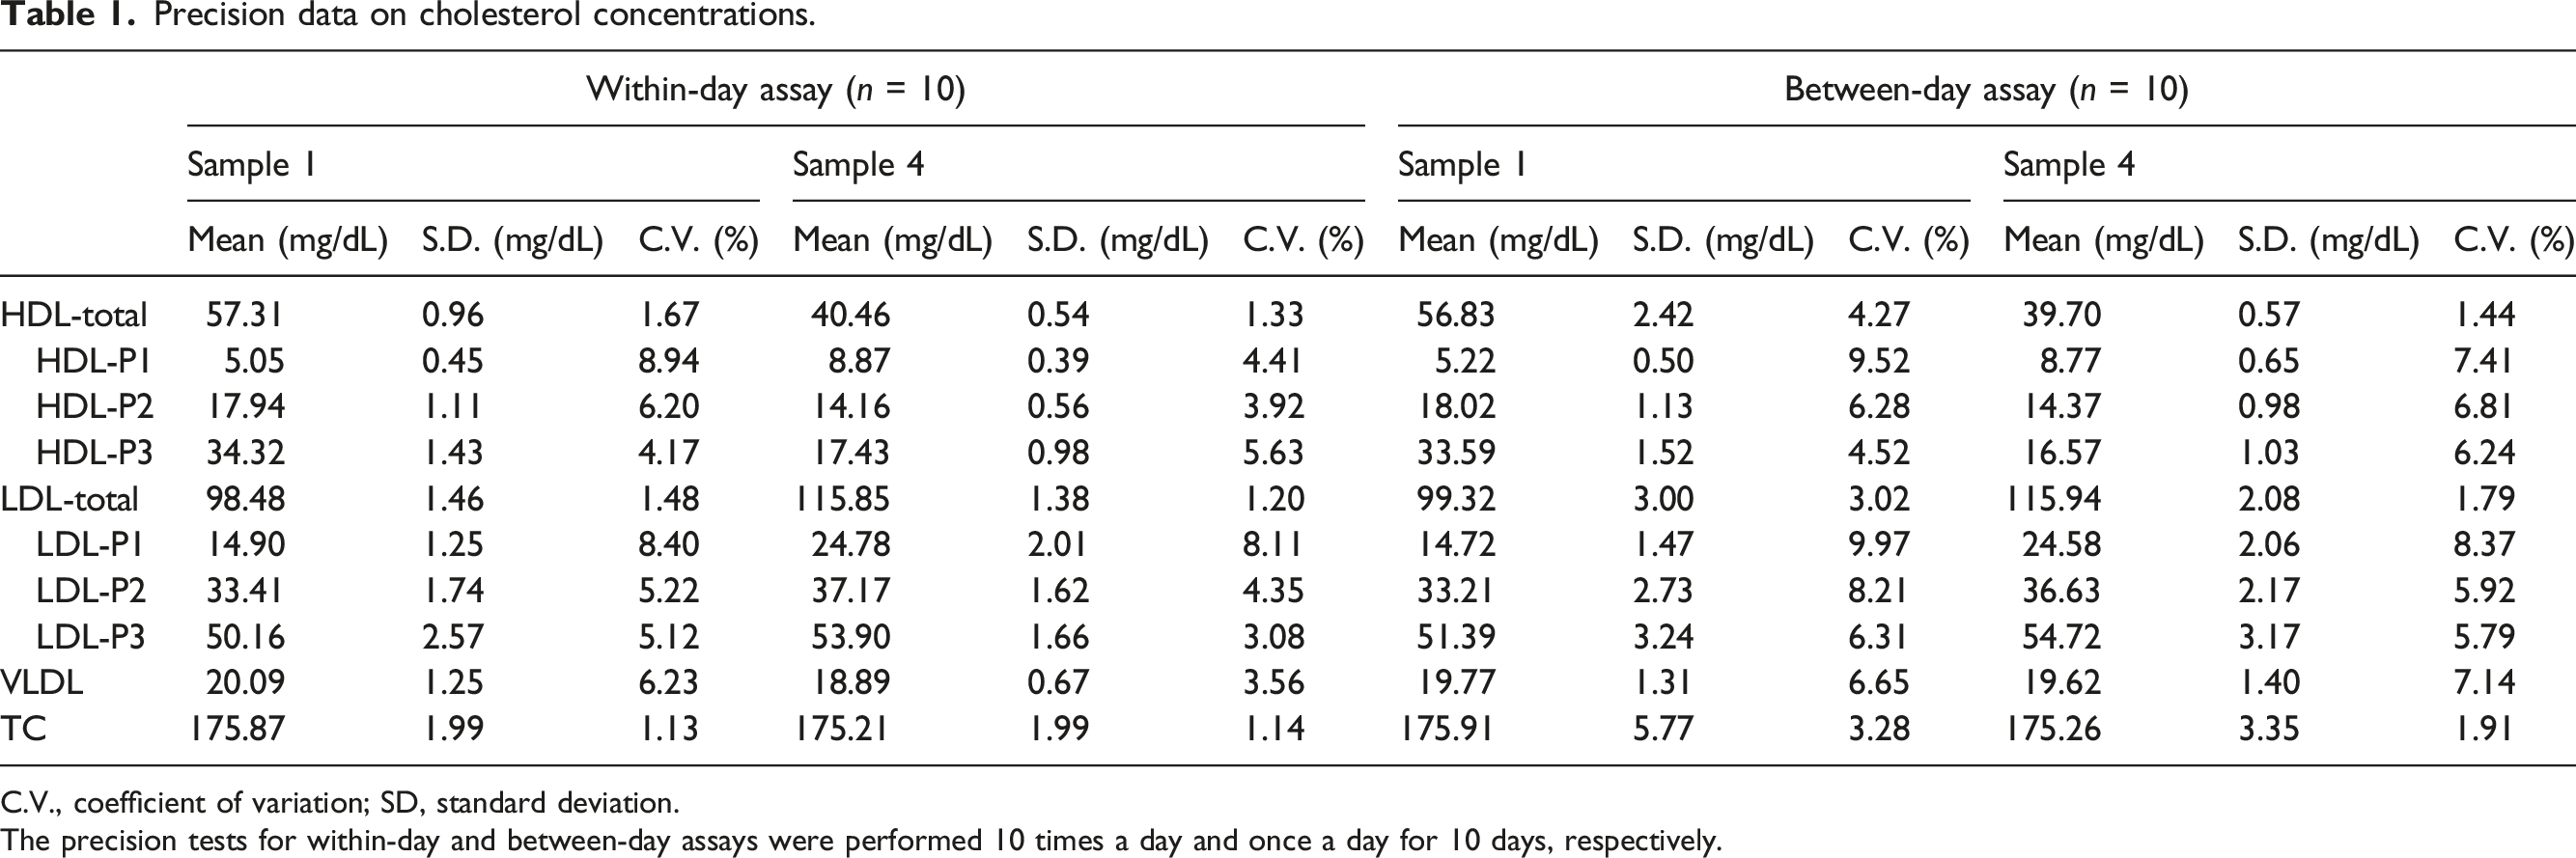
Figure 3(a) shows the chromatogram of sample 3. The chromatographic pattern was similar to those of samples 1 and 2. Linearity was confirmed by the relationship between peak areas of each lipoprotein class or subclass and dilution ratio in the range of up to 7.5 times. Figure 3(b) and Supplemental Table 2 show the linearity with dilution ratios of serum sample 3. Linear relationships were found between the peak areas and the dilution ratios of the major lipoprotein classes, HDL-total, LDL-total, and VLDL (Figure 3b). In the HDL subclasses of HDL-P1, HDL-P2, and HDL-P3, linear relationships were observed between the peak areas and dilution ratios (Figure 3b). Moreover, linearity was confirmed for the LDL subclasses, LDL-P1, LDL-P2, and LDL-P3, which were separated depending on derivative values, and linear relationships were observed (Figure 3b). Linear relationships were obtained with dilution ratios in the range of up to 7.5 times, and an injection volume of 7.1 μL serum was used. The values of within-day and between-day assay coefficients of variation (C.V.) of the cholesterol concentration of each lipoprotein class and subclass were ≤8.94 and 9.97%, respectively (Table 1). Linearity of peak areas in lipoprotein classes and subclasses. (a): Sample 3 was analysed, and the injection volume was 4.7 μL. The retention times of HDL-P1, HDL-P2, HDL-P3, LDL-P1, LDL-P2, LDL-P3 and VLDL were 10.97, 12.72, 20.25, 34.55, 35.38, 37.11, and 53.59 min, respectively. (b): The data are peak areas of lipoprotein classes and subclasses. Sample 3 was diluted up to 7.5 times, and 7.1-μL aliquots were injected. Precision data on cholesterol concentrations. C.V., coefficient of variation; SD, standard deviation. The precision tests for within-day and between-day assays were performed 10 times a day and once a day for 10 days, respectively.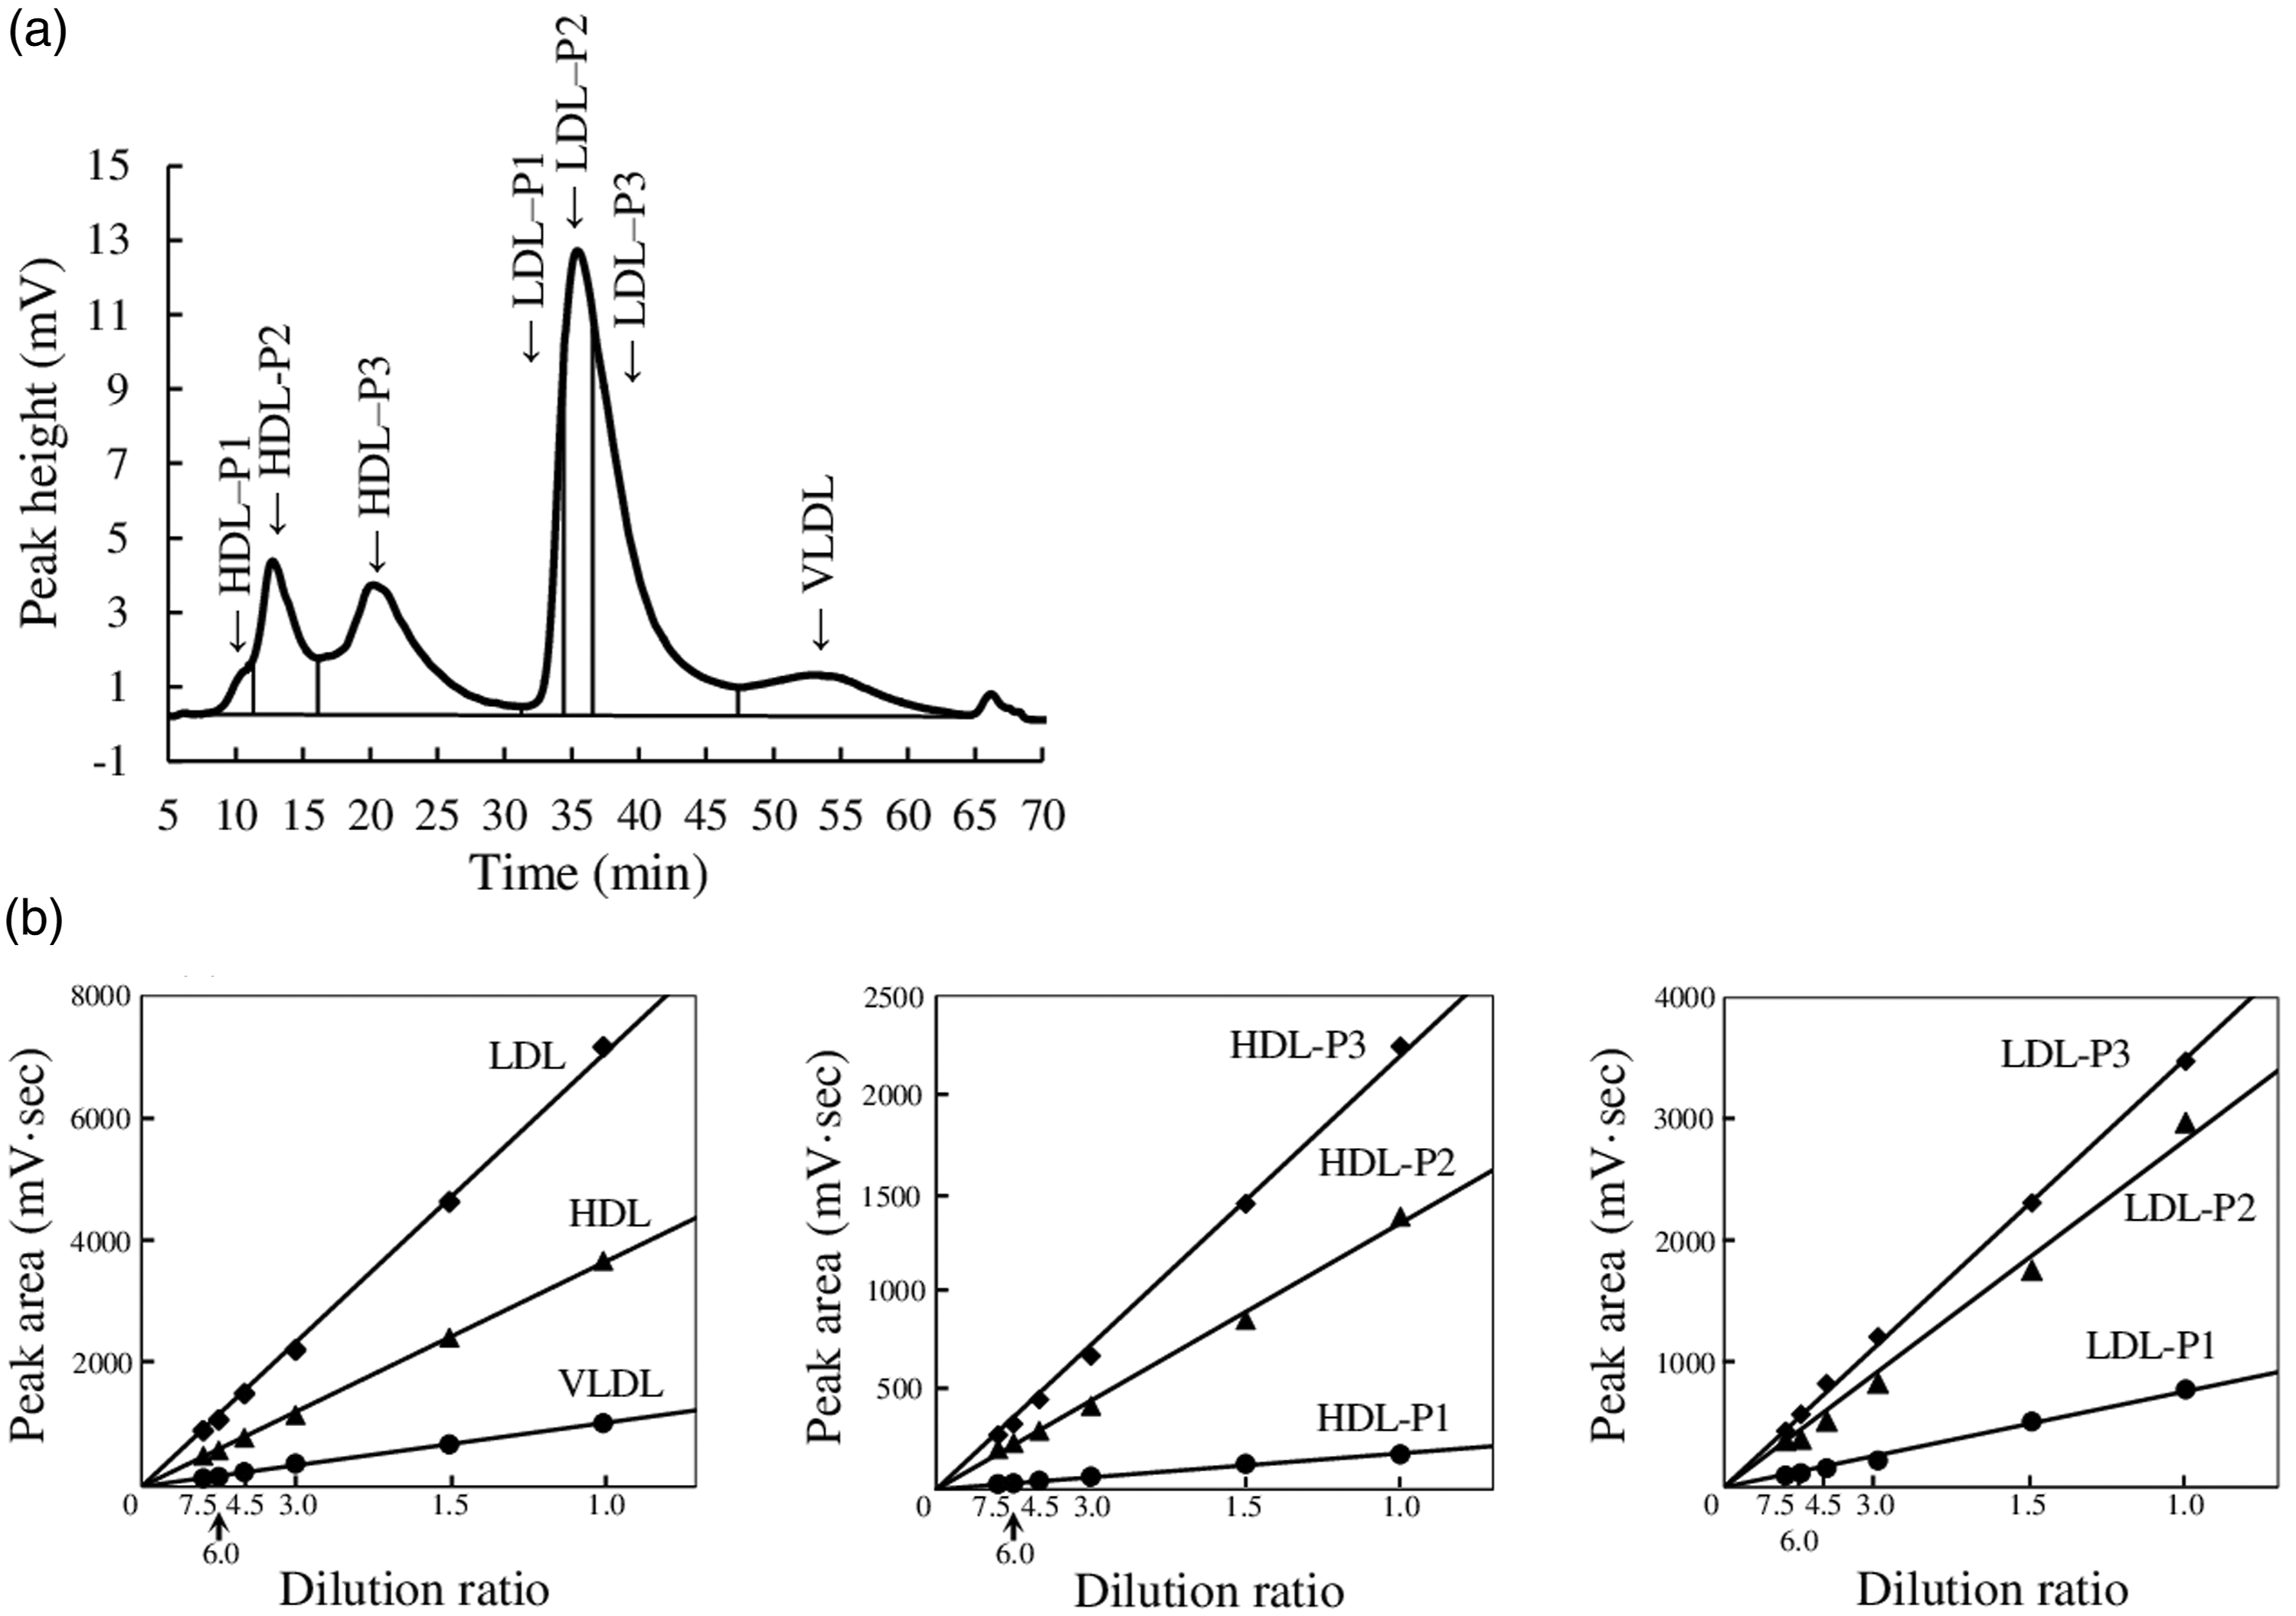
The considerable linearity of relationships between cholesterol concentration of each lipoprotein class and subclass, and dilution ratio, in addition to the high precision, indicated that the cholesterol levels of each lipoprotein class and subclass in serum can be reliably determined using AEX-HPLC.
Comparison between cholesterol levels of lipoprotein subclasses measured by AEX-HPLC and ox-LDL in diabetic patients
Clinical and biochemical characteristics and cholesterol concentrations in lipoprotein classes in studied patients with type 2 diabetes.
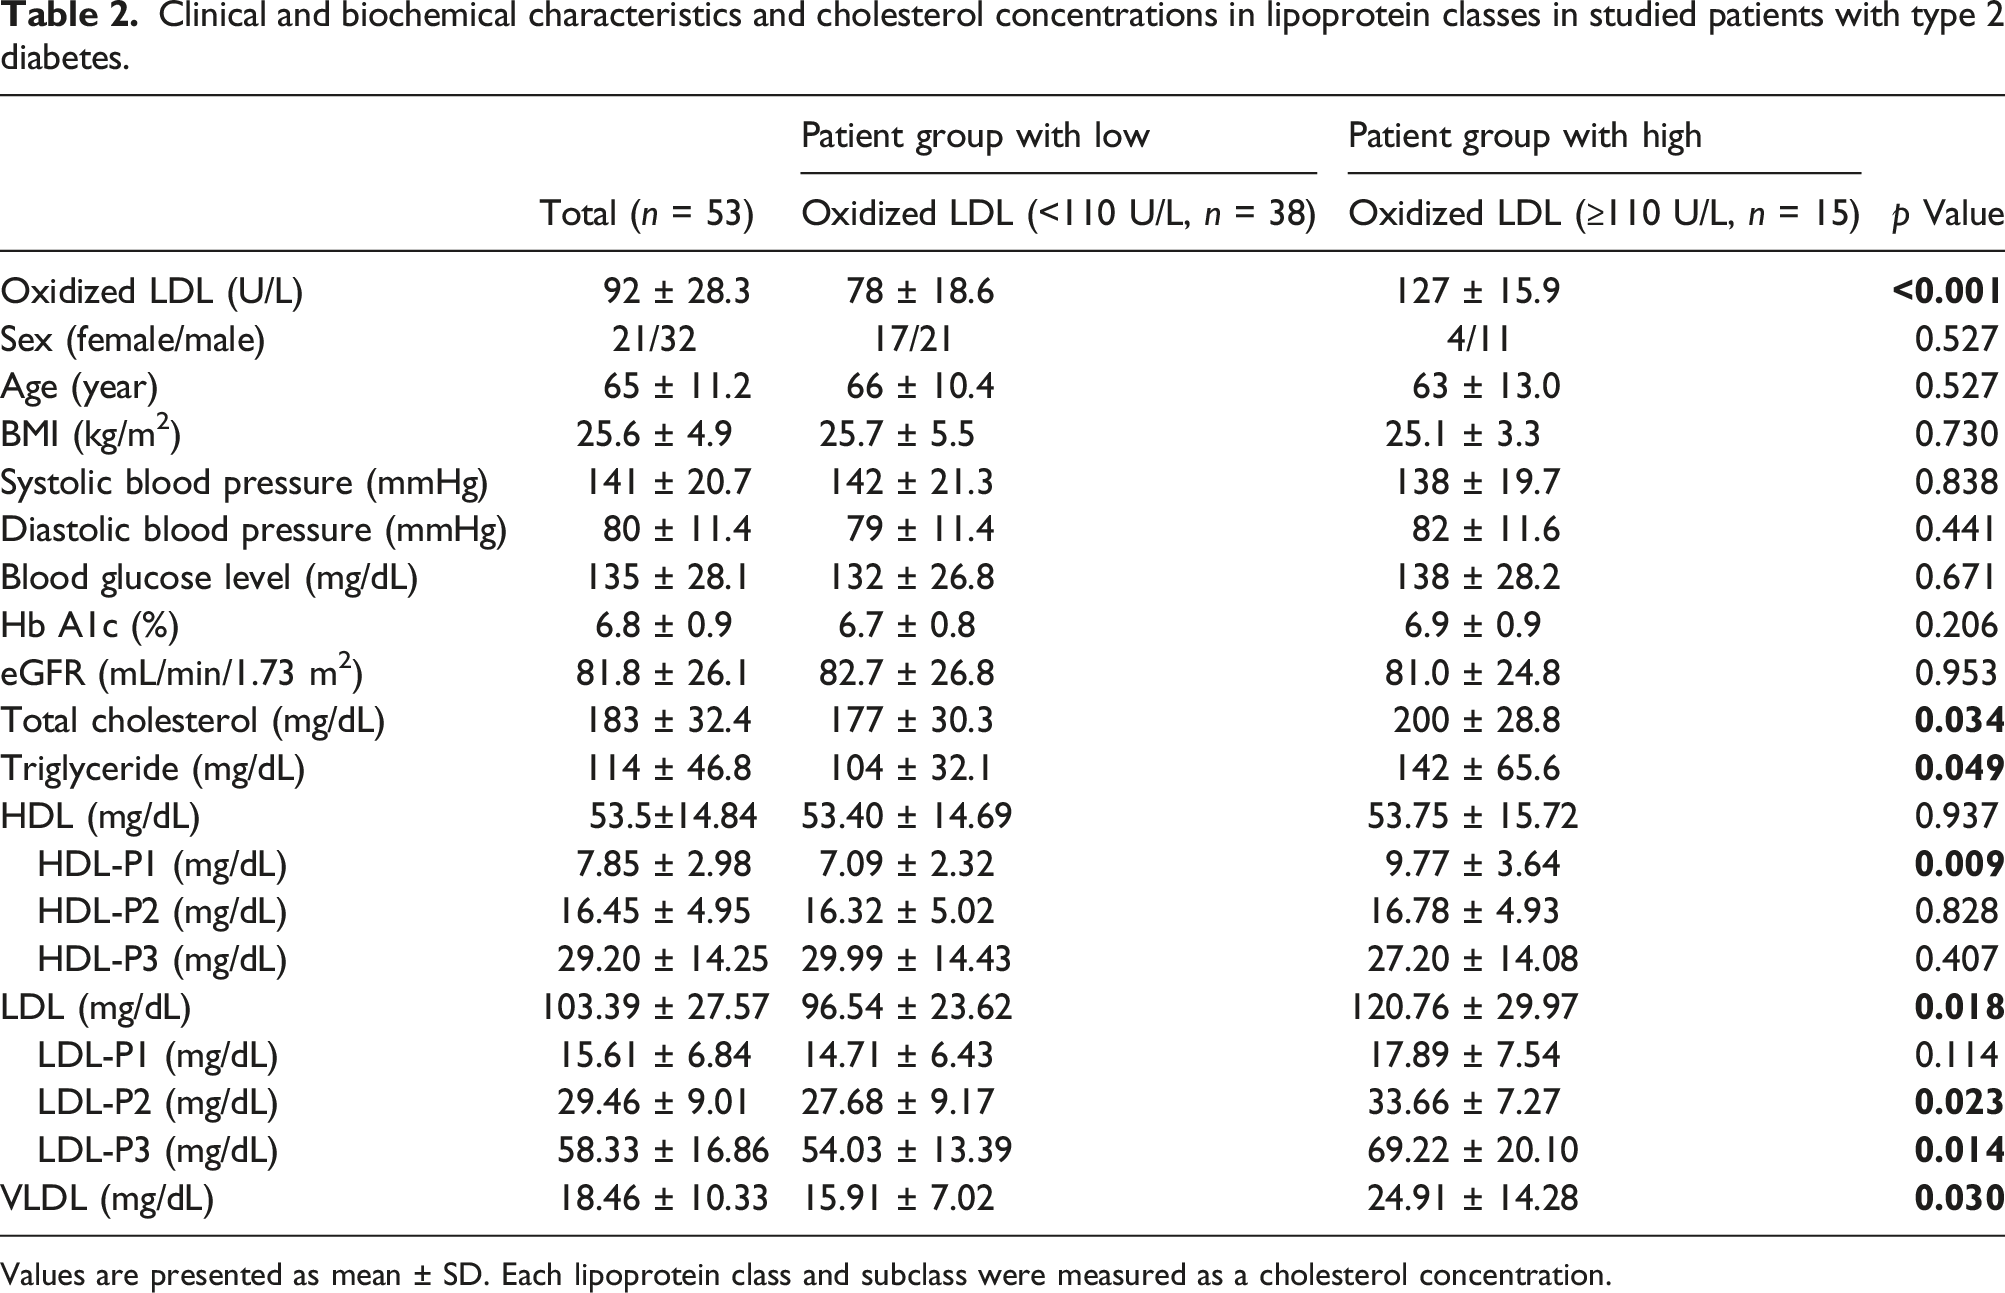
Values are presented as mean ± SD. Each lipoprotein class and subclass were measured as a cholesterol concentration.
A comparison of ox-LDL and cholesterol levels in lipoprotein classes and subclasses indicated significant differences in LDL-total (p < 0.001), VLDL (p = 0.003), HDL-P1 (p = 0.002), LDL-P2 (p = 0.004), and LDL-P3 (p < 0.001) (Figure 4(b)–(d), (h), and (i), respectively). Correlation between cholesterol concentrations of lipoprotein classes and subclasses and oxidized LDL in serum of patients with type 2 diabetes. (a–i) show the data of HDL-total, LDL-total, VLDL-total, HDL-P1, HDL-P2, HDL-P3, LDL-P1, LDL-P2, and LDL-P3, respectively. Circles in the figure indicate equiprobable ellipses.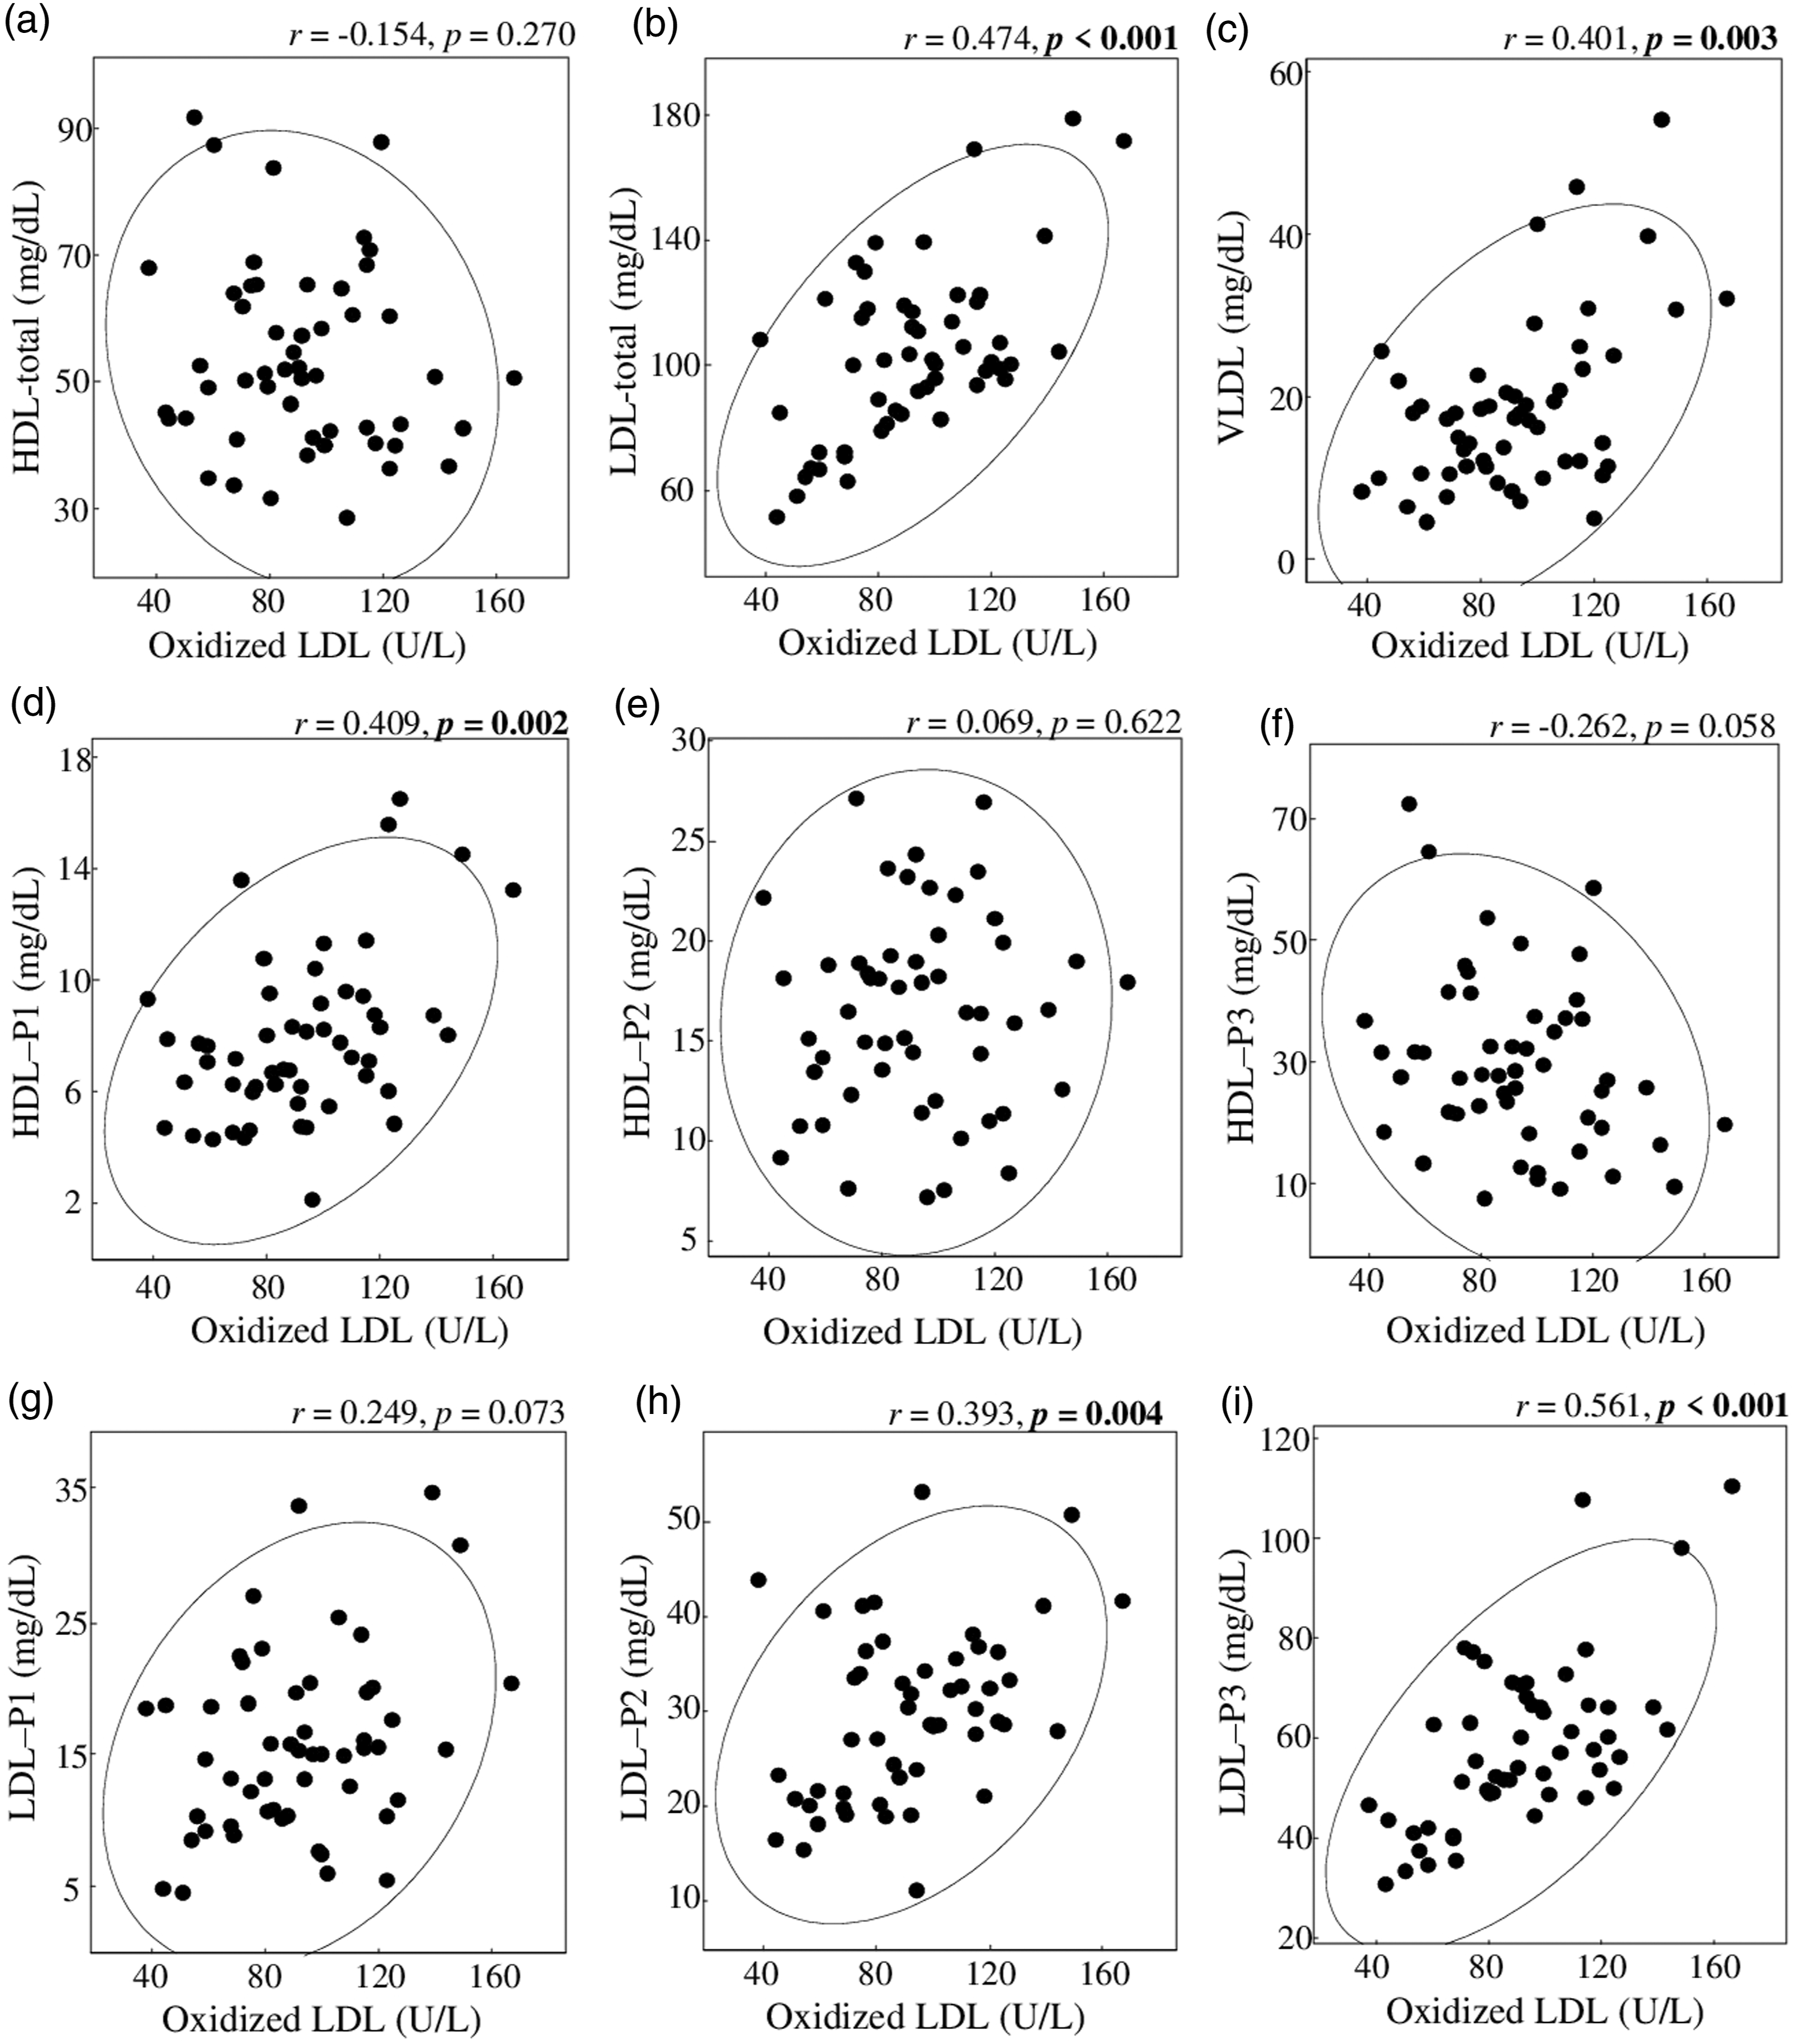
Discussion
We showed that three peaks of HDL subclasses, three peaks of LDL subclasses, and one VLDL peak in serum samples could be separated by AEX-HPLC with a linear concentration gradient of NaClO4, and LDL subclasses could be divided using the absolute value of the first derivative of chromatographic absorbance. Derivative chromatograms are used to improve the sensitivity or specificity of thermogravimetric analysis, polarography, and high-performance liquid chromatography (HPLC).24,25
The retention times of peaks 2 (HDL-P2) and 3 (HDL-P3) in the chromatogram were similar to the elution times of HDL3 and HDL2 fractions separated by ultracentrifugation, respectively. The result indicated that HDL3 and HDL2 were the major components of HDL-P2 and HDL-P3, respectively. The retention times of peak 1 (HDL-P1) in the chromatogram were similar to the elution times of a small peak prior to the main peak of HDL3 fraction. We thought that the main component of HDL-P1 was a part of HDL3, which was separated by ultracentrifugation. Peak 4 (LDL) in the chromatograms of serum samples showed two shoulder peaks before and after the top of LDL peak. The two shoulder peaks of LDL could be divided into three subclasses based on the absolute value of the first derivative of the chromatographic absorbance. We assumed that the different components of the three LDL subclasses remained to be examined.
The HDL and LDL subclasses could not be separated by the density-gradient ultracentrifugation and were divided with Gaussian curves for each lipoprotein subclass.26,27 The reproducibility (within-rotor C.V.) of the HDL and LDL subclasses was 0.9–6.1% and 1.9–8.3%, respectively. Using NMR, the lipoprotein subclasses could not be separated, and they were divided using the spectra of reference standards for lipoprotein subclasses isolated by ultracentrifugation. 17 The reproducibility (between-day assay C.V.) was 6–22%. Using ion mobility analysis, HDL was separated into two subclasses, whereas the LDL subclasses could not be separated. 28 The LDL subclasses were divided into four categories based on particle sizes obtained by ion mobility analysis. The reproducibility (within-day assay and between-day assay C.V.) of HDL and LDL subclasses were 5.0–15.7% and 6.7–13.8%, and 9.8–17.6% and 9.1–16.1%, respectively. The HDL and LDL subclasses could not be separated using gel-permeation chromatography, and they were divided by determining the number, position, and width of Gaussian curves of the lipoprotein subclasses. 29 The reproducibility (within-day assay C.V.) was 0.37–4.25%. We identified three HDL subclasses separated using AEX-HPLC, and one LDL peak with two shoulder peaks before and after the top (Figure 1(a)). The LDL peak was divided into three subclasses based on the absolute value of the first derivative of the chromatographic absorbance (Figure 1(b)). The reproducibility (within-day and between-day assays C.V.) of HDL and LDL subclasses were 3.92–8.94% and 4.52–9.52%, and 4.32–8.40% and 5.92–9.97%, respectively (Table 1). Serum sample 3 (TC, 195 mg/dL; HDL-C, 64 mg/dL; LDL-C, 110 mg/dL; and VLDL-C, 21 mg/dL as subtracting HDL and LDL from TC) was diluted up to 7.5 times for linearity test. Therefore, we thought that HDL-C, LDL-C, and VLDL-cholesterol could be measured in the ranges of 4544–606, 7810–1041, and 1491–199 ng, respectively, in the injected sample using AEX-HPLC.
Two HDL subclasses, HDL2 and HDL3, could be separated by ultracentrifugation. Moreover six subclasses, including HDL2a, HDL2b, HDL3a, HDL3b, HDL3c, and preβ1-HDL, could be separated by non-denaturing polyacrylamide gradient gel electrophoresis, and a number of HDL subclasses containing apolipoprotein A1, α-1, α-2, α-3, α-4, preβ1a, preβ1b, preβ2a, preβ2b, and preβ2c, could be separated by non-denaturing two-dimensional polyacrylamide gradient gel electrophoresis. 30 The association between two HDL subclasses, HDL2 and HDL3, and CHD risk have been evaluated in some studies. Joshi et al. reported that smaller, denser HDL3-cholesterol was primarily responsible for an inverse association between HDL-C and CHD incidence with a vertical auto profile (VAP) method using ultracentrifugation in Jackson Heart and Framingham Offspring Cohort Studies, and patients with CHD incidence included significantly more number of diabetic individuals than did those without CHD incidence. 9 Tiozzo et al. reported that HDL2-cholesterol and HDL-C were inversely associated with mean carotid intima-media thickness (cIMT), a marker of subclinical atherosclerosis, and it was remarkable in diabetic patients, but not HDL3-cholseterol using a sequential precipitation method by heparin-manganese and dextran sulphate. 31 Notsu et al. reported that HDL3-cholesterol was inversely associated with maximum cIMT, but not HDL2-cholseterol and HDL-C with a homogeneous method using polyanions and magnesium, and haemoglobin A1c level was positively associated with maximum cIMT. 32 Which HDL2 and HDL3 are associated with the risk of atherosclerotic diseases has been controversial. In this study we found three HDL subclasses (HDL-P1, HDL-P2, and HDL-P3) in the chromatogram of AEX-HPLC with a linear concentration gradient of NaClO4, and the major components of HDL-P2 and HDL-P3 were HDL3 and HDL2, respectively. HDL-P1 level was positively correlated to ox-LDL level, which is known to promote coronary atherosclerosis in diabetic patients.33,34 We need to determine the main components of HDL-P1.
Krauss et al. showed that LDL was divided into four or seven subclasses by equilibrium density ultracentrifugation using sodium bromide solution and electrophoresis using 2–16% polyacrylamide gradient gel, respectively. 35 Davies et al. showed that LDL was divided into four or three subclasses by density-gradient ultracentrifugation with iodixanol solution and the electrophoresis using 2–16% polyacrylamide gradient gel, respectively. 36 In this study, we found three LDL subclasses; a shoulder peak eluted fast, followed by the main peak, and another shoulder peak eluted late; and these peaks were divided using the absolute value of the first derivative chromatogram. We previously showed the later-shift elution time of LDL from a column by oxidation with copper ion using AEX-HPLC. 37 Ox-LDL was known to be higher amount in the smaller, denser LDL fraction. 38 In Figure 2, it was indicated that the fractions of LDL1, LDL2, and LDL3 obtained by ultracentrifugation eluted in the order; however, the elution times were highly similar. Therefore, the amounts of ox-LDL in LDL subclasses, LDL-P1, LDL-P2, and LDL-P3, may increase in order. Moreover, among the LDL subclasses, cholesterol levels in LDL-P3 were found to have the highest correlation with ox-LDL levels (Figure 4). However, we assumed that further investigation on the differences of components among the three LDL subclasses is needed.
We did not find an IDL peak in the chromatogram of serum samples using AEX-HPLC. The IDL fraction obtained by ultracentrifugation was eluted at the tail position of the LDL peak in the chromatogram of serum samples. We previously reported that IDL-cholesterol levels in males who underwent medical-check examination were low (7.8 ± 3.1 mg/dL), using the AEX-HPLC with a step concentration gradient of NaClO4. 39 Tatami et al. reported that patients with CVD were divided into four groups by the severity with coronary angiography, and the highest severity group had high levels of IDL-cholesterol (18.1 ± 11.2 mg/dL). 40 We assumed that the IDL peak might appear in the chromatogram of patients with CVD.
The Lp(a) peak was eluted after the retention time of VLDL, and the time was during the washing process (Supplemental figure 1). We have previously shown that HDL, LDL, IDL, VLDL, CM, and Lp(a) were separated and eluted from a column in order by AEX-HPLC with step concentration gradient of NaClO4. 19 It was also indicated that the Lp(a) levels in 17 healthy subjects and 16 dyslipidemia subjects were protein (0.49 ± 0.60 mg/mL and 0.58 ± 0.42 mg/mL, respectively) and cholesterol (6.78 ± 8.03 mg/mL and 8.21 ± 6.21 mg/mL, respectively). 19 The Lp(a)-cholesterol levels in males without and with CHD, and females without and with CHD were indicated to be 6.96 ± 5.8 and 9.32 ± 7.87, and 7.03 ± 6.43 and 7.71 ± 6.10 mg/dL, respectively, using a lectin-based assay in Framingham Heart Study. 41 The level of Lp(a) is known to be low. Therefore, we assumed that the peak of about 66 min containing Lp(a) in the chromatogram of serum sample 1 (Figure 2) was very small, and quantitative analysis of this peak was not possible.
Malondialdehyde-modified LDL (i.e. ox-LDL) has been found to be associated with the cholesterol levels in small HDL (r = 0.275), large HDL (r = −0.318), LDL (r = 0.692), very small LDL (r = 0.779), small LDL (r = 0.769), VLDL (r = 0.642), large-VLDL (r = 0.556), and medium-VLDL (r = 0.668) in healthy men using gel-permeation chromatography. 42 We indicated that cholesterol levels of HDL-P1, LDL-total, LDL-P3, and VLDL in the patients group with high ox-LDL were significantly higher than those with low ox-LDL (Table 2).
This study has several limitations. First, the major components of HDL-P1 were not indicated. Second, the three LDL subclasses could not be completely separated, and the different components in the subclasses could not be identified. Third, the number of diabetic patients was small.
Conclusion
This study showed that three HDL and three LDL subclasses in human serum could be separated by AEX-HPLC with a linear concentration gradient of NaClO4 using the absolute value of the first derivative of chromatographic absorbance for the division of LDL subclasses. We validated AEX-HPLC by examining its linearity and precision. Furthermore, the cholesterol levels of HDL-P1 and LDL-P3 in diabetic patients with high ox-LDL levels were significantly higher than those in patients with low ox-LDL levels. These results suggest that this method may be highly suitable as an assay for clinical assessment of lipoprotein subclasses.
Supplemental Material
Supplemental Material - Measurement of cholesterol levels of lipoprotein subclasses in human serum using anion-exchange high-performance liquid chromatography with a linear concentration gradient of sodium perchlorate
Supplemental Material for Measurement of cholesterol levels of lipoprotein subclasses in human serum using anion-exchange high-performance liquid chromatography with a linear concentration gradient of sodium perchlorate by Riku Ito, Daisuke Manita, Hidekatsu Yanai and Yuji Hirowatari in Annals of Clinical Biochemistry
Footnotes
Acknowledgements
We thank Ms Riko Omura, Ms Kana Ogawa, and Ms Miku Mugiyama for technical assistance.
Declaration of conflicting interests
The author(s) declared the following potential conflicts of interest with respect to the research, authorship, and/or publication of this article: DM is an employee of Tosoh Co. (Tokyo, Japan).
Funding
The author(s) disclosed receipt of the following financial support for the research, authorship, and/or publication of this article: This work was supported by the National Center for Global Health and Medicine Research Fund (to HY) and Tosoh Research Fund (to DM and YH).
Ethical approval
This study has been approved by the research ethics committee of National Center for Global Health and Medicine, No. NCGM-G-003443-00.
Guarantor
YH.
Contributorship
YH and HY designed and conducted this study. RI and DM measured the samples, and performed statistical analysis. RI and YH wrote the first draft of the manuscript, and HY and DM revised it. All the authors approved the final version of manuscript.
Supplemental material
Supplemental material for this article is available online.
References
Supplementary Material
Please find the following supplemental material available below.
For Open Access articles published under a Creative Commons License, all supplemental material carries the same license as the article it is associated with.
For non-Open Access articles published, all supplemental material carries a non-exclusive license, and permission requests for re-use of supplemental material or any part of supplemental material shall be sent directly to the copyright owner as specified in the copyright notice associated with the article.