
Abstract
Background
Non-alcoholic fatty liver disease is a frequent ailment with known complications, including those within the cardiovascular system. Associations between several indicators of high-density lipoprotein metabolism and function with clinical and laboratory parameters for the assessment of fatty liver index, a surrogate marker of non-alcoholic fatty liver disease, were evaluated.
Methods
The study comprised 130 patients classified according to fatty liver index values: fatty liver index < 30, fatty liver index 30–59 (the intermediate group) and fatty liver index ⩾ 60. Lecithin–cholesterol acyltransferase and cholesteryl ester transfer protein activities were determined. Paraoxonase 1 concentration and its activity, paraoxonase 3 concentration and high-density lipoprotein subclass distribution were assessed.
Results
Increased lecithin–cholesterol acyltransferase activity correlated with increased fatty liver index (P < 0.001). Paraoxonase 3 concentration was lower in the fatty liver index ⩾ 60 group compared with the fatty liver index < 30 group (P < 0.05). Cholesteryl ester transfer protein activity, paraoxonase 1 concentration and its activity did not significantly differ across the fatty liver index groups. The relative proportion of small-sized high-density lipoprotein 3 subclass was higher in the fatty liver index ⩾ 60 group compared with the other two fatty liver index groups (P < 0.01). Lecithin–cholesterol acyltransferase activity positively associated with the fatty liver index ⩾ 60 group and remained significant after adjustment for other potential confounders. Only the triglyceride concentration remained significantly associated with lecithin–cholesterol acyltransferase activity when the parameters that constitute the fatty liver index equation were examined.
Conclusions
Higher lecithin–cholesterol acyltransferase activity is associated with elevated fatty liver index values. Significant independent association between triglycerides and lecithin–cholesterol acyltransferase activity might indicate a role of hypertriglyceridaemia in alterations of lecithin–cholesterol acyltransferase activity in individuals with elevated fatty liver index.
Keywords
Introduction
Non-alcoholic fatty liver disease (NAFLD) is the most common liver disorder in the developed world. 1 The condition covers a spectrum of manifestations and progresses from pure steatosis, through steatosis with lobular inflammation, fibrosis and cirrhosis to hepatocellular carcinoma.1,2 NAFLD diagnosis requires establishing a presence of hepatic steatosis and excluding secondary causes of hepatic fat accumulation (e.g. alcohol consumption, steatogenic medications and monogenic hereditary disorders). 2 Although liver biopsy and evaluation of histological changes are standard procedures for NAFLD diagnosis, other clinical measurements avoiding such an invasive procedure would be welcomed.1,2 An alternative to imaging techniques recommended for the evaluation of steatosis is the fatty liver index (FLI), an algorithm derived from parameters that reflect anthropometric, liver function and lipid metabolism disorders related to NAFLD.1,3
Along with disease progression, cardiovascular complications are frequent in patients with NAFLD.1,2,4–6 The basis of this relationship resides in the close association of NAFLD with obesity, insulin resistance and the presence of metabolic syndrome.1,2,4,5 Atherogenic dyslipidaemia, hyperglycaemia, endothelial dysfunction, hypertension, hypercoagulability and inflammation develop in patients with NAFLD.1,2,4–6 All of these contribute to the development of cardiovascular disease.
Regarding dyslipidaemia, a low concentration of high-density lipoprotein cholesterol (HDL-cholesterol) is one of the hallmarks of NAFLD.1,2,4,5 However, a comprehensive evaluation of the complex antiatherogenic properties of this lipoprotein class cannot rely solely on the measurement of HDL-cholesterol concentration. The HDL family consists of heterogeneous particles, which differ in structure, size, metabolism and functional properties. 7 Changes in lipoprotein subclass distribution arise because of changes in lipoprotein metabolism under different metabolic conditions and are often accompanied by structural and functional alterations. 7 Consequently, understanding HDL subclass distribution in subjects with elevated FLI would be of interest. HDL subclass rearrangement is largely regulated by lecithin–cholesterol acyltransferase (LCAT) and cholesteryl ester transfer protein (CETP). Both are responsible for HDL particle maturation and remodelling since they catalyse cholesteryl ester formation and transfer, respectively.8,9 In order to better understand the distribution of HDL subclasses, both LCAT and CETP activities were examined in this current study. Despite its role in HDL particle maturation, the antiatherogenic role of LCAT has been previously challenged.8,10–12 Therefore, it would be of interest to investigate the association of this enzyme with a complex algorithm such as FLI score. Finally, to complete our understanding regarding qualitative changes in HDL, specific markers of HDL function need to be explored. Paraoxonases 1 (PON1) and 3 (PON3) are HDL-bound calcium-dependent antioxidative enzymes and are considered to be markers of HDL antioxidative capacity. 13 Although these enzymes have been well studied elsewhere, their associations with FLI remain unknown.
This study was aimed to examine the association of the abovementioned markers of HDL function and metabolism with FLI. Having in mind the controversial data about the antiatherogenic properties of LCAT, we performed extensive analysis of the association of LCAT with both FLI and separate variables included in FLI assessment. Considering the previous findings, we hypothesized that both HDL metabolism and function would be compromised in the group of participants with elevated FLI.
Materials and methods
Participants
Participants were recruited at the Clinic for Endocrinology, Diabetes and Metabolic Disorders in the Clinical Centre of Serbia (Belgrade) in the Department for Nutrition and Prevention of Metabolic Disorders. Trained interviewer assisted participants to complete a questionnaire (age, lifestyle, blood pressure, past illness, drug use and family medical history). The study was approved by the Ethical Committee of the Clinical Centre of Serbia. Each participant gave written consent to participate.
Initially, 201 subjects were recruited. Subjects with a history of atherosclerotic cardiovascular disease (n = 15), diagnosis of diabetes mellitus (n = 19), current intake of lipid modulating drugs (statins, nicotinic acid and fibrates) (n = 18) and those with missing data for FLI calculation (n = 19) were excluded. After disqualification, 130 participants remained in the study. None of the participants had infective liver disease documented in their medical record. As a part of the assessment, weight and height were measured, and body mass index (BMI) was calculated. The presence of metabolic syndrome was established according to the presence of at least three out of five criteria: elevated waist circumference (⩾102 cm for males, ⩾88 cm for females), fasting triglycerides ⩾1.7 mmol/L, reduced HDL-cholesterol concentration (<1.03 mmol/L for males, <1.3 mmol/L for females), elevated blood pressure (⩾130 mmHg systolic blood pressure or ⩾85 mmHg diastolic blood pressure or antihypertensive drug treatment) and fasting glucose concentration ⩾5.6 mmol/L. 14
Laboratory analyses
Blood samples were collected into serum and EDTA tubes after a 12 h fasting period. Fresh samples, or aliquots stored at –80°C, were used for analyses. Concentrations of glucose, total cholesterol, HDL-cholesterol, triglycerides and gamma-glutamyl-transferase (GGT) activity were determined by routine methods. Low-density lipoprotein cholesterol (LDL-cholesterol) was calculated using the Friedewald formula. 15 C-reactive protein (CRP) and haemoglobinA1c (HbA1c) were assayed by an immunoturbidimetric method. Biochemical analyses were performed in fresh samples using Cobas reagents on Cobas 6000 analyser (Roche Diagnostics, Mannheim, Germany). Insulin was determined by radio-immunoassay (INEP, Belgrade, Serbia) on LKB – Wallac – CliniGamma 1272 (Wallac Oy, Turku, Finland). Homeostatic model assessment-insulin resistance (HOMA-IR) was calculated using the formula (fasting glucose [mmol/L]×fasting insulin [mIU/L])/22.5. 16
Serum PON1 activity was measured using paraoxon as the substrate (Chem Service, PA, USA), by a previously described kinetic method. 17 Concentrations of PON1 and PON3 were determined by ELISA (R&D Systems, Minneapolis, USA).
Classification of patients according to the FLI
The FLI was calculated according to a previously published study
3
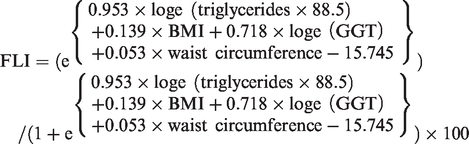
In the original equation, triglyceride concentrations were expressed in mg/dL. For converting mmol/L to mg/dL, a factor of 88.5 was used.
An FLI < 30 was used to rule out hepatic steatosis. FLI ⩾ 60 ruled in hepatic steatosis. 3 Patients were classified into three groups according to the FLI values: FLI < 30, FLI 30–59 and FLI ⩾ 60.
LCAT and CETP activities
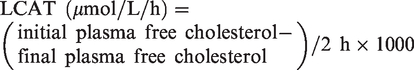
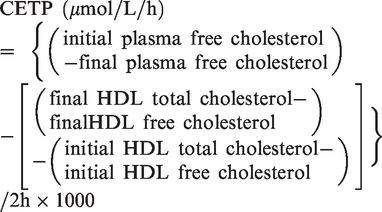
A previously described method for the simultaneous determination of LCAT and CETP activities in human plasma was used.18,19 Whole and apoB-depleted plasma samples were incubated for 2 h at 37°C. Measurements were performed before and after incubation.
LCAT activity was determined by measuring the decrease in the concentration of substrate (free plasma cholesterol) during incubation of the whole plasma.
CETP-mediated cholesteryl ester transfer was assessed as the difference between the rate of cholesteryl ester formation by LCAT activity and the rate of cholesteryl ester exchange in plasma HDL during 2 h of incubation. HDL was obtained using apoB precipitating reagent. The cholesteryl ester concentration was calculated as the difference between total and free cholesterol concentration.
All analyses were performed in triplicate using Biosystems reagents (Barcelona, Spain) on an ILab 300 plus analyser (Instrumentation Laboratory, Milan, Italy).
Lipoprotein subclasses
HDL and LDL subclasses were separated simultaneously using non-denaturing gradient gel electrophoresis. 20 A detailed description of the procedure has been published elsewhere. 21 Carboxylated polystyrene microsphere beads, Pharmacia High Molecular Weight protein standards and standardized human plasma with determined sizes of two LDL subclasses were used as calibrators. Electrophoresis was performed by employing a Ruby electrophoresis unit (Amersham Pharmacia Biotech, Vienna, Austria) at 4°C, pH = 8.35 for 20 h. Gels were scanned using Image Scanner (Amersham Pharmacia Biotech, Vienna, Austria) with Image Quant software (version 5.2; 1999; Molecular Dynamics, Sunnyvale, CA, USA). The relative proportion of each LDL and HDL subclass was established using areas under the peaks of densitometric scans in corresponding subclass regions. The relative proportion of small, dense low-density lipoprotein particles (sdLDL) was determined by calculating the area under the peak at or below 25.5 nm. 22 Similarly, the relative proportion of small-sized HDL particles was assessed as the area under the peak at or below 8.8 nm.
Statistical analysis
Data were tested for normality of distribution by the Shapiro-Wilk test. Normally distributed continuous variables were presented as mean ± standard deviation (SD). If the normality of distribution was achieved by logarithmic transformation, the results were presented as geometric mean (95% confidence interval [CI]). Comparisons between normally distributed variables in subgroups were performed using ANOVA with the post hoc Tukey test. Asymmetrically distributed variables were presented as median (interquartile range) and were compared using Kruskal-Wallis test. Categorical variables were presented as frequencies and compared using Chi square test. Spearman correlation coefficient was used to test the relationships between variables. Logistic regression analysis was used to determine independent predictors of elevated FLI values (dichotomous dependent variable, namely: FLI < 30 and FLI ⩾ 60). Models contained parameters that were not included in the FLI calculation. Results are presented as odds ratio with 95% CI. Multiple linear regression analysis was used to investigate the association between variables included in the FLI formula and the LCAT activity. P values less than 0.05 were considered statistically significant.
Results
The characteristics of the three groups of patients are presented in Table 1. Gender distribution did not significantly differ among the groups. Subjects with FLI < 30 were significantly younger compared with the other two groups. Obesity, GGT activity and CRP concentrations differed across the groups. Altered glucose metabolism in the FLI ⩾ 60 group was reflected through both higher fasting glucose and HbA1c compared with the FLI < 30 group. Differences in fasting insulin and HOMA-IR were noted between FLI ⩾ 60 and the other two groups. Triglycerides were the highest in the FLI ⩾ 60 group. HDL-cholesterol was lowest in the FLI ⩾ 60 group. Decreasing HDL-cholesterol trended with increasing FLI. Total and LDL-cholesterol were greater in the FLI ⩾ 60 group compared with the FLI < 30 group.
Characteristics of patients classified according to FLI values.
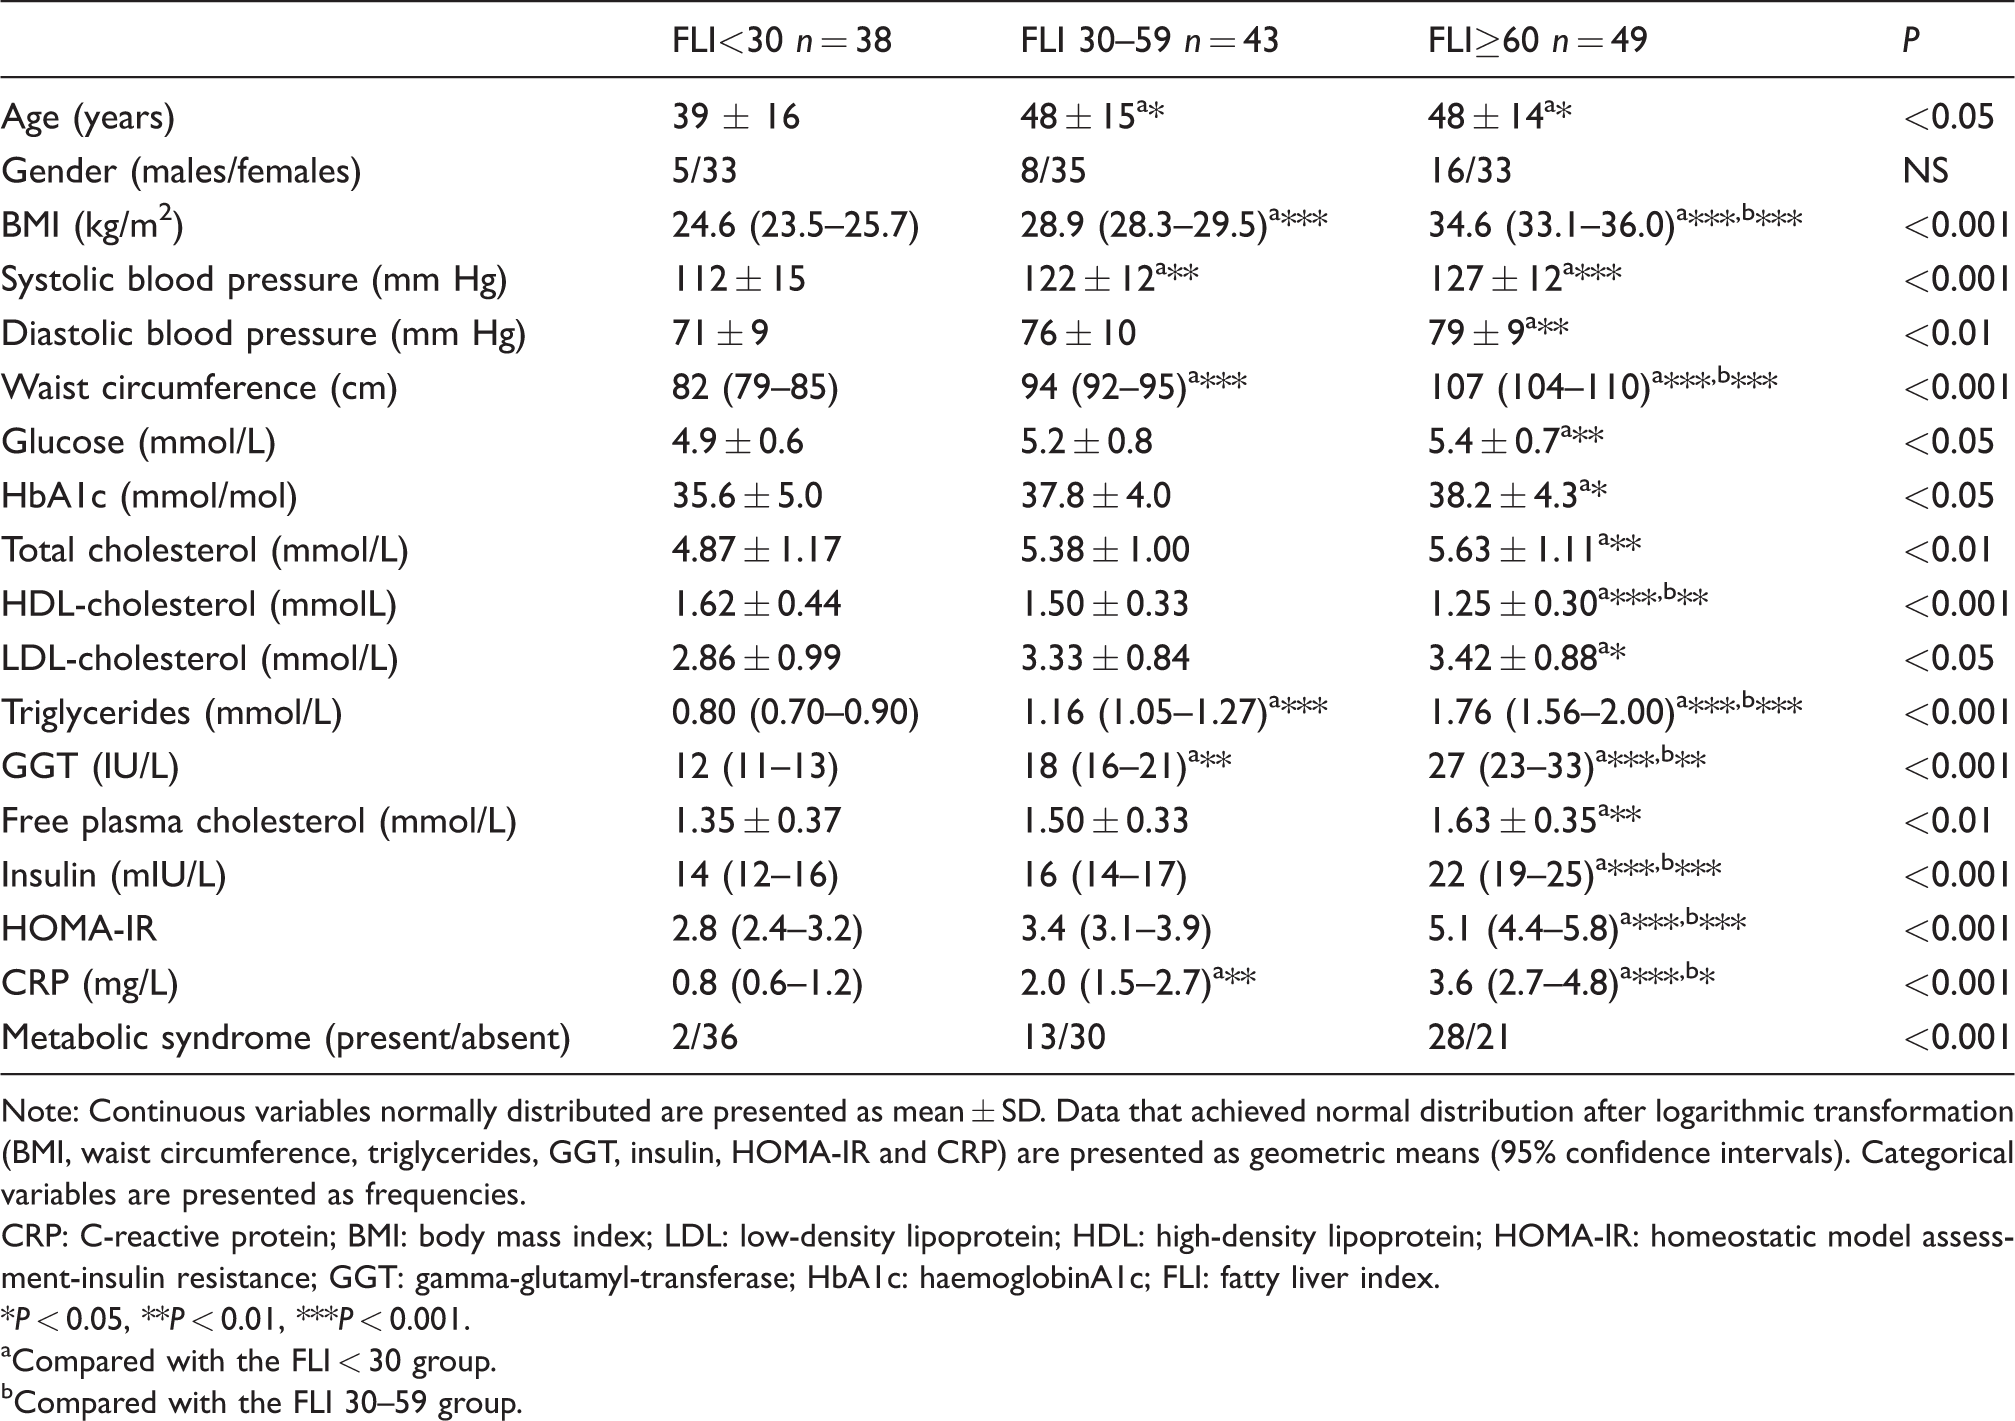
Note: Continuous variables normally distributed are presented as mean ± SD. Data that achieved normal distribution after logarithmic transformation (BMI, waist circumference, triglycerides, GGT, insulin, HOMA-IR and CRP) are presented as geometric means (95% confidence intervals). Categorical variables are presented as frequencies.
CRP: C-reactive protein; BMI: body mass index; LDL: low-density lipoprotein; HDL: high-density lipoprotein; HOMA-IR: homeostatic model assessment-insulin resistance; GGT: gamma-glutamyl-transferase; HbA1c: haemoglobinA1c; FLI: fatty liver index.
*P < 0.05, **P < 0.01, ***P < 0.001.
aCompared with the FLI < 30 group.
bCompared with the FLI 30–59 group.
Increased LCAT activity paralleled increased FLI. Despite higher CETP activity in the FLI ⩾ 60 group, compared with the two other groups, statistical significance was not achieved. PON3 concentration was lower in the FLI ⩾ 60 group compared with the FLI < 30 group. Both PON1 activity and PON1 concentration did not differ significantly across the three groups (Table 2).
Markers of HDL function and metabolism in patients with different FLI values.
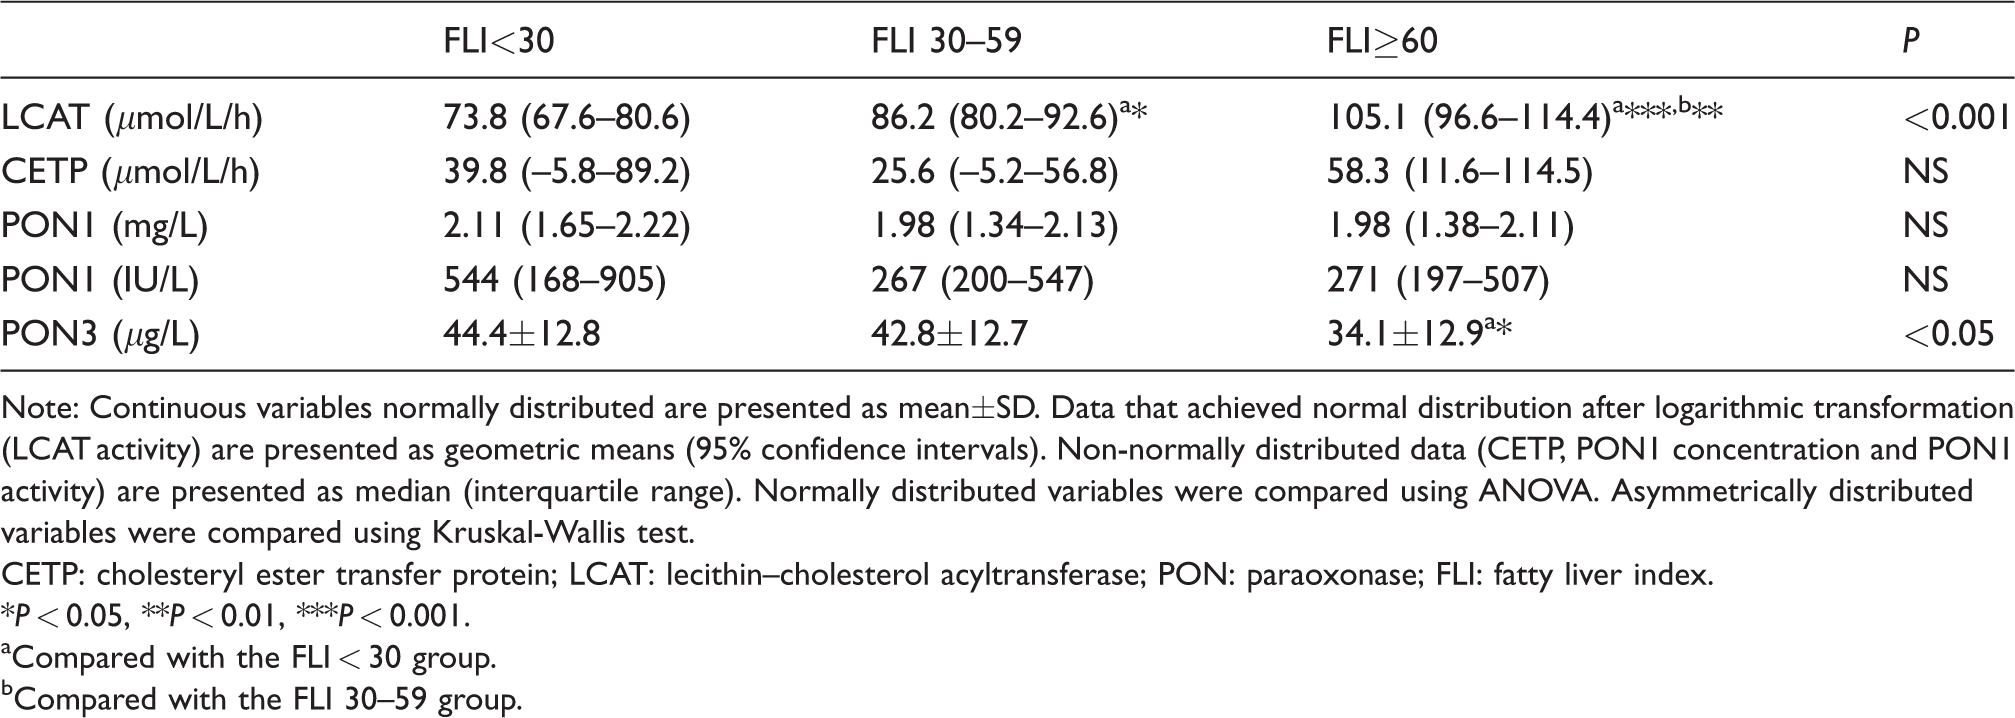
Note: Continuous variables normally distributed are presented as mean±SD. Data that achieved normal distribution after logarithmic transformation (LCAT activity) are presented as geometric means (95% confidence intervals). Non-normally distributed data (CETP, PON1 concentration and PON1 activity) are presented as median (interquartile range). Normally distributed variables were compared using ANOVA. Asymmetrically distributed variables were compared using Kruskal-Wallis test.
CETP: cholesteryl ester transfer protein; LCAT: lecithin–cholesterol acyltransferase; PON: paraoxonase; FLI: fatty liver index.
*P < 0.05, **P < 0.01, ***P < 0.001.
aCompared with the FLI < 30 group.
bCompared with the FLI 30–59 group.
Lipoprotein subclass analysis revealed changes in the distribution of LDL subclasses in the FLI ⩾ 60 group in terms of lower proportions of LDL II and higher proportions of LDL III and sdLDL compared with the FLI < 30 group (Table 3). Similar changes were observed in HDL subclass distribution: The relative proportion of HDL 2b was lower in the FLI ⩾ 60 group compared with the FLI < 30 group. In contrast, the relative proportions of HDL 3c and small-sized HDL 3 subclasses were higher in the FLI ⩾ 60 group in comparison with the other two groups (Table 3).
Lipoprotein subclass distributions in patients with different FLI values.
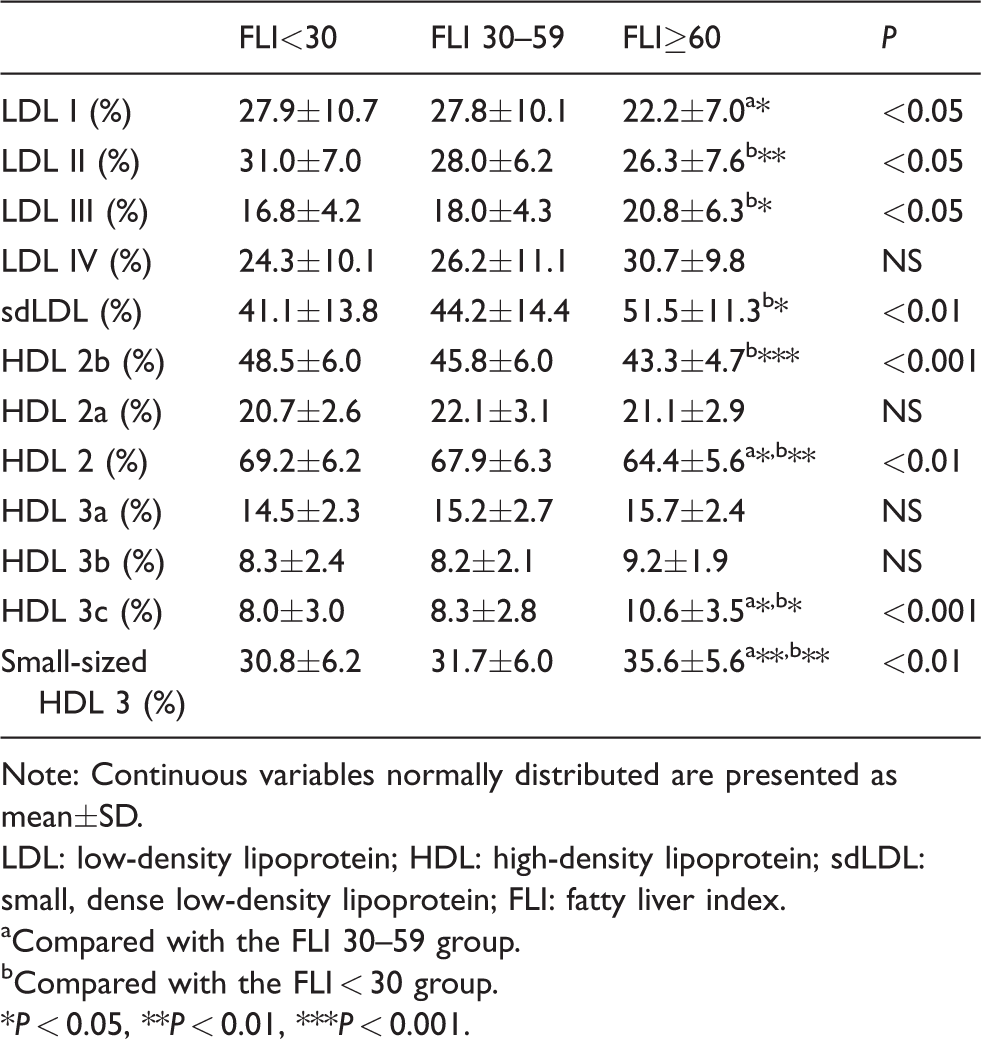
Note: Continuous variables normally distributed are presented as mean±SD.
LDL: low-density lipoprotein; HDL: high-density lipoprotein; sdLDL: small, dense low-density lipoprotein; FLI: fatty liver index.
aCompared with the FLI 30–59 group.
bCompared with the FLI < 30 group.
*P < 0.05, **P < 0.01, ***P < 0.001.
Since LCAT activity and PON3 concentration exhibited the most prominent changes between the three analysed groups, we investigated the correlations between these two markers and other parameters which differed between the FLI-defined groups. The results are presented in Table 4. We further evaluated the ability of LCAT activity and PON3 concentration to discriminate between different FLI groups. The two analysed groups consisted of patients having FLI values at opposite ends of the scale, namely the FLI < 30 and FLI ⩾ 60 groups. We performed adjustment for the effects of several factors related to NAFLD: HOMA-IR value as a measure of insulin resistance, the presence of metabolic syndrome and the relative proportion of the small-sized HDL3 subclass. Given the role of LCAT in lipoprotein cholesterol metabolism, we additionally evaluated the association between LCAT activity and elevated FLI values in models that included free and total plasma cholesterol concentrations. In each model, LCAT remained independently associated with elevated FLI. The relationship between PON3 concentration and FLI was lost after considering the proportion of HDL 3 in the model. The results are presented in Table 5.
Significant correlations of LCAT activity and PON3 concentration with other analysed clinical and laboratory parameters.
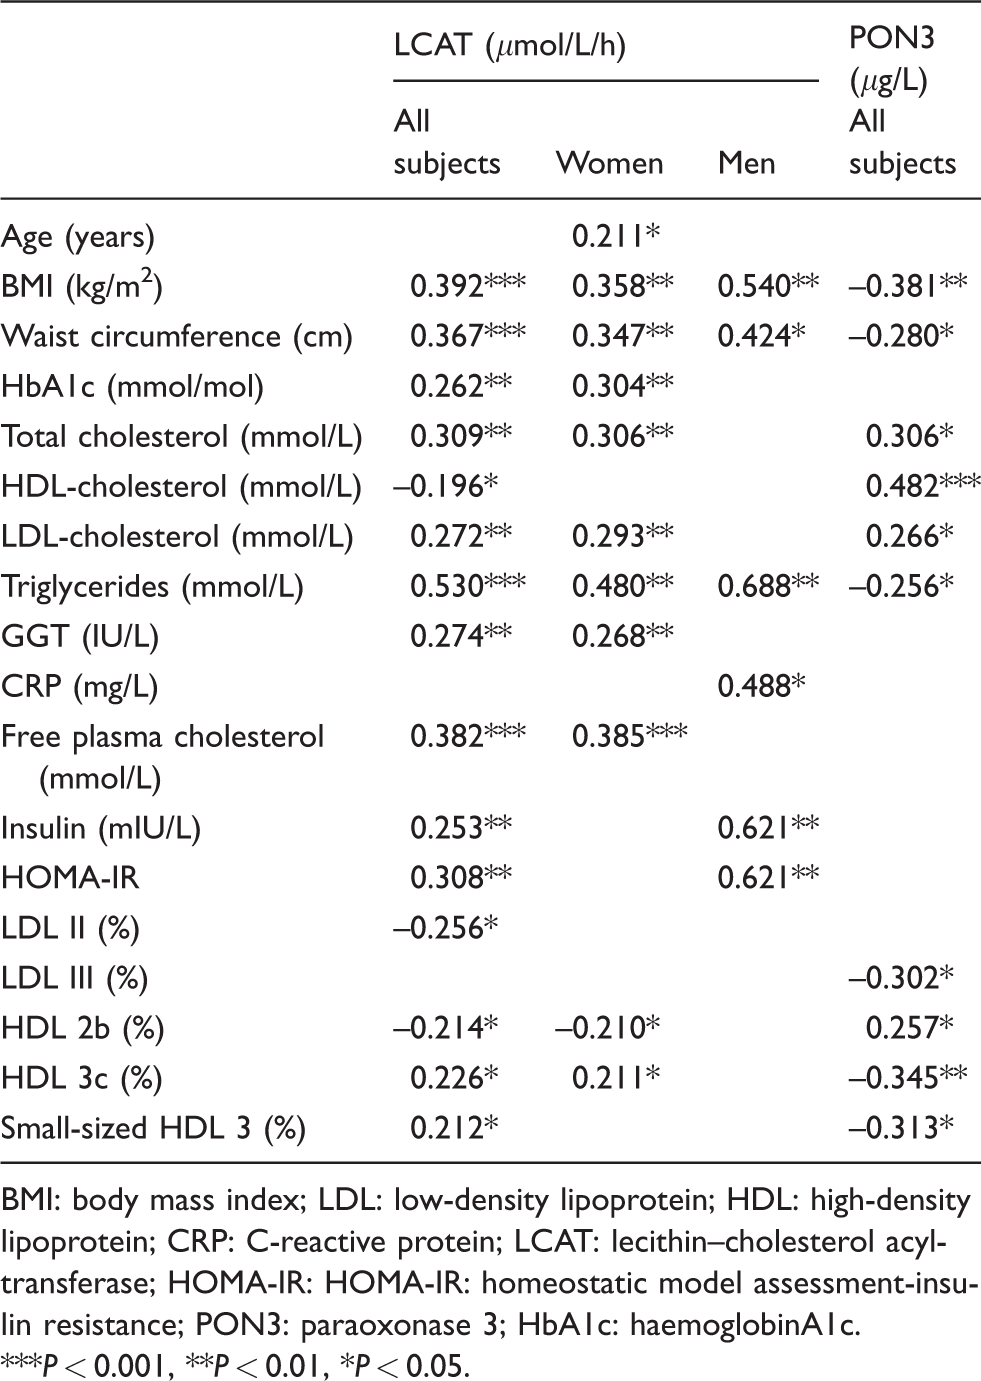
BMI: body mass index; LDL: low-density lipoprotein; HDL: high-density lipoprotein; CRP: C-reactive protein; LCAT: lecithin–cholesterol acyltransferase; HOMA-IR: HOMA-IR: homeostatic model assessment-insulin resistance; PON3: paraoxonase 3; HbA1c: haemoglobinA1c.
***P < 0.001, **P < 0.01, *P < 0.05.
Logistic regression analysis for the evaluation of LCAT activity and PON3 concentration as predictors of increased FLI.
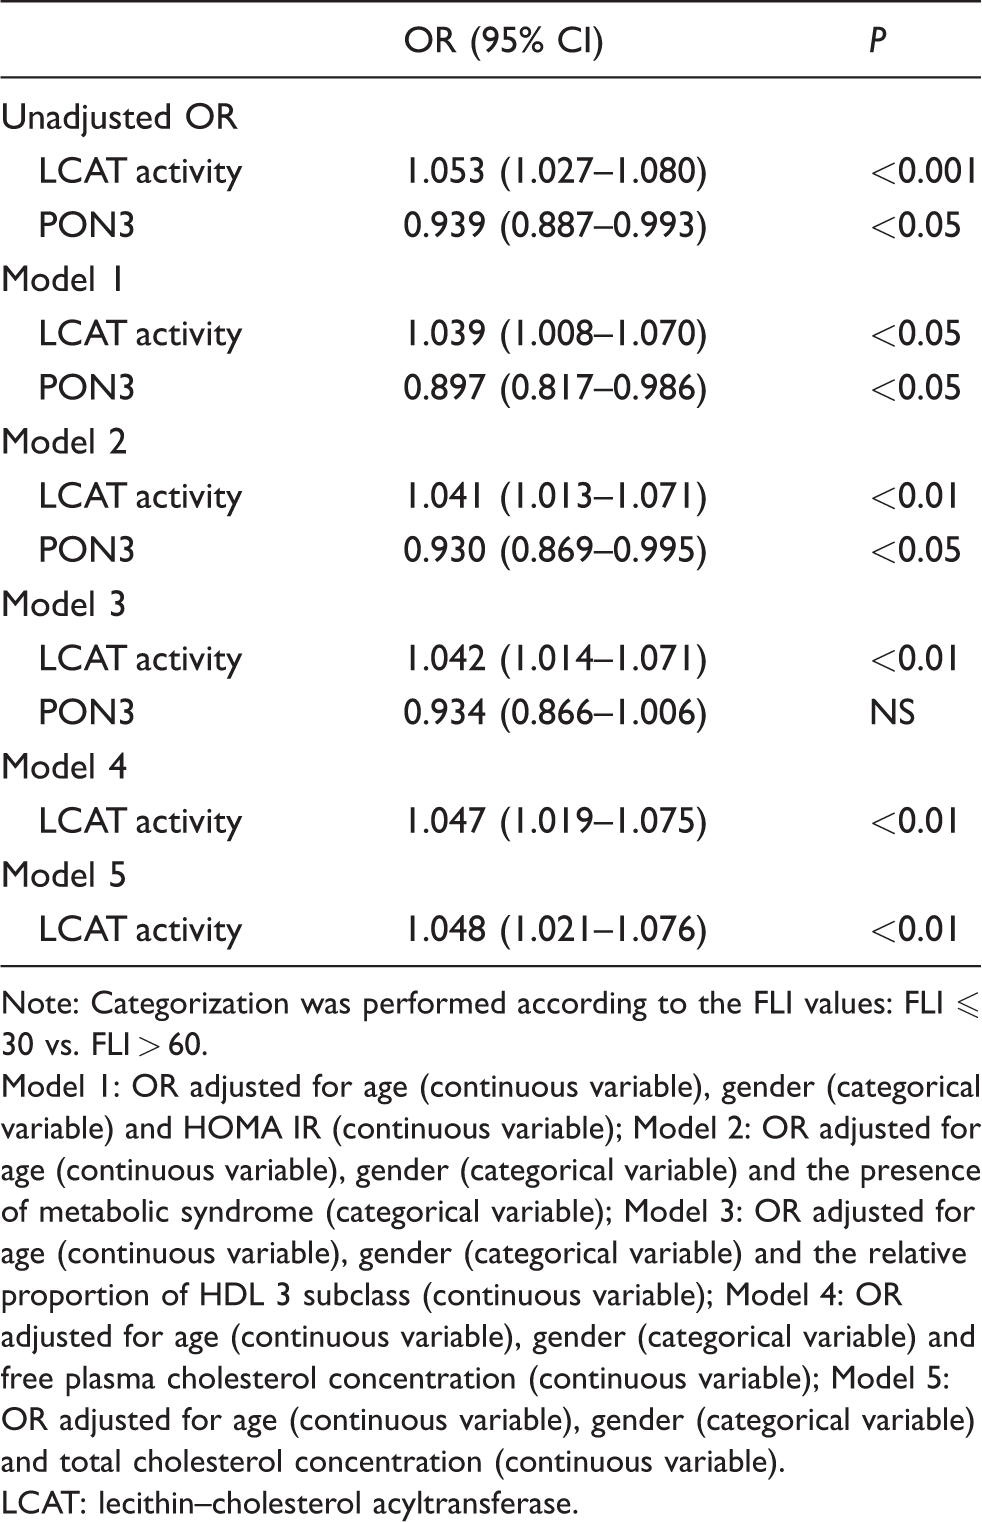
Note: Categorization was performed according to the FLI values: FLI ⩽ 30 vs. FLI > 60.
Model 1: OR adjusted for age (continuous variable), gender (categorical variable) and HOMA IR (continuous variable); Model 2: OR adjusted for age (continuous variable), gender (categorical variable) and the presence of metabolic syndrome (categorical variable); Model 3: OR adjusted for age (continuous variable), gender (categorical variable) and the relative proportion of HDL 3 subclass (continuous variable); Model 4: OR adjusted for age (continuous variable), gender (categorical variable) and free plasma cholesterol concentration (continuous variable); Model 5: OR adjusted for age (continuous variable), gender (categorical variable) and total cholesterol concentration (continuous variable).
LCAT: lecithin–cholesterol acyltransferase.
Lastly, we investigated the separate associations between LCAT activity and all the parameters included in the calculation of FLI. Multivariable regression analysis was performed in all subjects together and separately for both males and females. Model 1 contained parameters included in the FLI calculation, and Model 2 was expanded by including serum lipid parameters. Among the parameters included in the FLI equation, only triglyceride concentration was significantly associated with increased LCAT activity. When considering all the other parameters within the routine lipid profile, triglycerides remained positively associated with LCAT activity only in males. In females, only free plasma cholesterol remained significantly associated with the LCAT activity. All the results are presented in Table 6.
Multivariable regression analysis of independent associations between LCAT activity and variables included in the assessment of FLI.
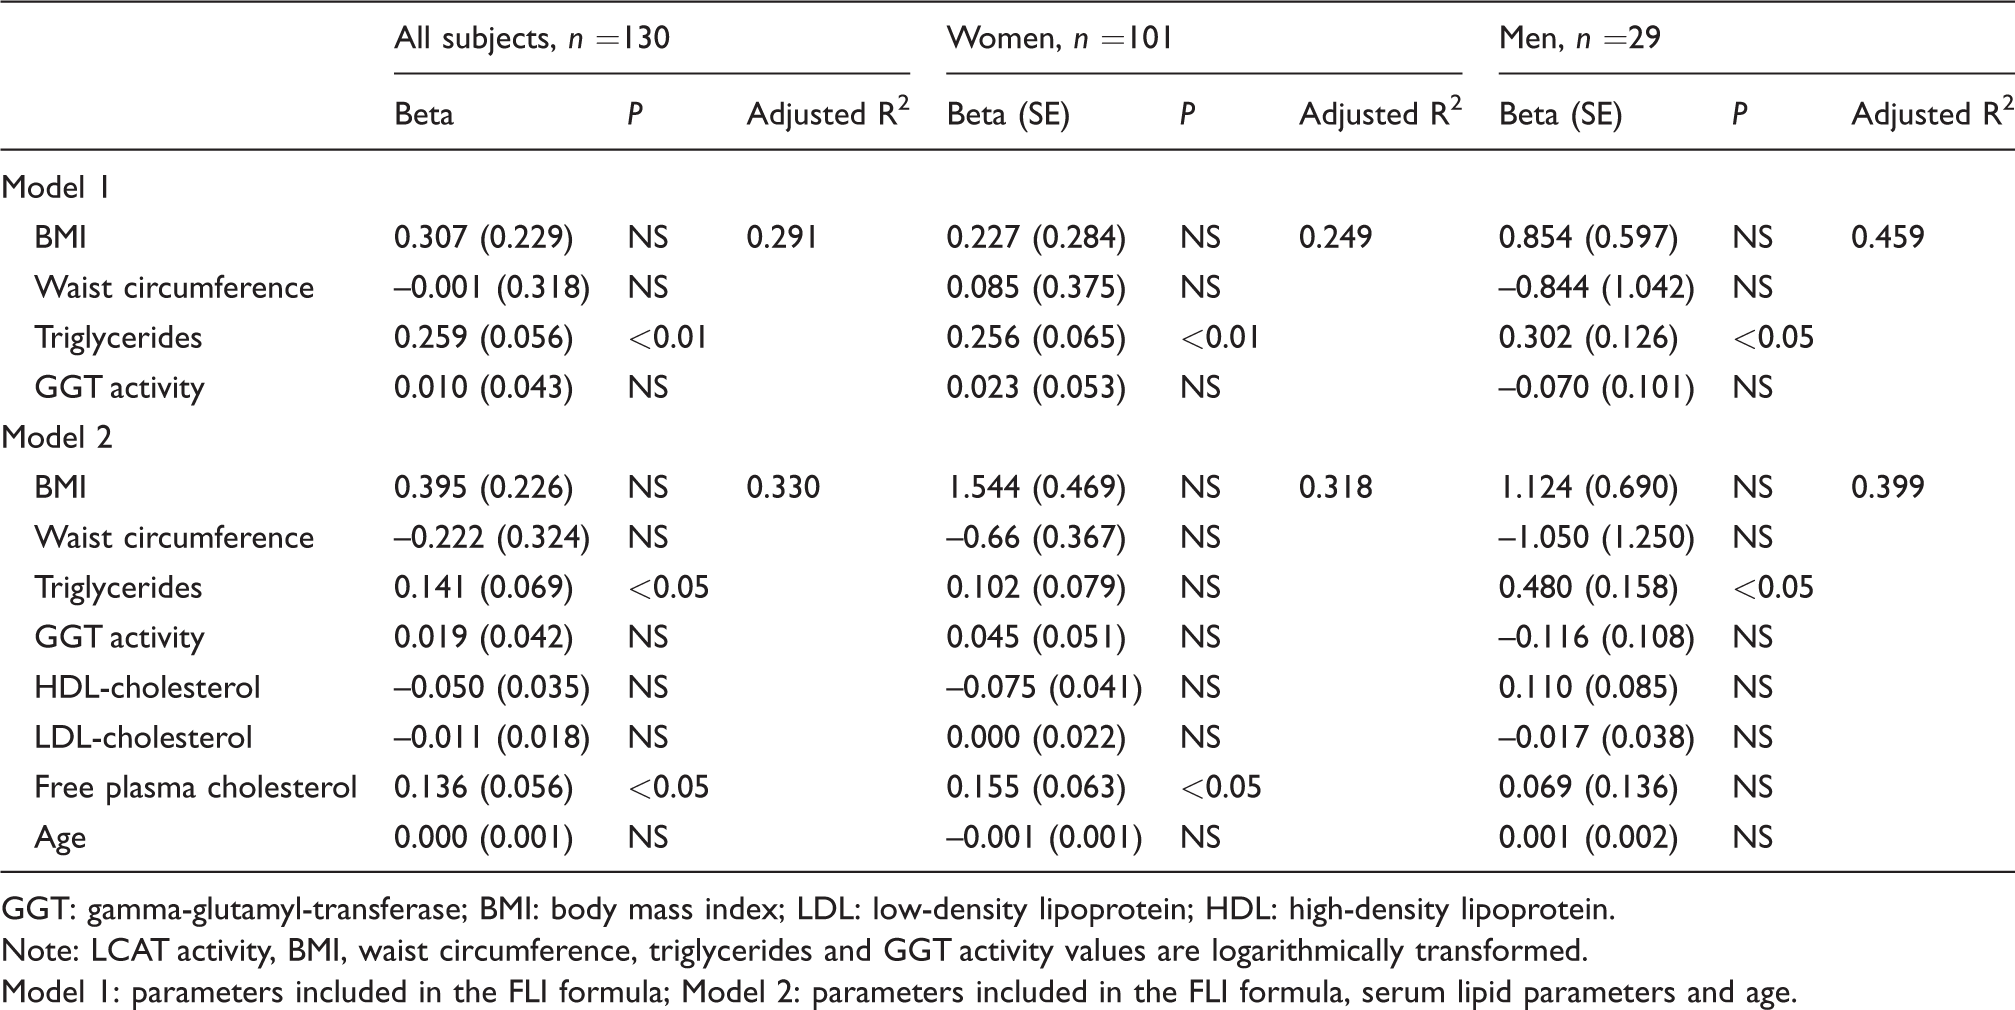
GGT: gamma-glutamyl-transferase; BMI: body mass index; LDL: low-density lipoprotein; HDL: high-density lipoprotein.
Note: LCAT activity, BMI, waist circumference, triglycerides and GGT activity values are logarithmically transformed.
Model 1: parameters included in the FLI formula; Model 2: parameters included in the FLI formula, serum lipid parameters and age.
Discussion
In the present study, we investigated alterations of various indicators of the quality of HDL particles in subjects with different FLI values. According to our results, the quality of HDL particles alters in parallel with rising of FLI score. The key finding of our study is that higher LCAT activity is associated with elevated FLI values.
Our results demonstrated that LCAT activity was higher in each successive group of increased FLI values (Table 2). Recently, higher LCAT activity measured with exogenous substrate assay in subjects with FLI ⩾ 60 was reported. 23 Since this enzyme’s activity can be determined by different methods, our results obtained by measuring of LCAT activity as a rate of decrease of plasma-free cholesterol concentration, adds valuable information to this insufficiently investigated area.
LCAT activity was recognized as an independent predictor of increased FLI, even after adjustment for other metabolic disturbances typically seen in NAFLD (Table 5). These findings are important, as elevated FLI could serve as a surrogate marker for increased liver fat content. 24 The positive association between LCAT activity and elevated FLI persisted even after adjustment for free and total cholesterol concentration (Table 5). This suggests that elevated LCAT activity might be related to FLI by an additional mechanism that is independent of cholesterol synthesis deregulation in fatty liver.25,26
However, individual variables included in the FLI calculation should not be ignored, as they might be associated with LCAT activity by themselves. Accordingly, we analysed the relationship of LCAT activity with each of the parameters included in the FLI formula, as well as with the lipid profile parameters. Despite significant correlations with all the parameters that constitute FLI, only triglycerides were independently associated with higher LCAT activity (Tables 4 and 6). Triglycerides are already established as major determinants of cholesterol esterification rate and are recognized as factors that affect the association between LCAT activity and the serum lipid profile parameters.27–29 It should be noted that one of the NAFLD characteristics is the enhanced secretion of triglyceride-rich very low-density lipoprotein, as a liver compensatory mechanism, aimed to maintain hepatic lipid homeostasis. 30 Taken altogether, higher LCAT activity could be expected in the case of lipid profile deregulation that accompanies NAFLD. The role of LCAT activity in the modulation of hepatic lipid deposition has been observed in animal models.31,32 These findings warrant further investigation, as the role of this enzyme in NAFLD in humans is still unclear.
Despite limited gender-specific studies on hepatic lipid metabolism, it has been reported that higher LCAT activity and concentration are related to increased cardiovascular disease risk in females. In contrast, the exact nature of this relationship was not clear in males.29,33 Our results demonstrated that after including lipid profile parameters in a model, LCAT activity was independently associated with both triglycerides and free plasma cholesterol in the entire cohort (Table 6). In females, only free plasma cholesterol remained independently associated with LCAT activity, while in males, only triglycerides persisted as a significant variable. Our findings raise the question of gender-specific determinants of LCAT activity. In line with this, the observed positive correlation between LCAT activity and HOMA-IR in the entire study cohort was confirmed in males only (Table 4). Animal studies have revealed that LCAT deficiency protects from the development of hepatic and adipocyte insulin resistance (the latter regulated by gender).34,35 Recently, it has been reported that increased LCAT activity is a predictor of diabetes development only in males. 36 Our findings both confirm and extend previous reports and support for future investigations of gender-specific differences in the regulation of LCAT activity.
In addition to the typical pattern of metabolic disorders seen in subjects with elevated FLI (Table 1), complex alterations of lipoprotein metabolism were also recorded. The observed shift towards both smaller LDL and HDL particles in the FLI ⩾ 60 group (Table 3) coincides with the previous report in subjects with NAFLD diagnosis confirmed by ultrasound or histological analysis, as well as in patients with NAFLD assessed through FLI.37–39 The abundance of sdLDL and smaller HDL particles reflects profound changes in lipoprotein metabolism, which can arise because of both a perturbed microenvironment and altered activities of endogenous LDL and HDL modulators. CETP-mediated remodelling of lipoproteins in hypertriglyceridaemic conditions results in the generation of small, dense LDL and HDL particles.7,9 Hence, when considering the rise in triglyceride concentration across our FLI groups, we would expect an increase in CETP activity. However, the anticipated increase was missing, but an upward trend in CETP activity in the FLI ⩾ 60 group was noted (Table 2). The lack of statistical significance reported in our study may have been due to a relatively small sample size. Additionally, it has been previously suggested that increased CETP substrate availability, i.e. increased triglyceride concentration, affects lipoprotein metabolism, despite a lack of confirmatory increase in CETP activity. 40 Our results concur with this.
Regarding markers of antioxidative HDL function, we found lower PON3 concentration in FLI ⩾ 60 subjects compared with FLI < 30 group, while both PON1 activity and concentration were comparable across the groups (Table 2). Previous studies on the association between NAFLD and serum PON1 activity have been inconsistent.41,42 HDL proteomic characterization has shown that PON1 concentration does not differ between subjects with normal liver and those with NAFLD. 43 A comparable PON1 arylesterase activity, despite low HDL-cholesterol concentration, has been recently reported in subjects classified according to FLI values. 44 Therefore, preserved PON1 activity in individuals with elevated FLI may reflect a compensatory mechanism directed towards the preservation of HDL antioxidative function. On the other hand, data about the association between PON3 and FLI are largely missing, as well as studies that simultaneously evaluated PON1 and PON3. However, it has been shown that PON3 concentration is lower in patients with subclinical atherosclerosis and autoimmune diseases (systemic lupus erythematosus and type 1 diabetes), without associated differences in PON1 concentrations. 45 In our study, after adjustments for the relative proportion of small-sized HDL 3 subclasses, PON3 concentration lost its discriminative ability regarding elevated FLI values (Table 5). This finding should be considered in the light of the observed positive correlation of PON3 with both HDL-cholesterol and the relative proportion of the largest HDL 2b subclasses, alongside its negative correlation with triglycerides and the percentage of smaller HDL subclasses (Table 4). It has been clearly demonstrated that metabolic rearrangements are associated with the accumulation of smaller dysfunctional HDL subclasses.7,46 Therefore, it is likely that the observed changes in PON3 are a consequence of altered HDL structure, related to the unfavourable metabolic environment in subjects with elevated FLI values. As PON3 is the least studied member of the PON family, future research should shed light on whether PON3 is a more sensitive marker of antioxidative HDL function compared with PON1, at least in some specific pathological conditions. In addition, the importance of the PON1 and PON3 balance for maintaining antioxidative HDL function should be further explored.
Our study has several limitations: cross-sectional design, a relatively small group of subjects (particularly the limited number of males) and the lack of strict NAFLD definition by the criteria recommended by clinical practice guidelines, which include hepatic steatosis confirmation by ultrasound or histological analysis. Larger longitudinal studies that enable monitoring of both NAFLD progression and HDL modulators and qualitative characteristics are necessary.
Conclusions
Our results demonstrate adverse qualitative changes of HDL particles in subjects with elevated FLI, i.e. a shift towards smaller HDL subclasses, higher LCAT activity and lower PON3 concentration. When analysing all the parameters in the FLI equation separately, only triglycerides were significantly associated with higher LCAT activity. When taken all together, the evaluation of HDL particle quality in different pathological conditions and metabolic disorders cannot be overstated. Future prospective studies should evaluate our preliminary findings and reveal the mechanisms of complex alterations in lipid profiles in subjects with elevated FLI.
Footnotes
Acknowledgements
The authors express gratitude to the patients who participated in this study and staff at The Clinic for Endocrinology, Diabetes and Metabolism Disorders for help in obtaining and processing samples.
Declaration of conflicting interests
The author(s) declared no potential conflicts of interest with respect to the research, authorship, and/or publication of this article.
Funding
The author(s) disclosed receipt of the following financial support for the research, authorship, and/or publication of this article: This work was financially supported by grants from the Serbian Ministry of Education, Science and Technological Development (Project number 175035).
Ethical approval
This study is approved by the Ethical Committee of the Clinical Centre of Serbia (number: 1230/8).
Guarantor
JJ.
Contributorship
JJ: Defined study design, performed laboratory research, collected, analysed and interpreted data and wrote the article. AZ: Defined study design, supervised laboratory research, interpreted and analysed data and prepared the article. ZJI: Formulated study concept and design, analysed data and critically revised the article to ensure intellectual accuracy. VDS: Defined study design, acquired data and critically revised the article to ensure intellectual accuracy. MM, AS, JM and JV: Performed laboratory research, analysed data and drafted the article. JKS: Supervised laboratory research, participated in data analysis and writing the article. VSK: Designed the study and critically revised the article to ensure intellectual accuracy. All authors approved the final version of the article.