
Abstract
Background
Several studies have demonstrated the analytical sensitivity of MALDI-TOF mass spectrometry (MALDI-TOF MS) by immunoenrichment for M-protein analysis. We report the results of a novel, low-cost, reagent-based extraction process using acetonitrile (ACN) precipitation to enrich for κ and λ light chains which can be analysed by MALDI-TOF MS.
Methods
Institutional Ethics committee approval was obtained. Serum samples from patients with monoclonal gammopathy of undetermined significance (MGUS), multiple myeloma (MM), plasmacytoma, AL amyloidosis and Waldenström macroglobulinemia (WM) underwent ACN precipitation. The images obtained were overlaid on apparently healthy donor serum samples to confirm the presence of M-protein. A sample was considered positive for M-protein if there was a sharp or broad peak within the κ or λ mass/charge (m/z) range: m/z- [M + 2H]2+: 11,550–12,300 Da and λ m/z- [M + 2H]2+: 11,100–11,500 Da. Images were acquired at a m/z range of 10,000–29,000 Da. Corresponding serum protein electrophoresis (SPEP), serum immunofixation electrophoresis (IFE) and serum free light chain (sFLC) assay by nephelometry were performed for all the samples.
Results
Two-hundred-and-two serum samples were included in the study: MM- 184 (91%); AL amyloidosis- 2 (1%); plasmacytoma- 8 (4%); MGUS- 6 (3%) and WM- 2 (1%). All the SPEP positive samples were identified by MALDI-TOF MS. Out of 179 samples positive for M-protein by IFE, MALDI-TOF MS was positive in 176 samples (98%). Compared to IFE, the sensitivity and specificity of M-protein identification by MALDI-TOF MS were 98.3% and 52.2%, respectively.
Conclusions
This study demonstrates the feasibility of qualitatively identifying M-protein without the need for antibody-based immunoenrichment, making the technique cost-effective.
Introduction
Monoclonal gammopathy of undetermined significance (MGUS), multiple myeloma (MM), plasmacytoma, light chain (AL) amyloidosis and Waldenström macroglobulinemia (WM) belong to a group of disorders known as clonal plasma cell dyscrasias.1–4 These disorders are diagnosed by detecting an abnormally secreted monoclonal protein (M-protein) in the blood and sometimes in the urine. Around 2–3% have non-secretory MM, that is, absence of M-protein. 1
M-protein is analysed by a multitude of tests, including serum/urine protein electrophoresis (SPEP/UPEP), serum/urine immunofixation (IFE) and serum/urine free light chains (sFLC/uFLC). The combination of these tests can be laborious, time-consuming and expensive. 5
Recent studies have demonstrated the feasibility of employing matrix-assisted laser desorption ionization mass spectrometry-time of flight mass spectrometry (MALDI-TOF MS) to detect M-protein by analysing immunoglobulin isoforms and light chains using isotype-specific nanobodies in MM and AL amyloidosis termed MASS-FIX.6–10 MASS-FIX has demonstrated superior analytical sensitivity to IFE.
11
MASS-SCREEN is another rapid and accurate screening technique using
The advantage of using MALDI-TOF MS analysis is based on the ability to measure the mass to charge (m/z) ratios of the light chains:
Another unique advantage of MALDI-TOF is its use for disease response assessment in patients with IgG
Here we report the feasibility of an alternate low-cost, reagent-based extraction process that can enrich the light chains-
Methods
Samples
Control and patient samples were collected after obtaining Institutional Ethics Committee approval for carrying out a study on biomarker discovery in plasma cell disorders. The work was carried out in accordance with the Declaration of Helsinki after obtaining written informed consent from patients. Excess control serum samples were obtained from healthy blood product donors who provided a sample for preliminary screening. Patients with confirmed plasma cell disorders who underwent SPEP, serum IFE and sFLC were included for MALDI-TOF MS analysis using the extra serum sample. Descriptive statistics were carried out using IBM SPSS Statistics v28.0.1.0 (142). The chi-square test was used to analyse the statistical significance of concordance between various tests.
Serum protein electrophoresis, serum IFE and sFLC analysis
Serum protein electrophoresis was performed on the Minicap/FP fully automated capillary electrophoresis analyser (Sebia, France), and serum total protein concentration was determined by the colourimetry method using biuret reagent on the BA400 fully automated clinical chemistry analyser (manufactured by Biosystem S.A., Spain). From the total protein value, the software automatically quantified each fraction (𝛼1, 𝛼2, β1, β2 and γ globulins). With the help of a pointer on the screen, the M-protein area was marked manually. The instrument automatically calculated the concentration of M-protein from the total protein value.
Serum IFE was performed on SAS-3 9IF gel (Helena Biosciences) or the Hydrasys 2 scan focusing gel electrophoresis (Sebia, France) instrument and reported.
Serum free light chain was analysed on BN II Nephelometer by Siemens using the Binding Site kit. IgD and IgE immunotyping was not performed. Based on the sFLC readings, a sample was labelled as
Reagent-based extraction
The serum fraction was separated from whole blood by centrifugation at 5000 rpm for 15 min and stored at −80°C until further analysis. Twenty-five
Western blot analysis of serum ACN precipitates
Acetonitrile precipitation was performed on all the serum samples as described above. The ACN precipitates were subjected to SDS PAGE electrophoresis using 12% SDS PAGE gel. Following western blot transfer onto a nitrocellulose membrane, the blot was incubated in a blocking solution (3% non-fat dry milk in TBST buffer) for 1 h. Next, the blot was incubated in primary antibody solution of either biotin-labelled mouse
Antibody immunoenrichment
The procedure for immunoenrichment was performed as previously described
7
with some modifications. Due to the non-availability of agarose beads and nanobodies targeting
MALDI-TOF analysis
One
Interpretation of M-protein
A sample was considered positive for M-protein if there was a sharp or broad peak within the
Results
Identification of
and
light chains in ACN precipitates of serum
κ and λ light chain M-protein standards were spotted at different concentrations: 3–12 ng/µL for (A) FLC mass spectra with [M + H]+ and [M + 2H]+2 charge states: Serum with 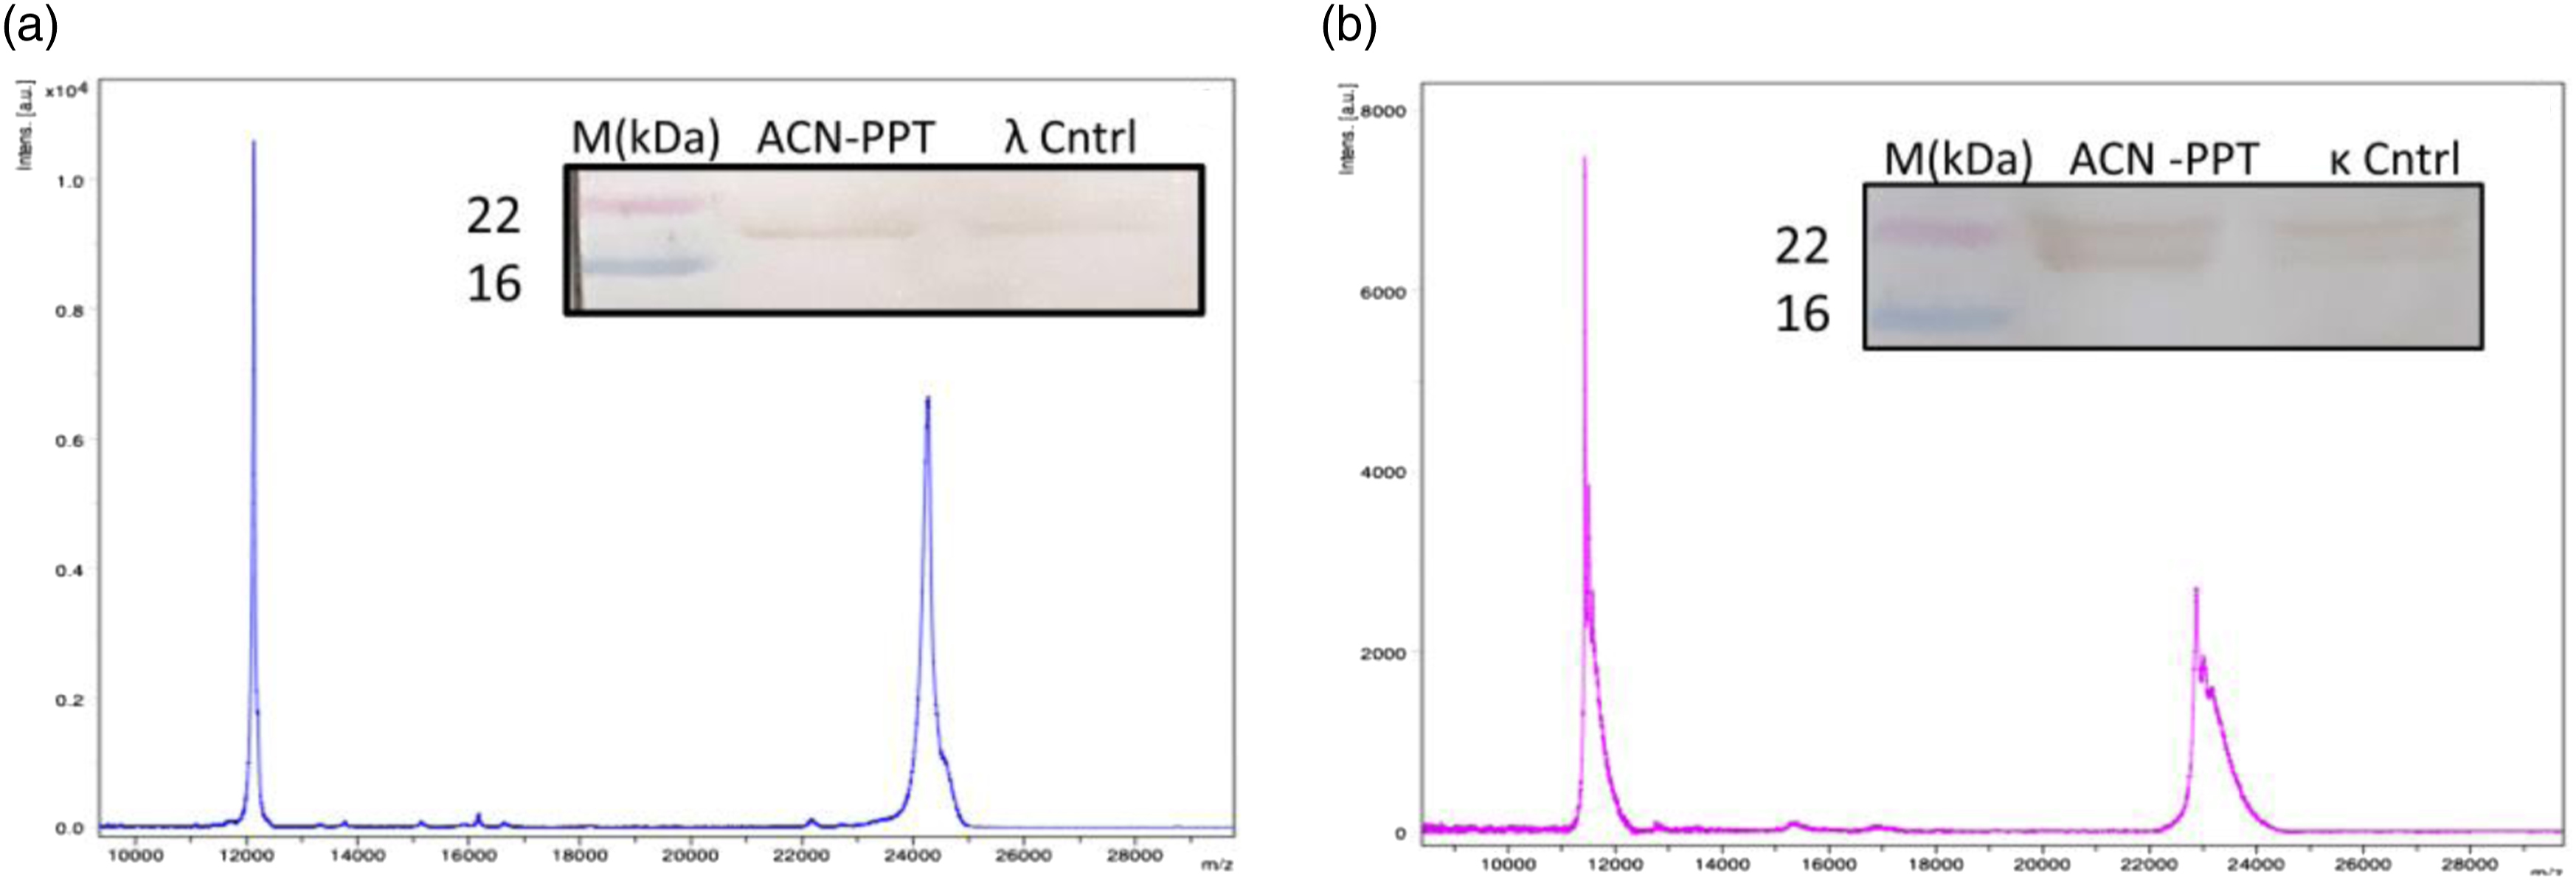
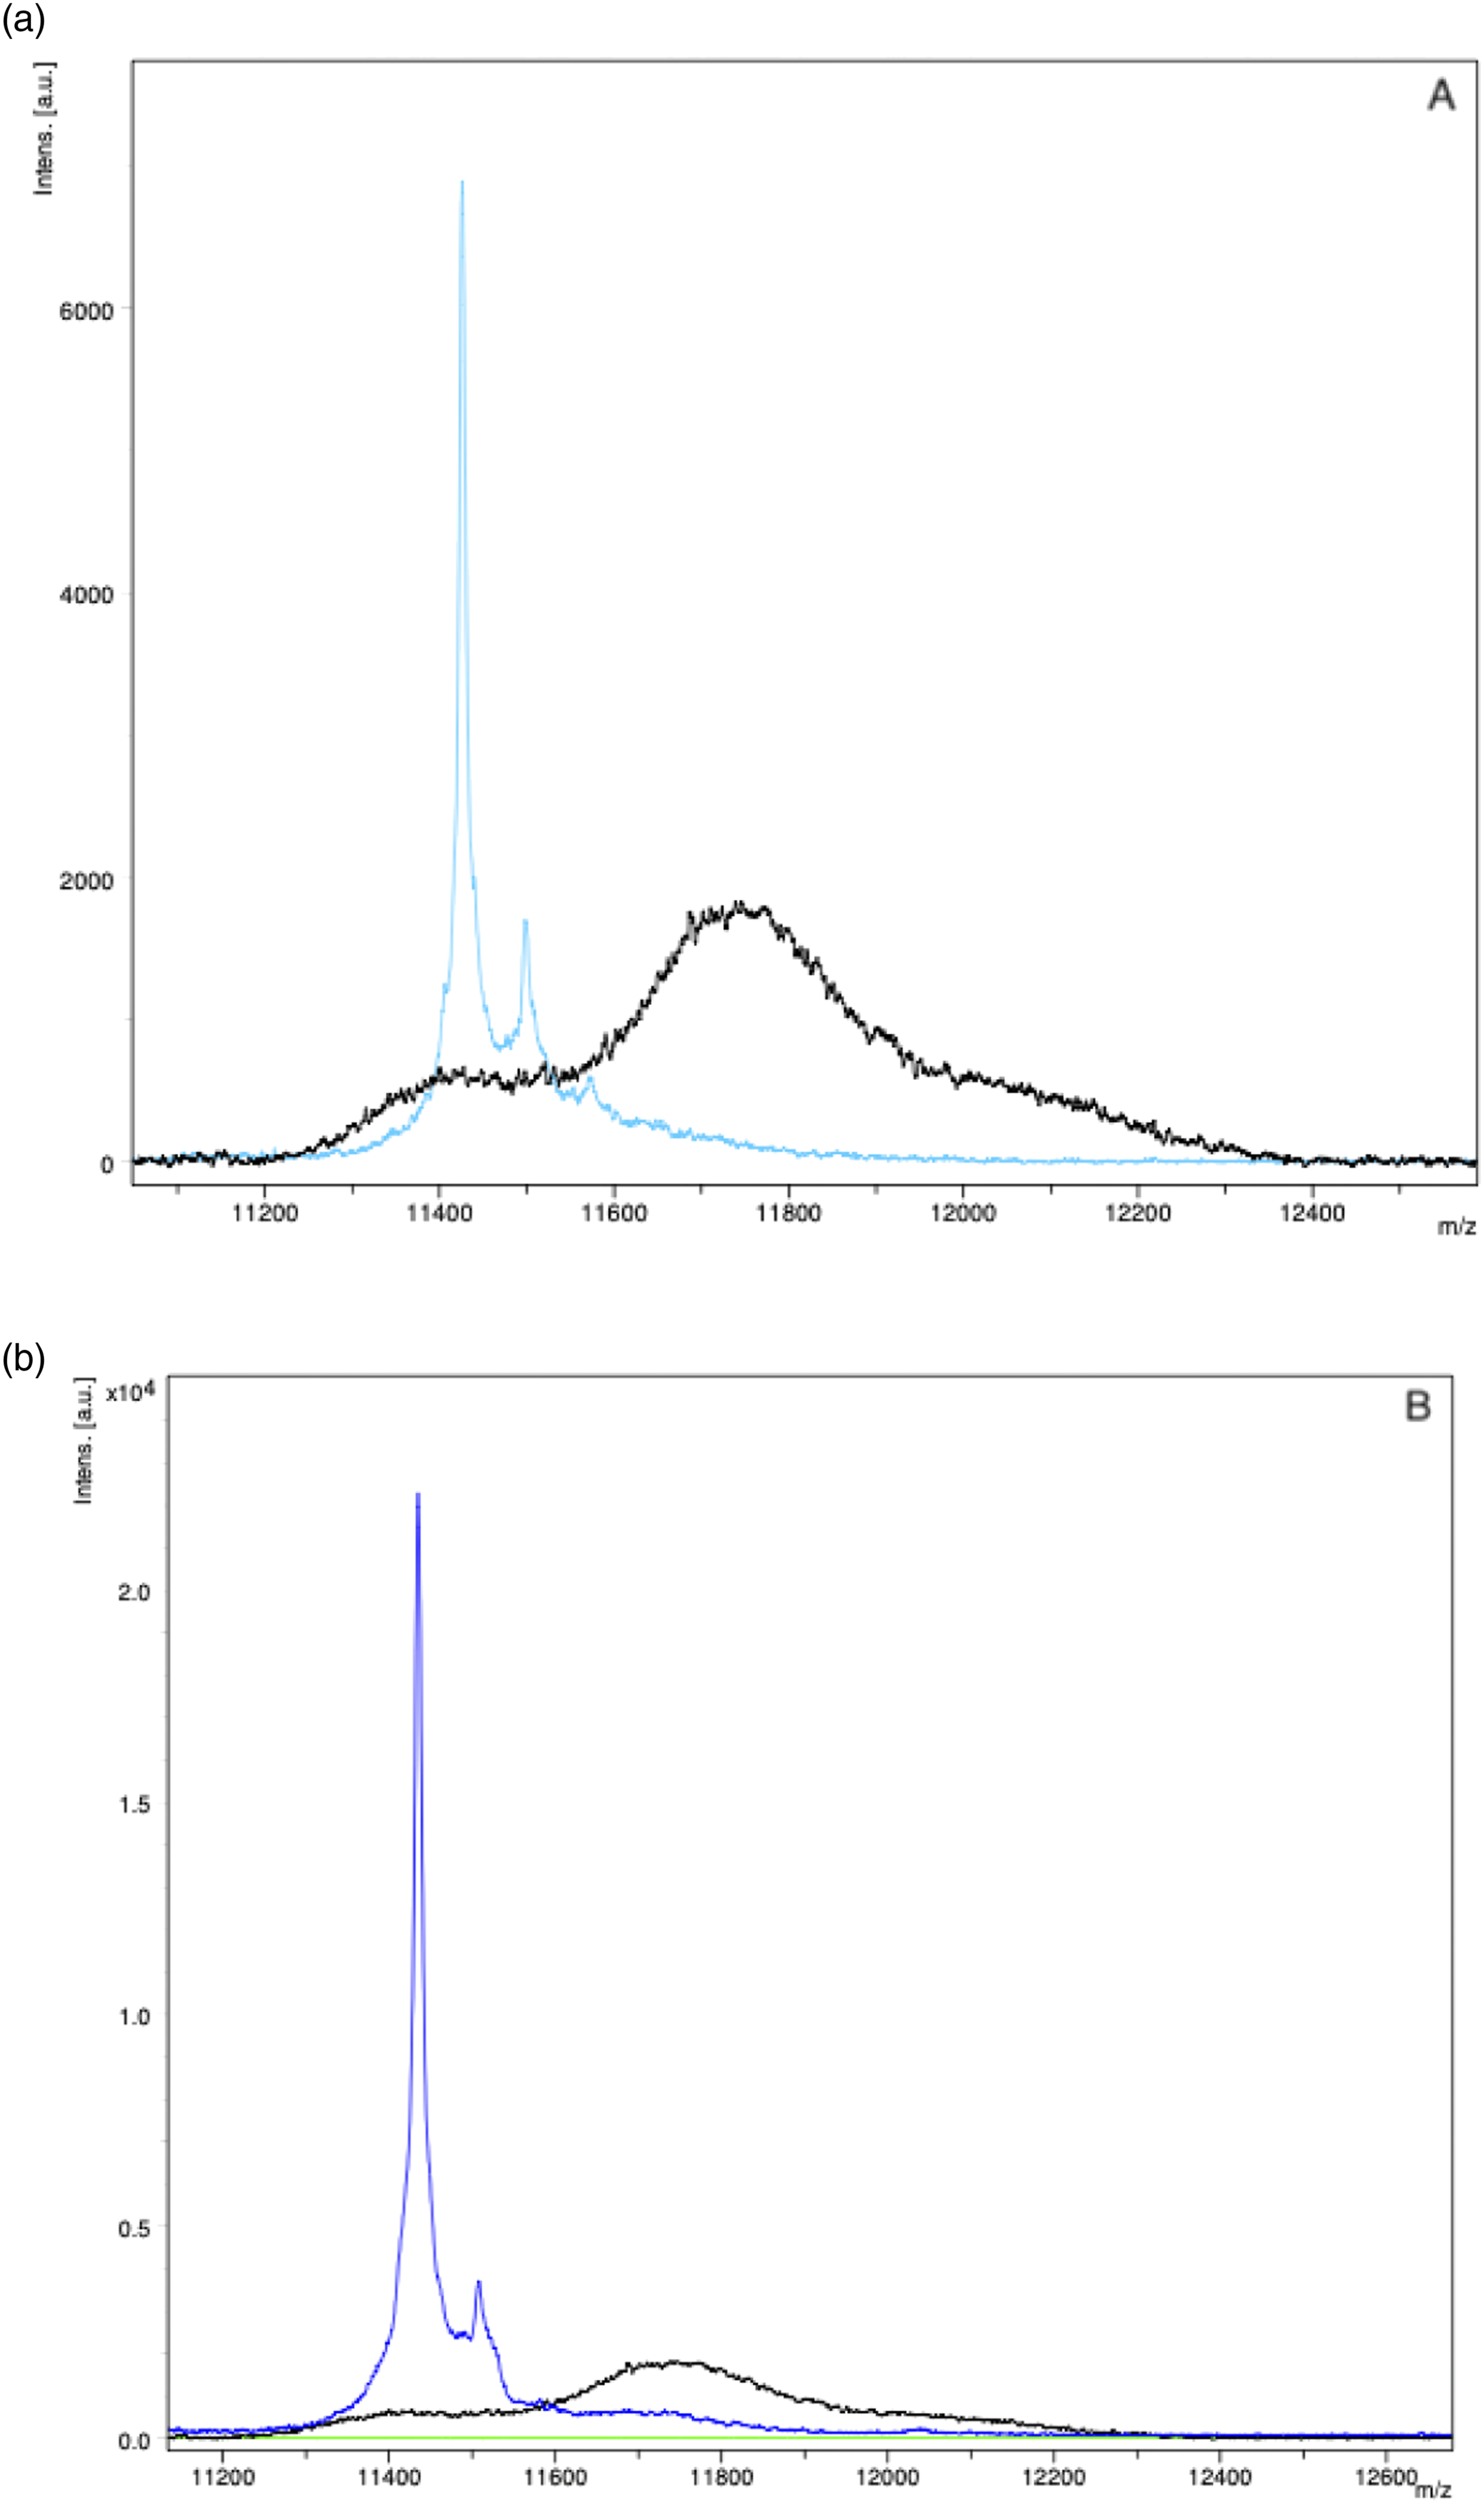
Validation of ACN precipitation results with immunoenrichment with
and
antibodies
Immunoenrichment was performed for two Serum sample with Serum with 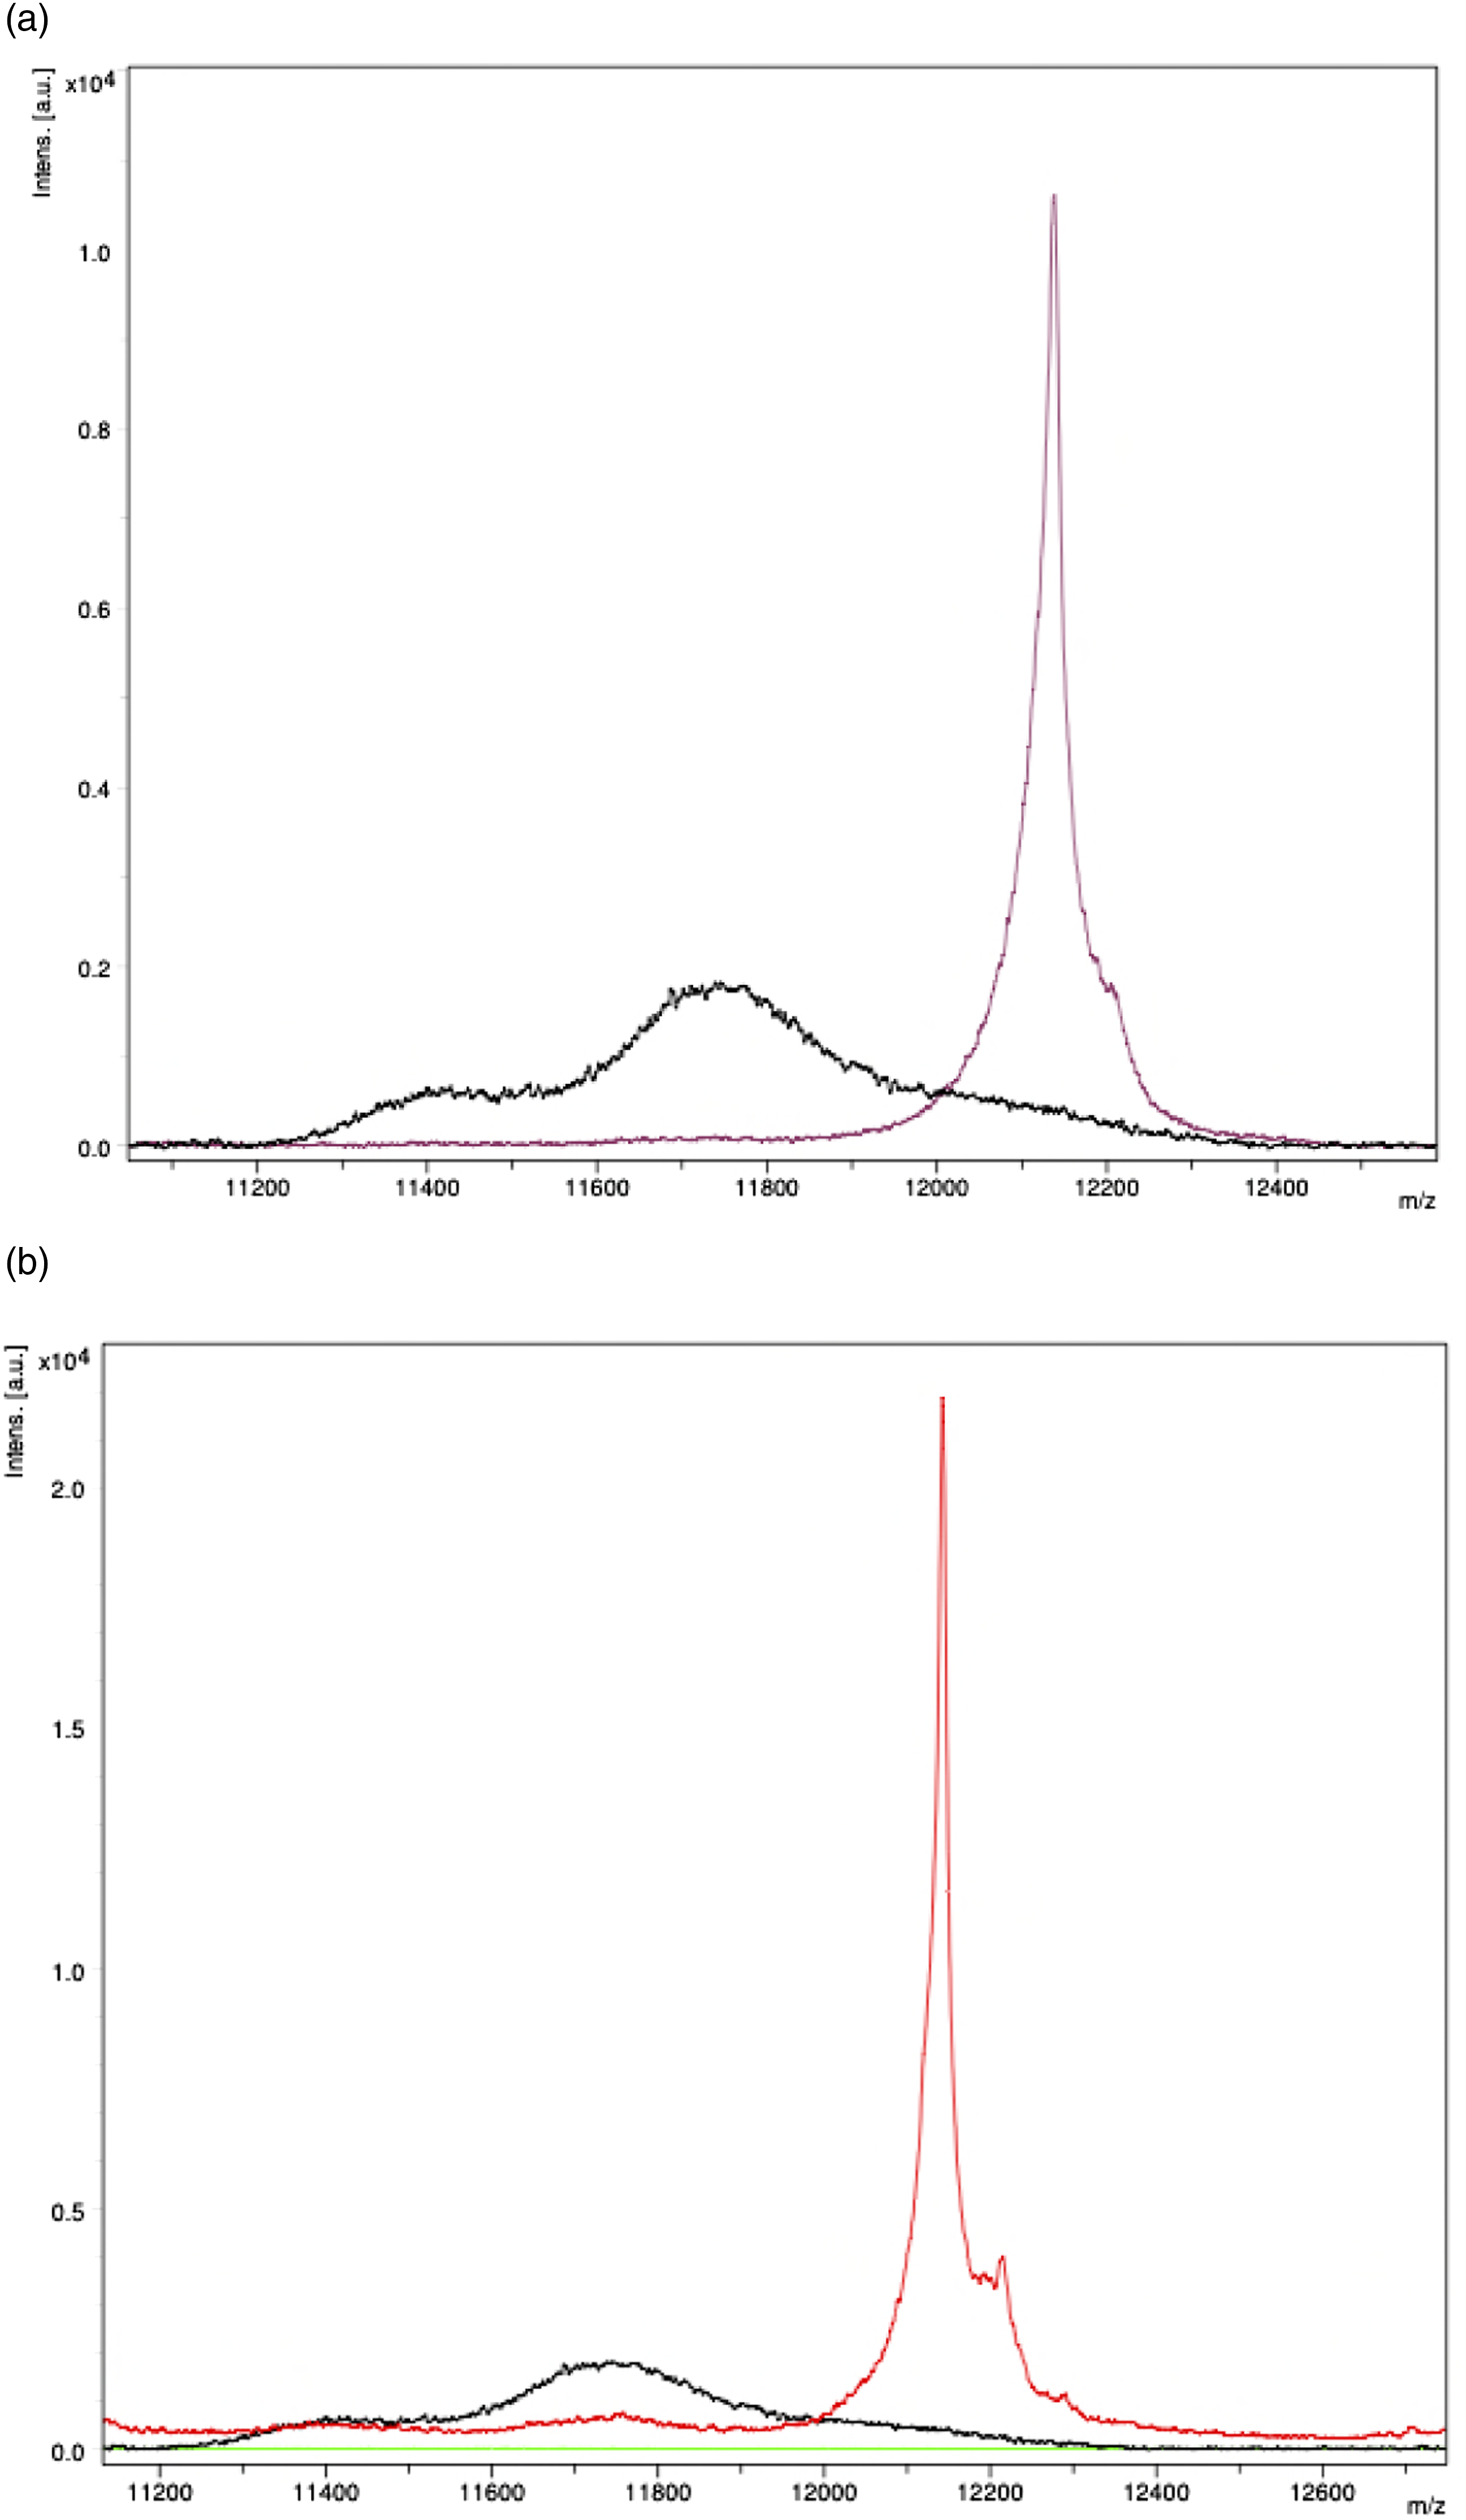
Acetonitrile precipitation of the control serum samples
The Gaussian distribution of light chains was obtained by analysing 20 control samples from the extra serum of apparently healthy blood donors. All the control samples underwent SPEP. Serum total protein was within normal limits for all samples, and SPEP did not demonstrate an M-protein (Figure 4). Mass spectra at [M + 2H]2+ charge state of all the healthy serum controls (N = 20). Gaussian distribution of polyclonal 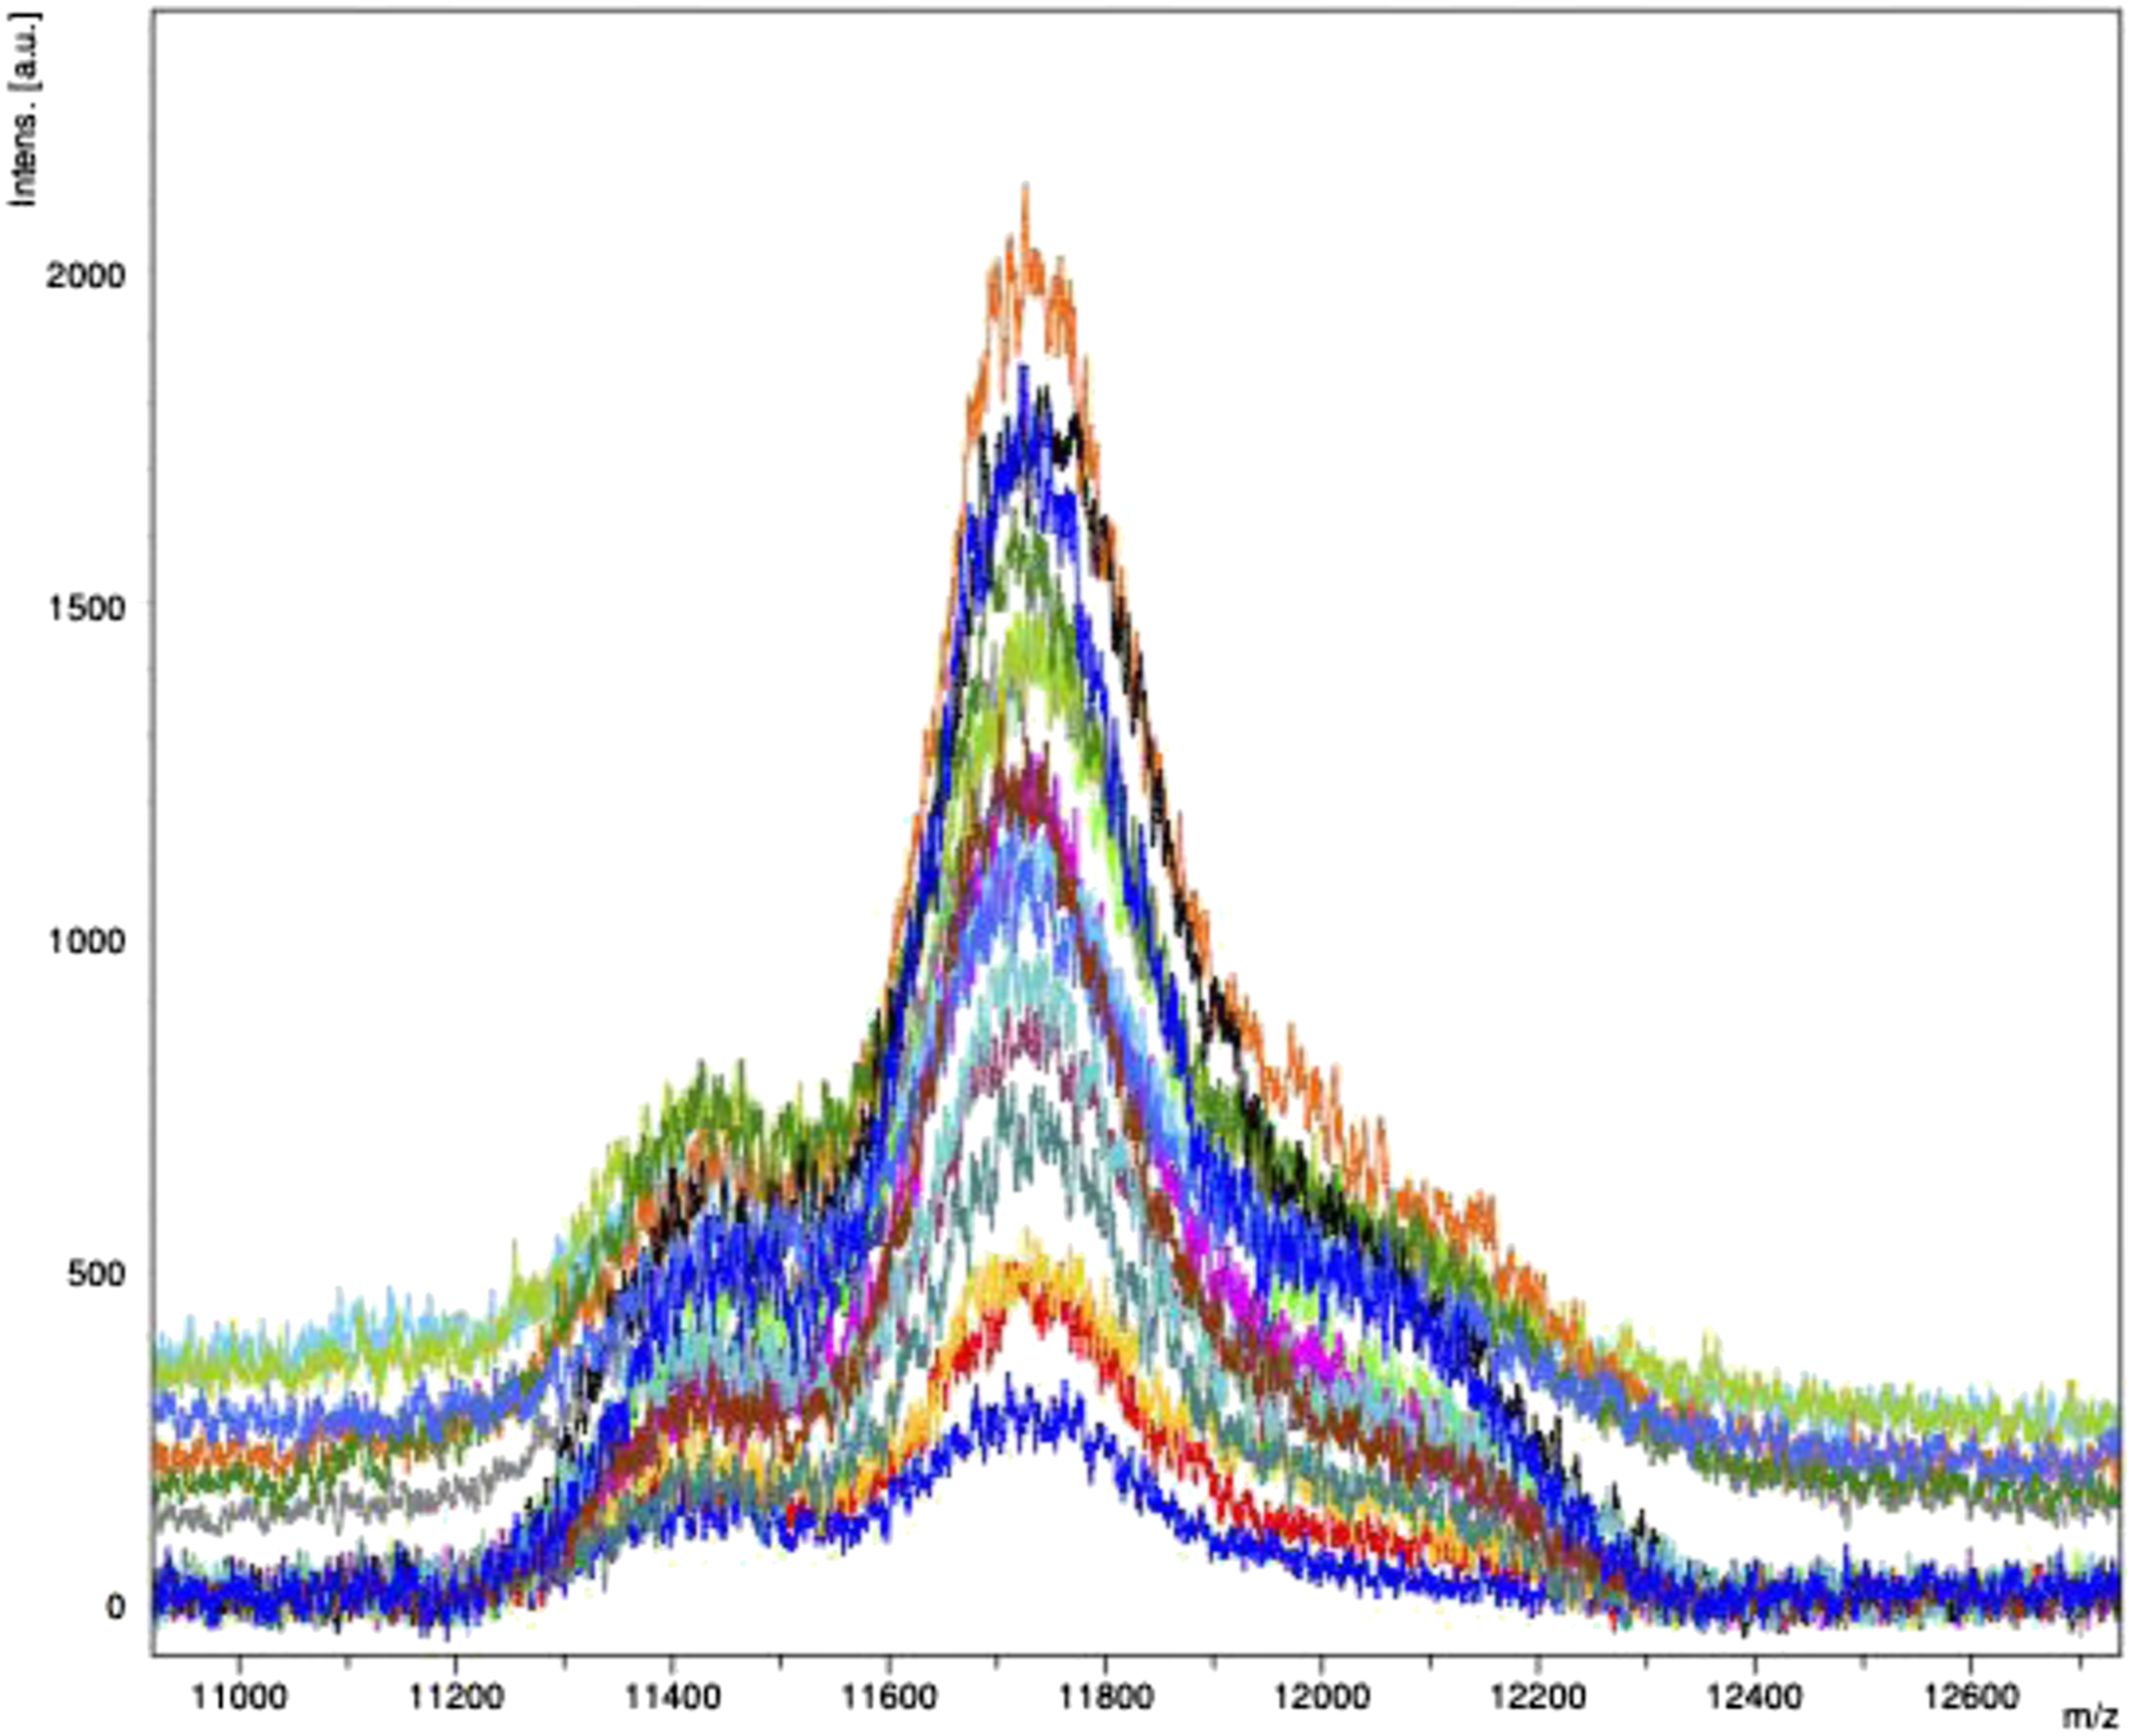
Patient samples
Two-hundred-and-two serum samples from patients with plasma cell disorders were included in the study: MM- 184 (91%); AL amyloidosis- 2 (1%); plasmacytoma- 8 (4%); MGUS- 6 (3%) and WM- 2 (1%). One-hundred-and-nineteen samples (59%) were taken from patients with newly diagnosed plasma cell disorders who received no treatment. All the others were either on or completed treatment.
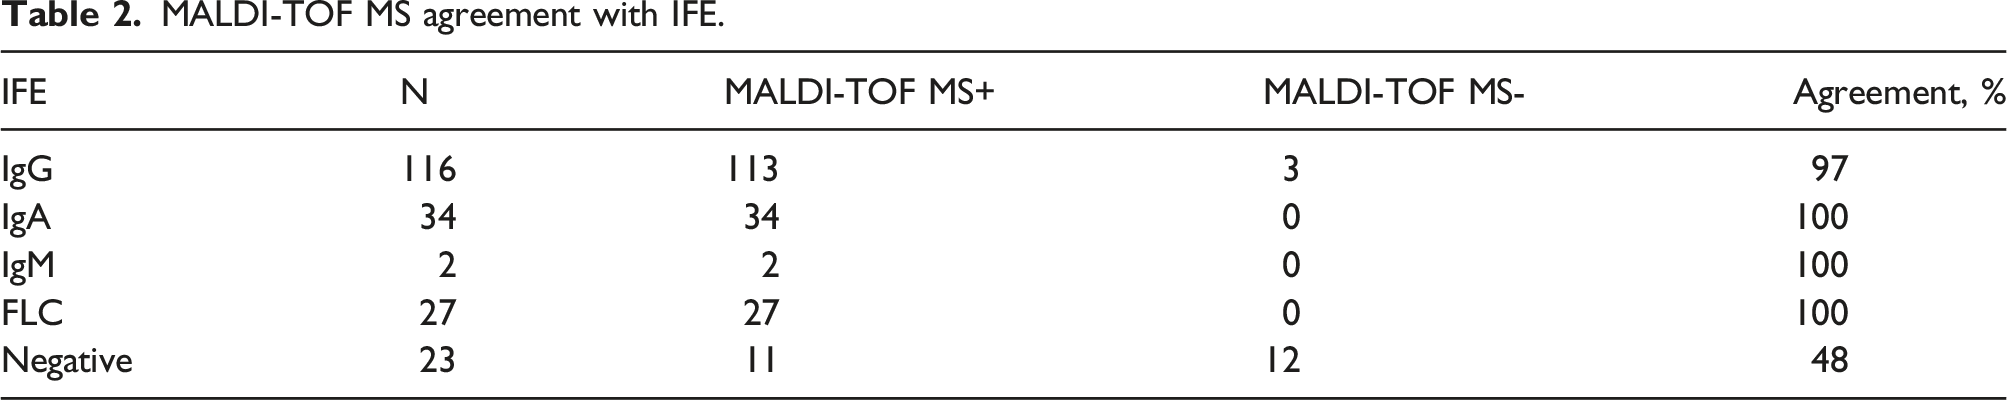
All the samples that were positive for M-protein by SPEP were identified by MALDI-TOF MS. However, out of 179 samples that were positive for M-protein by IFE, MALDI-TOF MS identified an M-protein in 176 samples (98%). Of these three samples identified by IFE and not by MALDI-TOF MS, one sample had a normal sFLC ratio. The other two samples that were negative by MALDI-TOF MS were identified as IgG
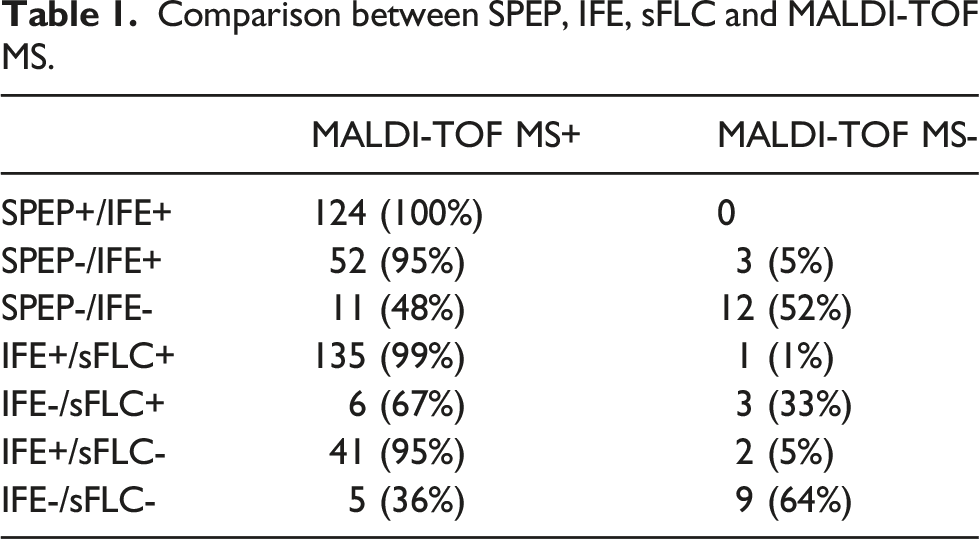
Compared to IFE, the sensitivity and specificity of M-protein identification by MALDI-TOF MS were 98.3% and 52.2%, respectively. With IFE as the reference, the presence or absence of M-protein by MALDI-TOF MS was concordant in 191 out of 202 samples (95%, p < 0.001)
Comparison between SPEP, IFE, sFLC and MALDI-TOF MS.
Six serum samples had characteristic polytypic peaks with a significant rightward shift (beyond the normal Mass spectra at [M + 2H]2+ charge state demonstrating the characteristic polytypic peaks suggestive of a glycosylated light chain (m/z: 12,569 Da).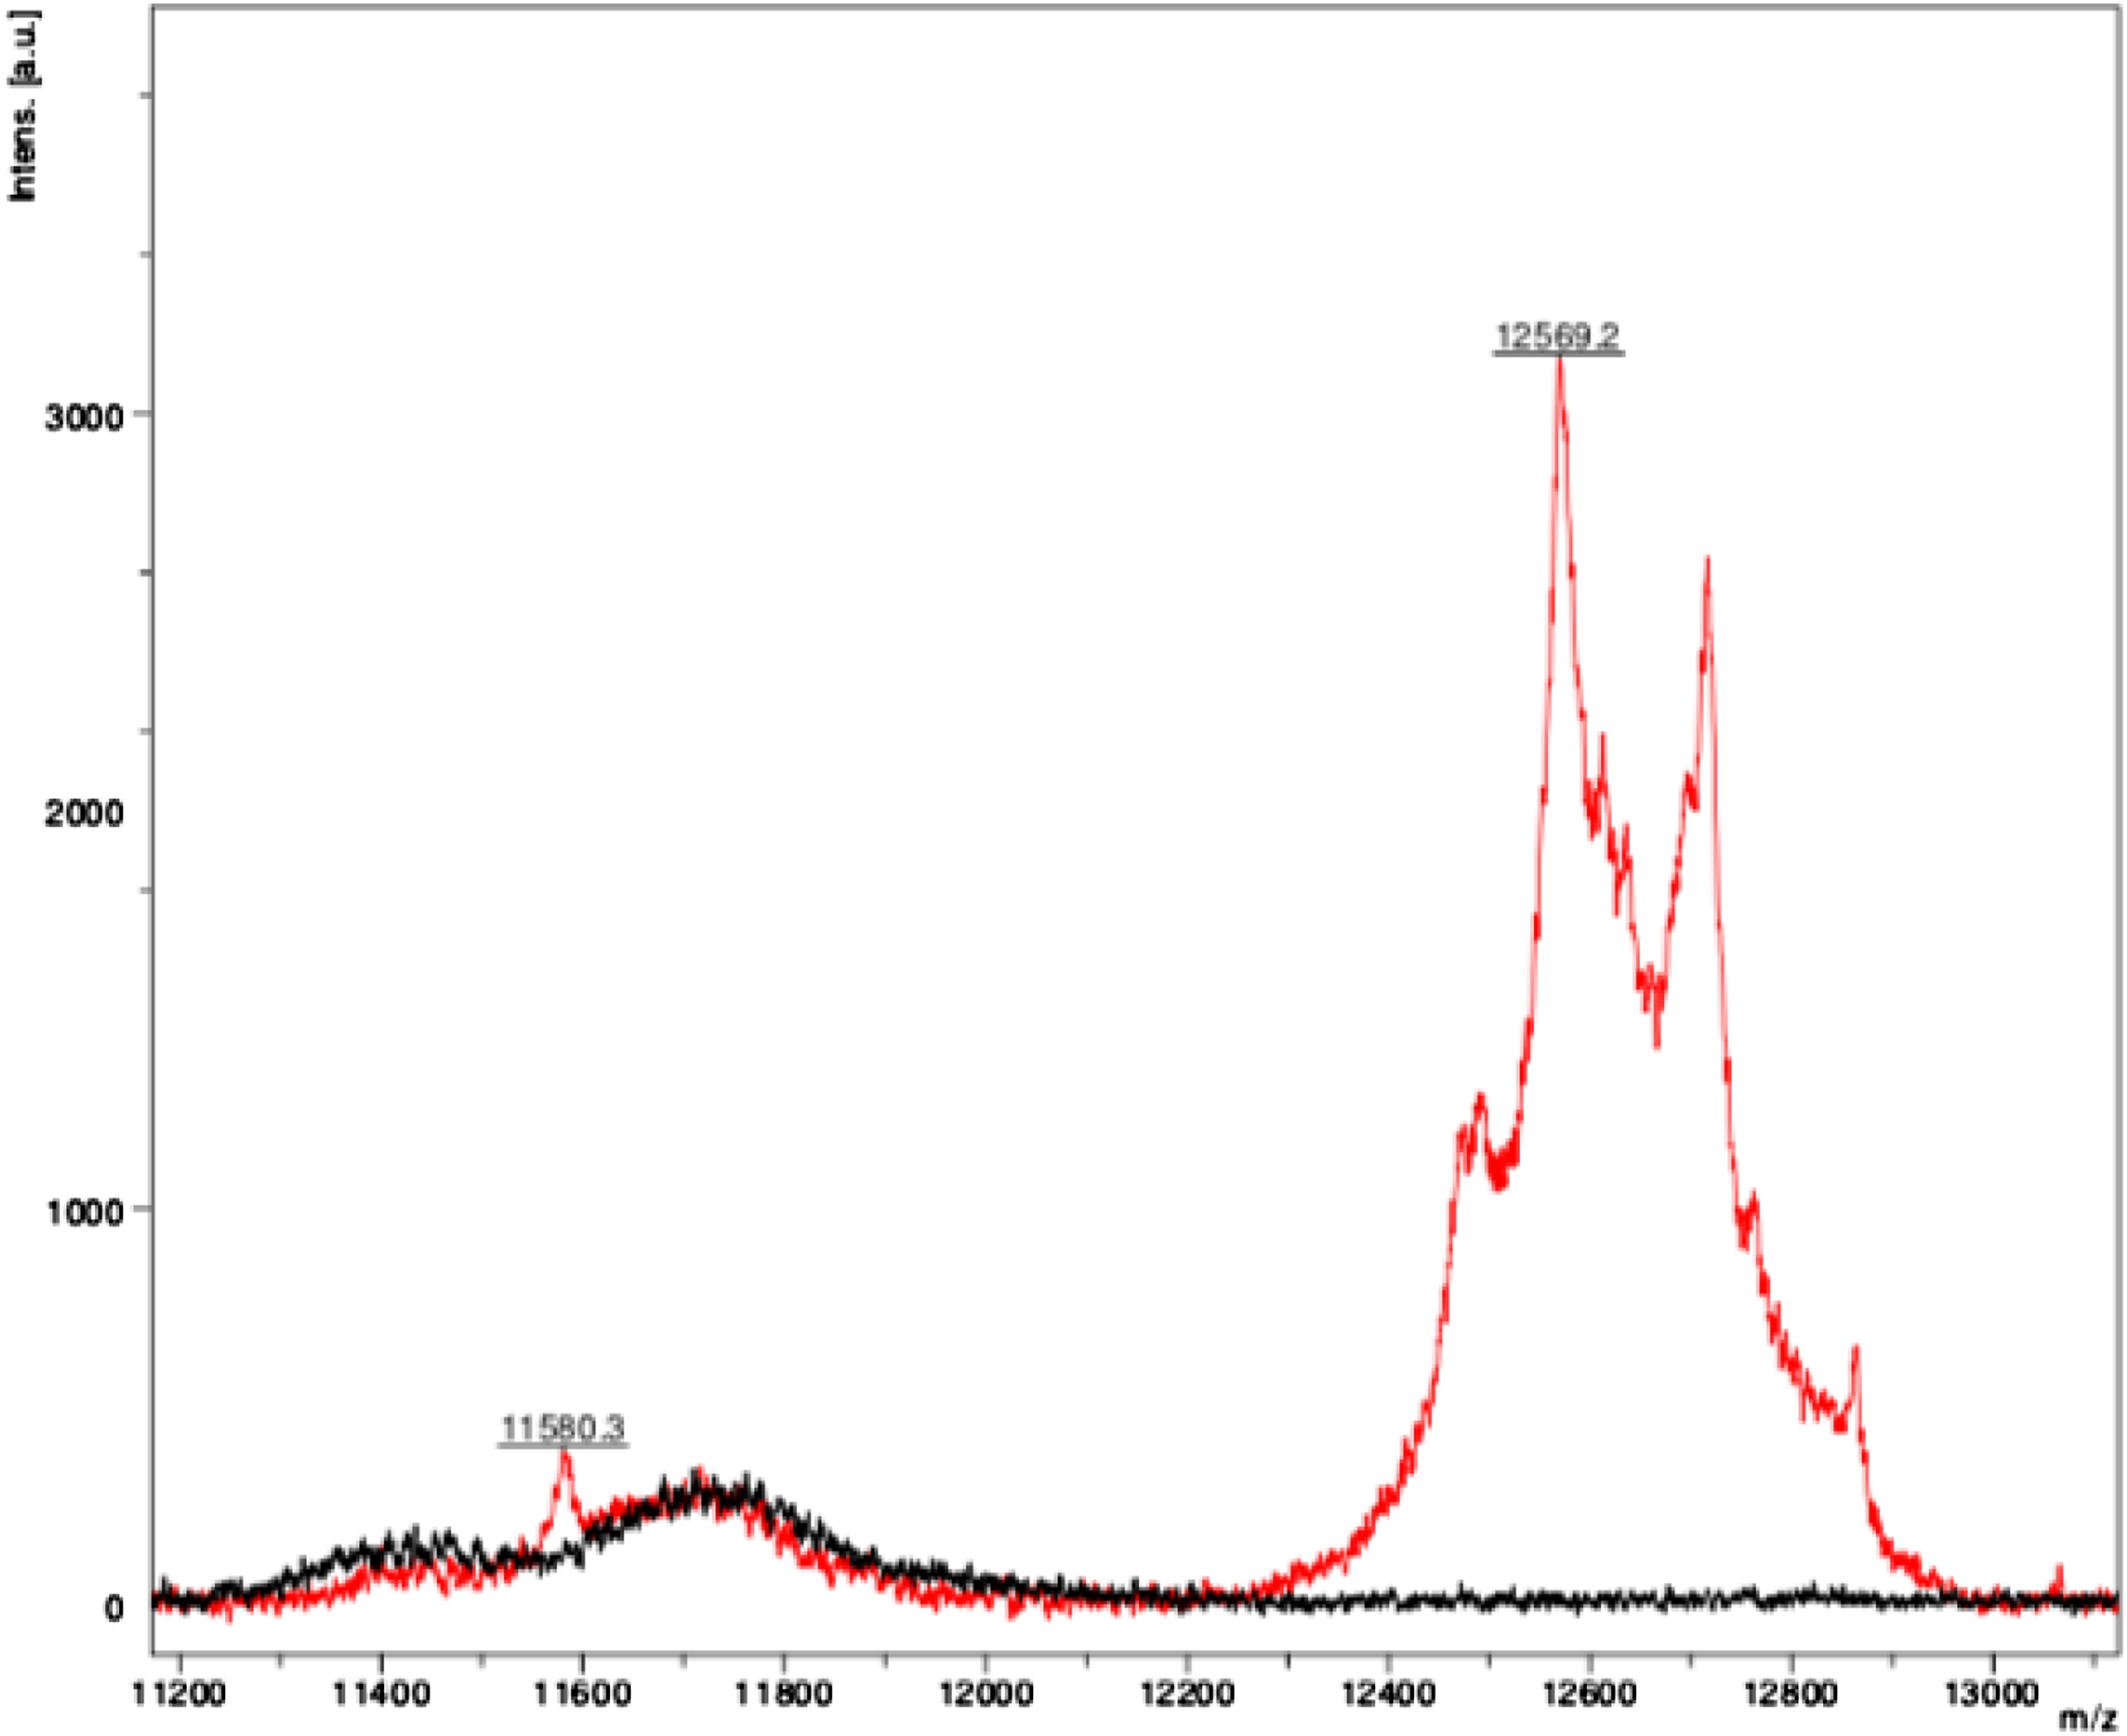
MALDI-TOF MS agreement with IFE.
All the lab members who participated as mass spectra analysts were given a training set and static images of the mass spectra. The mass spectra were assessed by three blinded analysts (authors G. Gopisetty, S. Jayavelu and S. Dhanasekar). N. Mehra was the unblinded analyst. A final consensus was obtained from all four analysts (agreement meant consensus obtained among at least three out of four analysts). Consensus was achieved in 96% (193/202) of the serum samples. Among the samples where consensus could not be achieved, the most common reason was low signal intensity, and the other reason was possible albumin contamination as described previously. 7 The images were zoomed in on the X-axis for better clarity for the samples with low signal intensity. After including one more wash step with 20% ACN, the contamination peaks were no longer visible, making the M-protein call unambiguous. There was complete consensus after the additional nine images were either zoomed in or after including the extra wash step.
MALDI-TOF MS analysis of samples with AL amyloidosis
In this report, two patients had AL amyloidosis confirmed by Congo red staining of the tissue biopsy. There was discordance in the monoclonal light chain identified by MALDI-TOF MS versus serum IFE and sFLC in both patient samples. The serum IFE and sFLC were suggestive of
Discussion
This study demonstrates the feasibility of qualitatively identifying M-protein without requiring immunoglobulin light chain-specific antibody-based immunoenrichment using agarose or sepharose beads. 12 Since antibodies are not required for M-protein analysis by MALDI-TOF MS using this method, a lack of specificity would be a possible drawback of the present methodology. However, immunoblot analysis of the ACN precipitates has revealed the presence of immunoglobulin light chains indicating that the ACN precipitation of serum resulted in enrichment of immunoglobulin light chains.
Using IFE as the gold standard, the sensitivity of M-protein identification by MALDI-TOF MS was 98%. However, the specificity was only 52%.
Our results are in line with studies published previously regarding the excellent analytical sensitivity of M-protein detection by MALDI-TOF MS.6–8 One disadvantage of this technique is that the call between
In the present report, the analysis of M-protein by ACN precipitation technique was qualitative and was defined by the m/z value of the aberrant light chain clone. Further studies will focus on developing this methodology to analyse immunoglobulin isoforms and quantitative determination of M-protein, as already reported with nanobody enrichment called MASS-FIX. 6 MASS-FIX was found to be superior to IFE in predicting progression-free survival and overall survival outcomes. 18 We envisage that ACN precipitation methodology can also serve as a useful screening technique for M-protein analysis by MALDI-TOF MS in a haematology lab in place of SPEP and serum IFE. In the future, given the cost-effectiveness of the ACN precipitation methodology relative to the antibody-based M-protein enrichment by MALDI-TOF MS, studies will be undertaken to identify the predictive value of this test compared to other peripheral blood and bone marrow response assessment tools. This would be particularly relevant in low-income and low-and-middle-income countries where the out-of-pocket expenses for cancer diagnostics and treatment are high due to limited health insurance coverage. 19
To conclude, we have developed a low-cost, reagent-based extraction process using ACN precipitation to enrich
Footnotes
Acknowledgements
We thank the Medical Oncology trainees and Ms Roja from the Blood Bank at the Institute for helping with sample collection. Presented at the American Society of Hematology (ASH) 2022 62nd Annual Meeting, Virtual, December 5-8, 2020 (poster) citation: Nikita Mehra, Gopal Gopisetty, Jayavelu S, et al: Detection of M-protein in Acetonitrile Precipitates of Serum using MALDI-TOF Mass Spectrometry: A Novel Methodology. Blood 136:36-37, 2020 (Suppl 1; abstr session 803); the International Myeloma Society Annual Meeting, Vienna, Austria, September 8-11, 2021 (poster) citation: Nikita Mehra, Gopal Gopisetty, Jayavelu S, et al: Detection of M-protein in Acetonitrile Precipitates of Serum using MALDI-TOF Mass Spectrometry: A Novel Methodology. Clinical Lymphoma, Myeloma and Leukemia 21, 2021(suppl 2, S94; abstr #101). At the conference, N. Mehra received the young investigator award for exemplary abstract for the work. International Myeloma Society Annual Meeting, Los Angeles, CA, August 25-27, 2022 (poster): Nikita Mehra, Gopal Gopisetty, Jayavelu S, et al: Screening Technique for M-proteins in Plasma cell Disorders in Acetonitrile Precipitates of Serum using MALDI-TOF Mass Spectrometry: A Comparison with Serum Immunofixation Electrophoresis and Serum Free Light Chain Assay. The published work is a part of Nikita J Mehra’s Ph.D. Thesis of The Tamil Nadu Dr. M.G.R. Medical University.
Declaration of conflicting interests
The author(s) declared the following potential conflicts of interest with respect to the research, authorship, and/or publication of this article: GG, NM, SJ, Indian provisional patent application no: 202041009443, filed on 5 March 2020.
Funding
The author(s) disclosed receipt of the following financial support for the research, authorship, and/or publication of this article: This work was supported by funds from the Cancer Institute (WIA).
Ethical approval
Control and patient samples were collected after obtaining Institutional Ethics Committee approval for carrying out a study on biomarker discovery in plasma cell disorders. Cancer Institute (WIA)- Institutional Ethics Committee, Reference Number: IEC/2019/13.
Guarantor
GG.
Contributorship
NM- Conceptualisation; methodology; data curation; investigation; resources; validation; formal analysis; writing- original draft, review and editing; visualisation; project administration.
GG- Conceptualisation; methodology; software; validation; formal analysis; investigation; resources; data curation; writing- original draft, review and editing; visualisation; project administration.
SJ and SD- Software; validation; investigation; data curation; formal analysis; visualisation.
RA- Conceptualisation; methodology; validation; resources; writing- original draft, review and editing.
JPK, PK and KK- Investigation; resources; writing- review and editing.
SR- Formal analysis; resources; writing- original draft, review and editing; visualisation.
TR- Conceptualisation; methodology; formal analysis; resources; writing- review and editing; visualisation; supervision; funding acquisition; project administration.
Correction (July 2024):
Article updated online to include ‘The published work is a part of Nikita J Mehra’s Ph.D. Thesis of The Tamil Nadu Dr. M.G.R. Medical University.’ in the ‘Acknowledgements’ section.