
Abstract
Background
Changes were made to the Australian guidelines for vitamin D testing in November 2014 which restricted the patients who could be tested and reimbursed under the Medical Benefits Schedule. A retrospective study was conducted to assess the impact of the changes.
Methods
Data from 588,021 cases tested for vitamin D over the period of 2014 to 2017 were obtained and the results in 149,808 cases tested before the change in guidelines were compared to 438,213 cases tested afterwards.
Results
The results showed an initial fall in requests took place after the introduction of changes, but request numbers had returned to pre-change levels by November 2016. Furthermore, following the intervention, there was a significant reduction in the number of cases of vitamin D deficiency (<50 nmol/L) detected after November 2014 (P < 0.001) with odds ratio (OR) calculations showing the strongest effect for the sub-cohort of 0–20 nmol/L (OR = 1.77). For patient vitamin D levels >71 nmol/L, the pattern of detection inverted with more cases of sufficiency being detected after the intervention than before (OR from 0.84 to 0.48, P <0.001).
Conclusions
The failure to show a sustained reduction in vitamin D testing is a common finding with demand management strategies to limit test requesting. More significant is the failure of the intervention to improve the detection of vitamin D deficiency. These failures highlight the need for better tools to manage test requesting including the use of audit and outcomes measurement to guide future interventions.
Introduction
The increasing cost of healthcare in many countries has led funders, whether governments or insurers, to find ways to reduce usage. 1 In the case of laboratory testing where the focus is on costs rather than outcomes, strategies to reduce such costs have concentrated on restricting the volume or type of tests that can be requested. These strategies are variously named as laboratory test utilization management or more simply as demand management. An extensive literature exists on a wide range of demand management interventions together with their limitations. A recent Q and A paper in Clinical Chemistry reviewed more recent interventions in several different countries and posed several unanswered questions related to demand management. 2
In Australia, laboratory test utilization is guided by the Federal Government’s Medical Benefits Schedule (MBS) which is applied universally across Australia and determines which tests will be reimbursed and for which clinical indications. Thus, demand management strategies include changes to the MBS that place limits on test requests to retain eligibility for reimbursement. As part of a recent major review of the MBS, including laboratory testing, a review of the literature on demand management was recently conducted for the Department of Health by the National Prescribing Service. The draft outcomes of this review have been made public and are likely to include new strategies to reduce unnecessary testing including more use of clinical decision support systems to help requesting doctors. 3
A relatively recent demand management strategy in Australia related to changes to the indications for Vitamin D (25-hydroxy (25(OH)D) and 1,25-dihydroxy vitamin D) testing. Requesting data indicated that many general practitioners (GPs) were screening for vitamin D deficiency despite there being no evidence for the benefit of such screening. Accordingly the Australian Department of Health published new requesting guidelines which restricted testing to patients with specific conditions where there was a high risk of developing vitamin D deficiency. 4 These new guidelines listed the symptoms and risk factors associated with vitamin D deficiency as a way to guide requesting but did not include recommendations on testing for patients taking vitamin D supplementation. Testing guidelines such as these apply nationally to all requesting GPs and to the pathology practices where the majority of GP testing is conducted. However, there may be some variation in application between GP practices. The full guideline can be found on the Australian Department of Health website. 4
Similar to many countries, there has been a large increase in Vitamin D testing in Australia with a 94-fold increase over the preceding 10 years. 5 While various factors were believed to be the cause of this increase, the dimension of the increase and the cost to the community, without any demonstration of improved patient outcome, led Bilinski et al. to conclude that the above changes to Vitamin D testing guidelines were required. 6
Following implementation of these changes in 2014, a report analysing MBS data from the first eight months after implementation of restricted testing indicated a marked reduction of 29% over a full year with an estimated financial saving of $AU39.46 million. 7 A more recent publication confirmed an immediate reduction in vitamin D test requests from General Practitioners up to March 2016, 14 months after the introduction of these guidelines. 8 These authors also described a decrease in the frequency of testing of those at higher risk of deficiency with only a small improvement in detection of patients with moderate to severe vitamin D deficiency which is defined as a serum 25(OH)D <25 nmol/L according to the position statement from the Royal College of Pathologists of Australasia, which defines vitamin D sufficiency as a 25(OH)D level of >50 nmol/L and mild deficiency as 25–50 nmol/L. 9
It is not known whether these reductions in testing numbers and costs have been sustained after March 2016. Also, we do not know if there is a risk that some patients with genuine vitamin D deficiency may be missed because of these changes to testing guidelines. To address this issue, we now report a retrospective analysis of the results from patients on whom 25-hydroxyvitamin D testing was requested before and for 33 months after the change to the MBS schedule, hereafter referred to as the intervention. We also assessed the effect of the intervention on the vitamin D status amongst these patients as indicated by their serum 25-hydroxyvitamin D levels.
Materials and methods
Retrospective data spanning the period from 1 January 2014 to 31 August 2017 were obtained from Sullivan Nicolaides Pathology (SNP, Brisbane, Australia), a private pathology practice. This practice is one of two servicing the vast majority of general practitioners in Brisbane and across the Queensland state with population approaching six million, over 2500 km long and spanning the tropic of Capricorn.
SNP data comprised 595,597 individual samples tested for serum 25(OH)D and other analytes over the above-mentioned 2014–2017 period, with an age range of 18–90 years old (female 72.7%–male 27.3%). No specific patient identifiers were provided.
25(OH)D was measured using the DiaSorin Liaison XL automated non-isotopic immunoassay analyser (DiaSorin, Sydney Australia) which has 100% cross reactivity for 25 OH Vitamin D3 and 25 OH Vitamin D2 in serum. The interassay imprecision at serum 25(OH)D levels of 59 nmol/L, 124 nmol/L and 290 nmol/L was 6.1%, 5.1% and 5.9%, respectively. Inter-batch reagent variation is minimized by only accepting reagents for routine use when the results of internal QC material and 100 patients’ samples (with values evenly distributed across a range from 10 to 200 nmol/L) from the new reagent and current reagent batch differ by <5%. All samples were analysed in the one laboratory and there was no change in method during the study period.
The changes to the MBS guideline which restricted vitamin D testing to patients with specific conditions where there was a high risk of developing vitamin D deficiency were introduced in November 2014. A total of 149,808 pre-November 2014 cases was available, with 438,213 cases representing the post–November 2014 category tested according to the new vitamin D testing requirements. All were single patients’ samples with multiple samples excluded from the analysis. Statistical analyses were adjusted to accommodate pre- and post-intervention sample size differences (see below).
The pre- and post-November 2014 cohorts were subsequently arranged into separate classes (pre- and post-intervention, respectively). All cases tested during November 2014 were excluded from the analyses (reducing the sample total to 588,021), as were cases younger than 18 years, or older than 90 years, and cases with an indeterminate sex.
Serum 25(OH)D levels were arranged into categories reflecting moderate to severe deficiency (<25 nmol/L), mild deficiency (<50 nmol/L) or sufficiency (>50 nmol/L) and representing increasing ranges of 10 nmol/L per category, as reported by the SNP database for 25(OH)D, except of the low category of <20 nmol/L, and the category of ≥101 nmol/L termed high. The 25(OH)D data spanned serum concentrations of 8–1248 nmol/L.
To see if changes in 25(OH)D requesting were reflective of general changes in pathology ordering, we also analysed changes in electrolyte requests over the same period.
Time series analysis was conducted using generalized least squares regression. Both series incorporated an intercept, trend, monthly effects and two interventions (in December 2014 and December 2015). The Vitamin D series also incorporated a first-order moving average correlation between observations, while the electrolyte series incorporated a first-order autoregressive correlation between observations. For this investigation, additional pre-intervention data were obtained (from January 2012) to increase the degrees of freedom available for estimating monthly effects.
Data plots were prepared with RStudio 1.2.5033 running version R3.6.1. 10 Statistical analyses using Pearson's Chi-squared test with Yates' continuity correction, with R statistical programming (version 3.4.1) were performed. Statistical significance between stratified serum 25(OH)D time classes (pre- or post-intervention) and the calculation of Odds Ratios (as used in Table 2) were performed with the Fisher test, also using R statistical programming (version 3.4.1). 10 For all analyses conducted, statistical significance was set at P ≤ 0.05 (df = 1).
Impact of a change to MBS guidelines for vitamin D testing on the detection of sufficiency, mild deficiency and moderate to severe deficiency states of serum vitamin D as assessed by Odds Ratios.
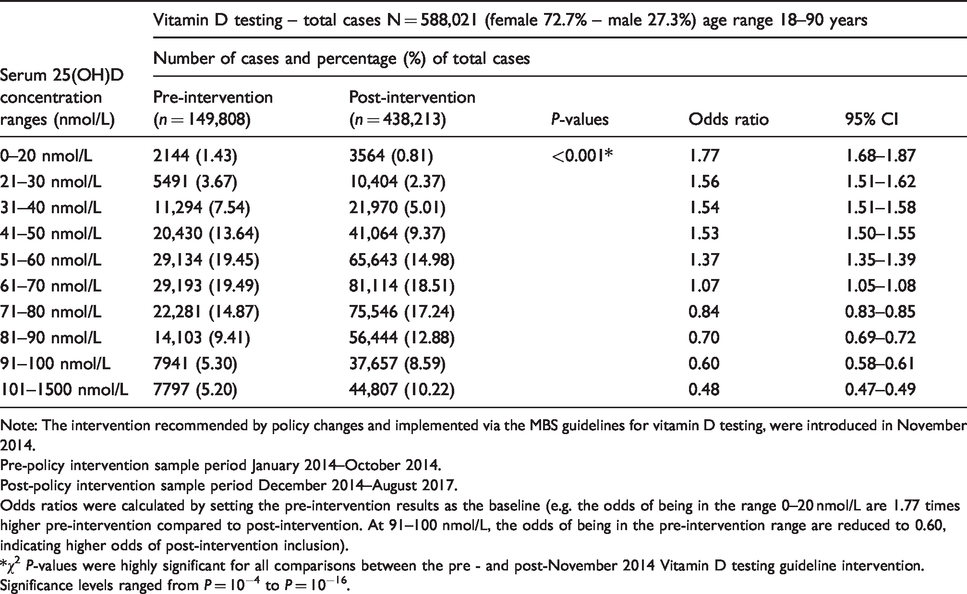
Note: The intervention recommended by policy changes and implemented via the MBS guidelines for vitamin D testing, were introduced in November 2014.
Pre-policy intervention sample period January 2014–October 2014.
Post-policy intervention sample period December 2014–August 2017.
Odds ratios were calculated by setting the pre-intervention results as the baseline (e.g. the odds of being in the range 0–20 nmol/L are 1.77 times higher pre-intervention compared to post-intervention. At 91–100 nmol/L, the odds of being in the pre-intervention range are reduced to 0.60, indicating higher odds of post-intervention inclusion).
*χ2 P-values were highly significant for all comparisons between the pre - and post-November 2014 Vitamin D testing guideline intervention. Significance levels ranged from P = 10−4 to P = 10−16.
Results
The monthly numbers of requests for vitamin D tests over the time period January 2012 to August 2017 are presented in Figure 1 as a time-series analysis. They show that while there was an initial fall in requests from January 2015 through to October 2016, request numbers returned to levels above those recorded before the intervention by November 2016. Furthermore, they showed an exponential rate of increase with an estimated monthly increase after November 2016 of 1.7% (95% CI 1.2–1.8%) compared to pre-November 2014 of 1.01% (range 0.7–1.4%). The changes in electrolyte requests also shown in Figure 1 are in a similar direction to those of Vitamin D, but the increase after the intervention is a linear increase of a much lower magnitude (a mean monthly increase of 507 tests, 95% CI 295–720 tests per month).
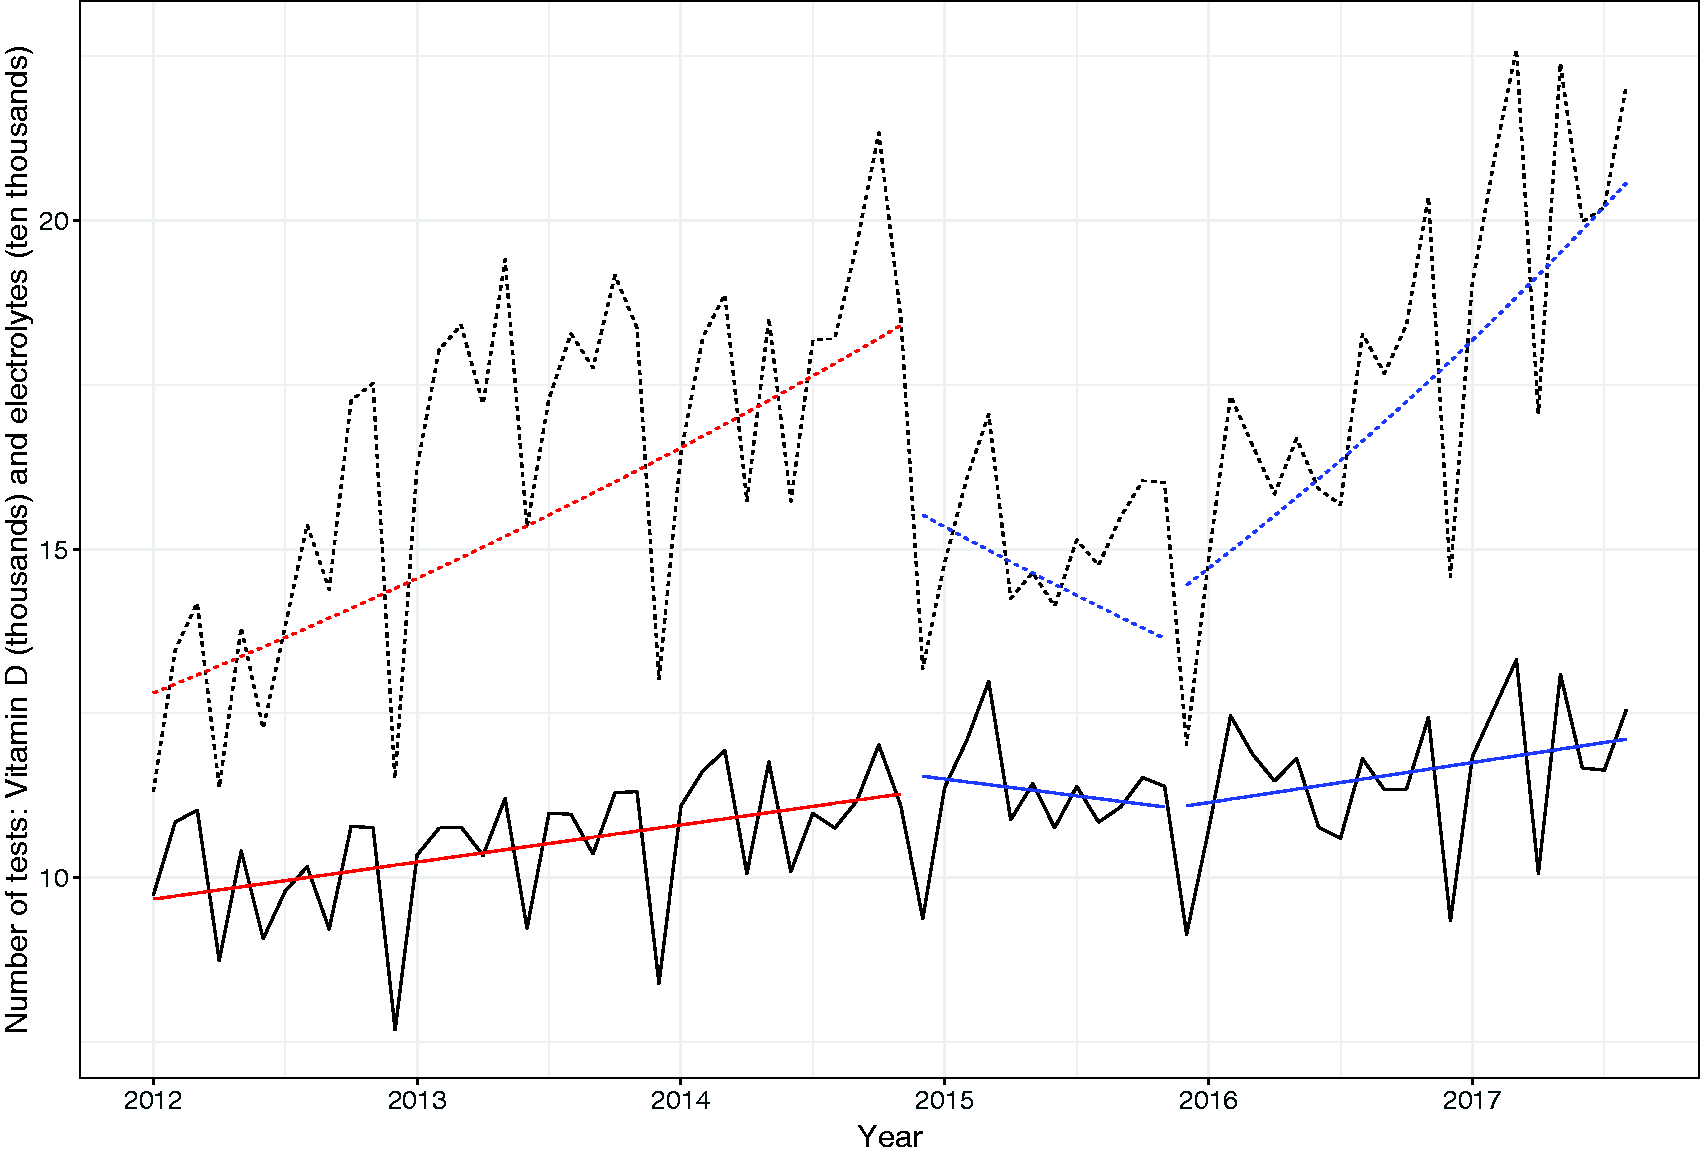
Comparison of Vitamin D and electrolyte test requests per month for the years 2012–2017. Dotted line indicates vitamin D requests; Solid line indicates electrolyte requests.
An important question to address with this study was the effectiveness of the guidelines to improve the rate of diagnosis of vitamin D deficiency. The proportion of all insufficient cases with serum 25(OH)D levels <50 nmol/L and <25 nmol/L, before and after the intervention, is summarized in Table 1. The percentage of <50 nmol/L and <25 nmol/L cases detected was higher for the pre-intervention period (151,512 samples measured between January and October 2014). However, there was a longer period of data collection post-intervention compared to pre-intervention. To counter the possible influence of the data-imbalance, the post-intervention dataset was randomized, and a sub-sample matched to the total number of pre-intervention cases (Table 1). Whether for the matched sample size of 151,512 cases, or the complete post-intervention data sample, the proportions detected for <25 nmol/L and <50 nmol/L were similar.
Prevalence of low and critically low 25(OH) vitamin D results (nmol/L) before (pre-) and after (post-) the MBS guideline intervention on vitamin D testing.
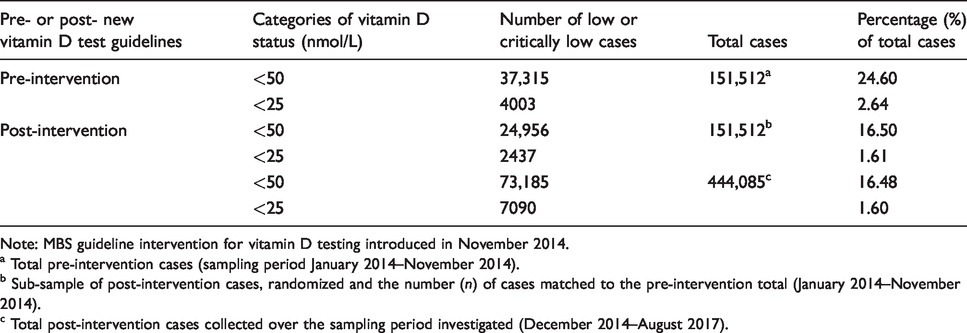
Note: MBS guideline intervention for vitamin D testing introduced in November 2014.
a Total pre-intervention cases (sampling period January 2014–November 2014).
b Sub-sample of post-intervention cases, randomized and the number (n) of cases matched to the pre-intervention total (January 2014–November 2014).
c Total post-intervention cases collected over the sampling period investigated (December 2014–August 2017).
To obtain a more detailed picture of vitamin D status before and after the intervention, we stratified the serum 25(OH)D levels into 10 nmol/L concentration bands covering the entire range detected for this cohort (8–1248 nmol/L) and compared the number in each band according to the period of measurement before or after the intervention (Table 2). The pattern of results demonstrated significantly fewer serum 25(OH)D cases <50 nmol/L detected after November 2014 (P < 0.001), with odds ratio (OR) calculations showing the strongest effect for the sub-cohort of 0–20 nmol/L (OR = 1.77) (namely, the odds of being in the pre-intervention range were 1.77 times higher when compared to the same serum 25(OH)D range post-intervention). While still highly significant, the OR ratio reduced to 1.37 for the 51–60 nmol/L range, with a gradual reduction of OR from 0–20 to 51–60 nmol/L observed. For patients with serum 25(OH)D levels between 71 and 80 to 101 and 1500 nmol/L, the pattern of detection inverted, with significantly more cases of vitamin D sufficiency detected post-intervention (Table 2). The OR results for vitamin D sufficiency above 71 nmol/L ranged from 0.48 to 0.84.
Discussion
Our study aimed to identify the impact of an intervention in November 2014 to limit test requests for vitamin D that were eligible for reimbursement by the MBS . 4 As well as overall test numbers, we sought to identify how the intervention impacted on the ability of medical practitioners to identify patients with a suspected increased risk of vitamin D deficiency.
Our results confirm a previous report of a significant and immediate reduction of vitamin D test requests following the intervention. 8 However, our results show that this was only a temporary reduction, and that by 1 November 2016 through until the end of our study, 31 August 2017, request numbers remained above the levels for the equivalent month prior to the intervention in 2014. These monthly data reveal that the marked decrease in test request numbers existed only for 13 months (1 December 2014 until 31 January 2016) after which an increase over the previous year for the equivalent month is detected.
We compared the changes in vitamin D requests to that of electrolyte tests in order to obtain an overall assessment of pathology requesting. While we acknowledge that post-intervention there was also a fall in electrolyte tests, we cannot identify the cause of this fall. However, we do not believe it detracts from the main finding that after a relatively short period following the intervention, vitamin D requests increased to levels in excess of those before the change in guidelines. This pattern of data has recently been confirmed by the report of Gordon et al. who show that vitamin D requests have since returned to the same levels as those immediately before the intervention. 11
Our findings differ to that of Gonzalez-Chica et al., 8 in that we found that the detection rate of patients with severe deficiency (serum 25(OH)D levels <25 nmol/L) was significantly reduced from 2.6% before to 1.6% of patients tested after the intervention; Gonzalez-Chica et al. found some 5.4% of patients at the slightly higher level of serum 25(OH)D <30 nmol/L before compared to 6.4% afterwards. However, we found a similar difference between detection rates before and after when the definition of vitamin D deficiency was extended to the level of 50 nmol/L as recommended by various Medical Specialist societies. 9 , 12
When examining the proportions of patients who were sufficient, mildly or moderately deficient and tested for vitamin D before and after the intervention, we consistently found that the MBS Vitamin D testing guidelines led medical practitioners to select patients for vitamin D testing who were more likely to have an adequate vitamin D status.
It is only possible to speculate on the reasons for the changes in testing described above. Specialist medical societies during the time of the intervention were providing other guidelines for the requesting of vitamin D testing as well as providing recommendations for a critical level of serum 25(OH)D above which represents adequate vitamin D status. 9 , 12 These may have influenced testing practices. As well, many reviews were published in leading international medical journals reporting negative results for the efficacy of vitamin D supplementation regarding treating various disease states. However, despite this evidence, test request numbers returned and eventually increased above pre-guideline levels.
Why fewer patients with true vitamin D deficiency were detected is difficult to understand. Perhaps it could be that in the period when the number of test requests was significantly reduced, medical practitioners were recommending vitamin D supplementation without prior testing. This could have resulted in a greater proportion of patients who were adequately supplemented being assessed for vitamin D status, particularly in the period November 2016 to October 2017. Indeed, the number of patients in the category designated as high (serum 25(OH)D level >100 nmol/L) increased markedly and the increase in these patients, for which adverse effects of vitamin D supplementation have been reported, 13 could be the result of this practice. Alternatively, the intervention could have had the effect of only discouraging testing in patients who personally did not insist on such testing. It is possible that patients who are aware of the requirements for an adequate vitamin D status are better educated and health conscious and so are vitamin D replete. Patients who did not insist on testing were possibly less health literate, ignorant of the benefits of an adequate vitamin D status and possibly vitamin D deficient.
We cannot completely rule out the possibility that after the change in guidelines, more people were purchasing and taking over the counter vitamin D supplements and hence there were less deficient patients overall in the study population. We believe several factors make that unlikely. First is the fact that most of the samples in this study were collected from patients located in Brisbane which is essentially a tropical location with relatively larger amounts of sunshine, particularly in the winter. It is well documented that there is less vitamin D deficiency in locations with longer sunshine hours, 14 and this also explains the lower rate of Vitamin D deficiency in Brisbane and Queensland generally compared to more southern cities and states in Australia. Second, given that across Australia only 5% of the population is taking vitamin D supplements, 15 it is likely that this figure in Queensland and Brisbane is even lower given the degree of sunshine and the prevalence of light clothing including short sleeves or sleeveless garments enabling more exposure of the skin to sunlight all year round.
The failure to sustain a reduction in testing and furthermore, to lead to a reduction in the identification of patients with vitamin D deficiency, is common to many studies of demand management. The review of the literature on demand management recently conducted for the Australian Department of Health by the National Prescribing Service aimed to determine what interventions improve the appropriateness and clinical utility of diagnostic investigations requested by medical practitioners. 4 The evidence that was examined included several systematic reviews conducted in the last decade and which dealt with various strategies including clinical decision support, educational interventions, audit and feedback, payment systems and finally quality improvement exercises such as modifications to request forms. The overall conclusion from the review was that there was more, albeit modest, evidence for clinical decision support systems compared to other interventions.
It may be noteworthy that in Australia, unlike countries such as the UK, there is no formal auditing of pathology services. 16 That audit is not an international practice is also suggested by the fact that in the recent review by Baird et al. which included comments by demand management experts from several countries, none of whom mentioned the role of audit. 2 The consequence is that tests are introduced but little effort is expended to assess if the right patients are being tested. A related issue to the lack of audit as a professional practice is that the laboratory service remains largely ignorant of the patient outcomes from testing. It could be argued that such outcomes are difficult to measure, but that is not always the case as indicated by this study and that of Gonzalez et al. 8
In summary, the main conclusion from this study was that an intervention to reduce unnecessary requesting for Vitamin D has patently failed, and in addition it may have adversely affected the ability of general practitioners to detect those patients with Vitamin D deficiency. From the results of this intervention, we would argue that audit and outcome measures, where possible, are essential activities that should be conducted in parallel with changes to testing guidelines. In that way, the possibly deleterious consequences of largely ad hoc changes to the MBS, as has happened in the case of vitamin D testing, might be avoided in the future.
Footnotes
Acknowledgements
We would like to specially acknowledge the contribution of Howard Morris to this paper but who tragically passed away before its publication.
Declaration of conflicting interests
The author(s) declared no potential conflicts of interest with respect to the research, authorship, and/or publication of this article.
Funding
The author(s) received no financial support for the research, authorship, and/or publication of this article.
Ethical approval
Not required.
Guarantor
ASJ.
Contributorship
All of the authors of the paper made substantial contributions to the original paper and to the revised version.