
Abstract
Background
Current practice requires regular venous blood samples for monitoring of tacrolimus concentrations post renal transplant requiring regular hospital visits. Mitra devices use volumetric absorptive microsampling technology and absorb a fixed amount of blood (10 μL) from a capillary blood sample. They are a viable volumetric alternative to dried blood spots and are able to be posted to the laboratory for analysis.
Objective
The aim was to develop and validate liquid chromatography-tandem mass spectrometry (LC-MS/MS) assays for tacrolimus and creatinine analysis using Mitra devices. The usefulness of this approach was assessed in renal transplant patients routinely monitored for tacrolimus and creatinine.
Method
Routine tacrolimus samples were used to assess the utility and reliability of Mitra sampling. Shared sample preparation for both tacrolimus and creatinine was carried out in a 96-deep well plate; mass spectrometric analysis was then undertaken for tacrolimus followed by re-injection for creatinine analysis.
Results
Comparison of 131 Mitra samples with a routine LC-MS/MS assay for tacrolimus showed a minimal bias –5.6% (95% CI –8.5 to –2.7%). Comparison of 135 serum and Mitra samples for creatinine using a fully validated LC-MS/MS assay showed a bias –6.5% (95% CI –8.5 to –4.5%).
Discussion
We have developed assays for tacrolimus and creatinine on fingerprick blood using the Mitra device and believe this approach provides a viable alternative to repeated venepuncture for therapeutic drug monitoring. This method could open up the opportunity for patients to perform tacrolimus and kidney function monitoring at home.
Introduction
Tacrolimus is the immunosuppressant most commonly used to prevent and treat allograft rejection in renal transplant recipients. 1 Treatment with tacrolimus must be monitored closely in order to maintain drug concentrations within the therapeutic window; if concentrations are too high, adverse effects can be serious. On the other hand, if drug concentrations are too low, then organ transplant rejection may occur. Measurement intervals should therefore be frequent until a steady-state concentration of tacrolimus has been reached, followed by monitoring as deemed necessary by the clinician. Measurement of creatinine is important in these patients, as a sharp increase may indicate graft dysfunction or rejection which would need immediate hospital admission and investigation.
Current monitoring relies on venepuncture in a hospital or GP surgery, requiring regular patient and clinician attendance. This may impact work or school life and can be very expensive for the NHS. One alternative is collection of a capillary blood sample onto a Mitra microsampling device. Mitra devices use volumetric absorptive microsampling (VAMs) technology and provide a reproducible way of sampling 10 μL of capillary blood. 2 The sample is absorbed onto a porous polymer tip, which can be dried and stored prior to analysis. Mitra devices are easy to use and allow samples to be taken at the patient’s home/workplace/school and sent by post for analysis the following day. They may prove useful for patients who find it difficult or an inconvenience to attend their GP/hospital for repeated blood tests; they could also be an alternative for patients where repeated venepuncture is difficult and/or painful.
The aim of this study was to develop a shared sample preparation procedure and fully validate the LC-MS/MS methods to allow analysis of tacrolimus, followed by creatinine using the same Mitra sample. To assess the usefulness of this approach, a clinical study was performed to compare samples collected by traditional venepuncture with samples collected from capillary blood using Mitra device. This is building on a smaller study carried out in paediatric transplant patients which is awaiting publication.
Materials and methods
Tacrolimus
Calibration of the routine tacrolimus assay was achieved using commercial ‘6PLUS1’ WB standards (Chromsystems, Munich, Germany), with a range of 0–42.3 μg/L which were pipetted into the corresponding wells of the 96-deep well plate (Porvair, Leatherhead, UK). To make QC material, tacrolimus-free whole blood (WB) was pooled and known concentrations of tacrolimus (Cerilliant, Texas, USA) added to produce three different concentrations: 1.5, 6 and 24 μg/L. QC material was loaded onto Mitra devices, dried and stored at –20°C prior to testing. Stock internal standard was made for tacrolimus using ascomycin (Sigma, Poole, UK) which was further diluted in acetonitrile to make a working internal standard at a concentration of 2 μg/L.
Mobile phases were deionized water (A) and methanol (B) (Honeywell, Seelze, Germany), each consisting of 0.1% formic acid (BDH, Bristol, UK) and 2 mmol/L ammonium acetate (Sigma, Poole, UK). The sample extract (20 μL) was injected onto an Acquity UPLC HSS C18 SB 1.8 μm 2.1 × 30 mm analytical column (Waters, Manchester, UK). Starting conditions were 50% A for the first 0.2 min, a linear gradient to 100% B at 0.6 min, this was held until 1.2 min when it returned to starting conditions. Each sample had a total run time of 2.5 min.
The mass spectrometer was operated in electrospray positive mode, capillary voltage was 1.0 kV and the source temperature was 150°C. The desolvation temperature and gas flow were 450°C and 800 L/h, respectively. The quantifier transitions monitored for tacrolimus were m/z 821.45 > 768.4 and ascomycin m/z 809.4 > 756.3, which were detected in multiple reaction monitoring (MRM) mode with a dwell time of 60 ms.
Inter-/intra-assay imprecision and bias was calculated from a minimum of 10 WB QC samples which had been prepared and loaded onto Mitra devices. The QC at a concentration of 1.5 μg/L was used for the investigation of the LLOQ; this was analysed 10 times within the same analytical run and 10 times between runs. The LLOQ was deemed acceptable if the CV and bias were both less than 20%.
Creatinine
Creatinine calibrators (0–1000 μmol/L) were prepared gravimetrically in phosphate-buffered saline (PBS) (Sigma, Poole, UK) using anhydrous creatinine (Sigma, Poole, UK). QC material was made in PBS from a different stock of anhydrous creatinine powder to give concentrations of 75, 150, 300 and 600 μmol/L. One hundred microlitre aliquots of calibrators and QCs were stored at –20°C for up to 12 months prior to use. Stock internal standard was made by diluting powdered d3 creatinine (Cayman chemicals, MI, USA) in water which was further diluted in methanol to make a working internal standard at a concentration of 1 mg/L.
The creatinine assay was based on a previously published method which utilizes the same aqueous mobile phase as the tacrolimus assay (A). 3 Mobile phase B consisted of 10% LC-MS grade methanol in deionized water (v/v) containing 0.1% (v/v) formic acid and 50 mmol/L ammonium acetate. The sample extract (3 μL) was injected onto a 4 mm × 3 mm strong cation exchange SecurityGuard column (Phenomonex, Macclesfield, UK). Starting conditions were 100% A for the first 0.4 min, the composition then changed to 100% B and was held for 0.4 min until it returned to starting conditions (100% A); each sample had a total run time of 1.5 min.
The mass spectrometer was operated in electrospray positive mode, capillary voltage was 0.32 kV and the source temperature was 150°C. The desolvation temperature and gas flow were 400 °C and 800 L/h, respectively. The respective quantifier transitions for creatinine and d3 creatinine were m/z 113.9 > 43.9 and m/z 116.9 > 46.9 which were detected using MRM with a dwell time of 225 ms. Quantification was achieved using peak height, 1/X weighting and linear least squares regression.
Inter-/intra-assay imprecision and bias was calculated from PBS-based QC samples with weighed-in targets for creatinine following the same protocol used for the tacrolimus assay. For the LLOQ, a sample with a target creatinine of 16 μmol/L was made in PBS, which was analysed 10 times within the same run. In addition, a patient sample around this concentration was analysed 10 times within the same analytical run to confirm the suitability of the LLOQ in a matrix sample. To further assess inter-assay imprecision, WB samples were pooled to give approximate creatinine concentrations of 100, 200 and 300 μmol/L. Mitra devices were used for collection and then stored at –20°C prior to analysis.
Shared sample preparation for tacrolimus and creatinine analysis
Standards and QCs (10 μL) were manually pipetted, and Mitra samples were added into a 96-deep well plate. To each well, 200 μL of deionized water was added, the plate was covered and vortexed at 1800 r/min for 6 min (Grant Instruments, Cambridge, UK). Subsequently, 300 μL of 35 mmol/L zinc sulphate heptahydrate (VWR, Leicester, UK) in 80% methanol:water (v/v)) was added followed by 10 μL of d3 creatinine and 100 μL ascomycin. The plate was vortexed for a further 2 min at 1800 r/min followed by centrifugation for 5 min at 880 g. Supernatant for both methods was injected into an Acquity ultra high pressure liquid chromatography (UPLC) system and detected using a Waters XEVO® TQD mass spectrometer (both Waters, Manchester, UK).
Sample collection
For validation, anonymized EDTA WB samples from routine tacrolimus analysis were absorbed onto Mitra devices and compared with the routine laboratory result. For clinical comparisons, renal transplant patients were recruited while attending routine clinical follow-up at Nottingham University Hospitals NHS Trust. Venous EDTA WB, venous serum and fingerprick capillary Mitra samples were posted to the laboratory at Wythenshawe Hospital, Manchester, UK and stored at –20°C prior to analysis. Mitra samples were collected by trained research nurses in accordance with the manufacturer’s specifications. The study was approved by the Health Research Authority (18/WM/0176).
Tacrolimus and creatinine sample comparison
Tacrolimus and creatinine analysis was undertaken on venous samples (EDTA WB and serum, respectively) and finger prick Mitra samples taken concurrently from the same patients (n = 135). Venous EDTA WB samples were analysed for tacrolimus using a routine ISO 15189-accredited LC-MS/MS method with acceptable UK NEQAS external quality assurance (EQA) performance. Creatinine was measured on serum and Mitra samples using the LC-MS/MS method described above. For method comparison purposes, 43 serum samples measured using the LC-MS/MS assay were analysed using a ISO 15189-accredited Roche enzymatic creatinine assay with acceptable UK NEQAS EQA performance.
UK NEQAS EQA samples were analysed for both tacrolimus and creatinine. In addition, a National Institute of Standards and Technology (NIST) creatinine standard reference material was analysed in triplicate over three separate analytical runs to further assess accuracy.
Published acceptance criteria were used to validate both the assays for diagnostic use in the laboratory. 4
Matrix effects
To investigate matrix effects, the same concentrations of tacrolimus and creatinine used in the recovery were added into six different WB Mitra samples post extraction following a documented procedure. 5 In addition, a blank matrix sample was prepared by adding PBS onto Mitra devices. The matrix effect was calculated as a percentage from the peak height relative to the PBS blank used after taking into account the endogenous creatinine and tacrolimus in the sample.
Recovery
Four different concentrations of tacrolimus (0, 8, 16 and 32 μg/L) and creatinine (0, 150, 300 and 600 μmol/L) were spiked into six different blood samples pre-extraction which were loaded onto Mitra samples as per the protocol. The recovery was calculated as a percentage with acceptability criteria of 100 ± 20%.
Linearity
To assess assay linearity beyond the top calibrator, a creatinine calibration curve from 0 to 10,000 μmol/L was gravimetrically prepared in PBS. For tacrolimus linearity above, the top standard was not investigated. Dilutional linearity of tacrolimus and creatinine was not investigated on Mitra devices.
Mitra stability
To assess the stability of WB samples on Mitra devices, anonymized WB samples were combined and then split into three different pools that were fortified with known amounts of tacrolimus and creatinine. Mitra devices were stored in sealed bags with desiccant and subjected to varying storage temperatures for up to 25 days. Mitra devices were stored at –20°C, 4°C, room temperature (22°C), 37°C and 60°C to replicate extreme transport conditions. Stability was deemed acceptable if the change was within ±15% of the baseline concentration in accordance with FDA guidelines on accuracy. 4
WB absorption of Mitra devices
A published article was used as a guide to assess how different HCT concentrations affect the amount of blood absorbed by Mitra devices. 6 Three EDTA WB samples were split into six aliquots and centrifuged; the patient’s own plasma was transferred in such a way that gave samples with HCT ranging from 0.23 to 0.45 L/L. Tacrolimus and creatinine concentrations were measured on Mitra devices prepared from the samples and compared with the same WB samples that had been pipetted using a calibrated pipette.
Postextraction stability
Postextraction stability was assessed by preparing a plate with standards, QCs and 10 patient samples. Analysis was undertaken, and the plate was immediately resealed post analysis; it was then stored at 4°C for 20 h, centrifuged and reanalysed. A target of ±15% was deemed acceptable.
Statistical analysis
All data were analysed using Analyse-It Software (Analyse-It Software Ltd, Leeds, UK). Correlation between methods was assessed using Passing and Bablok regression analysis and Pearson correlation coefficients. Agreement between methods was assessed using Bland-Altman plots.
Results
Tacrolimus
Tacrolimus and ascomycin were eluted at 1.05 min. Figure 1 shows the chromatogram from a patient sample at the LLOQ. The peaks were well resolved with no interference present; time between injections was 2.5 min. For tacrolimus, the mean matrix effect for the each of the three concentrations assessed (low, med and high) was –34.2%, –39.7% and –30.4%, respectively (range –49.7% to –14.5%). Mean recovery following the addition of three concentrations of tacrolimus to six blood samples was 99% (range 97–102%), showing that the internal standard compensates well for the observed matrix effects.
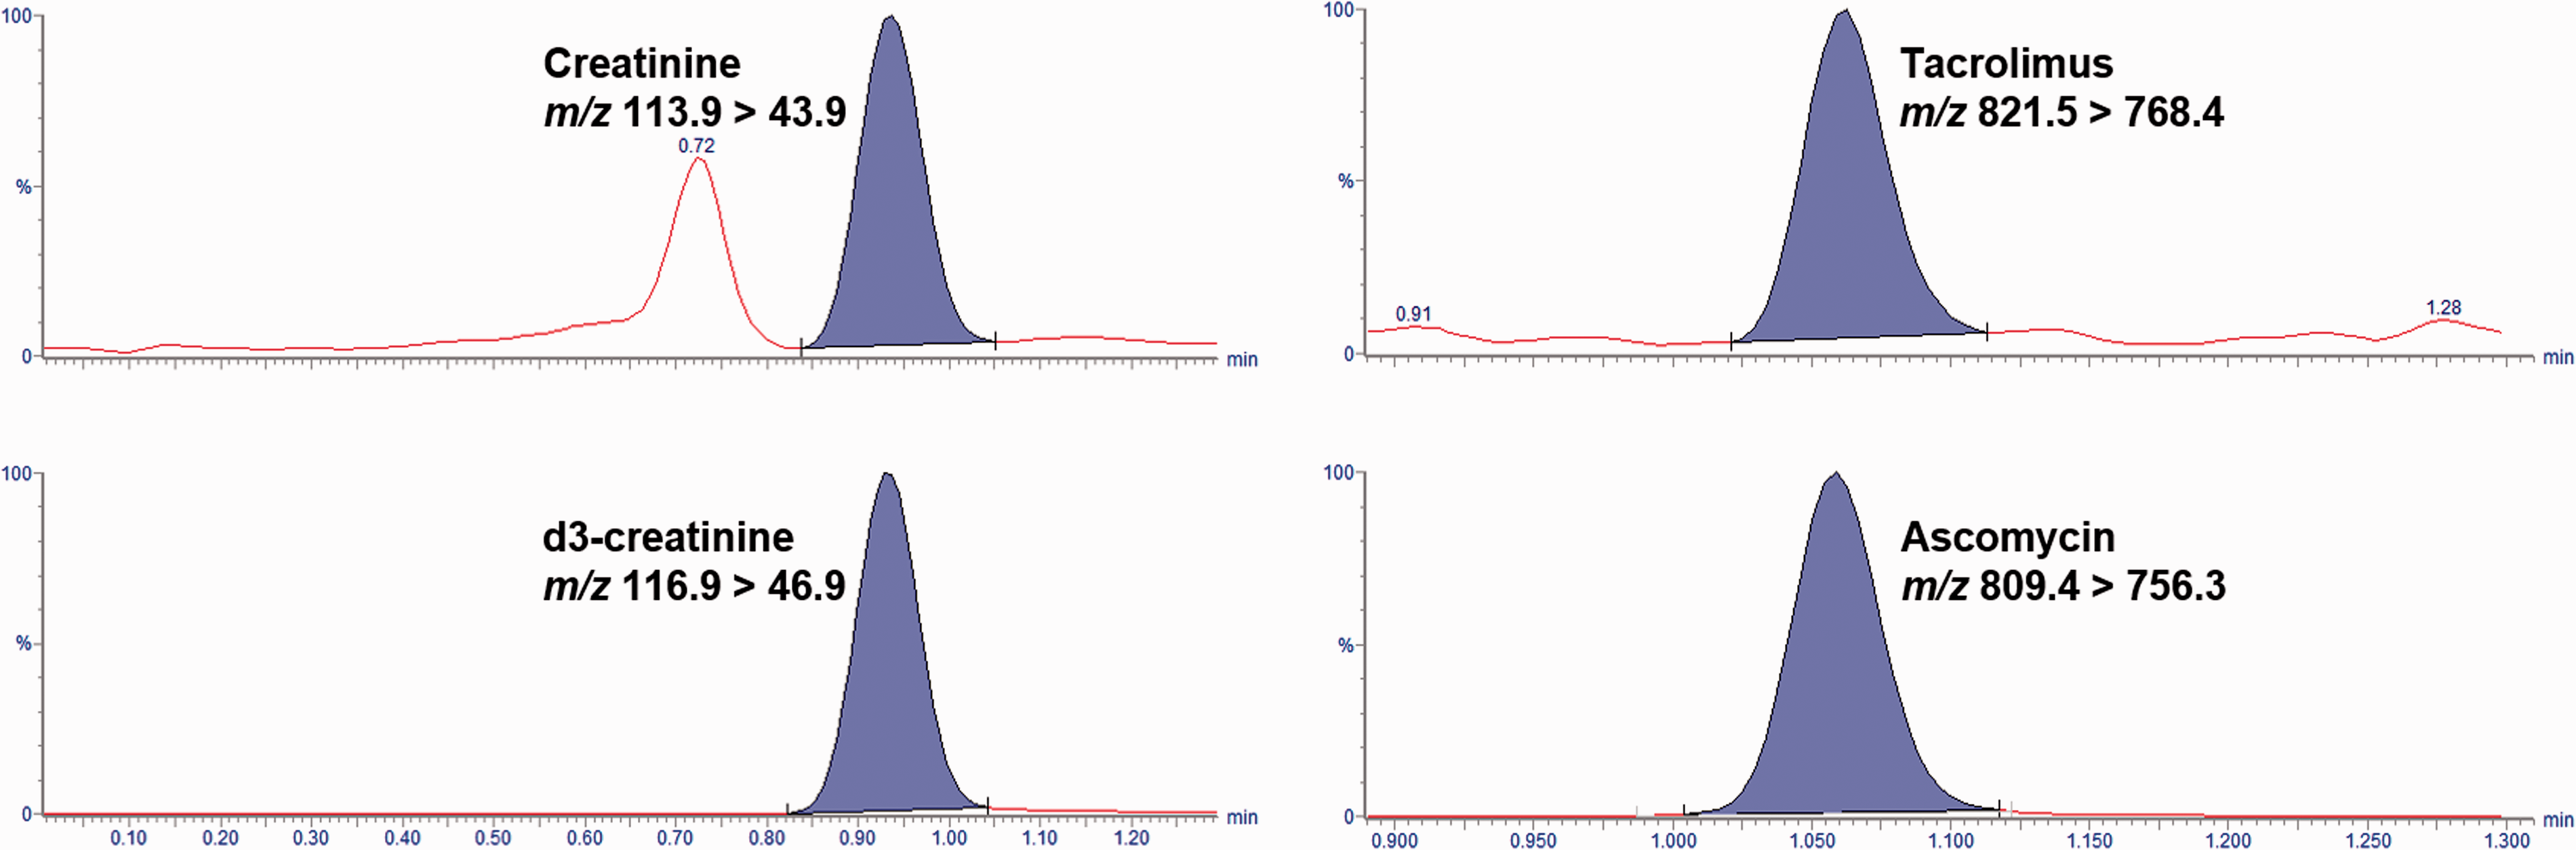
Chromatograms showing creatinine and tacrolimus extracted from a whole blood sample loaded onto a Mitra device.
The imprecision data and bias for the WB QCs loaded onto Mitra samples are shown in Table 1. The mean inter-assay CV for tacrolimus was 9%, and the mean intra-assay CV was 5%. The calibration curves were linear over the standard ranges showing reproducibility between batches; the R2 values were 0.999 for tacrolimus (n = 15).
Creatinine and tacrolimus imprecision data.
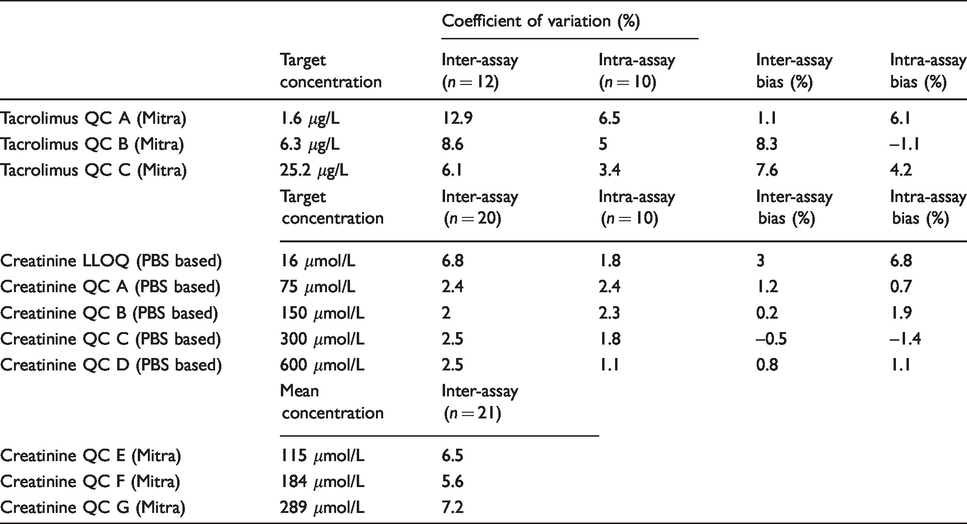
Repeat analysis of Mitra samples at the LLOQ of 1.5 μg/L within the same batch gave a CV of 6.5% and a bias of +11.4%. Between-batch analysis gave a CV of 13.4% and a bias of +7.9%. Analysis of 14 EQA samples gave an overall bias of –4.6% against the target value.
A method comparison of Mitra samples (n = 131) analysed using the new assay against an established LC-MS/MS assay using EDTA WB samples showed good agreement Figure 2. The mean tacrolimus bias for Mitra capillary samples compared with routine results was –5.6% (95% CI –8.5 to –2.7%). Passing-Bablok analysis gave an equation of: Mitra tacrolimus = 0.93 × routine tacrolimus + 0.07 μg/L.
Creatinine
Using the chromatographic conditions described in the methods section, the retention times for creatinine and its internal standard were 0.92 min; the chromatogram shown in Figure 1 is from a patient sample at the LLOQ. The peaks were well resolved with no interferences present, and time between injections was 1.5 min. Ion suppression was negligible for creatinine, as the average matrix effect for each of the levels was 3% or less. Mean recovery following addition of three concentrations of creatinine to six blood samples was 108% (range 100–115%).
The imprecision data and bias for the PBS-based QCs are shown in Table 1; the mean inter-assay CV and the mean intra-assay CV for creatinine was 2% for PBS-based QCs. For the WB Mitra samples, the mean inter-assay CV was 6%. The calibration curves were linear over the standard ranges showing reproducibility between batches; the R2 values were 0.999 (n = 15). Creatinine was linear up to 10,000 μmol/L (R2 = 0.998).
Repeat analysis at the LLOQ (∼20 μmol/L) gave CVs of 7% or less for both the non-matrixed and matrixed samples. Analysis of 12 EQA samples gave an overall bias of –2.0% against the Roche target value. Assessment of bias against NIST-certified reference material (CRM) with assigned values of 74.9 and 342.7 μmol/L showed a slight negative bias of 1 and 2%, respectively.
Comparison of capillary blood collected using Mitra devices with serum samples for the measurement of creatinine (n = 135) is shown in Figure 3. The mean bias for Mitra samples was –6.5% (95% CI –8.5 to –4.5%). Passing-Bablok analysis gave an equation of: Mitra creatinine = 0.91 × serum creatinine + 1.81 μmol/L.
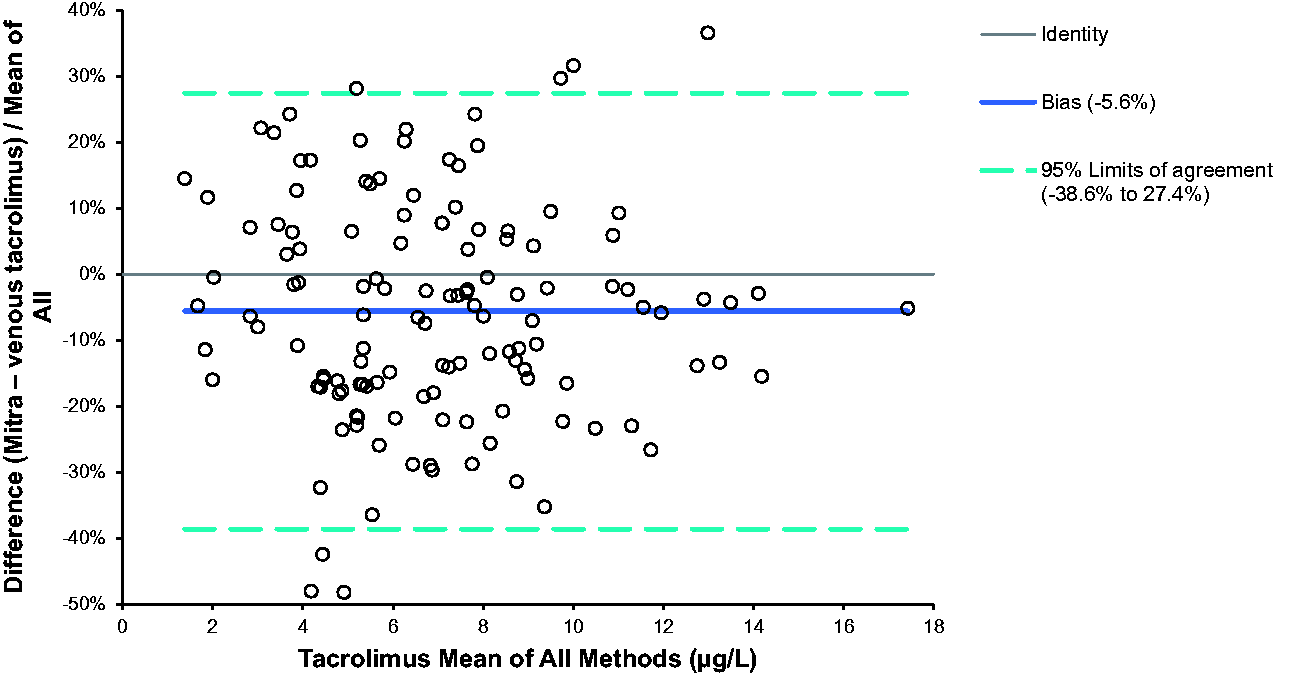
Percentage difference of venous tacrolimus and capillary whole blood tacrolimus collected onto Mitra devices (n = 131).
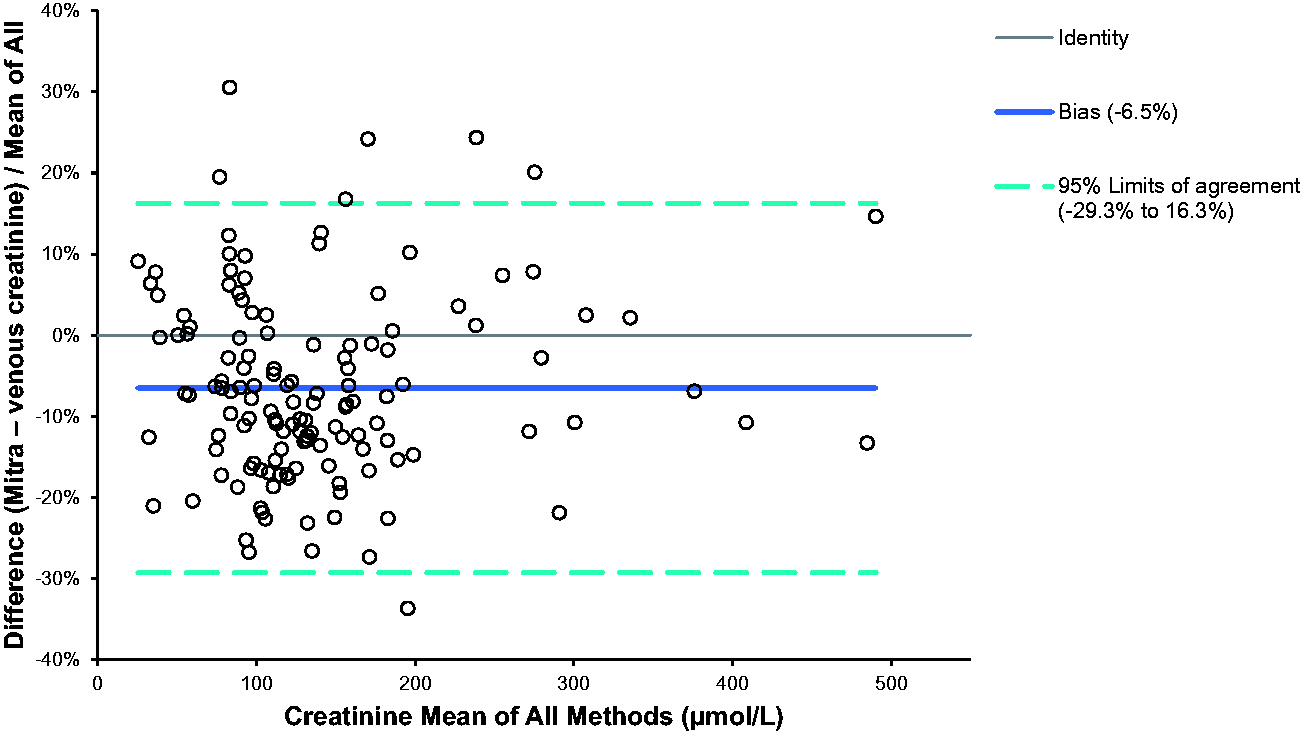
Percentage difference of venous creatinine and capillary whole blood creatinine collected onto Mitra devices (n = 135).
Comparison of 43 serum samples analysed by LC-MS/MS and Roche enzymatic creatinine showed a bias of 0.3% (95% CI –0.5 to 1.0%). Passing-Bablok analysis gave an equation of: LC-MS/MS creatinine = 1.01 × Roche creatinine –0.17 μmol/L.
Stability and absorption of Mitra devices
Stability data for Mitra devices are shown in Figure 4. Tacrolimus and creatinine results on the Mitra exhibited a deviation from the mean baseline value of <10% when stored at 4°C, –20°C and at room temperature (22°C) for 14 days. A <10% deviation of tacrolimus and creatinine was seen when stored at 37°C for seven days. Storage for one day at 60°C exhibited a <10% deviation for tacrolimus and creatinine, however, if stored for longer the % deviation increased.
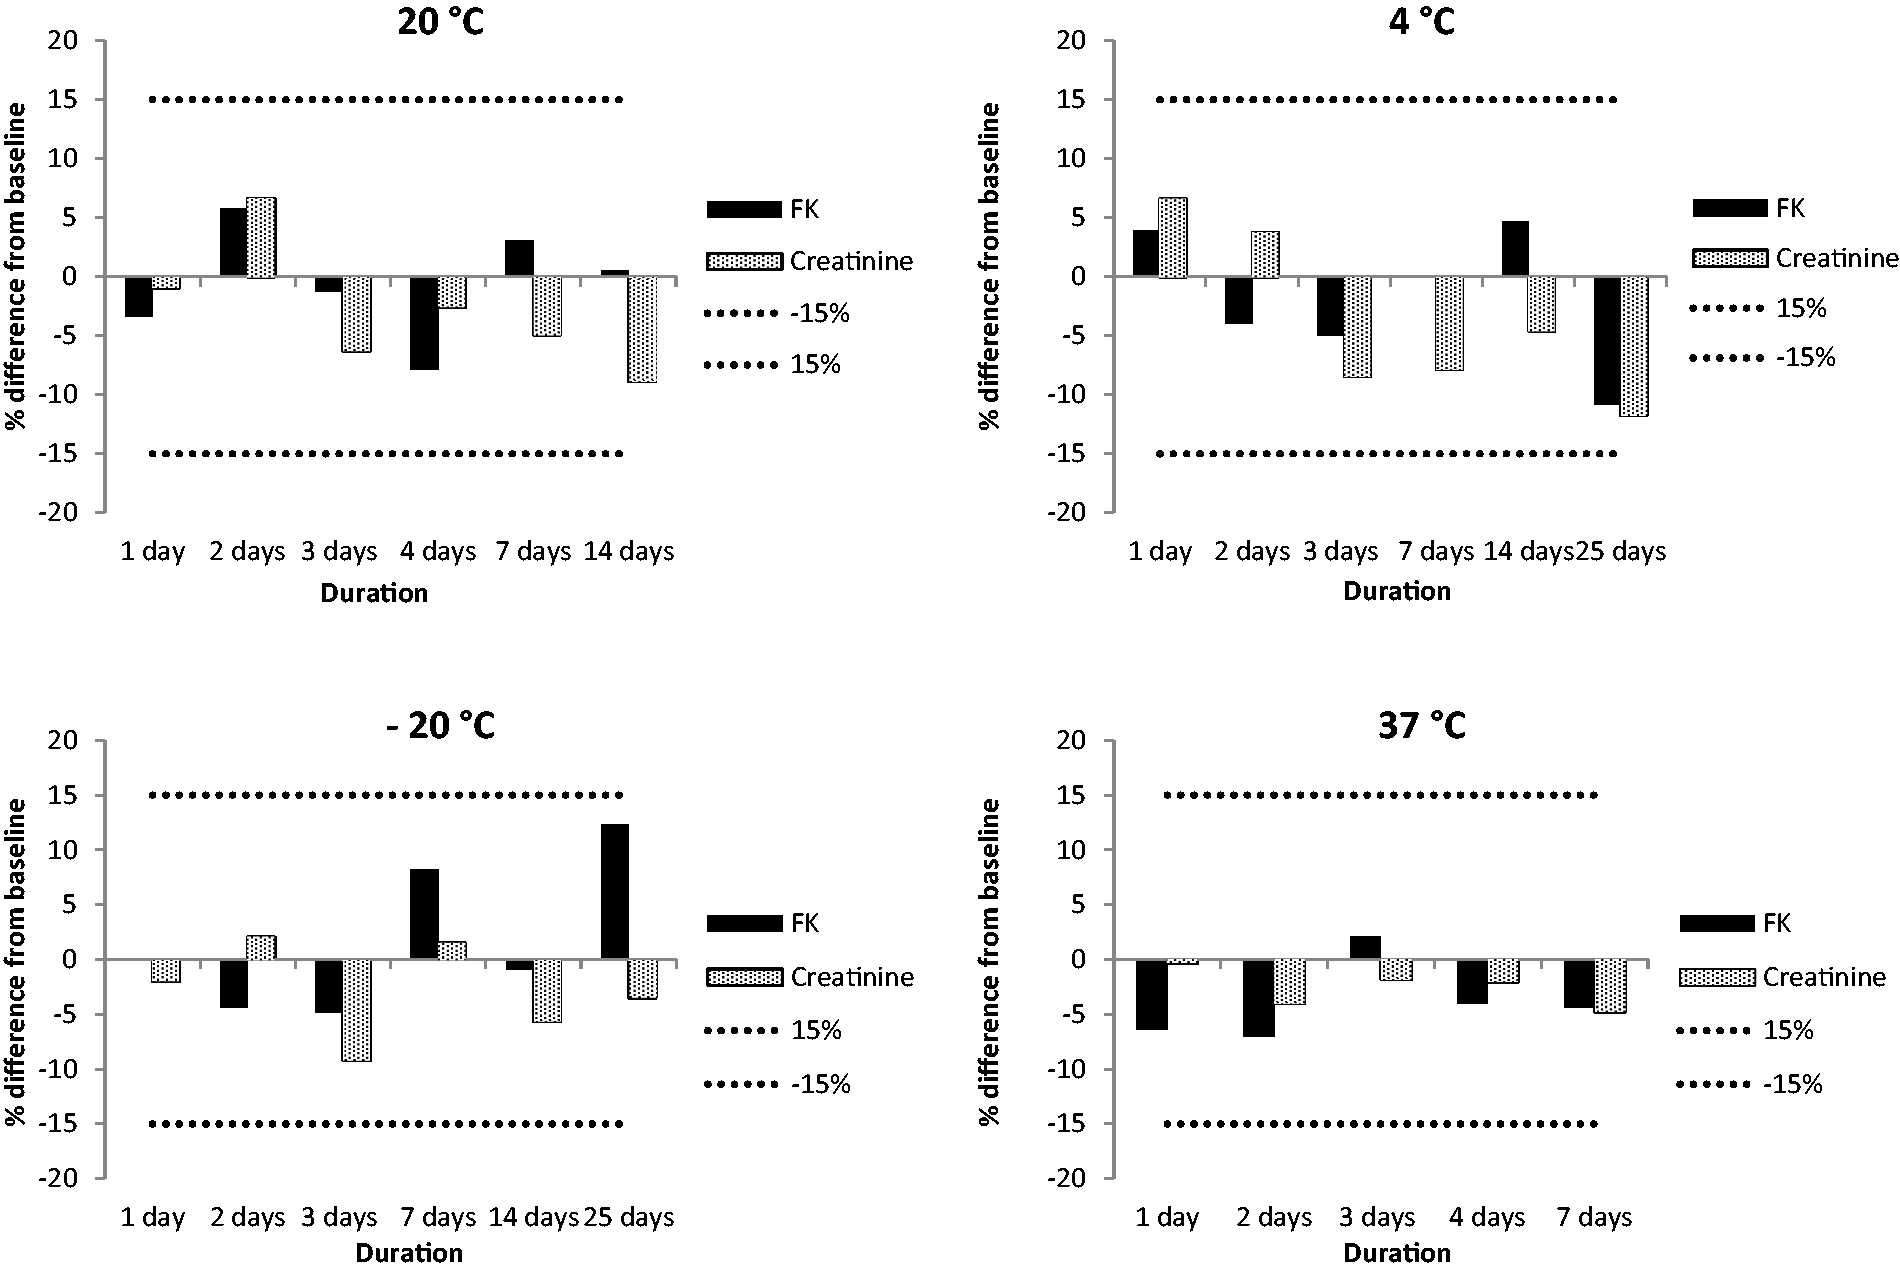
Stability data for creatinine and tacrolimus on Mitra devices. The mean of three different levels across the concentration range for each measurand has been calculated and represented as a percentage difference from the baseline value. The dotted lines represent the allowable deviation of 15%.
Mitra results at each HCT concentration were within 10% of the pipetted results for tacrolimus and creatinine (range –1.1% to 9.6%) with a mean positive bias of 4.3%.
Discussion
We have been successful in developing a shared sample preparation procedure and have validated LC-MS/MS assays for tacrolimus and creatinine using samples extracted from the same Mitra device. The extraction process is simple, and once complete, tacrolimus and creatinine can be analysed consecutively after changing the analytical column and mobile phase B. Previous work quantifying tacrolimus on fingerprick samples and in dried blood spots (DBS) has been successful, provided a known volume of blood is sampled or spotted onto the paper used for DBS.7,8
More recently, Veenhof et al. have shown DBS collection at home to be successful for monitoring of tacrolimus in transplant patients. Their studies have shown DBS measurement to convey a positive advantage over the use of Mitra devices. 9 However, in our experience, DBS are prone to the HCT effect caused by variations in spreading and sample homogeneity and require a larger yield of blood (approximately 75 μL). 10 Therefore, we decided to use the Mitra device for tacrolimus and creatinine measurement, as the sample size is smaller (10 μL) and potentially easier to collect for paediatric patients.
Stability is particularly important for Mitra samples, as they may be subjected to high temperatures or a delay in processing. The investigations undertook found that Mitra samples were stable for seven days at 37°C, 14 days at room temperature and 25 days if stored at 4°C and –20°C. These findings suggest that postal and subsequent storage prior to analysis is acceptable.
We compared the fingerprick capillary method with Mitra devices to standard venous samples taken using venepuncture in a cohort of renal transplant patients, with a range of creatinine and tacrolimus concentrations useful for clinical use. Comparisons showed no systemic bias and good correlation throughout the test range.
Kita and Mano assessed varying HCT values (20%, 45% and 65%) in three different levels of QC material applied to Mitra devices, and they found that tacrolimus recovery was affected by less than 15% for each of the samples tested (five replicates for each). 11 Studies undertaken in our laboratory on a range of HCT concentrations also support this. In addition, a study by Denniff and Spooner showed that varying HCT values had a minimal effect on the volume of blood absorbed by the Mitra device. 2
The use of Mitra devices loaded with QC samples/standards would have been ideal; however, we decided to use a positive displacement pipette to sample calibrators and QC material due to low cost and ease of use. We were able to gravimetrically calibrate the volume to match the specific Mitra lot number; volumes typically range from 9.9 to 10.9 μL. In addition, material spiked into WB can create other problems involving traceability. Also, spiked WB calibrators would not have been suitable for creatinine because of endogenous creatinine present.
Methods for measuring creatinine and tacrolimus on DBS samples have previously been published; however, to our knowledge, we describe for the first time a microsampling method for both using the same Mitra device. 12 While there was no systemic bias in the assay, the variation needs to be considered based on the indication in clinical practice. For tacrolimus, dosing is adjusted based on a target range rather than specific values. The blood test needs to be done at a 12-h trough time which would be more feasible using a remote method. Furthermore, repeated sampling will allow closer monitoring rather than relying on individual results.
For creatinine, a high variation would potentially be an issue if used for longitudinal monitoring of kidney function, especially if there is also a variation between the microsampling results measured using LC-MS/MS and other creatinine assays done by different hospital laboratories. However, we have shown that the precision in the microsampling method is good, and we are therefore making efforts to reduce the variation when performing the fingerprick sampling. In particular, incorrect sampling can lead to both under-sampling, which would lead to lower results and also oversampling which would lead to higher results.
Conclusion
We believe this fingerprick microsampling method would enable home testing by patients and provide a positive impact on their care. This would be more convenient and save patients’ time and travel costs. In addition, as we have seen during the CoVid-19 pandemic, home testing can reduce the risk of contagion from frequent hospital visits for routine blood monitoring.
Footnotes
Acknowledgements
The authors would like to thank the laboratory staff at Wythenshawe Biochemistry and the staff at Nottingham University Hospital for their contributions.
Declaration of conflicting interests
The author(s) declared no potential conflicts of interest with respect to the research, authorship, and/or publication of this article.
Funding
The author(s) received no financial support for the research, authorship, and/or publication of this article.
Ethical approval
Health Research Authority approved (18/WM/0176).
Guarantor
DJM.
Contributorship
The development and validation of the assay was performed by DJM, sample comparisons were performed by DJM and routine samples were analysed by laboratory staff. All authors have contributed to the article.