
Abstract
Background
Measurement of testosterone (T), androstenedione (A4) and 17-hydroxyprogesterone (17OHP) usually requires a venous serum sample which may have implications for sample stability or collection.
Objective
A liquid chromatography-tandem mass spectrometry (LC-MS/MS) assay was developed for samples collected using Mitra devices. Analytical validation was completed, and sample comparisons were undertaken to assess Mitra versus venous samples.
Method
Sample was combined with deionized water and internal standard. After mixing, MTBE was added for extraction. The supernatant was transferred to a deep-well plate and dried prior to re-constitution. A HSS T3 column and Waters TQS Micro was used, the detected quantifier transitions were T m/z 289.2 > 96.95, A4 287.2 > 96.95 and 17OHP 331.25 > 96.95.
Results
Mean recovery was 102% for T, 98% for A4 and 97% for 17OHP. Lower limit of quantification was 1 nmol/L for T/A4 and 4 nmol/L for 17OHP. T was linear up to 41.6 nmol/L, A4 41.9 nmol/L and 17OHP 72.6 nmol/L. Ion suppression was <10% for all analytes. A4 and 17OHP showed minimal bias for Mitra samples collected from finger prick blood. The bias for T differed between capillary and venous blood, indicating differences in constituency.
Discussion
A simple, fast and reproducible LC-MS/MS assay has been developed for measurement of blood collected using Mitra devices for T, A4 and 17OHP. Further comparisons with serum and capillary blood collected onto Mitra devices serum may pave the way for future use in a clinical setting.
Introduction
Measurement of testosterone (T) is important in the diagnosis and monitoring of males with hypogonadism. In females, T and androstenedione (A4) measurement is useful for identifying patients with androgen excess such as polycystic ovary syndrome (PCOS), Cushing’s syndrome and androgen-secreting tumours. Measurement of 17-hydroxyprogesterone (17OHP) can help diagnose classic and non-classic congenital adrenal hyperplasia (CAH) secondary to 21-hydroxylase deficiency. Additionally, the measurement of serum 17OHP and A4 is recommended for monitoring treatment of CAH. 1
Current alternatives to venepuncture include dried blood spot (DBS) sampling which is a well-established method that relies on a whole blood (WB) sample being collected onto cotton-based paper. DBS sampling has become increasingly popular and has further applications in newborn screening, therapeutic drug monitoring and antibiotic measurement.2–4 However, DBS sampling is not without its limitations. It is well recognized that varying haematocrit (HCT) concentrations can influence both the size of DBS and the concentration of measurands. 5 Differences in chromatography can also occur on the paper and may limit their use for particular analytes. 6
Mitra devices are FDA Class 1 CE/IVD-marked devices recently developed by Neoteryx (Torrance, California, USA). The devices use volumetric absorptive microsampling (VAMs) technology whereby a fixed volume of sample (10, 20 or 30 µL depending on tip size) can be collected from capillary blood. Mitra devices comprise a hydrophilic polymer tip attached to a plastic applicator (online supplementary information). Patients can use a lancet and harvest the blood by introducing the Mitra device at a 45° angle. Samples can either be left to dry, or posted immediately to the laboratory depending on the clinical requirement.
The objective of this study was to develop and fully validate a method for the analysis of T, A4 and 17OHP in WB collected using the Mitra microsampler.
Materials and methods
Sample collection
Ethical approval was granted (IRAS No. 225910) from REC review allowing surplus K2-EDTA blood samples to be used for method development. Samples were loaded on to the Mitra devices (Neoteryx Ltd, Cheshire, UK) to replicate sample collection from capillary blood. To do this, a small amount of sample was pipetted into a weighing boat (Elkay, Hampshire, UK). The Mitra tip was applied to the surface of the blood sample at an angle of 45°; once saturated, it was held in place for a further 2 s. Mitra devices were dried for a minimum of 3 h at ambient temperature, they were then analysed or stored at –20°C in airtight bags with desiccant. Finger prick capillary blood samples were also collected onto Mitra tips from healthy volunteers along with a corresponding serum sample.
Sample preparation
Two independent intermediate stock solutions for calibrators and quality control (QC) materials were prepared in HPLC-MS grade methanol (Honeywell, Seelze, Germany) by combining methanolic solutions of A4 (1 mg/mL), T (1 mg/mL) and 17OHP (1 mg/mL)-certified reference material (CRM) (Cerilliant, TX, USA) to produce concentrations of 17336 nmol/L, 17,458 nmol/L and 30,261 nmol/L respectively. To make working standards (n = 7), the intermediate standard stock was diluted in phosphate-buffered saline (PBS) 0.1% bovine serum albumin (BSA) to produce concentrations ranging from 0 to 41.6 nmol/L for T, 0 to 41.9 nmol/L for A4 and 0 to 72.6 nmol/L for 17OHP.
WB was spiked with the QC intermediate stock to produce three levels of QC material which were subsequently applied to Mitra devices. Combined internal standard was made in methanol from d7 to A4 powder (CDN Isotopes, Quebec, Canada), methanolic [13C]-T (Cerilliant, Texas, USA) and methanolic [13C]-17OHP (Cerilliant, TX, USA) to give a working concentration of 20 nmol/L for T, A4 and 17OHP. All standards, QCs and mixed internal standard were stored at –20°C prior to use.
Standards, QCs and samples were introduced to the 2 mL 96-well plate (Porvair, Leatherhead, UK). To each well, deionized water (100 µL) was added, the plate was sealed and vortexed at 800 r/min for 60 min to ensure complete elution of the sample from the Mitra tip.
HCT was calculated using the previously published method. 7 Briefly, 10 µL of the haemolysate was transferred to a 384 micro-well plate (NUNC, Roskilde, Denmark), and 80 µL of sulfolyser reagent (Sysmex, Kobe, Japan) was added. The absorbance was read at 550 nm using a plate reader (ThermoFisher Scientific, UK). Ten samples with a range of known HCT values were used to calibrate the assay, thus allowing the calculated HCT to be utilized to convert the WB androgen result to the serum equivalent.
Once HCT quantification was complete, 10 µL of mixed internal standard was added to the remaining haemolysate in each well, and extraction was carried out by adding 1 mL of MTBE (VWR, Leicester, UK). Subsequently, the plate was foil sealed and mixed by gentle inversion for 1 min. After mixing, the MTBE fraction in the wells was transferred to a clean plate, which was then dried down under gentle airflow. The wells were reconstituted in 100 µL 50% (v/v) methanol followed by sealing of the plate and vortexing for 1 min prior to centrifugation for 5 min at 880 g.
Chromatography
Mobile phases consisted of 0.05% (v/v) formic acid (BDH, Bristol, UK) in deionized water (A) and LC-MS/MS grade methanol (B). The extracted sample (5 µL) was injected onto a 1.8 µm HSS T3 Vanguard column coupled to a HSS T3 2.1 × 50 mm 1.8 µm analytical column (both Waters, Manchester, UK) with a flow rate of 0.5 mL/min. Starting conditions were 50% B which increased linearly to 70% B over 3.0 min. The composition then changed to 99% B for 0.5 min before returning to starting conditions. Total run time injection-to-injection was 4 min.
Mass spectrometry
Extracted samples were injected into a Waters XEVO® TQS Micro tandem mass spectrometer. The system was controlled by MassLynx NT 4.1 software and data were processed using TargetLynx. For each analyte, the ratio of analyte peak height to internal standard peak height was plotted against concentration (nmol/L). A 1/X weighting and linear least squares regression model was used.
The mass spectrometer was operated in electrospray positive mode, capillary voltage was 0.4 kV and the source temperature was 150°C. The desolvation temperature and gas flow were 650°C and 1200 L/h, respectively. The quantifier (qualifier) transitions monitored for T were m/z 289 > 97 (289 > 109), A4 m/z 287 > 97 (287 > 109) and 17OHP 331 > 97 (331 > 109). These transitions were detected in multiple reaction monitoring (MRM) mode, with a dwell time of 72 ms.
Validation
Published acceptance criteria were used to validate the assay for diagnostic use in the laboratory. 8
Accuracy
In the absence of matrix-matched CRMs, accuracy was assessed using gravimetrically prepared QC materials. The three levels of QCs were analysed over 10 consecutive batches; in accordance with the FDA, we deemed a deviance from the target concentration of <15% as acceptable. 8
Recovery
Four different concentrations of T (0, 10, 20 and 40 nmol/L), A4 (0, 8.75, 17.5 and 35 nmol/L) and 17OHP (0, 18.75, 32.5 and 75 nmol/L) prepared in methanol were spiked into six different WB samples. Mitra devices were used to absorb 10 µL of sample and dried prior to extraction. The recovery was calculated as a percentage with acceptability criteria of 100 ± 20%.
Matrix effects
To investigate matrix effects, both qualitative and quantitative experiments were undertaken. For the qualitative approach, six different samples were prepared with the internal standard omitted. The samples were analysed as described above with the addition of a constant postcolumn infusion of internal standard. 9 Any troughs in the chromatogram were indicative of ion suppression.
For the quantitative approach, a documented procedure was followed. 10 Six EDTA WB samples were used with endogenous T, A4 and 17OHP present. Each was loaded onto four different Mitra devices and extracted as per the experimental protocol. In addition, a blank matrix sample was prepared by adding PBS 0.1% BSA onto four Mitra devices. After extraction, the same concentrations of T, A4 and 17OHP used in the recovery were added. The matrix effect was calculated as a percentage from the peak height relative to the PBS 0.1% BSA blank used after taking into account the endogenous T, A4 and 17OHP in the sample.
Imprecision
Imprecision was assessed using WB-based QC samples spiked with known concentrations of T, A4 and 17OHP. These samples were applied to Mitra devices and stored frozen in airtight bags with desiccant. In addition, samples with three different concentrations of HCT were loaded onto Mitra devices and subjected to the same storage conditions in the freezer. Intra-assay imprecision was evaluated by analysing each level of QC twelve times within the same sample run. To calculate inter-assay imprecision, the same lot of QC material was analysed on 10 different analytical runs on different days. A CV of 15% was considered acceptable for inter- and intra-assay imprecision. 8
Measurement uncertainty
The measurement uncertainty (MU) was calculated using a ‘top down’ approach at three different concentrations using the imprecision data. The true value was taken as the mean value of the QC replicates (n = 10), and the determined CI was converted into a percentage of the respective QC (MU). The online Westgard database was used for target MU, which is shown in Table 1. 11
Results of the imprecision studies from whole blood samples loaded onto Mitra® devices.
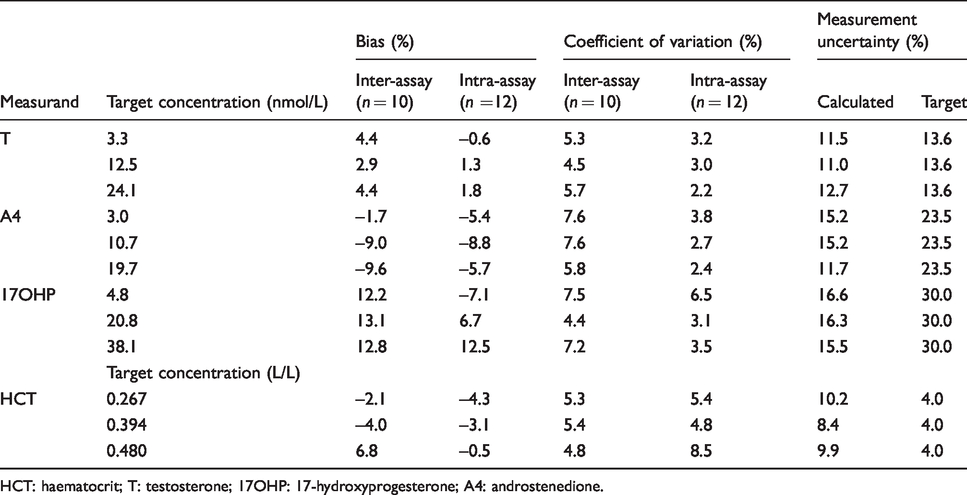
HCT: haematocrit; T: testosterone; 17OHP: 17-hydroxyprogesterone; A4: androstenedione.
Linearity
A combined calibration curve was prepared in PBS 0.1% BSA which had a concentration approximately 10 times greater than the normal top standard for each of the analytes. The assay was judged linear if the R2 value of expected versus measured concentrations was >0.99. Dilutional linearity was not investigated on Mitra devices.
Carryover
To assess carryover, a standard was made in PBS 0.1% BSA with concentrations of T, A4 and 17OHP approximately 10× the top standard concentration. This sample was analysed five times followed by a blank sample. Carryover was deemed acceptable if it was <20% of the lower limit of quantification (LLOQ).
Lower limit of quantification
For the LLOQ, a sample with a T/A4 target of 1 nmol/L and a 17OHP target of 4 nmol/L was made in PBS 0.1% BSA, which was analysed 10 times within the same run. In addition, a patient sample with similarly low concentration was analysed 10 times within the same analytical run to confirm the LLOQ in matrix samples. The LLOQ was deemed acceptable if the bias was no greater than ±20% in the PBS 0.1% BSA pool, and the imprecision was <20% in the both the PBS 0.1% BSA and matrix samples. 8
Analytical specificity
A panel of structurally related compounds (beclomethasone, prednisolone, fludrocortisone acetate, dihydrotestosterone, dehydroepiandrosterone, 21-hydroxyprogesterone, 21-deoxycortisol, epitestosterone, pregnenolone, aldosterone, dexamethasone, fludrocortisone, triamcinolone acetonide, budesonide, cortisol, corticosterone, cortisone) at supraphysiological concentrations (1 mg/mL) were sampled and subject to chromatographic separation and detection. If no co-elution was apparent with the target analytes of interest, then specificity was deemed acceptable.
HCT concentration
To assess how varying HCT concentrations affect the amount of blood drawn up by the Mitra device, three EDTA WB samples were split into six aliquots and centrifuged. The patient’s own plasma was transferred in such a way that gave samples with HCT concentrations ranging from 0.33 to 0.72 L/L. Each sample was subsequently loaded onto Mitra devices, extracted and analysed for T, A4 and 17OHP. On the same analytical run, 10 µL of each of the remaining samples was pipetted into the plate and analysed allowing a direct comparison of T, A4 and 17OHP to be made.
Interfering substances
Three serum samples with concentrations of T, A4 and 17OHP covering the analytical range were each spiked with known concentrations of haemoglobin (47 g/L), bilirubin (600 mg/L) and intralipid (172 µL/mL). The baseline samples, with no interference present, were analysed on the same analytical run as the spiked samples and the difference calculated as a percentage (acceptability target ± 10%).
Post-extraction stability
A full plate of patient samples was prepared, analysed and immediately resealed and stored at 4°C for 62 h to emulate storage over the weekend. After this time, the plate was centrifuged and re-injected with any difference calculated as a percentage. A target of ±15% was deemed acceptable.
Mitra stability
To assess the stability of WB samples on Mitra devices, a series of experiments were performed using QC samples loaded onto Mitra tips. To assess HCT stability, three sample pools with varying HCT (0.27, 0.39 and 0.48 L/L) were prepared and loaded onto Mitra tips. Samples were stored at –20°C for up to six months to assess the effect of long-term storage. In addition, samples were stored at room temperature, 37°C and at 60°C for various lengths of time to replicate extreme transport conditions. Stability was deemed acceptable if the change was within ±15% of the baseline concentration.
Comparative assays
Comparison of sample type was completed in a multistep process. Firstly, WB was compared with plasma from the same EDTA sample, and these paired samples were analysed on the same analytical run (n = 60).
Subsequently, plasma samples were compared against Mitra devices loaded with WB from the same sample. HCT concentration was measured and used to adjust the result to the plasma equivalent for comparison.
Finally, serum samples were compared with paired Mitra capillary blood finger prick samples from laboratory volunteers. Samples were analysed on the same analytical run, and the capillary WB Mitra results were converted to the serum equivalent.
Statistical analysis
All data were analysed using Analyse-It Software (Analyse-It Software Ltd, Leeds, UK). Correlation between methods was assessed using Passing-Bablok regression analysis and Pearson correlation coefficients. Agreement between methods was assessed using Bland-Altman plots.
Results
The retention time for T was 2.60, A4 was 2.35 and 17OHP was 2.79 min. Chromatograms for WB Mitra samples are shown in Figure 1. Qualitative ion suppression was minimal, and mean quantitative ion suppression was <5% for T, A4 and 17OHP. Mean (range) recovery for T was 102% (101 to 104%), A4 was 98% (95 to 100%) and 17OHP was 97% (96 to 98%) which were all within acceptable parameters.
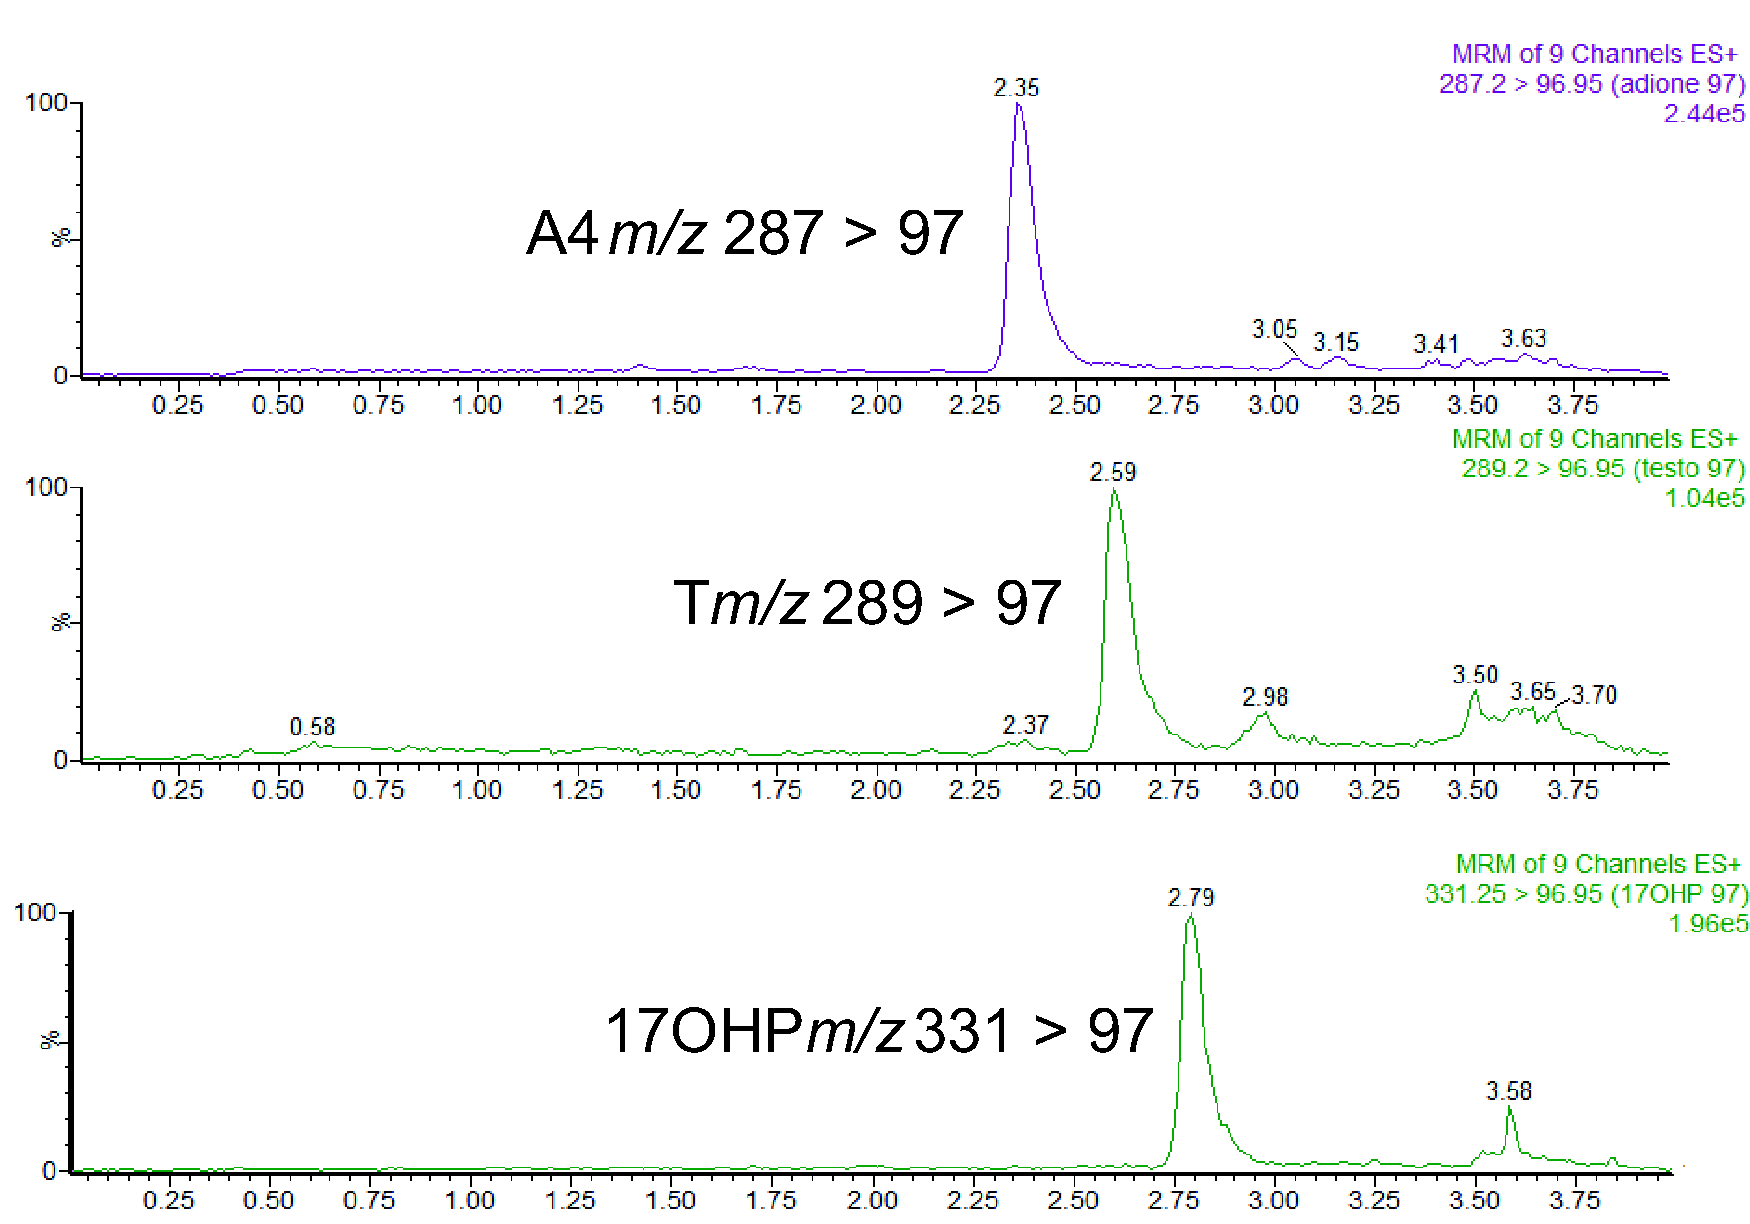
Chromatogram showing T, A4 and 17OHP extracted from a whole blood sample loaded onto a Mitra® device. T = 3.3 nmol/L, A4 = 3.0 nmol/L and 17OHP = 4.8 nmol/L.
HCT data were collected and compared with a target value from the Sysmex analysers where bias, inter- and intrabatch imprecision were all below 10% (Table 1). The calibration curves were linear over the standard ranges, showing reproducibility between batches, the R2 values were ≥0.999 for T, A4 and 17OHP (n = 20). For values above the standard curve, T was linear up to 400 nmol/L (R2 = 0.999), A4 up to 400 nmol/L (R2 = 0.999) and 17OHP up to 730 nmol/L (R2 = 0.999).
The inter- and intrabatch imprecision was below 10% for T, A4 and 17OHP (Table 1). Bias for QC samples was below 15% for all the analytes measured. The LLOQ was 1 nmol/L for T, 1 nmol/L for A4 and 4 nmol/L for 17OHP; at these concentrations, the signal:noise ratio (s/n) for each analyte was greater than 10. Following analysis of 10 replicates of both matrix and non-matrix samples, the imprecision (%CV) and bias were determined to be <10%. Absolute carryover for all analytes was below the acceptable criteria of 0.2 nmol/L for T and A4, and 0.8 nmol/L for 17OHP (20% of the LLOQ).
Analysis of 17 structurally related compounds showed no interfering peaks, and all responses were less than the LLOQ. Postextraction stability was acceptable up to 62 h stored at 4°C; the mean difference from the original concentration was <5% for each analyte.
Stability of T, A4 and HCT on Mitra devices is shown in Figure 2. T, A4 and 17OHP were stable for 14 days at room temperature and 200 days at –20°C. Storage at 60°C was not acceptable, as this led to a sharp decrease in all measurands.
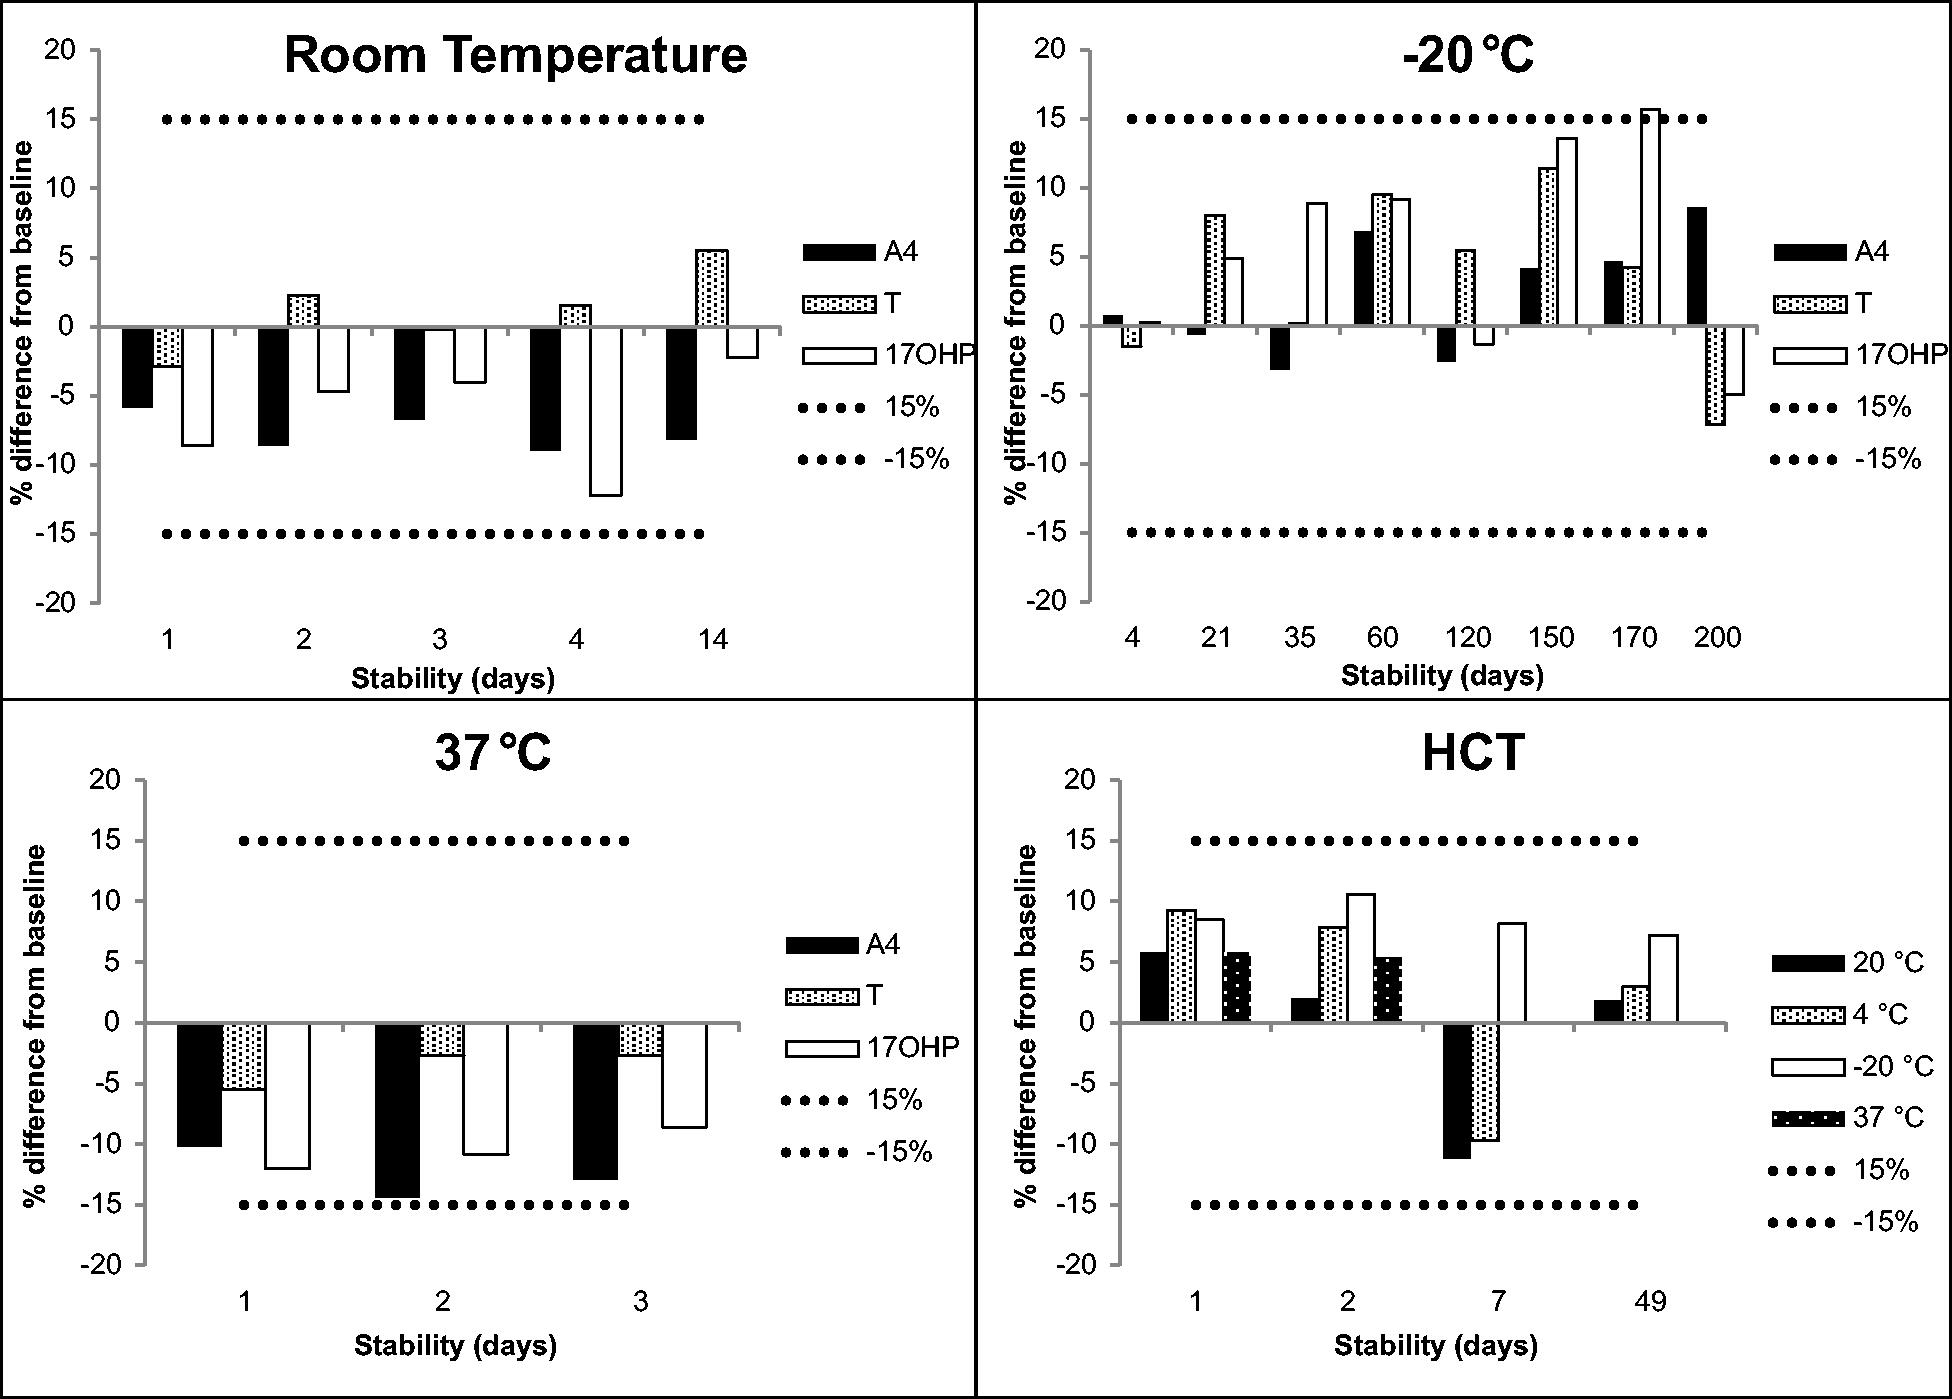
Stability data of T, A4, 17OHP and HCT. The mean of three different levels across the concentration range for each measurand has been calculated and represented as a percentage difference from the baseline value. The dotted and dashed lines represent the allowable deviation of ±15%.
Passing-Bablok regression analysis of HCT concentration measured on the Sysmex XN-9000 analysers and the Mitra method yielded: Mitra method = Sysmex HCT × 0.9989 + 0.0002.
The samples with a range of HCT values prepared to assess absorption of WB onto Mitra devices yielded mean results which were within 15% of the pipetted results for T, A4 and 17OHP (range –12.8% to 4.3%).
The equation used for conversion with the best correlation between dry WB Mitra samples and serum/plasma with the smallest bias for T, A4 and 17OHP is outlined below
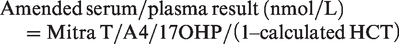
A comparison between venous plasma and WB Mitra results prepared from the same EDTA samples showed strong correlation for T (R2 = 0.96), A4 (R2 = 0.99) and 17OHP (R2 = 0.99) (data not shown). However, a proportional bias between the venous and WB samples was observed. The calculated HCT concentration was then used to amend the Mitra result for T, A4 and 17OHP. Passing-Bablok regression analysis showed
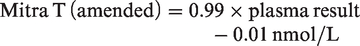
The results of capillary Mitra samples (amended for HCT) when compared against serum results are shown in Figures 3 to 5, respectively. A4 and 17OHP showed minimal bias for Mitra samples collected from finger prick blood and compared well to the studies undertaken with EDTA samples. The bias for testosterone was variable depending on whether capillary or venous blood was measured.
Absolute T difference of plasma vs. Mitra® both collected from venous blood (n = 63, bias = 0.25 nmol/L) represented by the hollow diamonds. Absolute T difference of venous serum vs. Mitra® collected from finger prick blood (n = 38, bias = –4.28 nmol/L) represented by the solid diamonds. The dotted and dashed lines represent the bias for each data-set.
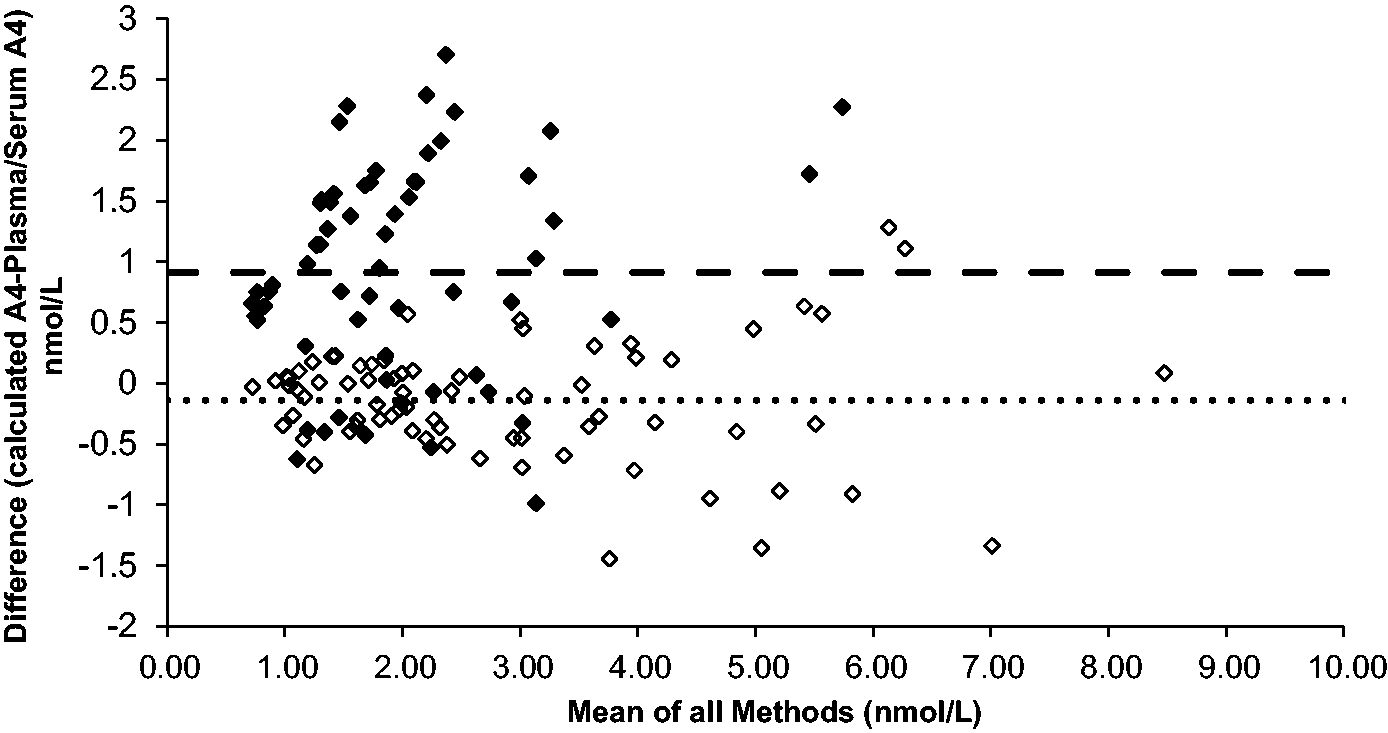
Absolute A4 difference of plasma vs. Mitra® both collected from venous blood (n = 72, bias = –0.14 nmol/L) represented by the hollow diamonds. Absolute A4 difference of venous serum vs. Mitra® collected from finger prick blood (n = 62, bias = 0.91 nmol/L) represented by the solid diamonds. The dotted and dashed lines represent the bias for each data-set.
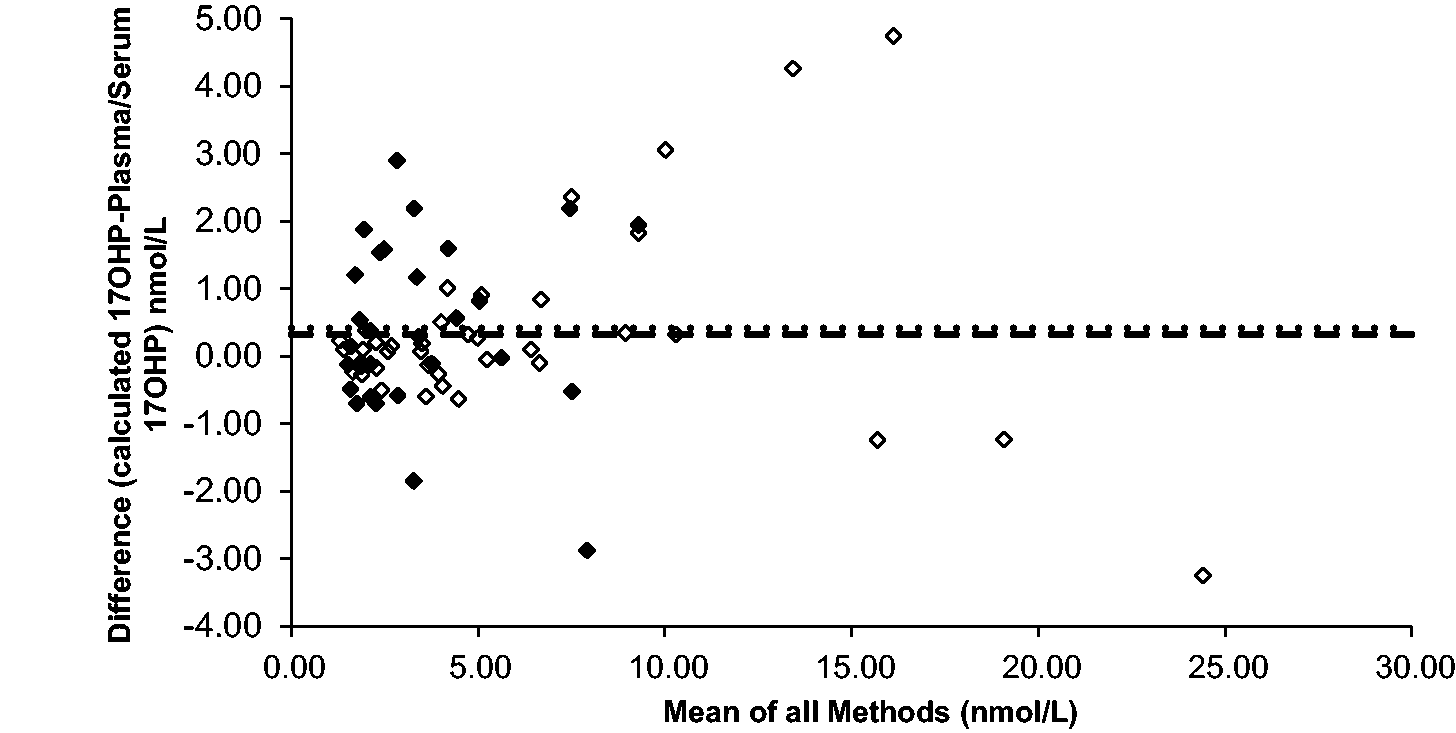
Absolute 17OHP difference of plasma vs. Mitra® both collected from venous blood (n = 39, bias = 0.33 nmol/L) represented by the hollow diamonds. Absolute 17OHP difference of venous serum vs. Mitra® collected from finger prick blood (n = 29, bias = 0.42 nmol/L) represented by the solid diamonds. The dotted and dashed lines represent the bias for each data set. Results below the validated LLOQ of the assay have been included in the sample comparisons.
Discussion
The LC conditions used gave reproducible separation and peak shape; importantly 17OHP was separated from its isobar, 21-hydroxyprogesterone. 12 The method proved to be robust, reliable and satisfied the required criteria for all aspects of the validation. Stability is particularly important for postal samples which may be subjected to extreme temperatures or a delay in processing. For all analytes, stability was acceptable for conditions from –20 to 37°C. 17OHP stability was acceptable in all conditions apart from long-term storage in the freezer where it was acceptable up to 150 days. Storage at 60°C led to the Mitra device losing functionality, as the dried blood could not be eluted with water.
It is well known that T is mostly bound to SHBG, and in this bound state, T will not enter the red cell. 13 Thus, the space occupying effect of red cells will have a large impact on analyte concentration if WB is analysed. This study shows that A4 and 17OHP are also affected, and measurement of HCT is required to adjust for these steroids as well. Sample comparison experiments show promise for this approach, with a strong correlation found between plasma and HCT amended results for T, A4 and 17OHP up to 25 nmol/L when using EDTA blood.
Comparisons of A4 and 17OHP in serum and capillary blood collected using Mitra devices showed a similar correlation and bias, suggesting that once amended for HCT concentration, Mitra sampling is a potential alternative to venous sampling. Further sample comparisons covering a wider range of concentrations are needed to fully assess the suitability of the Mitra devices and the use of capillary blood for measurement of A4 and 17OHP.
Although comparison of T showed good correlation when venous plasma was compared with venous WB loaded onto Mitra devices, this was not the case when serum was compared with capillary blood collected onto the Mitra device. A large negative bias of 4.28 nmol/L was apparent which could wrongly characterize men as having hypogonadism. We postulate that this disparity is likely due to differences in the composition of capillary and venous blood and not due to the functionality of the Mitra or the assay itself. Therefore, the generation of reference ranges specific for capillary blood may be required.
There are a number of advantages of using Mitra microsamplers over DBS; Mitra samples are known to be less affected by HCT, require a smaller sample volume and do not rely on cumbersome subpunching from paper. 14 Our results indicate that Mitra devices absorb the same volume of blood reproducibly from samples with a wide range of HCT concentrations. Therefore, this approach could convey an advantage over the use of DBS samples for the monitoring of patients with CAH due to 21-hydroxylase deficiency.
Conclusion
In conclusion, we have developed a fully validated LC-MS/MS method for T, A4 and 17OHP, which is simple and easy to perform on dried blood samples. Our results have confirmed the usefulness of this approach for A4 and 17OHP measurements, thus offering an alternative to monitoring CAH patients. 1 However, further work is required to establish Mitra-specific reference ranges for capillary blood.
Supplemental Material
sj-pptx-1-acb-10.1177_0004563220937735 - Supplemental material for Quantification of testosterone, androstenedione and 17-hydroxyprogesterone in whole blood collected using Mitra microsampling devices
Supplemental material, sj-pptx-1-acb-10.1177_0004563220937735 for Quantification of testosterone, androstenedione and 17-hydroxyprogesterone in whole blood collected using Mitra microsampling devices by David J Marshall, Joanne E Adaway, James M Hawley and Brian G Keevil in Annals of Clinical Biochemistry
Footnotes
Declaration of conflicting interests
The author(s) declared no potential conflicts of interest with respect to the research, authorship, and/or publication of this article.
Funding
The author(s) received no financial support for the research, authorship, and/or publication of this article.
Ethical approval
Ethical approval was granted (IRAS No. 225910) from REC review.
Guarantor
DJM.
Contributorship
BGK and DJM co-designed the study. DJM performed the study. DJM, JEA, JMH and BGK wrote the draft paper. DJM, JEA, JMH and BGK revised the draft paper.
Supplemental material
Supplemental material for this article is available online.
References
Supplementary Material
Please find the following supplemental material available below.
For Open Access articles published under a Creative Commons License, all supplemental material carries the same license as the article it is associated with.
For non-Open Access articles published, all supplemental material carries a non-exclusive license, and permission requests for re-use of supplemental material or any part of supplemental material shall be sent directly to the copyright owner as specified in the copyright notice associated with the article.