
Abstract
Background
Dried blood spot monitoring of nitisinone and succinylacetone in hereditary tyrosinaemia type 1 patients is not widely available in the United Kingdom. Currently, biochemical monitoring utilizes urinary succinylacetone, blood spot tyrosine and phenylalanine monitoring, which can lack in convenience and accuracy, respectively.
Methods
We report the development of a dried blood spot assay for nitisinone and succinylacetone and analysed retrospective clinical and biochemical data for hereditary tyrosinaemia type 1 patients from a single UK centre.
Results
A total of 13 hereditary tyrosinaemia type 1 patients were evaluated. Eleven presented with liver dysfunction (two with associated renal tubulopathy) and two were detected by early sibling screening. All patients (age 0.03–22 months) were commenced on a tyrosine-/phenylalanine-restricted diet and nitisinone at diagnosis. Ten patients were on twice daily dosing and three were on single daily dosing at the start of monitoring. One patient from each dosing group swapped between dosing regimens at 20 years of age and 8 months of age, respectively. A total of 684 dried blood spot samples were analysed; 80% of nitisinone concentrations were between 9.2 and 27 µmol/L when succinylacetone was <0.3 µmol/L. Patients on twice daily dosing regimens had significantly higher nitisinone concentration compared with those on once daily dosing (P < 0.0001). The median dose required in the twice daily doing group was significantly lower when compared with once daily dosing.
Conclusions
Dried blood spot monitoring for nitisinone and succinylacetone concentrations in hereditary tyrosinaemia type 1 patients is a rapid and convenient method which allows physicians to individualize treatment plans and observe adherence to treatment.
Introduction
Hereditary tyrosinaemia type 1 (HT1; or hepatorenal tyrosinaemia, OMIM 276700) is a rare autosomal recessive disorder of tyrosine (Tyr) metabolism caused by a deficiency of the enzyme fumarylacetoacetate hydrolase (FAH). The incidence worldwide is estimated at 1 in 100,000; however, in regions such as Quebec, Turkey and India, the incidence has been noted to be significantly higher. 1
The FAH enzyme catalyses the final step in the degradation of Tyr and results in the accumulation of intermediate metabolites fumarylacetoacetate (FAA) and maleylacetoacetate (MAA). FAA and MAA are very reactive and unstable and therefore cannot be detected in serum or urine. However, their degradation products succinylacetone (SA) and succinylacetoacetate (SAA) which are also toxic can be measured in the serum and urine. Together these intermediary metabolites and their derivatives account for the subsequent tissue injury and clinical manifestations. 2
Clinical symptoms can be variable, but HT1 classically presents in the first few weeks to months of life with liver failure and renal tubulopathy. A later onset, more chronic form can present with neurologic crises or hepatocellular carcinoma. Left untreated, HT1 leads to progressive liver failure, hepatocellular carcinoma and can be fatal. 2
Prior to 1992, affected patients would be immediately commenced on a Tyr/phenylalanine (Phe)-restricted diet. However, diet alone did not prevent the accumulation of toxic metabolites and hence the disease progressed regardless. The only available definitive treatment at that time was orthotopic liver transplantation. 3
In 1992, the introduction of nitisinone (2–(2-nitro-4-trifluromethlybenzoyl)-1, 3-cyclohexanedione (NTBC) transformed the management of HT1. NTBC is a potent inhibitor of 4-hydroxyphenylpyruvate dioxygenase (HPPD) and reduces the flux of metabolites through the Tyr catabolism pathway. NTBC received FDA and EU Drug Agency approval in 2002 and 2005, respectively. NTBC in conjunction with a Tyr- and Phe-restricted diet has since become the standard therapeutic regimen in HT1. 4 Liver transplantation is now only indicated in the minority of HT1 patients, i.e. the development of HCC or in areas where access to specialist treatment is limited.
In most patients, NTBC therapy is initiated with a dose of 1–2 mg/kg/day, given in two divided doses. 5 Guidance to this dosage was based on clinical, biochemical and pharmacokinetic observations. Testing with human HPPD showed NTBC to have an inhibitory constant of 5 nM.6,7 Thus, a plasma concentration of 35 µM would theoretically inhibit 99.9% of the activity of HPPD. From a clinical perspective, one could monitor the plasma concentration of NTBC and adjust the daily dosage to maintain plasma concentrations between 40 and 60 µM and be confident of satisfactory inhibition. 7 This has led some physicians to routinely monitor plasma NTBC concentrations and adjust doses accordingly. The target therapeutic NTBC concentration varies greatly between individuals and within the patients with time.8,9 The ‘recommended’ plasma and dried bloodspot (DBS) NTBC concentrations range from 30 to 70 µmol/L and 20 to 40 µmol/L, respectively.10,11 In centres where NTBC monitoring is not available, clinicians aim for undetectable SA (in urine or blood) and maintain doses to approximate 1 mg/kg/day according to weight. However, doses of NTBC as low as 0.55 mg/kg/day have been found to achieve biochemical success. 12
At present, there is no available evidence supporting one monitoring approach over the other. The chosen approach is often guided by local guidelines and the availability of laboratory facilities to perform analysis of NTBC and/or SA concentrations.
In this report, we will evaluate DBS monitoring for NTBC and SA in a tertiary metabolic centre in the UK. We aim to answer the following questions: (1) Do NTBC concentrations differ between different NTBC dosing regimens? (2) Is there a relationship between NTBC dose and NTBC concentration? (3) Is there a relationship between NTBC and SA? (4) Can we recommend a target range for DBS NTBC concentration?
Methods
Patients
A retrospective analysis of clinical and biochemical data was performed for all patients with HT1 at the Evelina London Children’s Hospital and St Thomas’s Hospital from May 2012 to May 2018. Clinical data were reviewed using electronic and paper medical records. Biochemical data including DBS NTBC, SA, Tyr and Phe concentrations were collected. Drug dosage, dosing regimens and follow-up data were also collected. Ethical approval was not required as this was an anoymized retrospective collection of data.
All HT1 routinely patients perform home monitoring for Tyr and Phe concentrations in DBS samples. The frequency of monitoring (weekly to monthly) was based on age and adherence to monitoring. Patients less than two years are expected to perform weekly DBS monitoring, 2–16 years fortnightly to monthly and >16 years at least monthly.
In May 2012, DBS NTBC and SA analysis was established for clinical use by the inherited metabolic disease service at the Evelina London Children’s Hospital. (See quantitative analysis below). DBS samples collected during the study period underwent simultaneous analysis for multiple analytes (including NTBC, SA, Tyr and Phe).
All patients had supervised protein restriction and amino acid supplementation. Dietary changes were made based on DBS Tyr concentration (target concentration: 200–400 µmol/L), and Phe was supplemented to maintain concentrations greater than 30 µmol/L.
The proposed target range for DBS NTBC was between 20 and 40 µmol/L10,11 with a SA <0.3 µmol/L.
NTBC and SA quantitative analysis
A new LC-MSMS assay for NTBC and SA in patients with HT1 was validated, initially using a Sciex API5000 triple quadrupole mass spectrometer with subsequent transfer to a Sciex API6500 Qtrap instrument (Sciex, Warrington UK) . Following the addition of stable isotope-labelled internal standards (13C6-NTBC, 13C5-SA, 2H4-methionine, 13C6-Tyr and 13C6-Phe), 3-mm blood spots were extracted with 3% formic acid in methanol. SA was quantified in negative MRM mode; m/z_157.1/99.1, 157.1/114.9, and polarity was switched for NTBC measurement in positive MRM mode (m/z330.3/218.2, 330.3/126.1), inject-inject time was 3.5 min using a C18 column (Agilent Poroshell 120, 4.6 × 50 mm, 2.7 µm particle size) with gradient elution. Buffer A was 50% water/acetonitrile, 0.025% formic acid and buffer B 100% acetonitrile 0.025% formic acid. Starting solvent was 60% buffer A, with a gradient to 10% buffer A over 1.5 min followed by a return to starting conditions for the next inject. Quantitation limits are 0.3 µmol/L for SA and 0.5 µmol/L for NTBC. Amino acids can be quantitated from a second injection of supernatant onto a Teicoplanin column (Chirobiotic T, Merck Supelco 2.1 mm × 100 mm), with isocratic elution using 50% water/acetonitrile, 0.025% formic acid.
Statistics
Baseline data are presented as either mean and range, median with interquartile range (IQR), or number and (%) where appropriate. Significance of difference was evaluated by the Mann Whitney test and Kruskal-Wallis test. A P-value of <0.05 was considered statistically significant.
Statistical analyses were conducted with the statistical program Prism 7 (GraphPad Software, San Diego, CA, USA).
In order to correlate NTBC with SA concentration, values from commencing NTBC and up to four weeks after were excluded from this particular analysis. This was to allow for the elevation of SA prior to starting treatment and achieve stable state at four weeks of NTBC.
Results
Demographics
Thirteen HT1 patients were identified (4 male) from 11 families. Four patients were Turkish, four British, three Pakistani and two of Indian origin. Seven patients had consanguineous parentage (Supplemental material Table 1).
The mean age at diagnosis was 6.3 months (range, 0.03–23 years). At presentation, 11 patients had liver dysfunction (two with associated renal tubulopathy). Of the remaining two who were asymptomatic at presentation, one was diagnosed on day 1 due to a previous affected sibling and one had elevated Tyr on newborn screening.
All patients were commenced on a Tyr-/Phe-restricted diet and NTBC (1 mg/kg/day) at time of diagnosis. At time of NTBC initiation, 10 patients were started on twice daily dosing and 3 were started on a single daily dose. Patient 5 was converted to once daily dosing after 20 years and patient 13 was changed to twice daily dosing due to low NTBC concentrations at 8 months of age.
All patients showed resolution of hepatopathy and renal tubulopathy with the commencement of NTBC and dietary therapy. No patients developed hepatocellular carcinoma during the study period and none required liver transplantation. No adverse effects of NTBC therapy have been reported in our case series.
The median duration of treatment was nine years (IQR 6.1, 15.9) and the median age at last follow-up was nine years (IQR 5.8, 15.7).
NTBC/SA concentrations
A total of 684 DBS samples were analysed; mean number per patient was 52 (range, 13–101).
The median NTBC concentration was 17 µmol/L (IQR 12.6, 21.7), and median and IQR of SA was 0.3 µmol/L (actual range of 0.3–7.9).
The median NTBC concentration in 650 samples with SA < 0.3 µmol/L was 17.2 µmol/L (IQR 12.8, 21.7). Thirty-four samples had SA > 0.3 µmol/L and median NTBC concentration was 12.6 µmol/L (IQR 3.92, 17.6). NTBC concentrations were significantly higher in samples with SA < 0.3 µmol/L (P = 0.0003) (Figure 1).
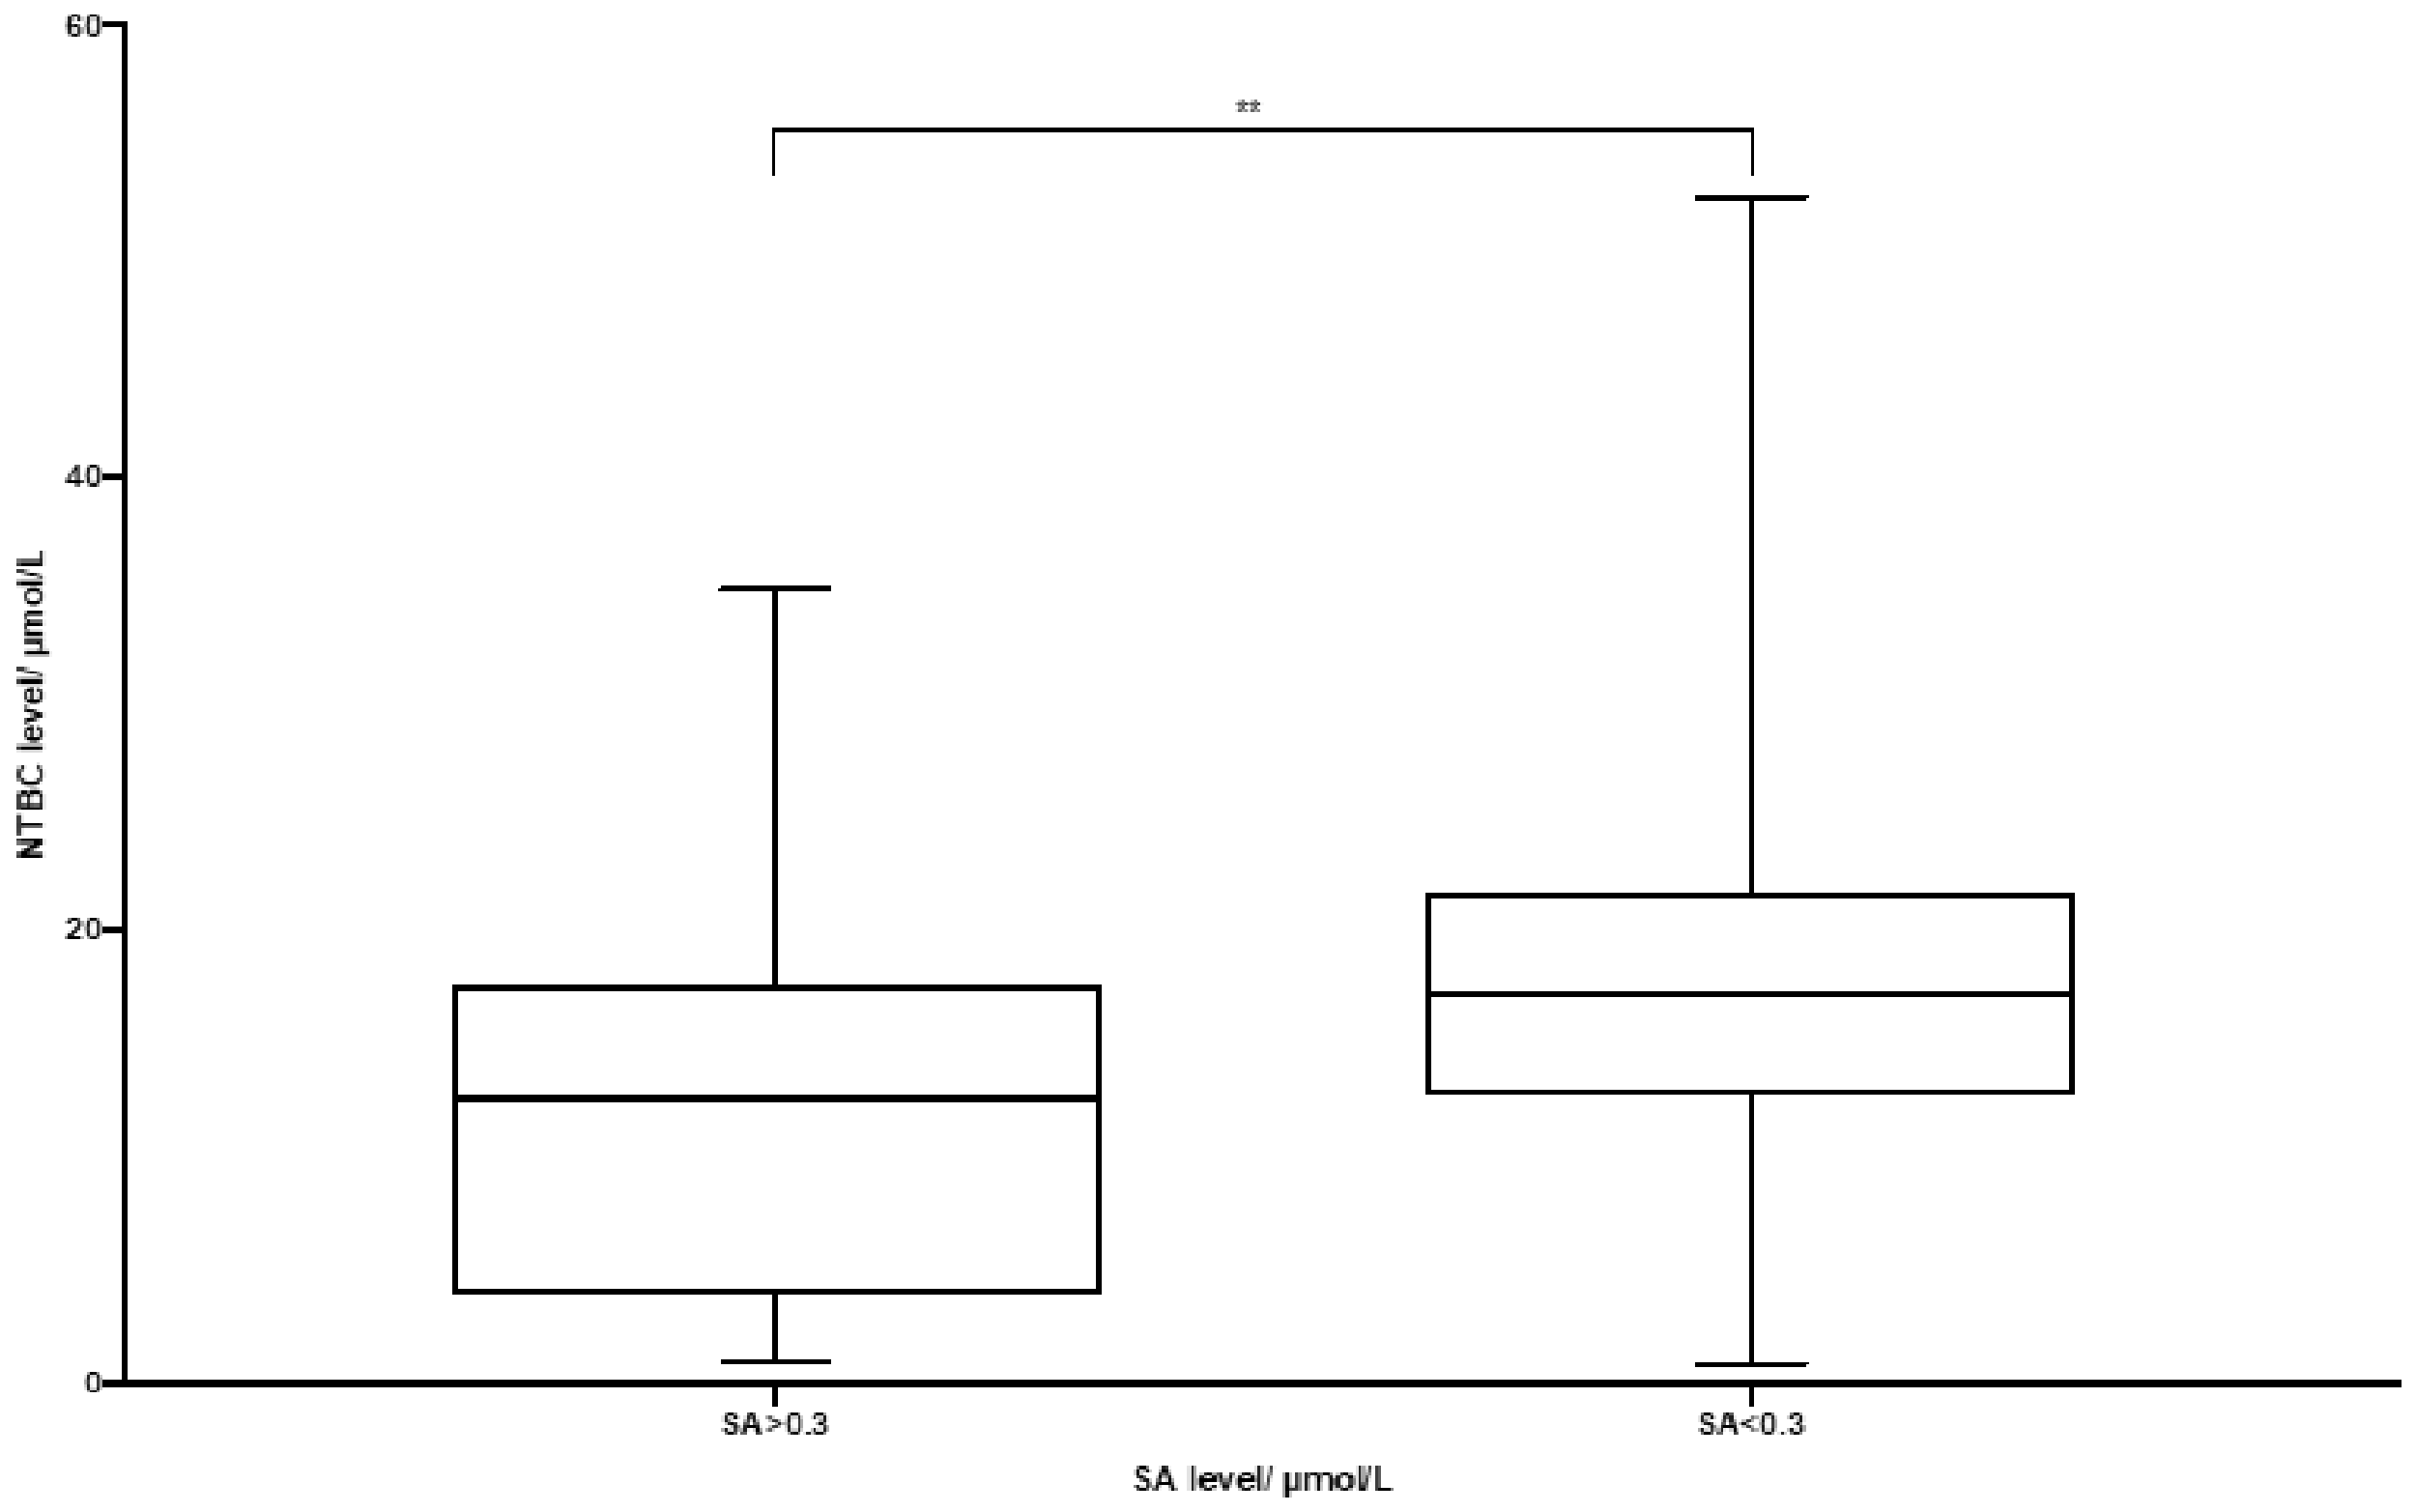
NTBC and SA concentrations.
NTBC was within the target range of 20–40 µmol/L in 32% of samples with SA < 0.3 µmol/L. When SA was <0.3 µmol/L, 80% of NTBC concentrations were between 9.2 and 27.0 µmol/L (10th–90th centile range) (Figure 2).
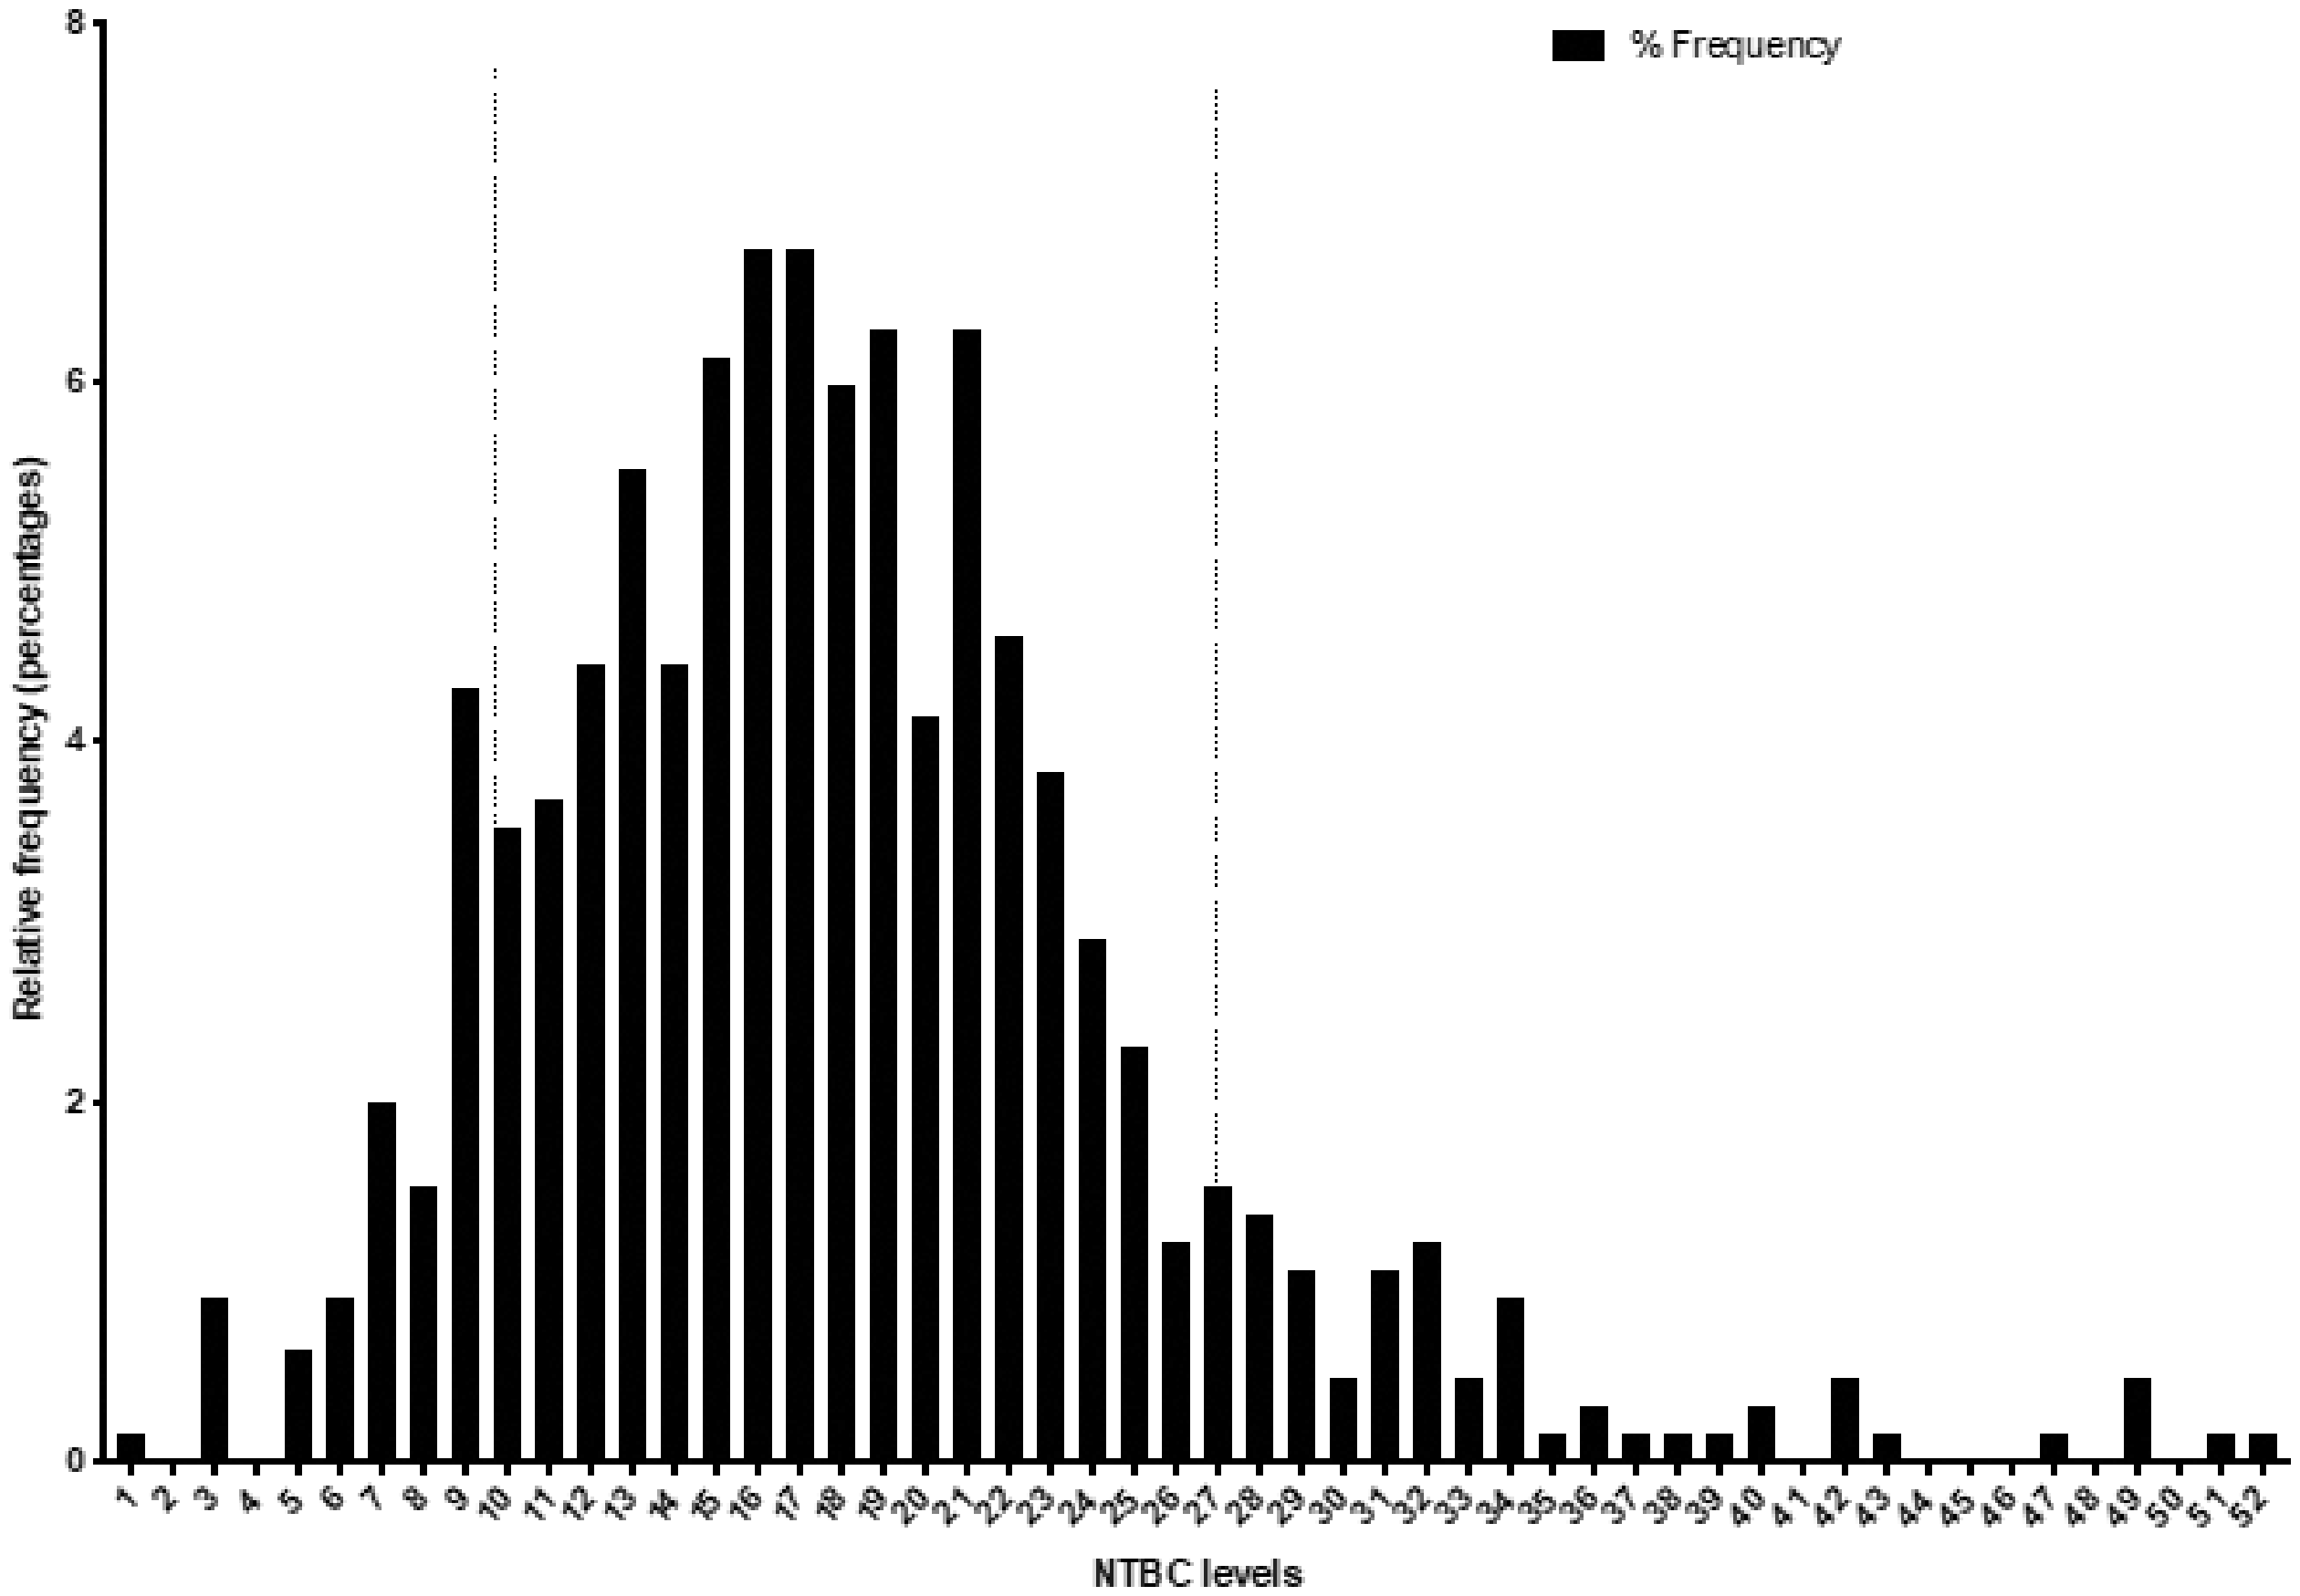
NTBC concentrations with SA < 0.3.
NTBC/dosing
A total of 563 samples were from patients on twice daily dosing regimen and a median daily dose of NTBC of 0.93 mg/kg/day (IQR 0.85, 1.0). A total of 139 samples were from those on once daily dosing with a median daily dose of 1.05 mg/kg/day (IQR 0.96, 1.17). The median daily dose was significantly (P < 0.0001) lower in those on twice daily dosing (Figure 3).
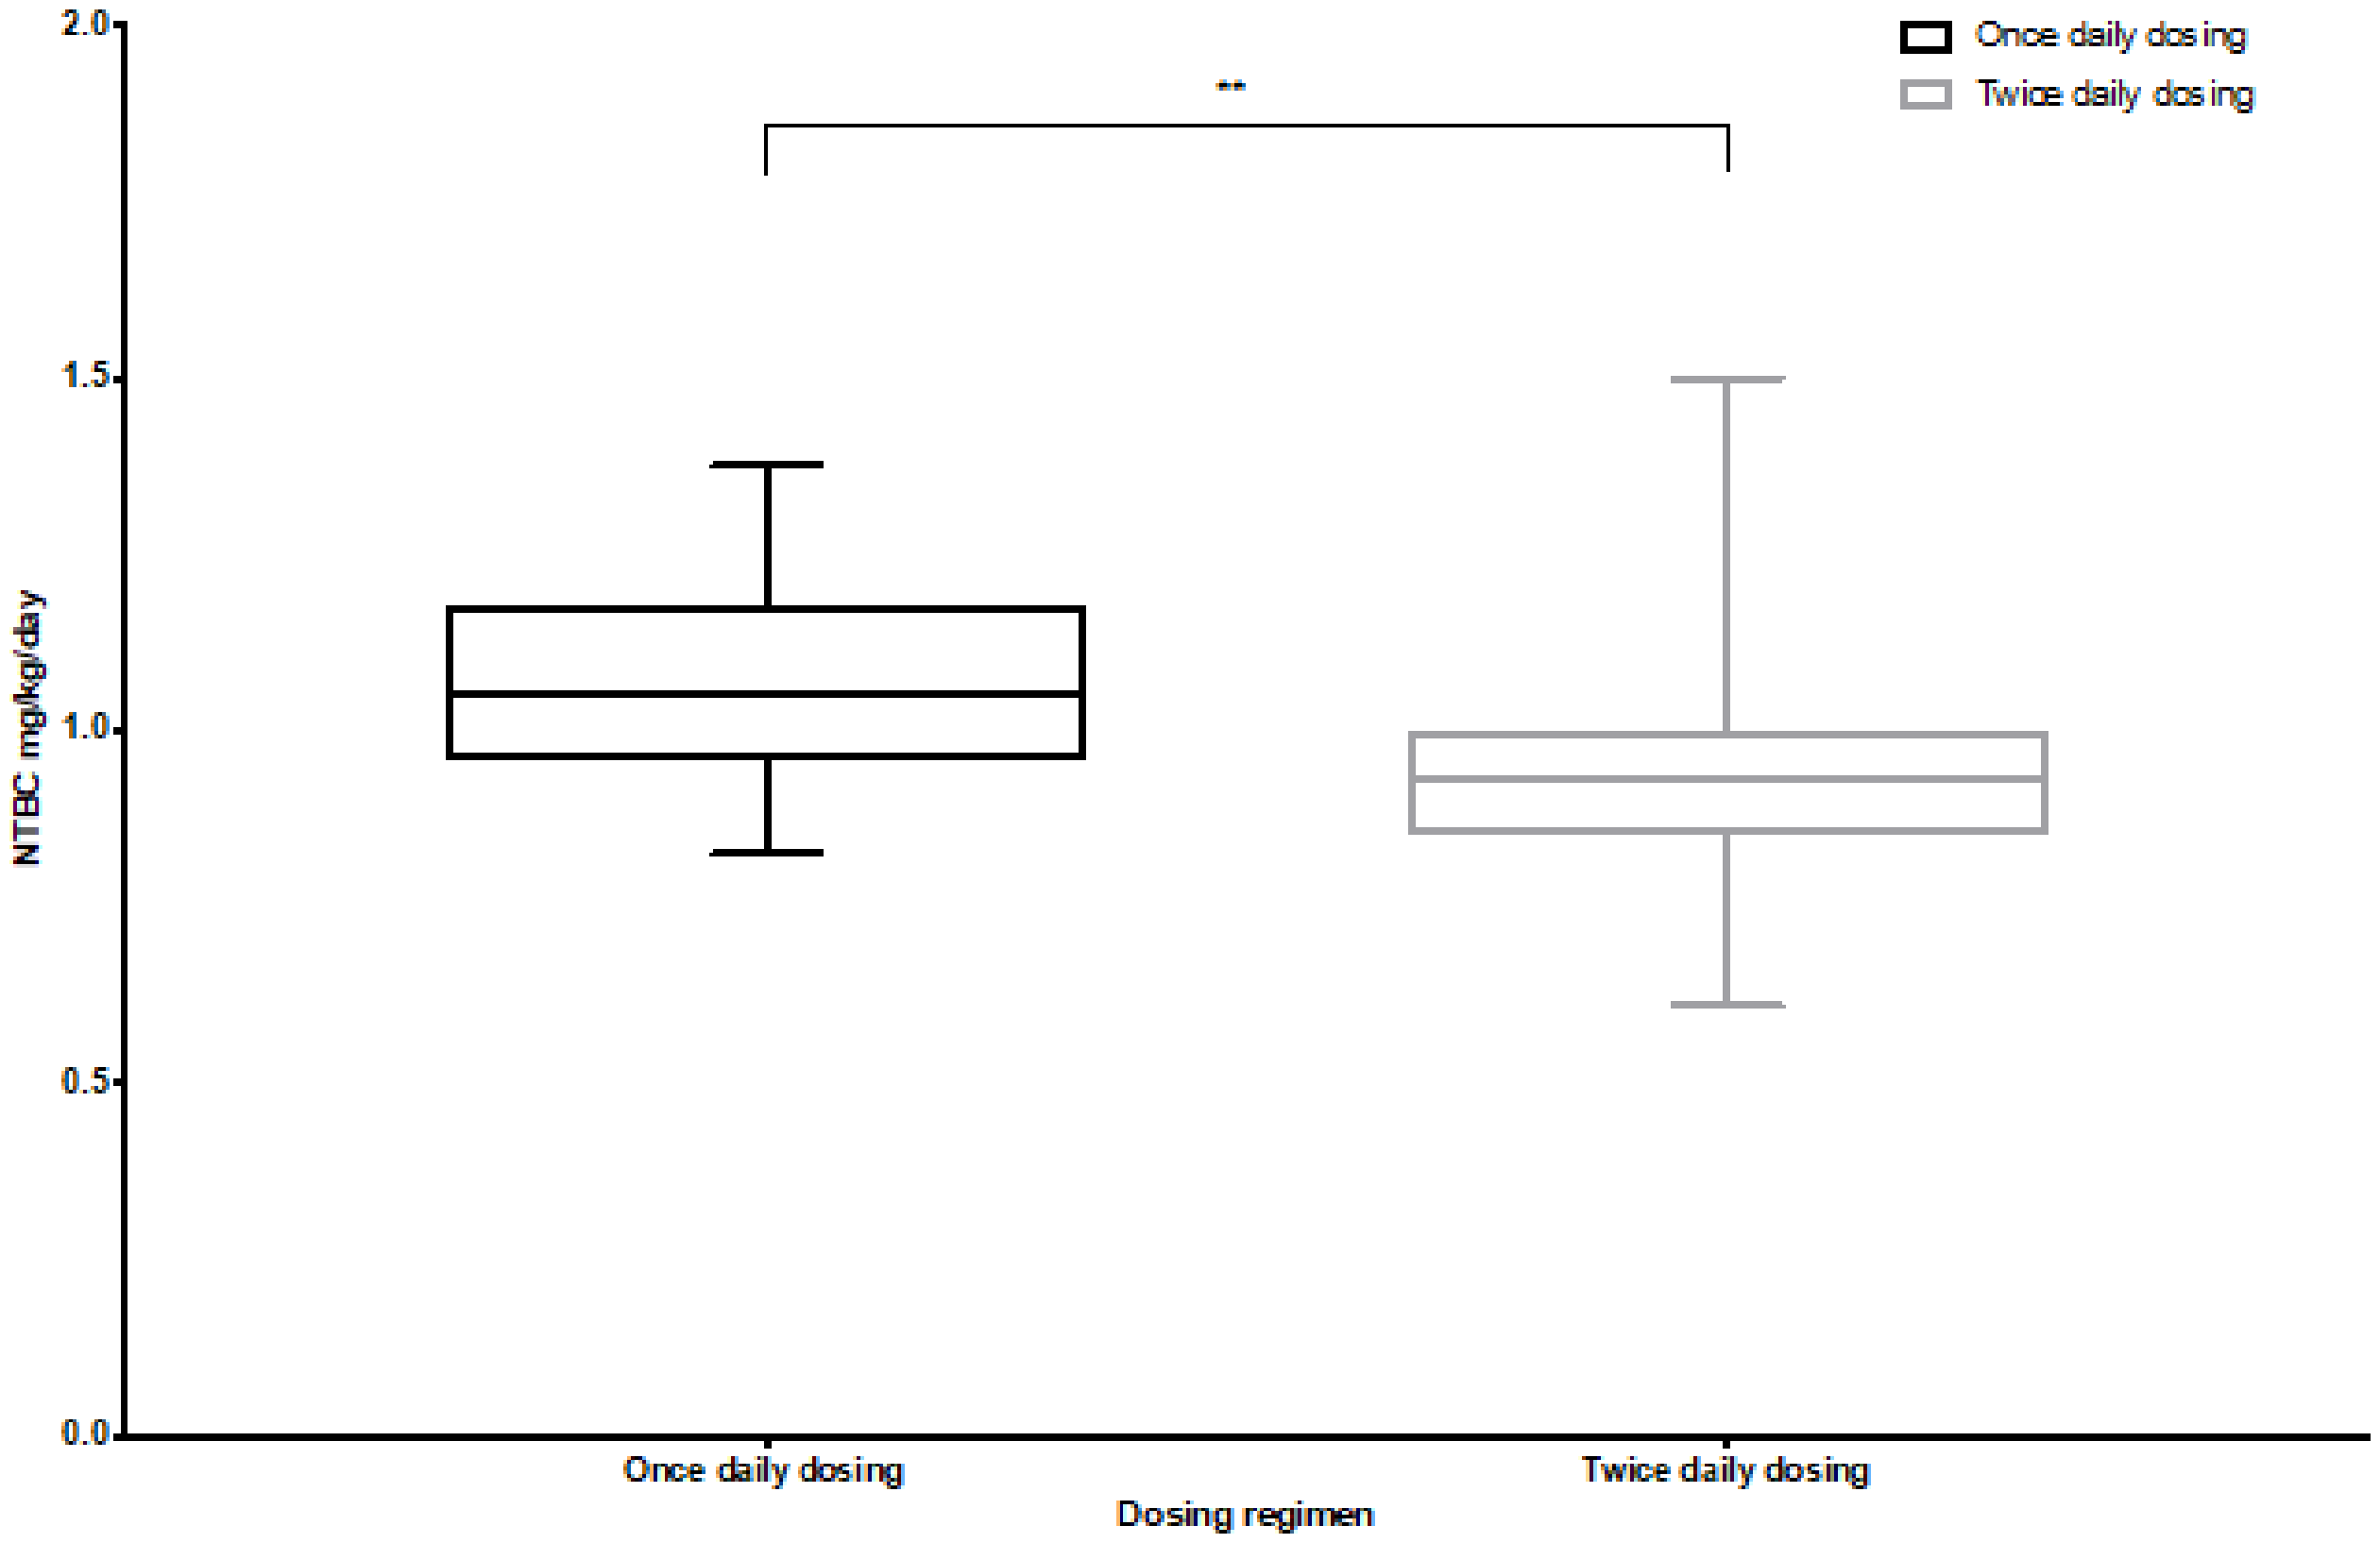
NTBC daily dosage and daily dosing regimen.
In the twice daily dosing group (n = 563), 3.3% (19) had detectable SA, and in the once daily dosing group (n = 139), 21.5% (30) had detectable SA.
The median NTBC concentration for patients on twice daily dosing was 17.4 µmol/L (IQR 13.6, 22.4) and for those on once daily dosing was 14.5 µmol/L (IQR 9.9, 18.8). This was significantly higher (P < 0.0001) (Figure 4).
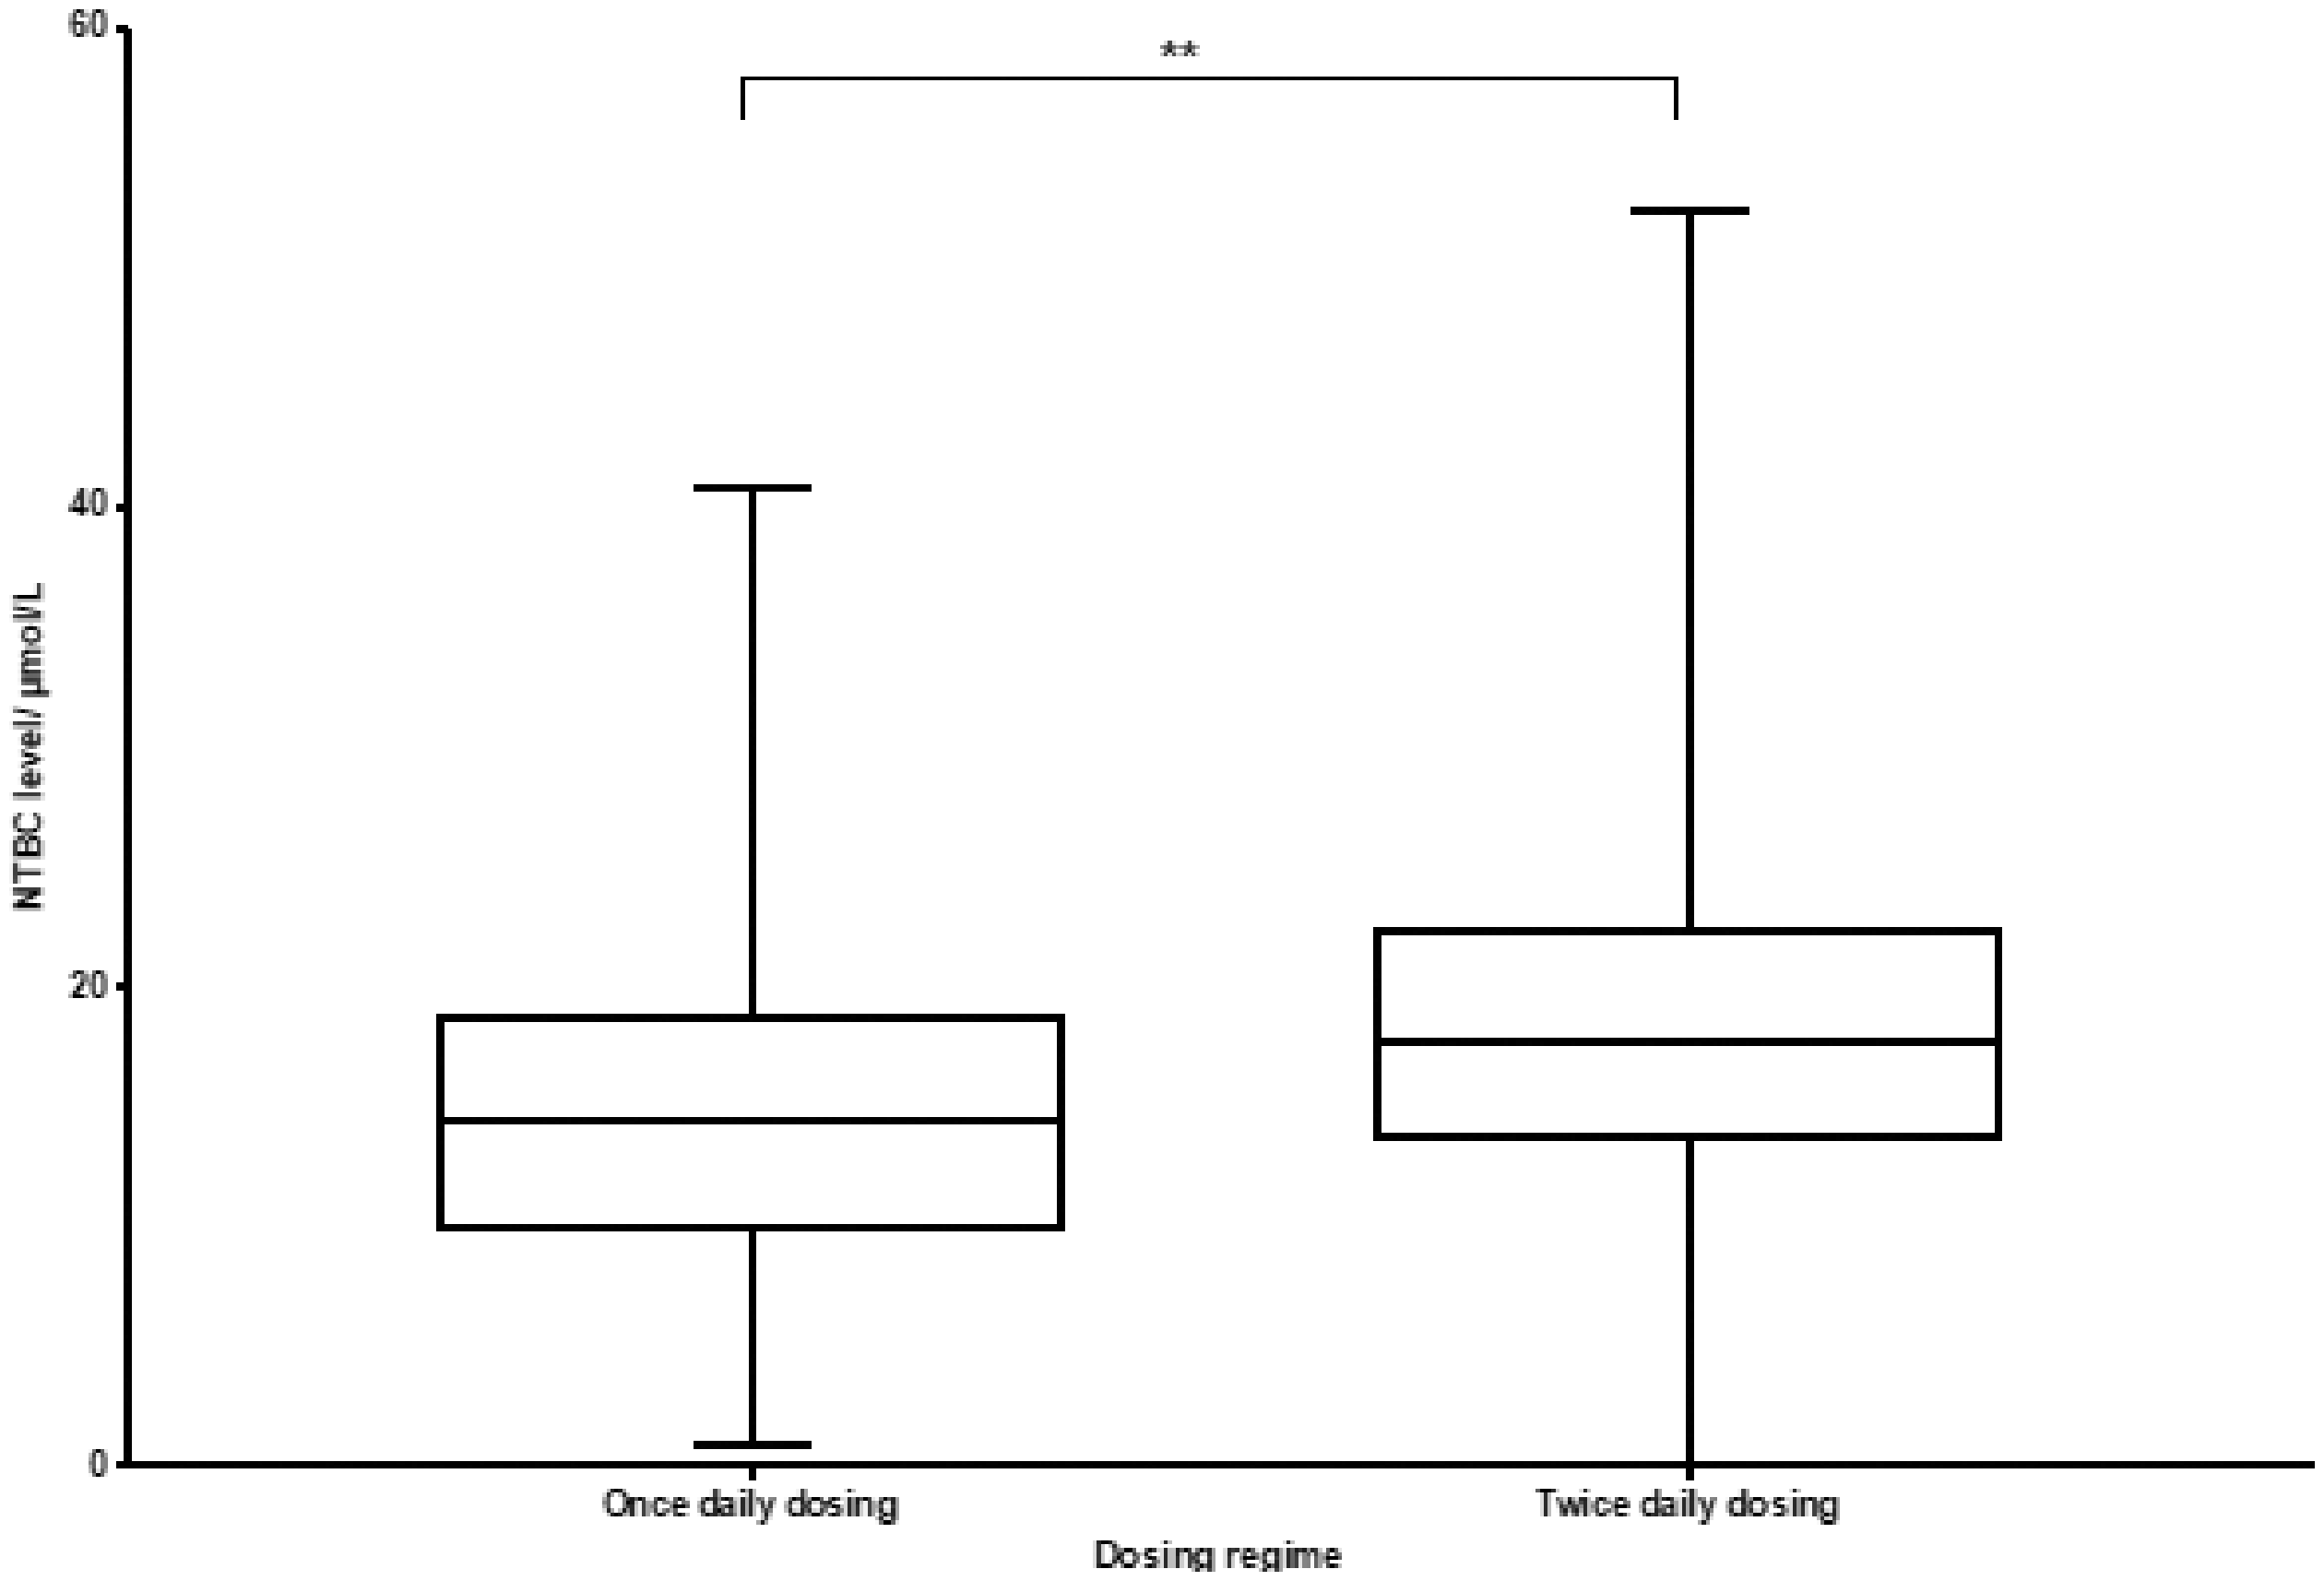
NTBC concentrations and dosing regimens.
The median dose of NTBC overall was 0.95 mg/kg/day (range 0.61–1.5, IQR 0.87, 1.04). The median NTBC dose with SA < 0.3 µmol/L was 0.96 mg/kg/day (range 0.61–1.5; IQR 0.87, 1.05). The median NTBC dose with SA > 0.3 µmol/L was 0.93 mg/kg/day (range 0.73–1.35; IQR 0.47, 1.06). There was no significant difference (Figure 5).
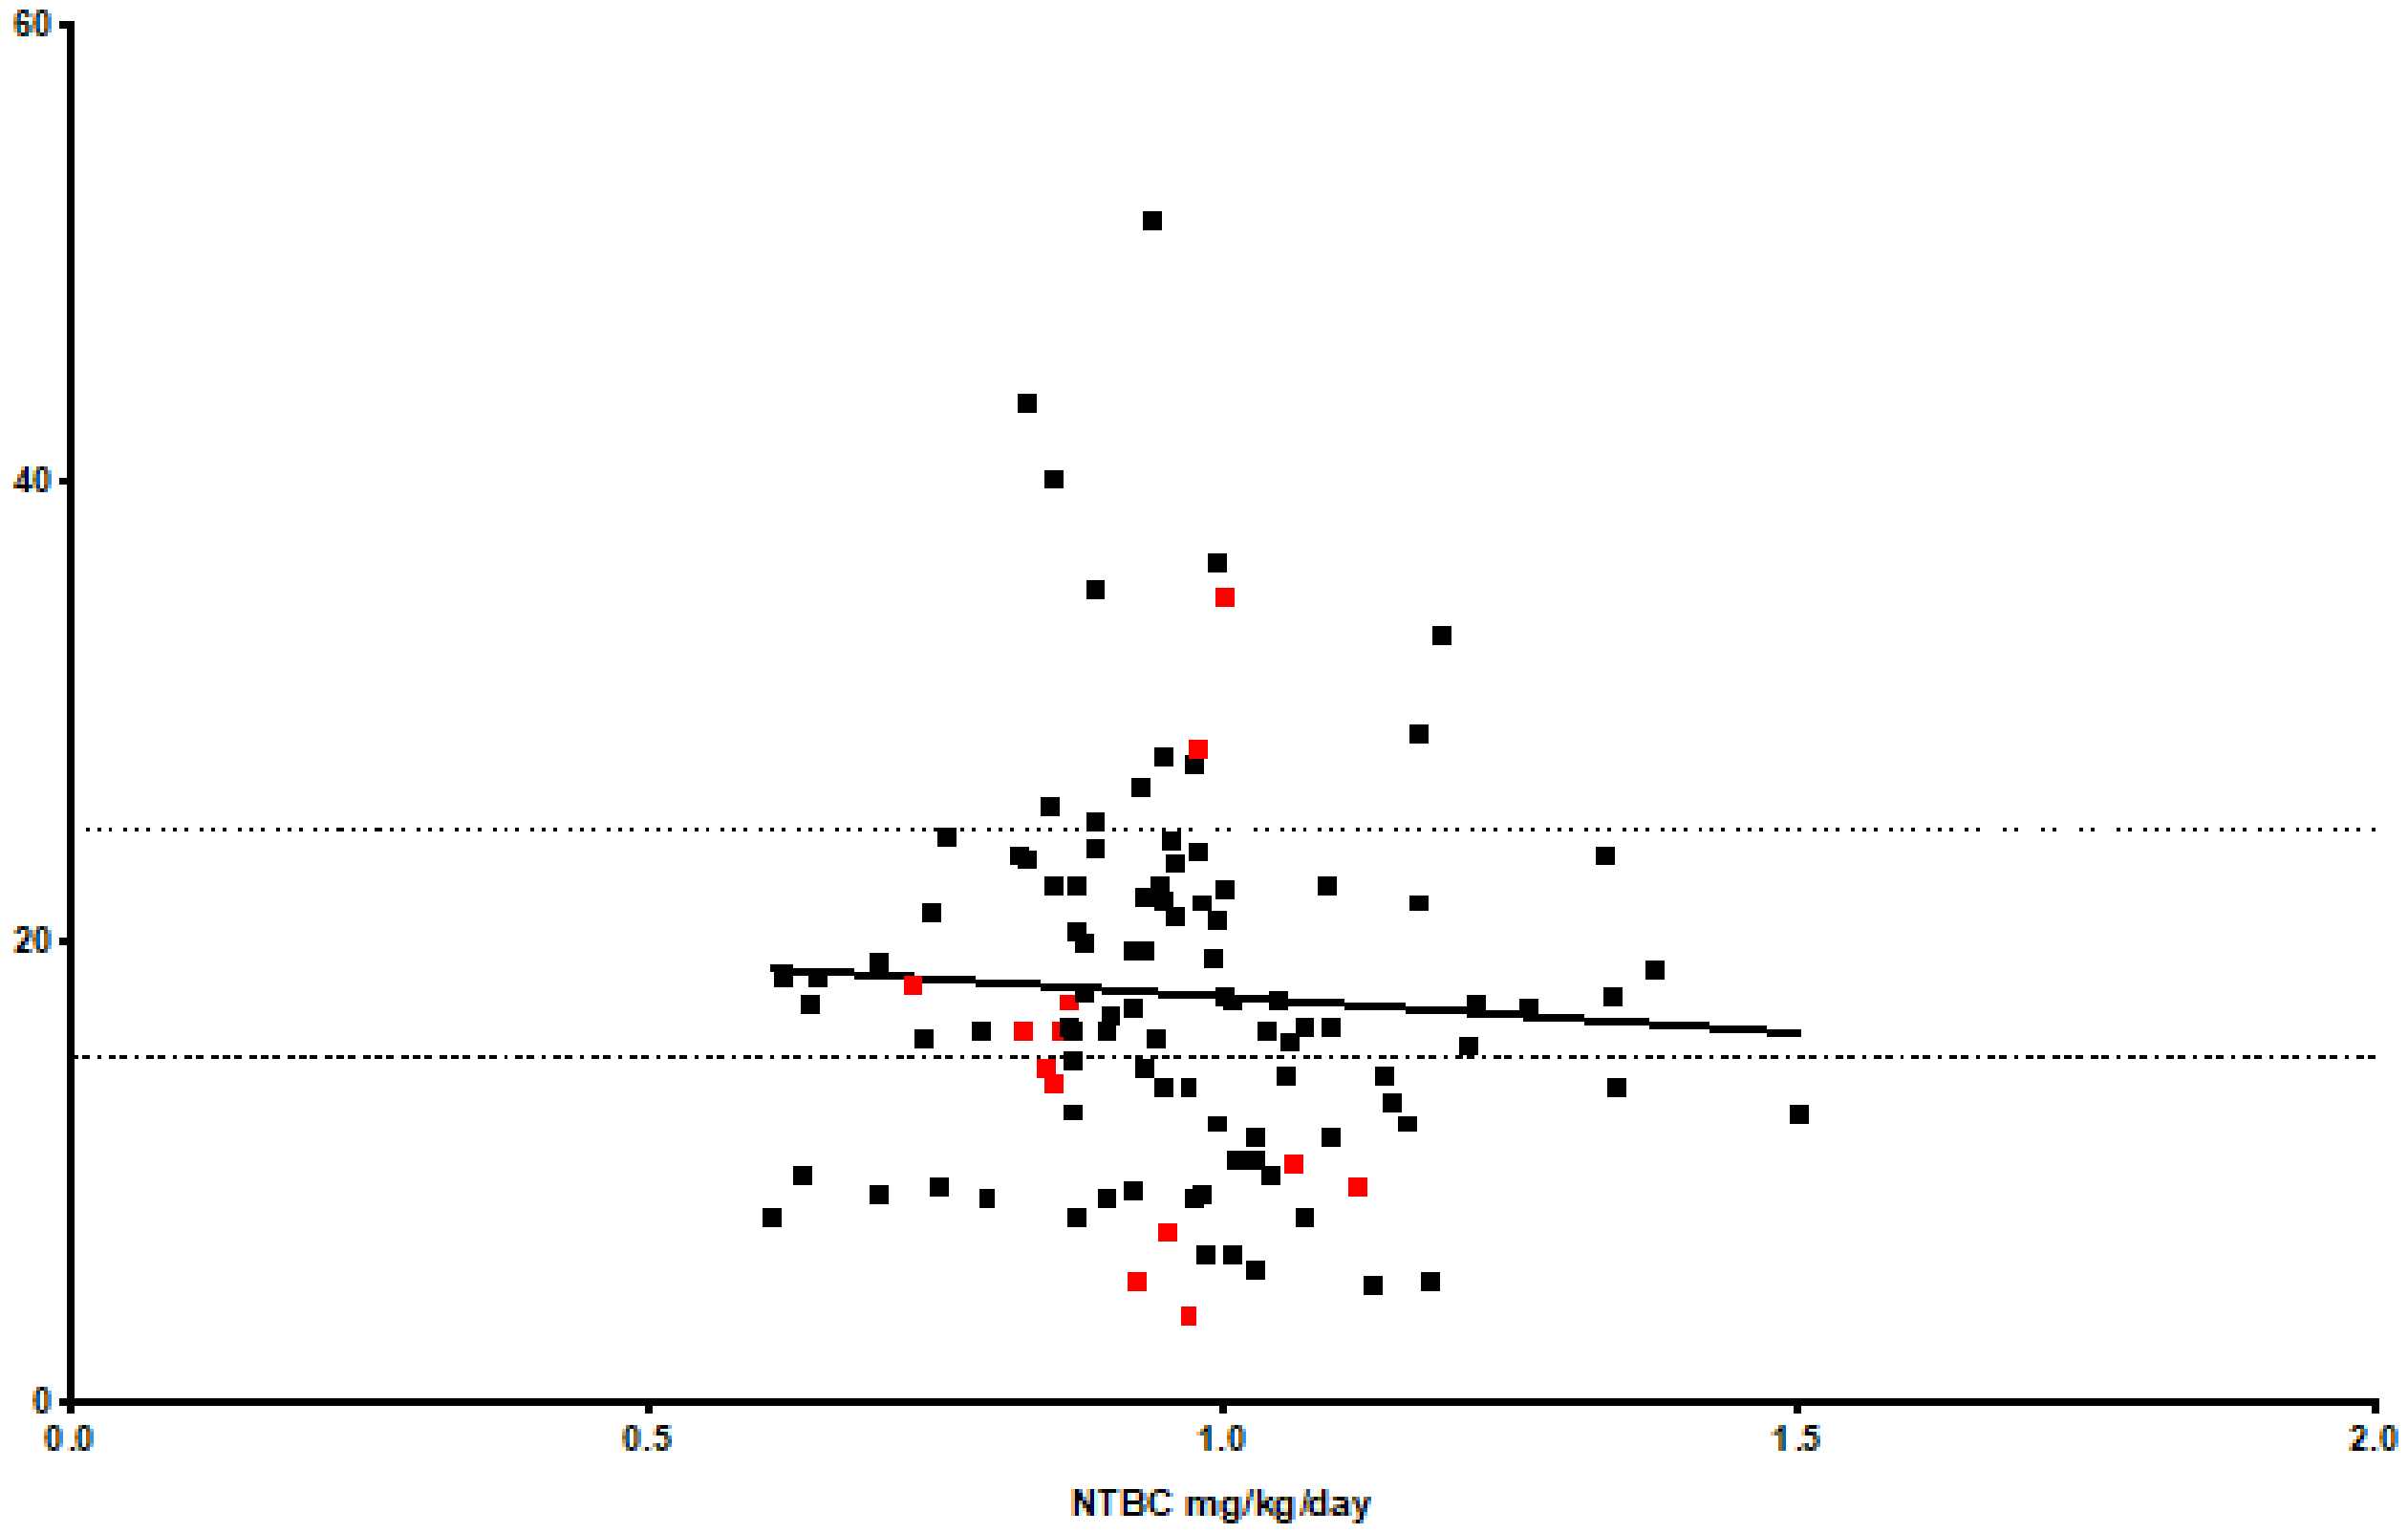
NTBC mg/kg/day and concentration.
Subgroups by age
Tyr and Phe concentrations were analysed in three age group categories; Group 1: <2 years (n = 126), Group 2: 2–16 years (n = 494) and Group 3: >16 years (n = 344). The median Tyr and Phe concentrations were: Group 1; Tyr 326 µmol/L (IQR 243, 396) and Phe 27 µmol/L (IQR 19, 40); Group 2; Tyr 349 µmol/L (IQR 287, 440) and Phe 37 µmol/L (IQR 29, 46) and Group 3; Tyr 446 µmol/L (IQR 353, 615) and Phe 42 µmol/L (IQR 37–46). There was a significant difference between age group categories for Tyr and Phe (P < 0.0001).
In Group 1, 65% of samples were within the Tyr target range of 200–400 µmol/L and 44% of Phe concentrations were >30 µmol/L.
In Group 2, 62% of samples were within the Tyr target range and 70% of Phe concentrations were >30 µmol/L.
In Group 3, 34% of the samples were within the Tyr target range and 86% of Phe concentrations were >30 µmol/L.
The median NTBC concentrations per age group were as follows: Group 1, 14.8 (range 0–40.8, IQR 11.1, 20.3); Group 2, 17.2 (range 2.6–52, IQR 13.2–21.7) and Group 3, 18.9 (range 2.8–41.7, IQR 10.7–24.8). There was a significant difference between age groups; P = 0.0077 (Figure 6).
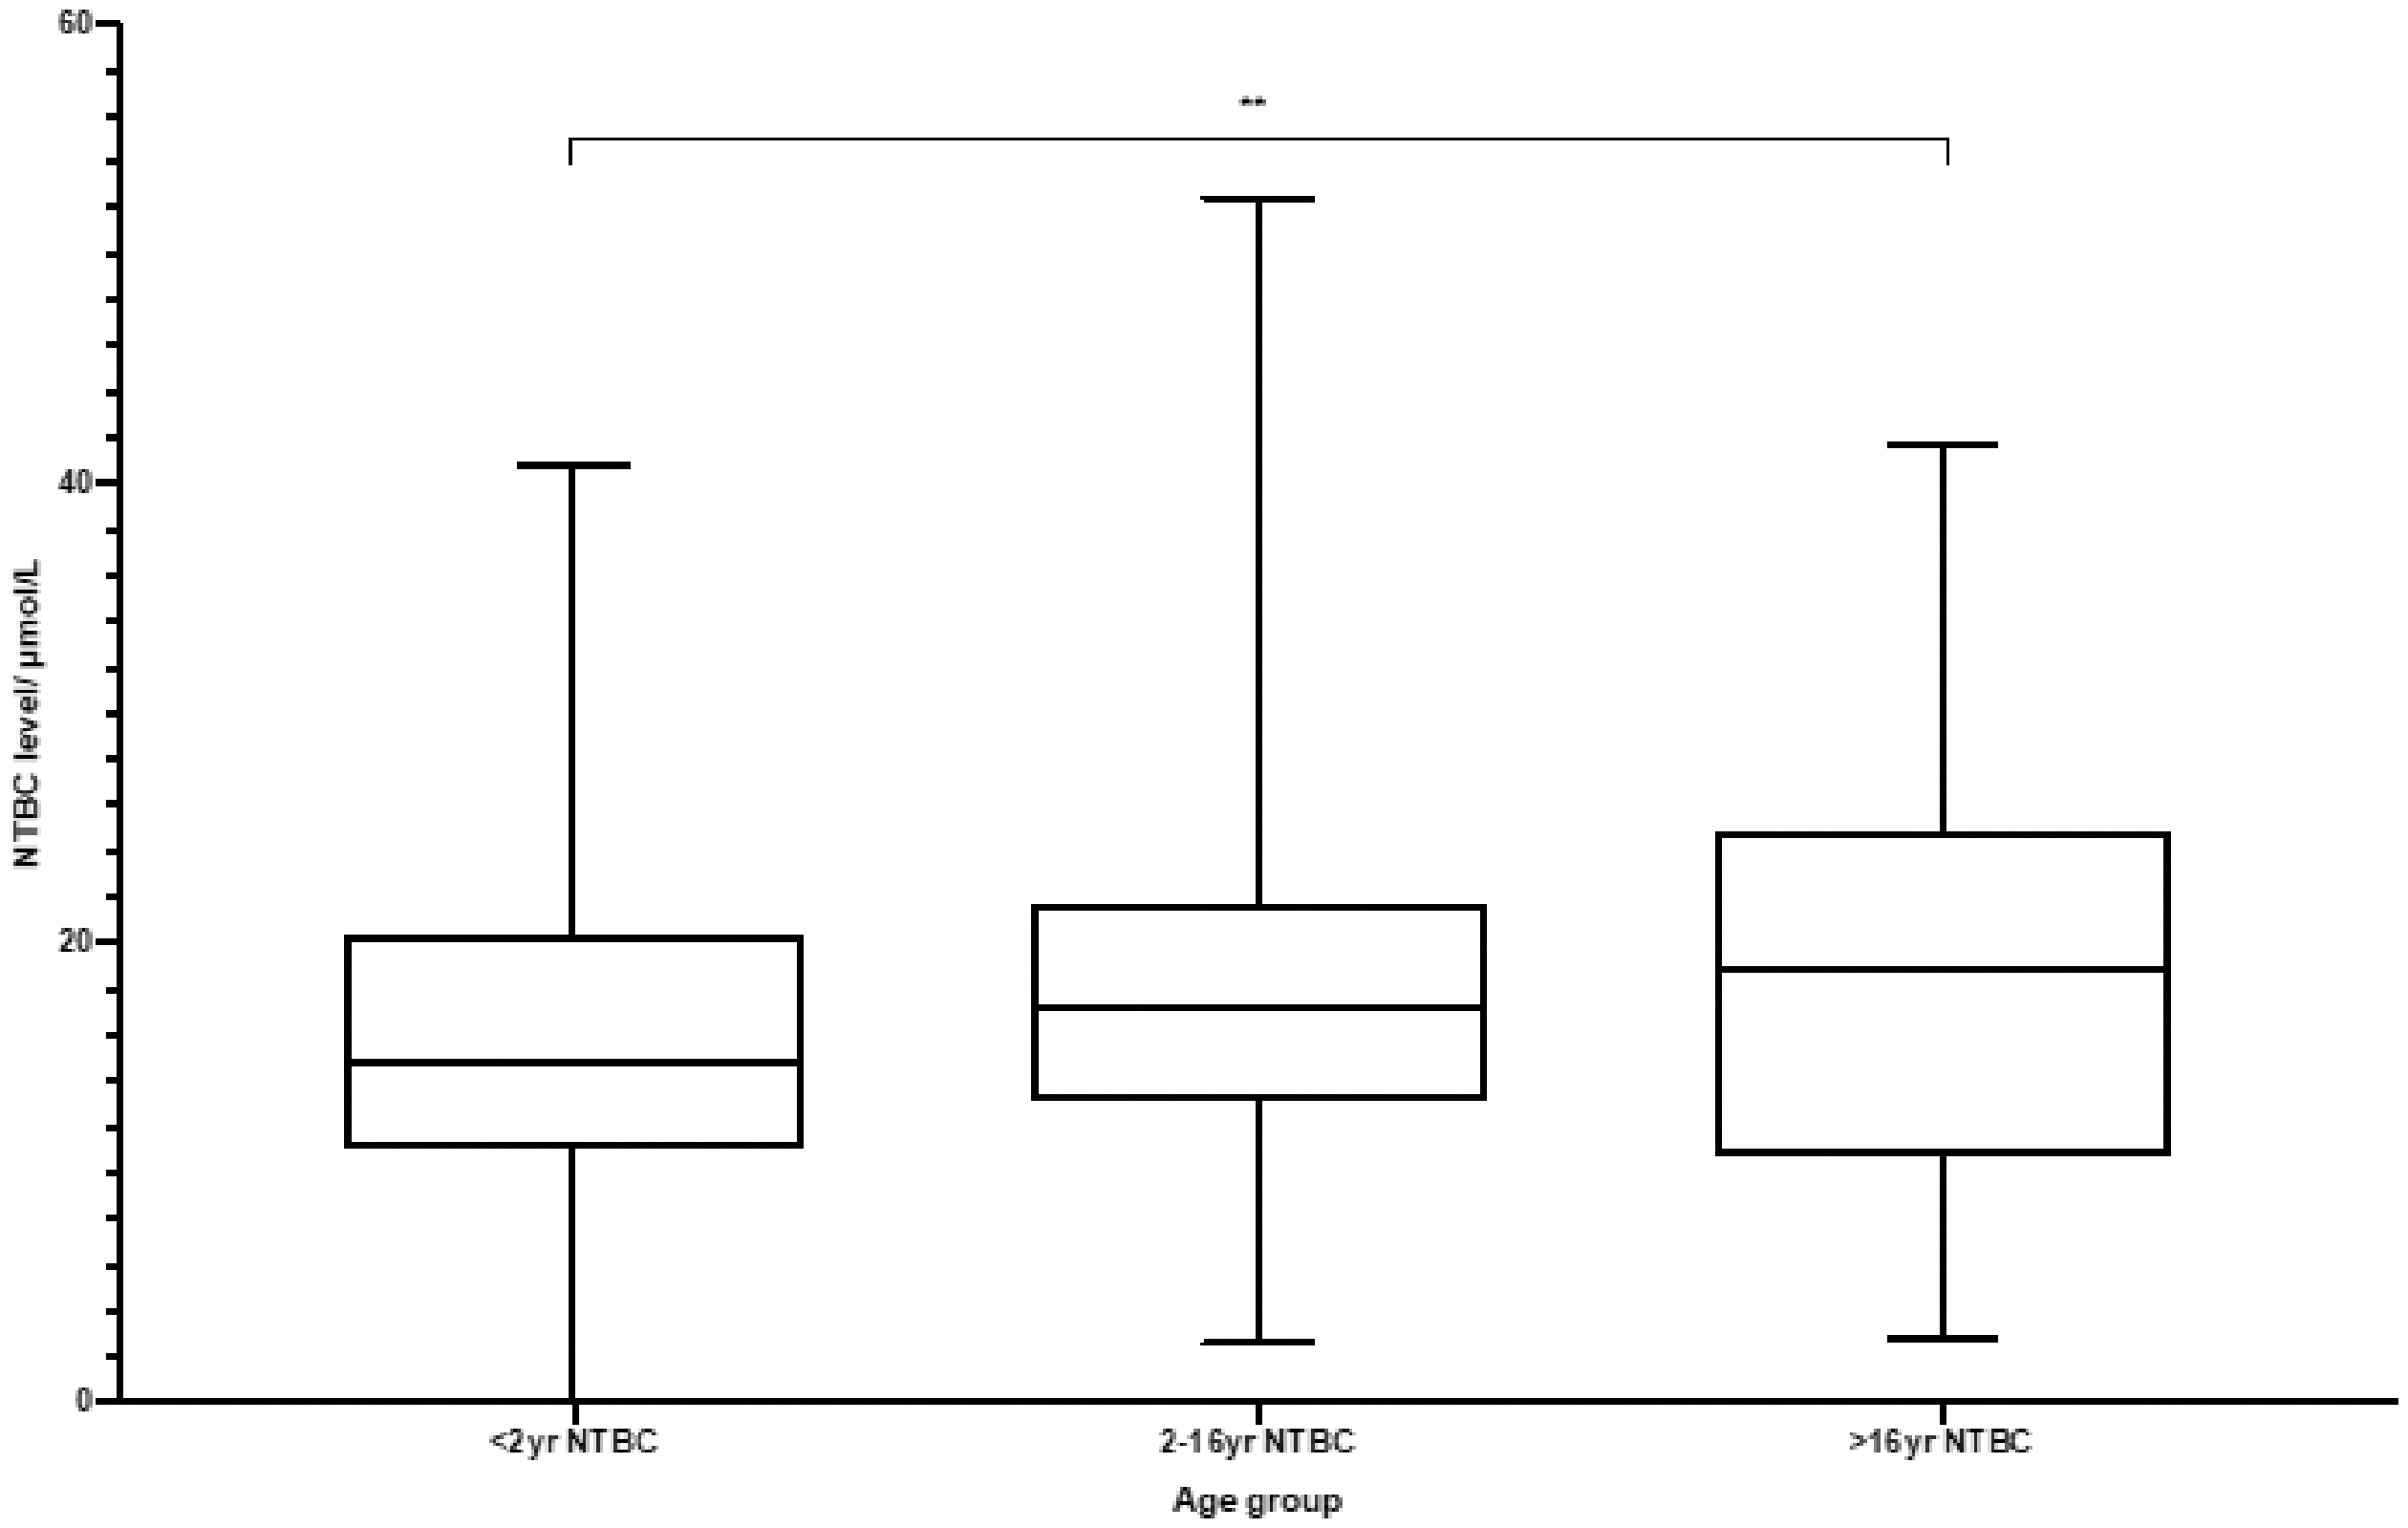
NTBC concentrations for age subgroups.
Discussion
The outcomes of patients with HT1 improved dramatically since the introduction of NTBC in 1992 13 due to its ability to prevent the accumulation of toxic metabolites with resolution of liver failure and renal tubulopathy. The result is an increased number of patients who have not required liver transplantation and remain on long-term treatment with NTBC. We present the clinical utility of DBS monitoring in HT1 with the addition of NTBC and SA at a UK centre.
DBS monitoring for NTBC has been reported in the literature in HT1 patients since 2011.14–16 This method is not widely available in the United Kingdom, and current biochemical monitoring utilizes urinary SA and bloodspot Tyr/Phe monitoring. It is well known that NTBC must be continued without interruption and failure to adhere may result in serious complications including acute liver failure, neurological crisis (acute porphyria-like crisis with abdominal pain, muscle weakness and respiratory failure) and hepatocellular carcinoma. Monitoring adherence to NTBC with Tyr/Phe alone can often be difficult, as the Tyr concentrations can still fall within the target range without adequate NTBC dosing. The availability of NTBC monitoring prior to 2012 required samples to be sent outside of the UK and results were not received in a timely manner. This led to the development of a novel DBS testing method by LC-MSMS for NTBC with SA, Tyr and Phe at our centre. Our assay has been compared with other DBS methodology and with NTBC measurements using plasma as the primary sample, in a Europe-wide multicentre comparison trial. 17 External quality assurance for DBS NTBC and SA is now available via the ERNDIM organization. The stability of NTBC and SA in DBS samples has previously been reported.16,18
Target NTBC concentrations in plasma and DBS samples are uncertain and vary from 20 to 50 µmol/L. 9 Complete suppression of SA is required and the dose that achieves this can be variable. We have shown that DBS NTBC concentrations were found to be significantly higher in those with corresponding undetectable SA concentration (<0.3 µmol/L) compared with those with detectable SA concentrations. This is an expected finding and would correspond with adherence to treatment.
A third of all NTBC concentrations fell within the previously reported target range of 20–40 µmol/L.10,11 When all NTBC concentrations were analysed, 80% (with undetectable SA) fell between 9.2 and 27.0 µmol/L (10th–90th centile quartile range). This may suggest that the target range of NTBC concentration could be lower than previously reported. We found that the median dose required to suppress SA was 0.96 mg/kg/day with a range of 0.61–1.5. The half-life of NTBC is 54 h, 19 with a recommended maintenance dose of 1 mg/kg/day. Our results may imply that a lower dose could achieve SA suppression in some patients and have cost benefit implications in this subgroup. The ability to monitor DBS NTBC and SA allows individual titration of dosing and observation of adherence to treatment.
Previous reports suggested that once daily dosing is a potential and could aid patients’ adherence to treatment with improved metabolic control. 8 However, more recently, it has been reported that NTBC may be less stable than previously thought and hence once daily dosing may be inferior to twice daily dosing. 20 Another report has recommended administration of once daily dosing; however, due to the limited data in patients with body weight <20 kg, it is recommended to divide the total daily dose into two daily administrations in this patient population. 5
We have shown in our cohort that NTBC concentrations were significantly higher in the twice daily dosing group, and in addition, a lower proportion had detectable SA. This suggests that twice daily dosing may be superior.
Limitations of our study include small sample size and non-uniformity of sample timing. There is also potentially interpatient variation in blood NTBC concentration while on a comparable dose.8,9,21
Current guidelines recommend regular monitoring of NTBC concentration in patients with HT1, as interruption of treatment is associated with complications including acute liver failure, neurological crisis and hepatocellular carcinoma.2,7,9 Our centre has been able to utilize this method for regular monitoring using blood spots sent from home and treatment adjustments made accordingly. We have also been able detect subtherapeutic NTBC concentrations and elevated SA in acute presentations enabling rapid diagnosis and appropriate management in adult patients with chronic non-adherence issues.
This method has also allowed rapid diagnosis for affected siblings by measuring SA concentration, allowing early initiation of treatment. In the UK, HT1 is currently not included in the national newborn screening program. This demonstrates once again that the addition of SA measured directly or indirectly using delta-aminolevulinate dehydratase, to the DBS screening programme would be both feasible and desirable. 22
We have established a DBS method for monitoring NTBC and SA in HT1 patients in the UK which allows individualized treatment plans, and we have shown that SA can remain undetectable at NTBC concentration lower than previously reported.
Supplemental Material
sj-pdf-1-acb-10.1177_0004563220961760 - Supplemental material for Clinical utilization of dried blood spot nitisinone (NTBC) and succinylacetone (SA) concentrations in hereditary tyrosinaemia type 1 – A UK centre experience
Supplemental material, sj-pdf-1-acb-10.1177_0004563220961760 for Clinical utilization of dried blood spot nitisinone (NTBC) and succinylacetone (SA) concentrations in hereditary tyrosinaemia type 1 – A UK centre experience by Mildrid Yeo, Charles Turner, Neil R Dalton, Yusof Rahman and Roshni Vara in Annals of Clinical Biochemistry
Footnotes
Declaration of conflicting interests
The author(s) declared no potential conflicts of interest with respect to the research, authorship, and/or publication of this article.
Funding
The author(s) disclosed receipt of the following financial support for the research, authorship, and/or publication of this article: Financial support was received from Swedish Orphan Biovitrum (SOBI) for the development and validation of the assay.
Ethical approval
Ethical approval was not required as this was an anoymized retrospective collection of data.
Guarantor
RV.
Contributorship
CT and RND developed the assay. MY, CT, RD, YR and RV were involved in planning and conducting the literature review and in writing the manuscript. All authors edited and reviewed the manuscript and approved the final version.
Supplemental material
Supplemental material for this article is available online.
References
Supplementary Material
Please find the following supplemental material available below.
For Open Access articles published under a Creative Commons License, all supplemental material carries the same license as the article it is associated with.
For non-Open Access articles published, all supplemental material carries a non-exclusive license, and permission requests for re-use of supplemental material or any part of supplemental material shall be sent directly to the copyright owner as specified in the copyright notice associated with the article.