
Abstract
Background
To know whether metformin improves postprandial hyperglycaemia, we examined the effect of metformin on the glycated albumin (GA) to glycated haemoglobin (HbA1c) ratio (GA/HbA1c ratio) in patients with newly diagnosed type 2 diabetes.
Methods
Metformin and lifestyle interventions were initiated in 18 patients with newly diagnosed type 2 diabetes. Metformin was titrated to 1500 mg/day or maximum-tolerated dose. HbA1c and GA were measured every four weeks up to 24 weeks.
Results
HbA1c decreased significantly from 9.0 ± 2.1% at baseline to 6.5 ± 0.9% at week 24, and GA decreased significantly from 24.3 ± 8.2% to 16.2 ± 3.1%. The GA/HbA1c ratio decreased significantly from 2.66 ± 0.37 at baseline to 2.47 ± 0.29 at week 24 (P < 0.01), despite that the GA/HbA1c ratio reached a plateau value at week 16. The change in the GA/HbA1c ratio during 24 weeks (ΔGA/HbA1c ratio) was significantly correlated with both baseline HbA1c and GA. Moreover, the ΔGA/HbA1c ratio was significantly correlated with the change in GA during 24 weeks but not with the change in HbA1c.
Conclusions
Metformin decreased the GA/HbA1c ratio in patients with newly diagnosed type 2 diabetes. This suggests that metformin improves postprandial hyperglycaemia in patients with newly diagnosed type 2 diabetes.
Introduction
Early and aggressive control to achieve near-normal glycaemia is important to prevent chronic vascular complications in patients with type 2 diabetes. The United Kingdom Prospective Diabetes Study 34 showed that metformin reduces the risk of diabetes-related endpoints, myocardial infarction, diabetes-related death and all-cause mortality in patients with newly diagnosed type 2 diabetes. 1 However, the mechanisms by which metformin reduces cardiovascular events in patients with type 2 diabetes are still not entirely clear. Recent epidemiological studies suggest that postprandial hyperglycaemia may be an independent risk factor of cardiovascular disease beyond and more powerful than fasting hyperglycaemia. 2 Although previous studies have suggested that metformin may improve postprandial hyperglycaemia in highly selected patients,3–5 it remains unclear whether metformin improves postprandial hyperglycaemia in patients with newly diagnosed type 2 diabetes in a routine clinical setting.
Glycated haemoglobin (HbA1c) is widely used as a marker of glycaemic control over two to three months. On the other hand, glycated albumin (GA) is another marker of glycaemic control for recent one to two weeks. HbA1c mainly reflects mean plasma glucose concentrations, while GA has been shown to reflect postprandial plasma glucose concentrations as well as mean plasma glucose concentrations. Indeed, GA is higher relative to HbA1c in gastrectomized subjects who show postprandial hyperglycaemia. 6 Moreover, GA is higher relative to HbA1c due to marked glycaemic excursions in patients with type 1 diabetes than patients with type 2 diabetes 7 , and in patients with type 2 diabetes treated with insulin than those treated without insulin. 8 Continuous glucose monitoring showed that GA is a better maker of glucose excursions than other markers such as HbA1c and 1,5-anhydroglucitol. 9 Because GA is higher relative to HbA1c in patients with postprandial hyperglycaemia, the GA to HbA1c ratio (GA/HbA1c ratio) is higher in those patients. In this regard, previous studies have demonstrated that the GA/HbA1c ratio reflects postprandial plasma glucose concentrations.10,11 Thus, administration of a drug that improves postprandial hyperglycaemia might lower the GA/HbA1c ratio.
In this study, to investigate whether metformin is effective for decreasing postprandial plasma glucose concentrations, we examined the effect of metformin on the GA/HbA1c ratio in patients with newly diagnosed type 2 diabetes.
Material and methods
Study design and patients
This is a subanalysis of the effectiveness of metformin and lifestyle interventions as an initial treatment in Japanese patients with newly diagnosed type 2 diabetes (EMINENT) study, which was a prospective observational study within a routine clinical setting to examine the effectiveness of metformin and lifestyle interventions as an initial treatment in Japanese patients with newly diagnosed type 2 diabetes. The details of the EMINENT study were described elsewhere. 12 Briefly, eligible patients were newly diagnosed patients with type 2 diabetes aged 20–75 years with HbA1c concentrations ≥6.5% and who had never taken oral hypoglycaemic agents. The diagnosis of type 2 diabetes was made on the WHO 1999 criteria. 13 We excluded patients with liver cirrhosis, renal disease or anaemia from the study. Metformin and lifestyle interventions were initiated at the time of diagnosis, and the dose of metformin was titrated to 1500 mg/day or maximum-tolerated dose. Lifestyle interventions were composed of an individualized dietary counselling and an encouragement to increase daily physical activities. The primary outcomes were reduction in HbA1c and the proportion of patients who achieved HbA1c <7.0% after 16 weeks. The study was conducted in accordance with the Declaration of Helsinki and with the approval of the local ethics committee. Each patient provided written informed consent for study participation and the use of their data for research purposes. The EMINENT study was registered with the University Hospital Medical Information Network clinical trial registry, number 000004193.
Among 23 previously reported patients, 12 this study included 18 patients (17 men and one woman; mean age 51.8 ± 10.8 years; mean body mass index (BMI) 26.4 ± 4.8 kg/m2) who were followed for 24 weeks.
Measurements
Plasma glucose was determined using the hexokinase, glucose-6-phosphate dehydrogenase method. HbA1c was measured with HLC-723G8 (Tosoh Co., Tokyo, Japan) by high-performance liquid chromatography approved by the National Glycohemoglobin Standardization Program. 14 Interassay coefficient variations were 1.57% and 1.52%, respectively, as determined by representative blood samples (5.6% and 10.3% of HbA1c). GA was determined with a Hitachi 7600 autoanalyzer (Hitachi Instruments Service Co., Tokyo, Japan) by the enzymatic method using albumin-specific proteinase, ketoamine oxidase and albumin assay reagent (Lucica GA-L; Asahi Kasei Pharma Co., Tokyo, Japan). 15 Interassay coefficient variations were 1.26% and 1.77%, respectively, as determined by representative serum samples (13.3% and 37.1% of GA).
Statistical analyses
All data are shown as means ± SD. GA/HbA1c ratio was determined by dividing GA by HbA1c. Changes in HbA1c, GA and GA/HbA1c ratio (ΔHbA1c, ΔGA and ΔGA/HbA1c ratio, respectively) were calculated by subtracting each value at week 24 from the corresponding value at week 0. Because all variables including HbA1c and GA are not skewed, paired Student’s t-test was used to compare the two groups. Univariate linear regression analysis was employed to calculate the correlation between ΔGA/HbA1c ratio and other variables. All statistical analyses were performed using the StatView computer program (Version 5.0 for Windows; Abacus Concepts, Berkeley, CA, USA). A P value of <0.05 was considered to be statistically significant.
Results
At baseline, fasting plasma glucose, HbA1c, GA and the GA/HbA1c ratio of the study patients were 10.2 ± 3.4 mmol/L, 9.0 ± 2.1%, 24.3 ± 8.2% and 2.66 ± 0.37, respectively. BMI decreased from 26.4 ± 4.8 kg/m2 at baseline to 24.6 ± 2.5 kg/m2 at week 24 (P < 0.001). Fasting plasma glucose also decreased from 10.2 ± 3.4 mmol/L at baseline to 7.4 ± 2.4 mmol/L at week 4 (P < 0.001) and further to 6.4 ± 0.7 mmol/L at week 24 (P < 0.001). HbA1c gradually decreased from 9.0 ± 2.1% at baseline to 6.6 ± 0.9% at week 16 (Figure 1). The HbA1c concentration at week 24 (6.5 ± 0.9%) was not significantly different from the HbA1c concentrations at week 16.
Changes in HbA1c (closed circles) and glycated albumin (GA) (open circles) with metformin treatment. Error bars represent SD. n.s. means not significant.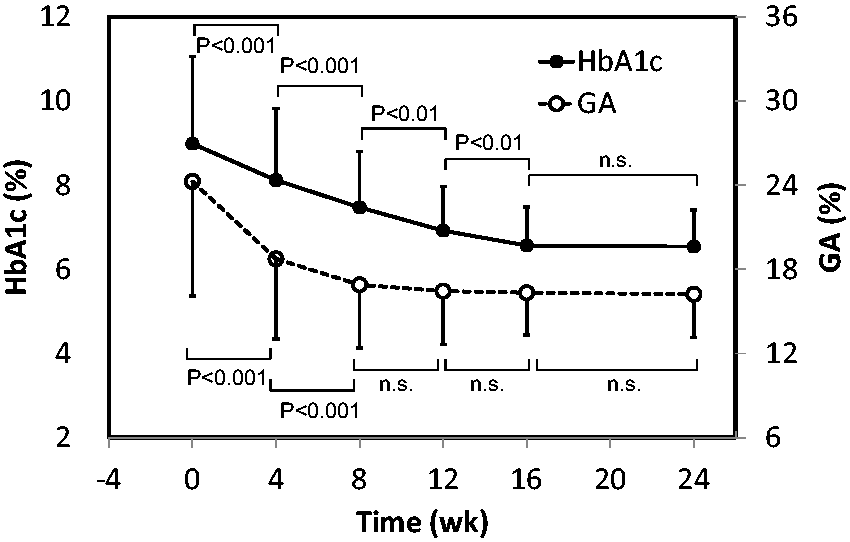
GA significantly decreased from 24.3 ± 8.2% at baseline to 18.8 ± 5.7% at week 4 (P < 0.001) and further to 16.9 ± 4.5% at week 8 (P < 0.001). GA reached a plateau value at week 8, and subsequent values did not differ significantly from the prior values. The GA/HbA1c ratio decreased from 2.66 ± 0.37 at baseline to 2.25 ± 0.32 at week 8 (P < 0.001), which was the lowest value during 24 weeks (Figure 2). The GA/HbA1c ratio increased from 2.25 ± 0.32 at week 8 to 2.48 ± 0.28 at week 16. However, the GA/HbA1c ratio at week 24 (2.47 ± 0.29) was not significantly different from that at week 16. Importantly, the GA/HbA1c ratios at week 16 and at week 24 were significantly lower compared with the GA/HbA1c ratio at baseline (P < 0.05 and P < 0.01, respectively).
Changes in the GA to HbA1c (GA/HbA1c) ratio with metformin treatment. Error bars represent SD. *P < 0.05; **P < 0.01; ***P < 0.001 versus week 0.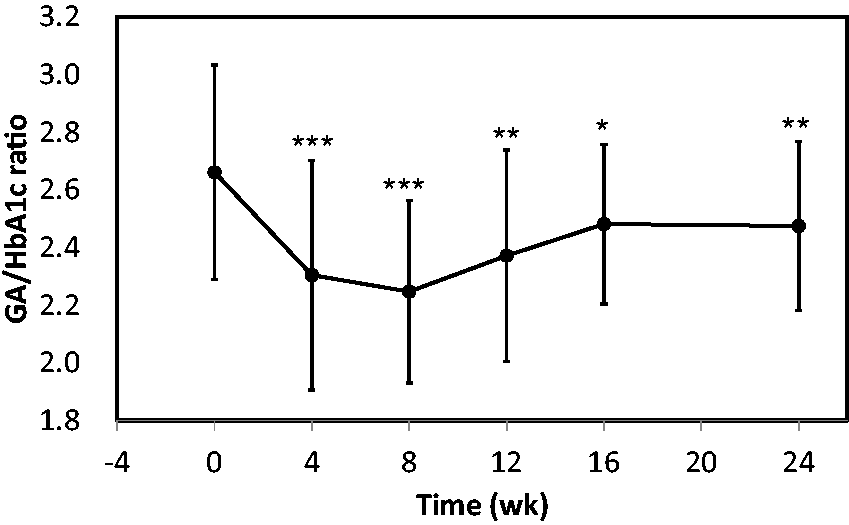
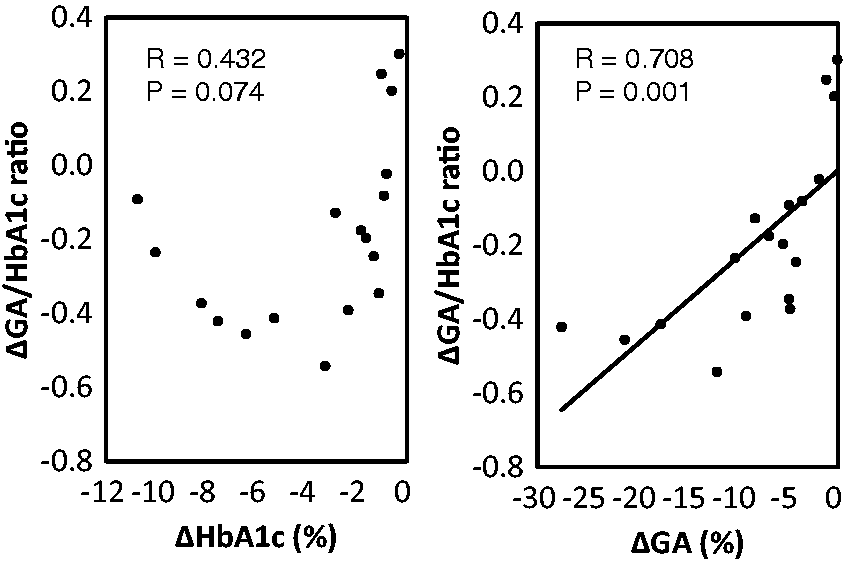
We found a strong inverse correlation between ΔHbA1c and baseline HbA1c (R = −0.697, P = 0.001). We also found a much stronger inverse correlation between ΔGA and baseline GA (R = −0.927, P < 0.001). ΔGA/HbA1c ratio was inversely correlated with baseline HbA1c (R = −0.558, P = 0.016) and baseline GA (R = −0.637, P = 0.005) (Figure 3). In addition, the ΔGA/HbA1c ratio was significantly correlated with ΔGA (R = 0.708, P = 0.001). However, the ΔGA/HbA1c ratio was not significantly correlated with ΔHbA1c (R = 0.432, P = 0.074) (Figure 4).
Correlation between the change in GA/HbA1c ratio during 24 weeks (ΔGA/HbA1c ratio) and baseline HbA1c (left panel) and baseline GA (right panel). Correlations were tested with linear regression analysis. Correlation between the change in GA/HbA1c ratio during 24 weeks (ΔGA/HbA1c ratio) and the change in HbA1c during 24 weeks (ΔHbA1c) (left panel) and that in GA during 24 weeks (ΔGA) (right panel). Correlations were tested with linear regression analysis.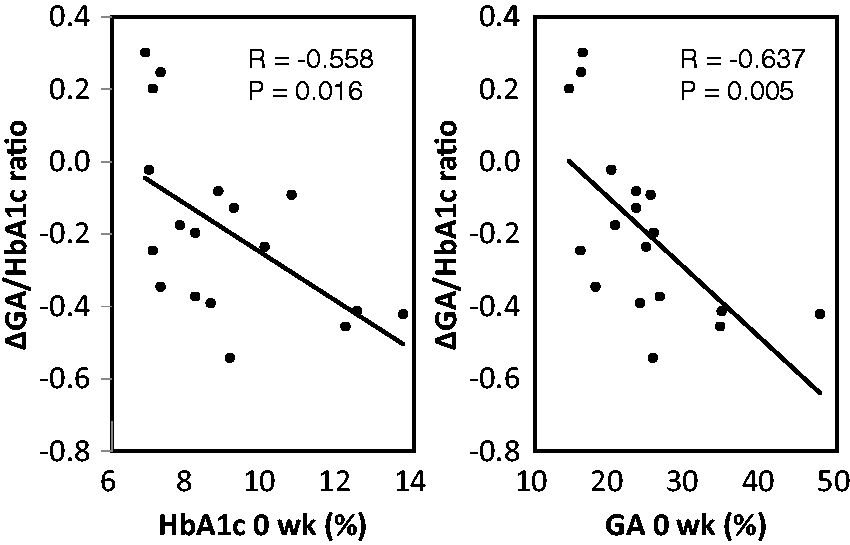
Discussion
We demonstrated that metformin treatment for 24 weeks significantly decreased the GA/HbA1c ratio in patients with newly diagnosed type 2 diabetes. Although HbA1c gradually decreased and reached a plateau value at week 16, GA rapidly decreased and reached a plateau value at week 8 (Figure 1). This is consistent with the notion that GA reflects a shorter-term change in glycaemia as compared with HbA1c. The GA/HbA1c ratio decreased from baseline to week 8 because of a greater decrease in GA relative to HbA1c during the early periods after starting metformin. Subsequently, the GA/HbA1c ratio increased and reached a plateau value at week 16. This is because HbA1c still decreased even after the decrease in GA reached a plateau value. In contrast, because HbA1c also reached a plateau value at week 16, the GA/HbA1c ratio did not change significantly after week 16. Similar time course of change in the GA/HbA1c ratio has been reported in type 2 diabetic patients treated with intensive insulin therapy. 16 Importantly, the GA/HbA1c ratio at week 16 and week 24 was significantly lower compared with the ratio at baseline. Because GA and HbA1c decreased and reached a plateau at week 8 and week 16, respectively, the significant decrease in the GA/HbA1c ratio at week 16 and week 24 could not be explained by more rapid decrease in GA compared with HbA1c in response to the treatment.
Because we concurrently initiated lifestyle interventions and treatment with metformin, it is possible that lifestyle interventions but not metformin decreased the GA/HbA1c ratio. However, we previously reported that lifestyle interventions alone did not showed the low levels of the GA/HbA1c ratio (2.79 ± 0.34) in 28 patients with type 2 diabetes. 8 Furthermore, treatment with vildagliptin, a dipeptidylpeptidase 4 inhibitor, for 12 weeks did not decrease the GA/HbA1c ratio in 199 patients with type 2 diabetes. 17 These findings corroborate our notion that treatment with metformin specifically decreases the GA/HbA1c ratio.
We previously reported that the GA/HbA1c ratio at the time of diagnosis is higher in patients with fulminant type 1 diabetes 18 and acute-onset type 1 diabetes 19 than patients with type 2 diabetes. This is because those patients usually experience an abrupt increase in plasma glucose after disease onset and, consequently, the degree of increase in GA is greater relative to HbA1c. If plasma glucose concentrations had rapidly increased just before diagnosis in our type 2 diabetic patients, the GA/HbA1c ratio would have increased. In that case, the GA/HbA1c ratio would have decreased when the glycaemic control was improved with the treatment. However, the GA/HbA1c ratio of our patients was 2.66 ± 0.37, which was not significantly different from the GA/HbA1c ratio (2.72 ± 0.34) obtained in type 2 diabetic patients with stable glycaemic control. 8 Therefore, it is unlikely that an abrupt increase in plasma glucose concentrations just before the diagnosis would have increased the baseline GA/ HbA1c ratio in our patients.
HbA1c mainly reflects mean plasma glucose concentrations, whereas GA reflects postprandial plasma glucose as well as mean plasma glucose concentrations.20,21 The GA/HbA1c ratio is correlated with postprandial plasma glucose but not correlated with fasting plasma glucose or HbA1c. 10 Thus, the GA/HbA1c ratio mainly reflects the concentrations of postprandial plasma glucose and can be used as a better marker of postprandial plasma glucose than GA.10,11 Therefore, a significant decrease in the GA/HbA1c ratio after 24 weeks of metformin treatment suggests that metformin may improve postprandial plasma glucose concentrations. In this regard, Wu et al. 3 previously demonstrated that metformin not only decreased fasting plasma glucose concentrations but also decreased postprandial plasma glucose concentrations during a meal tolerance test. In the Hyperinsulinaemia: the Outcome of its Metabolic Effects trial, add-on of metformin to insulin regimens was demonstrated to improve postprandial hyperglycaemia. 4 In addition, Lund et al. 5 showed that metformin decreased post-load plasma glucose concentrations to the same degree as a postprandial insulin secretagogue, repaglinide.
We found a significant correlation between the ΔGA/HbA1c ratio with baseline HbA1c and GA (Figure 3). This is consistent with the findings that the correlation between baseline GA and ΔGA (R = −0.927, P < 0.001) was stronger than that between baseline HbA1c and ΔHbA1c (R = −0.697, P = 0.001). Given that the ΔGA/HbA1c ratio is associated with the decrease in postprandial plasma glucose concentrations, the significant correlation between ΔGA/HbA1c ratio with baseline HbA1c and GA suggests that glucose-lowering effects of metformin on postprandial plasma glucose concentrations may be greater in patients with poorer glycaemic control. Impaired suppression of postprandial glucagon secretion is a major contributor to postprandial hyperglycaemia in patients with type 2 diabetes. 22 In this regard, it is interesting to note that metformin suppresses glucagon signalling in the liver. 23 We also found that the ΔGA/HbA1c ratio was significantly correlated with ΔGA but not with ΔHbA1c (Figure 4). Because HbA1c is known to reflect mainly mean plasma glucose, these findings clearly indicate that the decrease in mean plasma glucose is not enough to explain the decrease in the GA/HbA1c ratio that we observed after metformin treatment. This may be because the degree of reduction in postprandial plasma glucose has greater influence on ΔGA than ΔHbA1c.
The term glycation gap (GG) was first defined by Cohen et al. 24 as the difference between the measured HbA1c and the HbA1c predicted from the measure of fructosamine, based on the HbA1c-fructosamine regression equation. Zafon et al. 25 recently showed that GG value was positively associated with treatment with metformin but not that with sulphonylurea or insulin. Thus, they concluded that patients treated with metformin have spuriously higher HbA1c concentrations, despite similar fructosamine concentrations, than patients not treated with metformin. If this is the case, the decreased GA/HbA1c ratio that we observed in the present study could be due to spuriously increased HbA1c concentrations because the concentration of fructosamine and that of GA is highly correlated. 20 However, we believe that GG value was positively associated with metformin treatment because patients treated with metformin had decreased concentration of fructosamine due to the improvement of postprandial hyperglycaemia. First, Zafon et al. 25 did not show that metformin treatment directly elevated HbA1c concentrations. They only showed that patients treated with metformin had higher GG values than patients not treated with metformin. Because GG was defined as the difference between the measured HbA1c and the HbA1c predicted from the measure of fructosamine, the increase in GG value is theoretically derived from the increase in HbA1c concentrations or the decrease in fructosamine concentrations. Second, to our knowledge, there is no report demonstrating that metformin directly facilitates intracellular glycation of haemoglobin in vitro or in vivo. Rapin et al. 26 demonstrated that treatment with metformin in vitro increases intracellular glucose-6-phosphate concentrations in erythrocytes obtained from patients with insulin-dependent diabetes. Although this suggests that metformin may facilitate glucose transport and/or phosphorylation in erythrocytes, the increase in glycation of haemoglobin was not shown in the study. Third, Chon et al. 27 recently showed using continuous glucose monitoring system (CGMS) that the concentration of fructosamine reflects postprandial hyperglycaemia in type 2 diabetic patients. Therefore, it is likely that metformin treatment increases GG value through reduction of fructosamine concentrations due to improved postprandial hyperglycaemia.
Metformin decreases the formation of advanced glycation end products both in vitro and in vivo. 28 Therefore, it could be possible that metformin directly inhibits the glycation of extracellular albumin, thus leading to the decreased ratio of GA/HbA1c. GA is a ketoamine that is formed during early glycation stage through binding of glucose to albumin. 20 Mechanism of metformin to inhibit glycation process is proposed to be chiefly through scavenging α-dicarbonyl compounds such as methylglyoxal during late glycation stage. 28 Therefore, it seems unlikely that metformin could directly inhibit the glycation of extracellular albumin, thus leading to the decreased ratio of GA/HbA1c.
This study has several limitations. First, besides HbA1c and GA, we only measured fasting plasma glucose but not postprandial plasma glucose. We need to examine whether improved postprandial hyperglycaemia with metformin treatment causes the decrease in the GA/HbA1c ratio using more sophisticated method such as CGMS. Second, this study is a retrospective analysis of a small number of patients in a single clinic. A multicentre, prospective clinical study with a larger number of patients is necessary to confirm our results.
In conclusion, we demonstrated that metformin decreased the GA/HbA1c ratio in patients with newly diagnosed type 2 diabetes. This suggests that metformin improves postprandial hyperglycaemia in patients with newly diagnosed type 2 diabetes.
Footnotes
Acknowledgements
None.
Declaration of conflicting interests
None declared.
Funding
This research received no specific grant from any funding agency in the public, commercial, or not-to-profit sectors.
Ethical approval
The ethics committee of Nissay Hospital approved this study, and written informed consent was obtained from each subject.
Guarantor
SS.
Contributions
SS researched literature, conceived the study, researched data, contributed to the discussions, wrote and edited the manuscript. SM, RD, KH, KM, YU, SM, BS and HN researched data, contributed to the discussions and edited the manuscript. SK contributed to the discussion, and reviewed and edited the manuscript. MK wrote and edited the manuscript and contributed to the discussions. All authors approved its final version.