
Abstract
Background
D-dimer increases during pregnancy and is problematic to use in the diagnosis of venous thromboembolism. Fibrin monomer represents an alternative biomarker for venous thromboembolism. However, to be useful in pregnancy, the fibrin monomer concentration should be stable throughout pregnancy and during postpartum.
Methods
To describe the course of fibrin monomer concentration during pregnancy and the postpartum period in healthy pregnant women and to compare their within-subject biological variation (CVI) with non-pregnant women. Blood samples were obtained every fourth week during pregnancy and three samples after delivery in 20 healthy women and every fourth week during a 40-week period in 19 healthy non-pregnant women. Fibrin monomer (STA Liatest FM, Stago) was analysed in duplicates for all samples. Concentrations of fibrin monomer in pregnant and non-pregnant women were compared and the CVI for fibrin monomer was calculated.
Results
The median fibrin monomer concentration in pregnant women was 6.2 mg/L (2.5 and 97.5 percentiles 3.7–10.8 mg/L) and in non-pregnant women 4.8 mg/L (3.6–8.2) (P < 0.01). The fibrin monomer concentration was relatively stable during pregnancy, although a few unexplained high fibrin monomer concentrations were found during pregnancy/postpartum. Fibrin monomer CVI in pregnancy and postpartum was 20.6% (95% CI 18.3, 23.5) and in non-pregnant 16.1% (13.7, 18.9).
Conclusions
For clinical purposes, fibrin monomer concentration can be considered stable during pregnancy, although it is slightly higher than in non-pregnant women. Pregnant and non-pregnant women have the same CVI. The suitability of fibrin monomer in venous thromboembolism diagnosis in pregnant women should be validated in further studies.
Introduction
Fibrin monomer (FM) is formed by thrombin-cleaving fibrinopeptide A and B from the fibrinogen molecule before the formation of cross-linked fibrin.1,2 D-dimer (DD) is formed after the action of factor XIII (cross-linking of fibrin) and plasmin (fibrinolysis of cross-linked fibrin).1,2 Thus, FM may reflect an early stage of a thrombotic event and is more closely related to thrombin generation than to fibrinolysis,2,3 while DD reflects secondary fibrinolysis after cross-linking of fibrin.1,4 Plasma concentration of DD (DD) is used both for exclusion of venous thromboembolism (VTE) and in diagnosis and monitoring of disseminated intravascular coagulopathy (DIC). 1 Unfortunately, DD is a non-specific marker for VTE and DIC, which also is elevated during acute phase/inflammatory situations (e.g. surgery, rheumatic diseases, malignancy and infections) as well as in pregnancy and during the postpartum period. 5 Therefore, it will be of interest to identify one or more biomarkers in blood which could improve the diagnostic work-up of VTE and DIC, alone or in combination with DD especially in those specific conditions. Plasma concentration of FM is one promising candidate marker, especially in combination with DD.1–3,6–8 FM could be especially valuable in clinical conditions where DD is elevated, without the presence of VTE, for example after surgery9–12 or in pregnancy.13–15 In pregnancy, FM could be a more useful marker than DD, since it is more closely related to thrombin activity rather than fibrinolysis. 3 There are conflicting results regarding the stability of FM concentrations throughout pregnancy.2,13–18 There are no studies estimating biological variation of FM in pregnant or in non-pregnant women. The aim of the present study was to describe the main course of FM throughout pregnancy and postpartum in the same healthy pregnant women and compare the estimated biological variation with healthy non-pregnant women during a similar time course.
Materials and methods
Participants
Twenty healthy pregnant women (median age 31 years [range 22–38]) recruited in the first trimester (median duration of gestation at inclusion was eight weeks [range 5–13]) and 19 healthy non-pregnant women (median age 33.5 years [range 23–40]) (all Caucasians) were included in the study during a period of 20 months. The pregnant women were numbered from 1 to 20 and the non-pregnant from 21 to 39. One pregnant woman was heterozygous (subject 1) and one was homozygous (subject 5) for Factor V Leiden (this was not known until after study completion). None of the women had a personal or family history of VTE. The pregnancies were uncomplicated, with median gestational week at delivery of 41 (range 37–42), but three women with caesarean deliveries were included and one woman with more than 500 mL blood loss after delivery. No symptoms of VTE were experienced during the study, so diagnostic imaging for VTE was not undertaken. Other characteristics of the participating women and their health status during pregnancy can be found in earlier papers.19–21 Study participants were recruited by an advertisement in the local newspaper and on the webpage of Haukeland University Hospital. The Regional Committee of Medical Ethics of Western Norway approved the study (Project number 3.2006.1869/REK Vest 2010/221), and the women gave informed consent to participate.
Specimen collection and handling
The blood samples were collected in 0.129 mmol/L (3.8%) sodium citrate tubes and centrifuged at 2500 g for 15 min. Plasma was transferred to microtubes, frozen within 2 h of blood sampling and stored at –80°C in 1.5–3 years until analysis. Blood samples were collected every fourth week in pregnancy and at 1–3 days, two and six weeks after delivery. The gestational age was calculated retrospectively according to the date of term determined by routine ultrasound in the 18th week of pregnancy. The time of sampling was allocated into nine four-week time windows during pregnancy at gestational weeks 5–9, 9–13, etc. The 15 pregnant women recruited from week 5 to 9 were included from the first sampling, while those recruited from week 10 to 13 first were included from the second sampling. In non-pregnant women, 10 blood samples were collected over a period of 40 weeks (i.e. every fourth week). In three of these women, only five samples (for two of them) and seven samples were collected because they became pregnant before the study period finished, and these samples were kept in the non-pregnant group.
Analysis
Frozen plasma from each participant was rapidly thawed in a 37°C water bath for 5 min, thoroughly mixed and analysed in duplicate in the same analytical run. The samples were analysed on a STA-R instrument (Stago) with STA Liatest FM (Stago) (catalog number 00543). Internal quality control material (STA Liatest FM controls 1 and 2) was supplied from the same manufacturer. One lot of both reagents and controls were used for all analyses. No systematic changes in the concentrations of the controls during the period of analysis were detected. Total analytical coefficients of variation (CVs) (within-run and between-run variation) calculated for the internal controls and within-run analytical variation (CVA) calculated for duplicate participants’ samples are shown in Supplemental Table 1.
Statistics
Outliers
The method of Burnett 22 was used to examine for outliers (1) in the duplicates (measurements) in the samples for each woman, (2) the samples (mean of duplicates) from each blood sampling and (3) the means of each subject. According to this method, there was one outlier in the duplicates in pregnant (subject 14, sample 11) and two in non-pregnant women (subject 25, sample 10 and subject 38, sample 5), which were excluded from further analyses. In addition, there were pregnant women with considerable higher mean FM concentration than the other pregnant women (subject 5 [homozygous Factor V Leiden mutation] and 18) and these two pregnant also had several outlying samples (Supplemental Figure 1(a)). Outlying samples were also found for one sample in pregnant subject 15 (sample 6) and non-pregnant subject 31 (sample 1) (Supplemental Figure 1(a) and (b)). In some of the samples, FM concentration was higher than expected, but not statistical outliers according to Burnett. These were considered outliers in the test for homogeneity of variances (see later) and the results were therefore not included in the further calculations (in pregnancy: subject 4 samples 1 and 2, subject 8 sample 3, subject 9 sample 1 and in postpartum: subject 4 sample 10, subject 6 sample 10, subject 12 samples 10 and 11, subject 15 sample 10) (Supplemental Figure 1(a) and (b)). Consequently, 18 pregnant and 19 non-pregnant women were included when calculating medians, ranges and biological variation variables, excluding five samples in pregnancy, six postpartum and three in non-pregnant women.
Descriptive statistics
Descriptive statistics with median and ranges (2.5- and 97.5 percentiles, minimum and maximum) of FM concentration in each of the different time-periods were used to describe the main path (course) of FM in pregnant and non-pregnant women. The Shapiro-Wilk test was used to test for Gaussian distributions. To test for trend during pregnancy and postpartum, polynomial regression with degrees 1 and 2 on the relationship between sample time and FM were performed for the first 9 (pregnancy) and all 12 (pregnancy and postpartum) samples. A small trend in the results was detected; for the first 9 samples (pregnancy), the trend was (95% CI): FM = 5.43 (5.00, 5.85) + 0.20 (0.12, 0.27) × Time (where time is the sample number from 1 to 9, with an interval of four weeks during pregnancy), for all 12 samples (pregnancy and postpartum): FM = 4.40 (3.80, 4.99) + 0.78 (0.57, 0.98) × Time –0.06 (–0.08, –0.05) × Time 2 (where time is the sample number from 1 to 12). The results were therefore also adjusted for trend and then the CVI (‘trend adjusted’) was calculated as described below. CVI is thus shown both with and without adjusting for trend. SPSS version 22.0 (SPSS Inc., Chicago, IL), R version 3.6 (https://cran.r-project.org) with lme4 version 1.1–21 (https://cran.r-project.org/web/packages/lme4/index.html) and Excel (Microsoft Office) were used for statistical calculations and figures
Biological and analytical variation and variance homogeneity
The biological variation, separated into the within-subject (CVI) and between-subject (CVG) biological variations, and within-series analytical variation (CVA), were estimated from analysis of variance with the statistical model for repeated subsampling (nested design) 23 when the systematic changes over time are negligible. The measured FM concentrations were transformed into natural logarithms (lnFM), for both pregnant and non-pregnant women, to make the distributions Gaussian and to calculate CVs. The standard deviations (SDI, SDG and SDA) were calculated when using the lnFM results. These SDs are then used for estimating CVs for the original FM results, using the formula CV = √(exp(SD2)–1).24,25 Confidence intervals (95%) were calculated according to Burdick and Graybill. 26 Testing for variance homogeneity was performed as described in detail in earlier publications19–21 and was performed by Bartlett’s test (statistical significance, P < 0.01). 27 Variance homogeneity was illustrated on a rankit scale where the cumulated ranked coefficients of variation were plotted as fractions on the ordinate as function of the personal values of the variation, SDP or CVP. This was compared with the theoretical χ2 function for homogenous distribution of CV values: pooled CVP·√χ2/df shown on the same rankit scale using the mean degrees of freedom (df) for series of results from each woman (Supplemental Figure 2).19,23,28–30
The estimated SDI and SDA were used to calculate the reference change value (RCV) (RCV = z × √2 × √(SDA 2 + SDI 2 )), as described in detail in earlier publications,19–21 where z = 1.65 when choosing a one-sided test (e.g. an increase in the result) and 95% probability. The results can be transformed back by the formula RCVorg = 100%×[exp(RCVlog)–1]24,25 (resulting in asymmetric confidence intervals) and SD can be calculated back by the reverse formula SD = {ln[(CV) 2 + 1]}½. 31 A difference between two FM values in per cent has to be judged according to the RCV on the logarithmic level. RCV refers to the probability that a change within the RCV limits can be explained by analytical and within-subject biological variation with a certain probability, i.e. that the patient is in a stable situation, and not the counter hypothesis – the probability that a true change has occurred. 32
Results
The course of FM during pregnancy
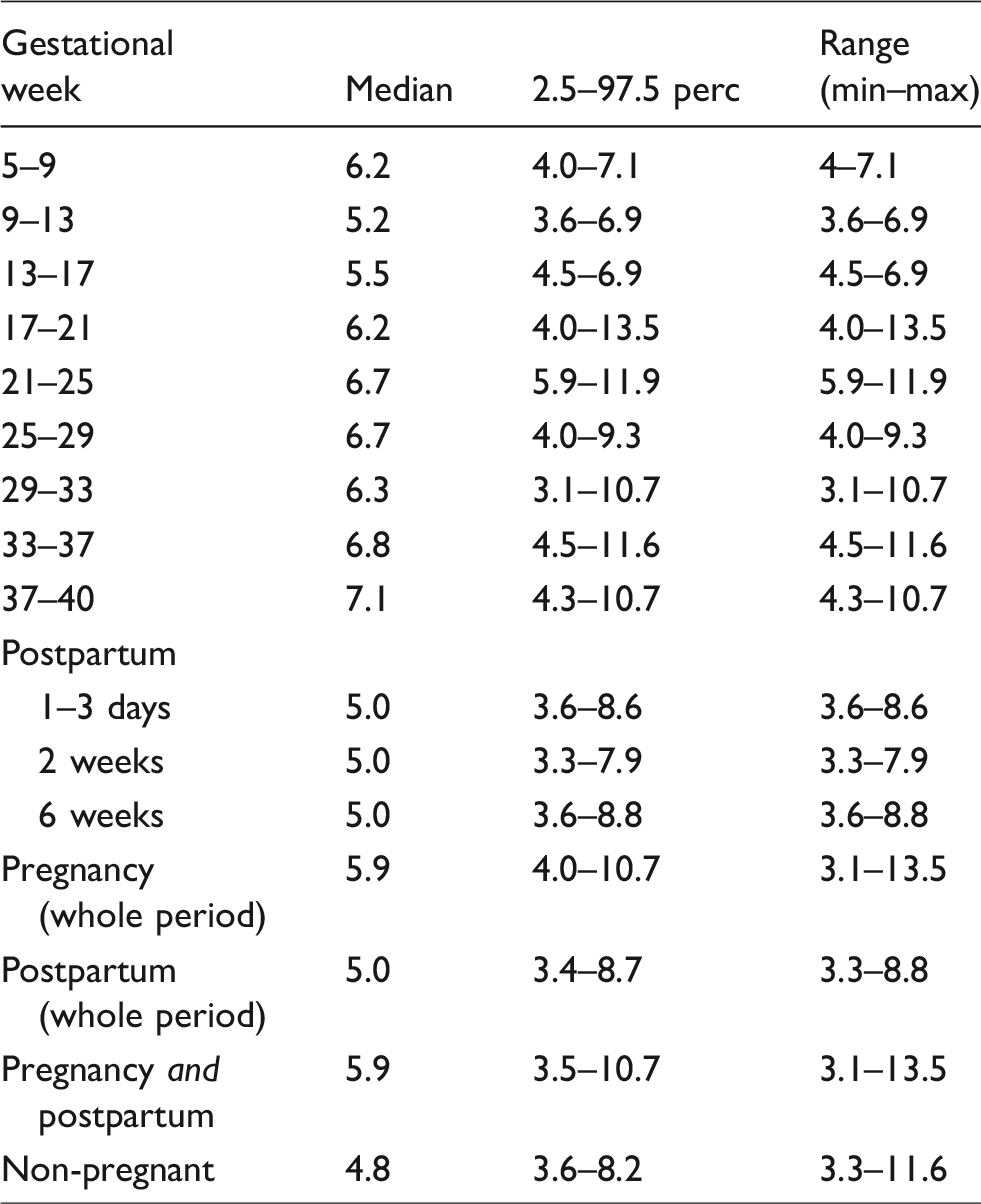
For clinical purposes, the FM concentration can be considered stable throughout pregnancy from the earliest period tested (Figure 1(a) and (b) and Table 1), although statistical significant trend was detected. The FM concentrations measured in pregnancy and postpartum were overlapping with concentrations in non-pregnant, although the median FM concentration was slightly higher in pregnancy and postpartum (6.2 mg/L [2.5 and 97.5 percentiles 3.7–10.8 mg/L]) compared with non-pregnant women (4.8 mg/L [2.5 and 97.5 percentiles 3.6–8.2 mg/L]) (P < 0.01) (Table 1). Two pregnant women (subjects 5 and 18) had very high FM concentrations measured at different times during pregnancy (one of them was homozygous for the Factor V Leiden mutation) (Figure 2(a)). These two women also had an ‘outlying course’ for DD concentrations during their pregnancies (Figure 2(b)). In addition, a few FM concentrations at different time points in pregnancy (n = 5) and a few postpartum (n = 5), from six different women, were higher than expected (Supplemental Figure 1(a)), and were excluded to obtain variance homogeneity. These results were not associated with high DD concentrations at the same time points, but three of the samples with the highest FM concentration after delivery (subject 15, 4 and 6) (Supplemental Figure 1(a)) also had the highest DD concentrations at the same time point. Among non-pregnant women, only one had an outlying FM concentration at one sampling (Supplemental Figure 1(b)), and this was not associated with a pathological high DD result.
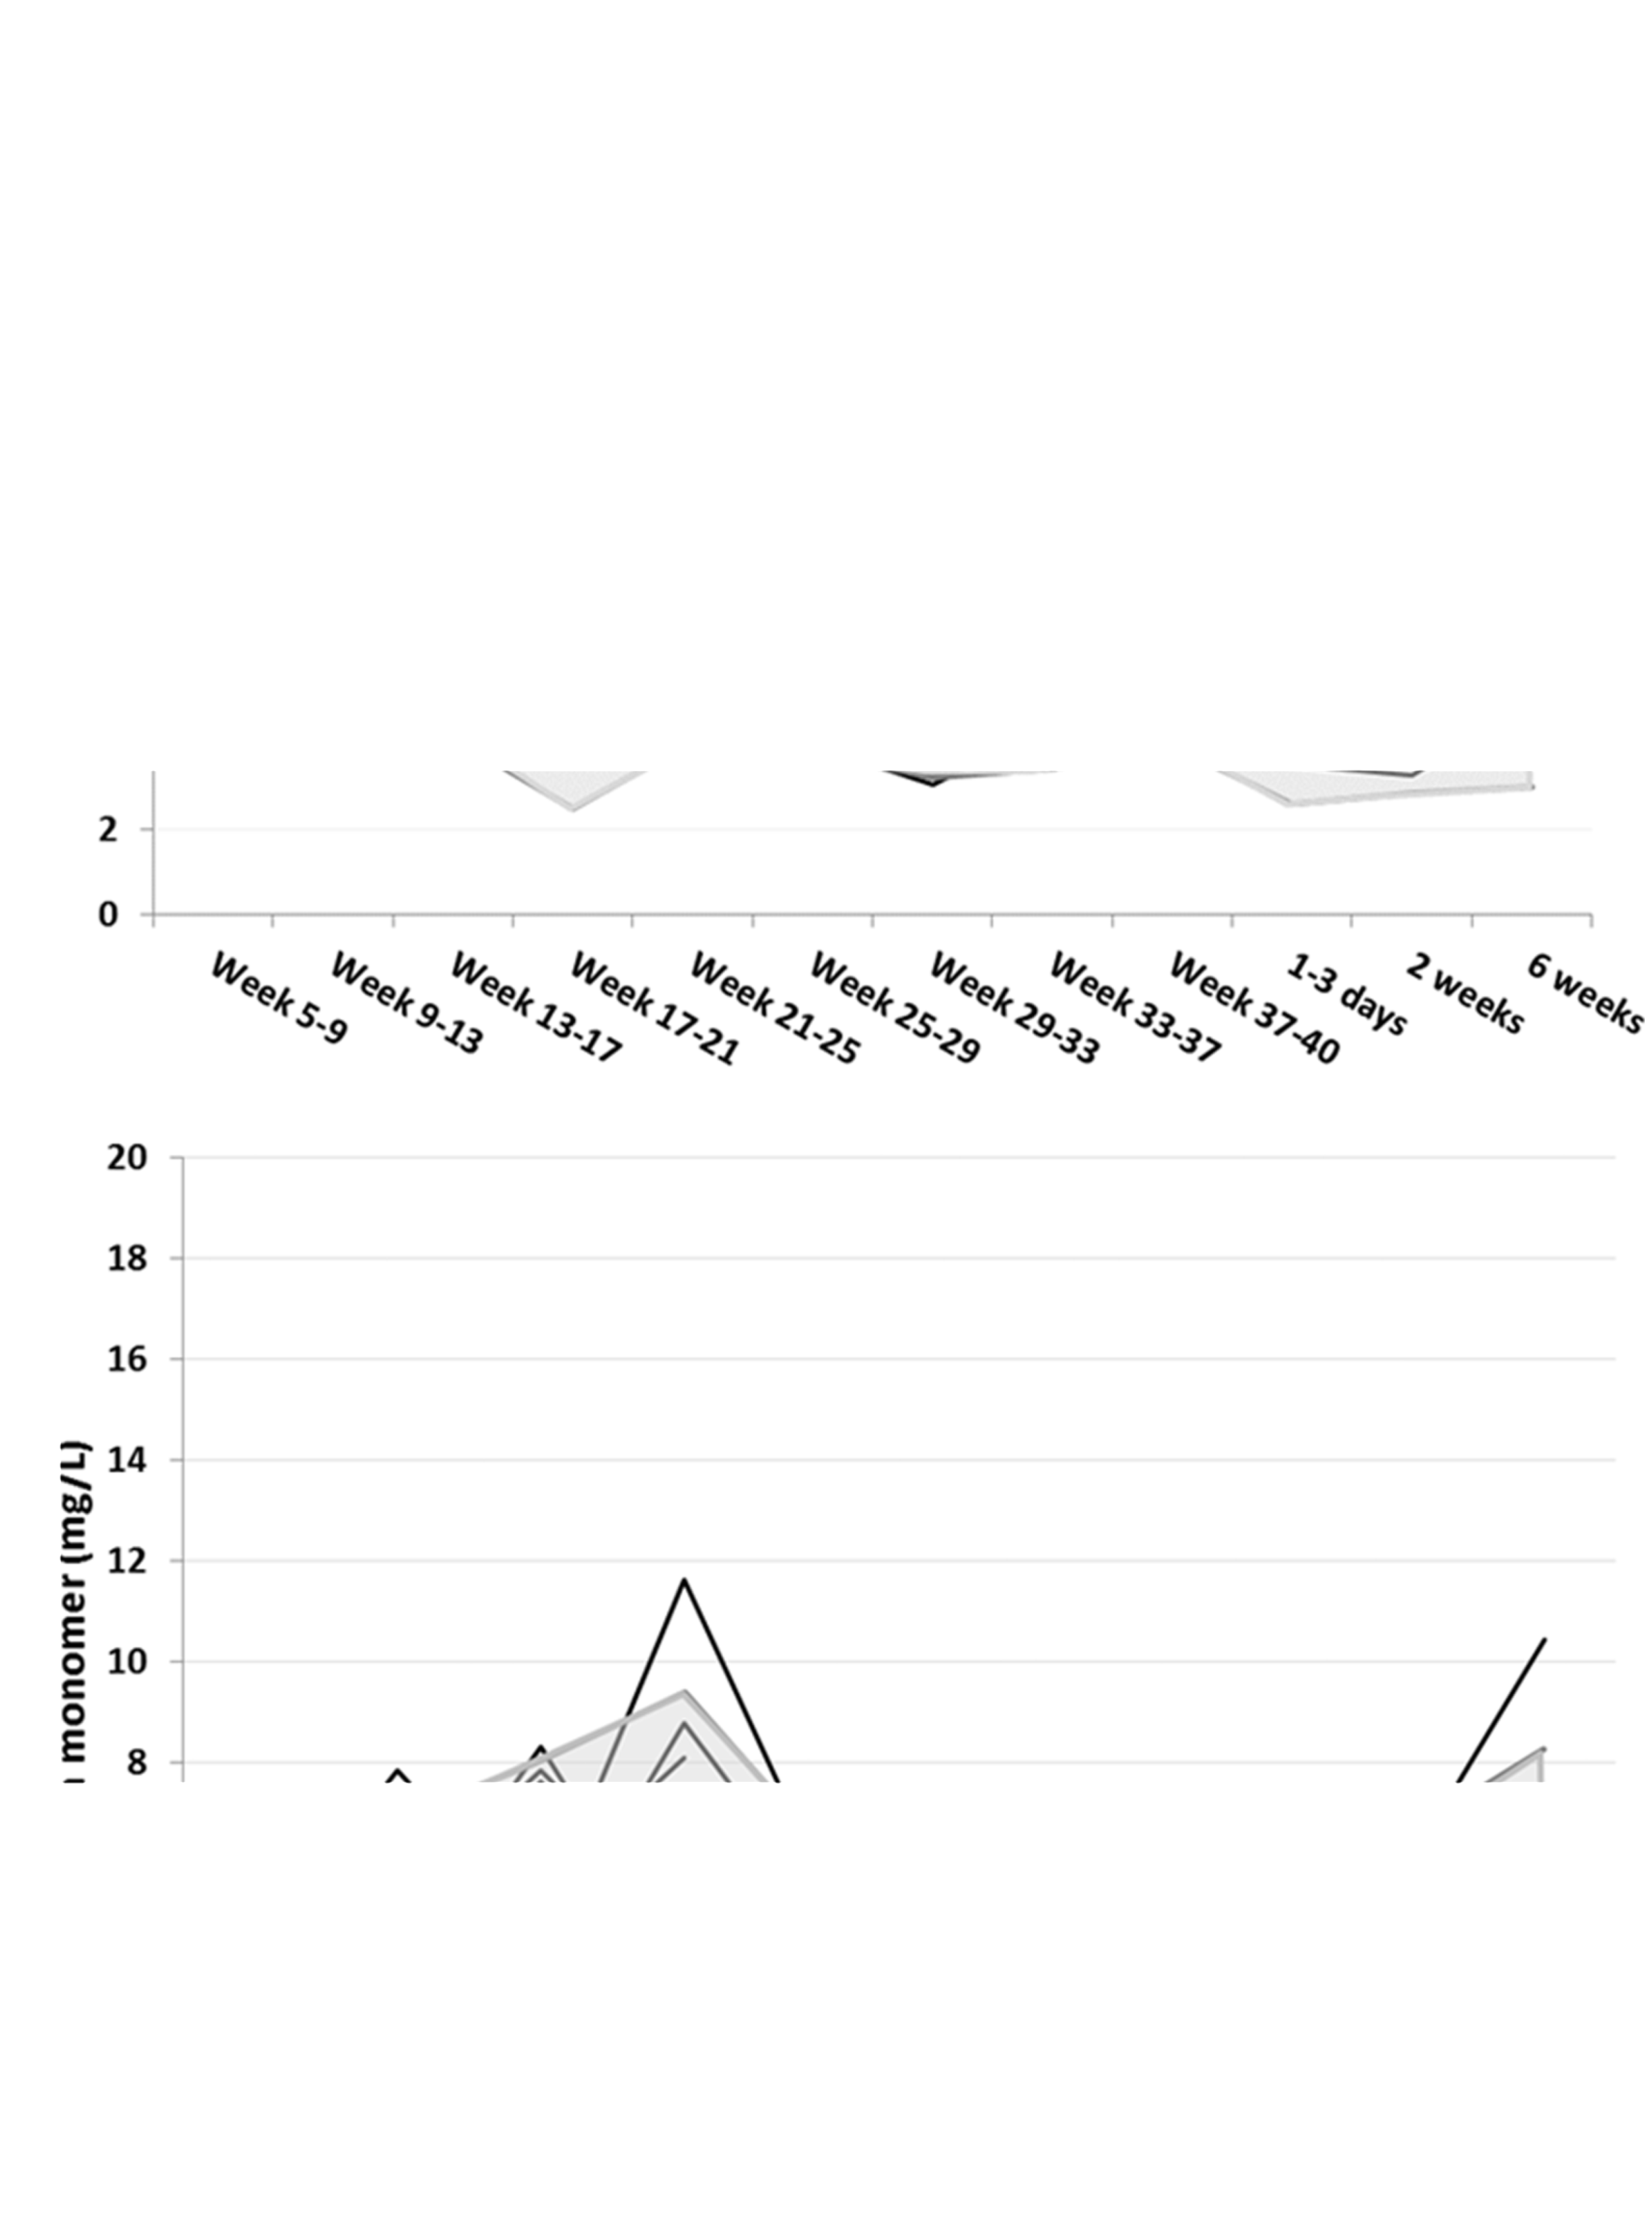
The course of fibrin monomer (FM) concentration in pregnancy and postpartum (a) and in non-pregnant women (b) as a function of time for 18 pregnant and 19 non-pregnant women. The FM concentrations are presented on the y-axis and the time of sample related to pregnancy or postpartum (a) or sample number (b) on the x-axis. Each black line represents the trajectory of the concentration for individual women, the grey lines represents the mean and ±2SD. The shaded area encloses the mean ± 2SD of FM concentrations for pregnancy or postpartum (a) and non-pregnant (b).
Median, 2.5- and 97.5 percentiles and ranges for FM concentrations (mg/L) at different time intervals during pregnancy and postpartum compared with results in non-pregnant women.
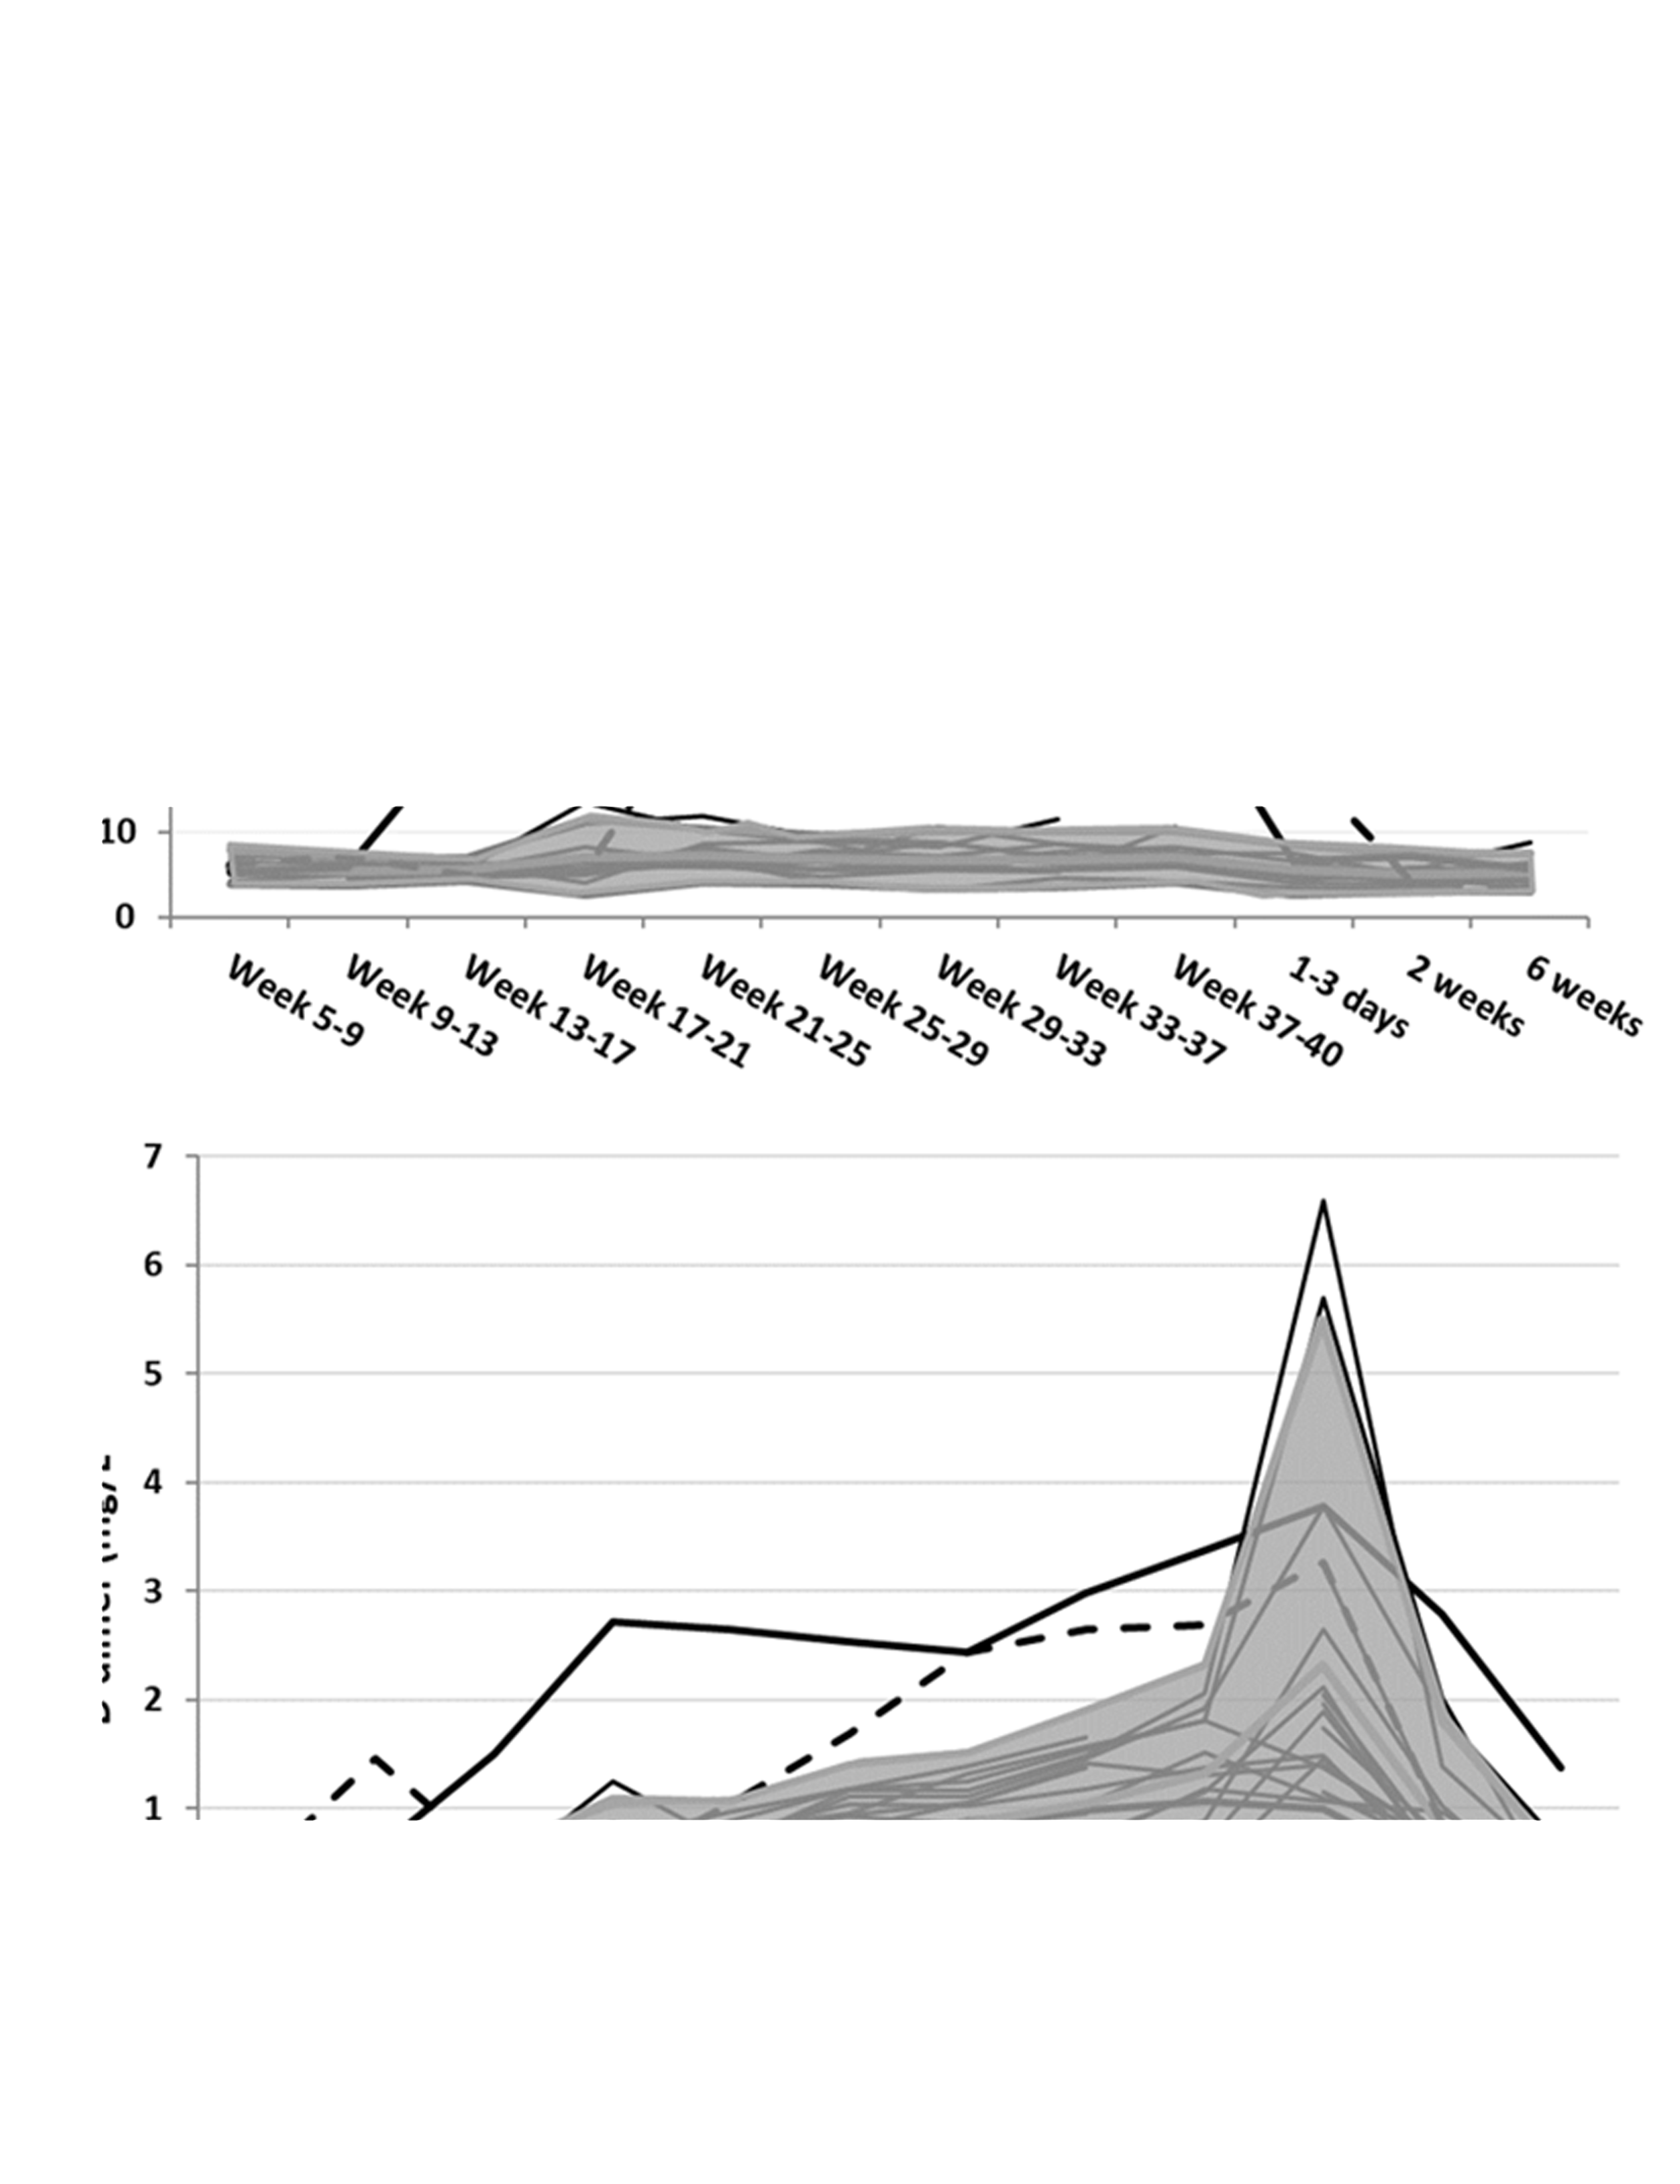
The course of fibrin monomer (FM) (a) and D-dimer (DD) (b) concentration in pregnancy and postpartum as a function of time for 20 women. The FM (a) and DD (b) concentrations are presented on the y-axis and the time of sample related to gestational age (weeks) and time postpartum (days and weeks) on the x-axis. Each black line represents the trajectory of the concentration for individual women. The shaded area encloses the mean ± 2SD of FM (a) and DD (b) concentrations for 18 of the women. The two outlying trajectories represents the excluded outliers subject 5 (homozygous for Factor V Leiden mutation) (
Transformation into natural logarithms and test for Gaussian distribution and variance homogeneity
Gaussian distribution of the residuals from the analysis of variance was not found for FM concentrations nor for the transformed results (lnFM) in pregnant or non-pregnant women, while it was found for results in pregnancy and postpartum together (Table 2 and Supplemental Tables 2 and 3). Variance homogeneity was not found for FM or lnFM in pregnancy, but was found for lnFM in pregnancy and postpartum together and was found for both FM and lnFM in non-pregnant women (Table 2, Supplemental Figure 2 and Supplemental Tables 2 and 3).
Within- (CVI) and between- (CVG) subject variation, analytical variation (CVA) and unidirectional reference change value (RCV) calculated for lnFM (transformed to CVs) in healthy pregnant women during pregnancy (P) (nine samples from each woman), during pregnancy and postpartum (PP) (12 samples from each woman) and in non-pregnant women (NP) (10 samples during 40 weeks).
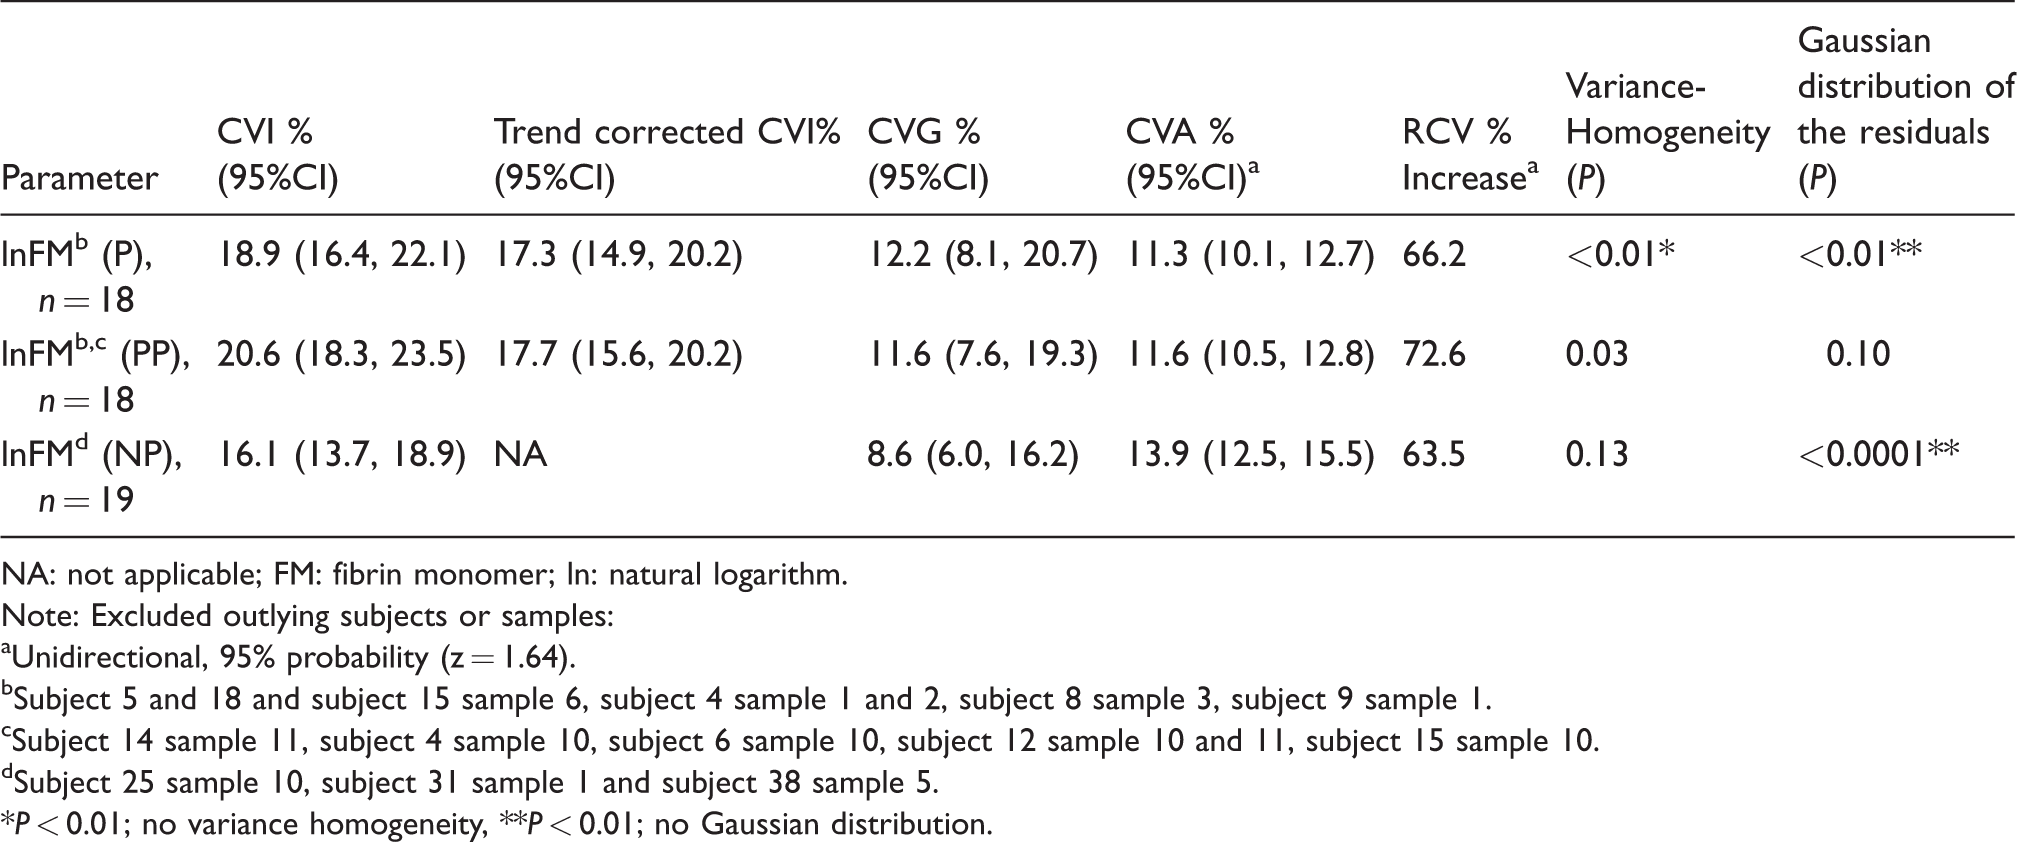
NA: not applicable; FM: fibrin monomer; ln: natural logarithm.
Note: Excluded outlying subjects or samples:
aUnidirectional, 95% probability (z = 1.64).
bSubject 5 and 18 and subject 15 sample 6, subject 4 sample 1 and 2, subject 8 sample 3, subject 9 sample 1.
cSubject 14 sample 11, subject 4 sample 10, subject 6 sample 10, subject 12 sample 10 and 11, subject 15 sample 10.
dSubject 25 sample 10, subject 31 sample 1 and subject 38 sample 5.
*P < 0.01; no variance homogeneity, **P < 0.01; no Gaussian distribution.
Within-subject biological variation and reference change value
The CVI for lnFM in pregnancy and postpartum was 20.6% (95% CI 18.3–23.5%) and the CVG 11.6% (7.6–19.3%), and were not significantly different from CVI and CVG in pregnancy only 18.9% (16.4–22.1) and 12.2 (8.1–20.7), respectively, or in non-pregnant 16.1% (13.7–18.9%) and 8.6% (6.0–16.2%), respectively (Table 2). The trend-adjusted CVI was not statistically significantly different in pregnancy (17.3% [14.9, 20.2]) and in pregnancy and postpartum (17.7% [15.6, 20.2]). The RCV for non-adjusted data were 72.6% in pregnancy and postpartum, 66.2% in pregnancy only and 63.5% in non-pregnant.
Discussion
The main findings in this study were that FM concentrations can be considered stable throughout pregnancy and postpartum for clinical purposes, in contrast to other haemostasis parameters (e.g. DD and fibrinogen). Although the median FM concentration is slightly higher in pregnant than in non-pregnant women, the concentrations were largely overlapping. In addition, the CVI is similar in pregnant and in non-pregnant. Since FM concentrations can be considered stable for practical purposes during pregnancy, it is proposed that measuring FM in pregnancy (in combination with DD) could be a valuable marker of increased coagulation activity. However, this will have to be confirmed in larger studies as also mentioned by others.2,13
The course of FM during pregnancy and correlation with other markers
The explanation for a relatively modest increase of FM concentrations during pregnancy, compared with the very large increase in DD concentration, could be that FM has a shorter half-life (t1/2 2.3–3 h)33,34 compared with DD (t1/2 15.8 (13.1–23.1 h)). 35 Probably, the formation of both FM and DD is increased during pregnancy and delivery, but it is possible that the increase in FM formation will not be detected in the physiological state, because of a more rapid clearance of FM compared with DD. The receptor-mediated clearance mechanism becomes saturated with conversion of just 3% of the fibrinogen to FM. 34 Thus, it can be speculated that if a complication (like VTE or DIC) occurs, with increased coagulation activation and thereby increased FM formation, the FM clearance mechanisms may be saturated and FM concentration increases in plasma – also relative to DD. The use of both FM and DD may therefore improve the diagnostic accuracy in suspected VTE (and/or DIC).2,3
The woman who developed postpartum DVT in the study by Onishi et al. had a significantly higher FM concentration at the time of diagnosis compared with the pregnant women. 15 Whether a normal FM concentration may be used to exclude VTE, should be tested in a cohort of pregnant and non-pregnant women with suspected and verified VTE. The slightly higher concentration of FM in pregnancy compared with non-pregnant may have consequences for reference intervals and/or cut-offs for FM in pregnancy, since using the same cut-off for excluding VTE could increase the number of false positives.
The reason for the conflicting data regarding FM stability during pregnancy in earlier studies13–17 is difficult to explain. Three studies have, as in the present report, included measurements from the same pregnant women throughout pregnancy and postpartum. One of them showed that FM concentration is stable in pregnancy, 18 another showed an increase of FM concentration throughout pregnancy and a drop postpartum, but 80% of the results were still within the reference interval for non-pregnant. 17 The third study identified a larger interindividual variation in FM concentration in the second trimester, but not significantly different concentrations compared with non-pregnant (eight weeks postpartum) concentrations. 16 The other studies on FM have not followed the same women throughout pregnancy, and in these publications, no or minimal increase in FM concentrations was identified.13–15
In the present study, the before mentioned saturable clearance of FM might be the reason for a more marked increase in FM relative to DD as seen in Figure 2(a) and (b) for subjects 5 and 18. The probable explanation for the high FM concentrations coinciding with increased DD concentrations in subject 5 (Figure 2(a) and (b)) was that she turned out to be homozygous for Factor V Leiden, probably resulting in a higher thrombin generation compared with the other pregnant women. She should have received prophylaxis with low-molecular weight heparin to decrease the thrombotic risk if the homozygosity was known before the pregnancy. No specific reasons for the increased FM and DD concentrations were identified for subject 18. Neither subject 5 nor 18 experienced symptoms of VTE and the DD and FM results were not known during the collection of samples, so further diagnostic work-up was not performed.
Of the excluded FM results from the other women, most did not coincide with a higher DD concentration than expected. The exceptions were three samples with the highest FM concentrations right after delivery, which also had the highest DD concentrations at this time point. One of these women (subject 4) had a blood loss of 7–800 mL; otherwise no plausible explanations for the high FM (and DD) concentrations were identified. Other published studies have not measured FM on the day of delivery or the next day. The study by Kawamura et al. measuring FM concentrations three to four days after delivery did not find an increase and also no difference was found when comparing FM concentrations after caesarean sections and vaginal deliveries. 14 The FM concentrations were not increased after the three caesarean sections in the present study. Acute phase/inflammation was not suspected to be a cause of increased FM concentrations, since the health information registered at the same time points did not reveal such an association. In addition, increased concentrations of CRP or fibrinogen were not found simultaneously (data not shown).
Within-subject biological variation, reference change value and index of individuality
Since variance homogeneity was found, the results for within-subject biological variation in pregnancy and postpartum and in non-pregnant can be generalized. The RCVs calculations based on the within-subject biological variation may therefore be used to evaluate if an increase in FM can be explained by analytical and biological variation or not, like for other coagulation parameters studied.19–21 Using the adjusted CV with the estimated regression curve is maybe more correct for monitoring, but since the trend was very small, for practical purposes, the unadjusted RCV is probably sufficient and more practical in use.
Strengths and limitations
The strength of this study is that the samples were obtained from the same pregnant women throughout the course of the pregnancy, that most of the pregnant women attended all of the samplings and that the blood samplings were performed more frequent than in earlier studies. In addition, acute phase reactants (CRP and fibrinogen) and other coagulation parameters (DD and fibrinogen)19,21 were measured at each sampling time and information regarding health status and medication was collected prospectively (at the time of sampling). It is also an advantage that the FM concentrations and the within-subject biological variation were compared with results from non-pregnant women using the same method.
The limitation of this study is that only one assay for FM is used and therefore the results cannot automatically be transferred to the use of other FM assays using different antibodies. Ideally, further examinations of the women with unexpectedly high FM and DD results during the study period should have been undertaken (e.g. ultrasound of lower extremities). However, the results were not known in the study period, and in addition, if the results were known, there is no high-level evidence (guidelines) on how to handle asymptomatic (small) thrombi found in such a situation. In the present study, most samples were obtained the day after delivery, and it would be of interest to measure FM concentrations in samples obtained closer to the time of delivery and at shorter time intervals after for more knowledge of the effect of different delivery methods.
Conclusion
For clinical purposes, the FM concentration can be considered stable throughout pregnancy, compared with the increase in for example DD and fibrinogen. These characteristics make FM a potential biomarker to be included in the diagnostic workflow for VTE, but further studies are needed to evaluate the clinical usefulness.
Supplemental Material
Supplemental Figures - Supplemental material for Concentration of fibrin monomer in pregnancy and during the postpartum period
Supplemental material, Supplemental Figures for Concentration of fibrin monomer in pregnancy and during the postpartum period by Ann Helen Kristoffersen, Per Hyltoft Petersen, Line Bjørge, Thomas Røraas and Sverre Sandberg in Annals of Clinical Biochemistry
Supplemental Material
Supplemental Table1 - Supplemental material for Concentration of fibrin monomer in pregnancy and during the postpartum period
Supplemental material, Supplemental Table1 for Concentration of fibrin monomer in pregnancy and during the postpartum period by Ann Helen Kristoffersen, Per Hyltoft Petersen, Line Bjørge, Thomas Røraas and Sverre Sandberg in Annals of Clinical Biochemistry
Supplemental Material
Supplemental Table2 - Supplemental material for Concentration of fibrin monomer in pregnancy and during the postpartum period
Supplemental material, Supplemental Table2 for Concentration of fibrin monomer in pregnancy and during the postpartum period by Ann Helen Kristoffersen, Per Hyltoft Petersen, Line Bjørge, Thomas Røraas and Sverre Sandberg in Annals of Clinical Biochemistry
Supplemental Material
Supplemental Table3 - Supplemental material for Concentration of fibrin monomer in pregnancy and during the postpartum period
Supplemental material, Supplemental Table3 for Concentration of fibrin monomer in pregnancy and during the postpartum period by Ann Helen Kristoffersen, Per Hyltoft Petersen, Line Bjørge, Thomas Røraas and Sverre Sandberg in Annals of Clinical Biochemistry
Footnotes
Acknowledgements
Thanks to Stago for supporting the study with reagents free of cost. Thanks to the biomedical scientists, Solveig Vannes and Bente Asbjørnsen, at the Department of Medical Biochemistry and Pharmacology for excellent technical assistance. Additional thanks to the Western Regional Health Authorities for supporting A.H. Kristoffersen with PhD and post-doc scholarship.
Declaration of conflicting interests
The author(s) declared no potential conflicts of interest with respect to the research, authorship, and/or publication of this article.
Funding
The author(s) disclosed receipt of the following financial support for the research, authorship, and/or publication of this article: The Western Regional Health Authorities supported AHK with PhD and post-doc scholarship.
Ethical approval
Ethical approval was obtained from the Regional Committee of Medical Ethics of Western Norway (Project No. 3.2006.1869/REK Vest 2010/221).
Guarantor
AHK.
Contributorship
AHK, PHP, LB and SS contributed to the design of the study. AHK collected the data, did the literature research and wrote the first draft of the article. AHK, PHP, TR and SS contributed to the statistical work. All authors contributed to interpretation of data, critical review of the article, and approved the final version of the article.
References
Supplementary Material
Please find the following supplemental material available below.
For Open Access articles published under a Creative Commons License, all supplemental material carries the same license as the article it is associated with.
For non-Open Access articles published, all supplemental material carries a non-exclusive license, and permission requests for re-use of supplemental material or any part of supplemental material shall be sent directly to the copyright owner as specified in the copyright notice associated with the article.