
Abstract
Introduction
In this study, we investigate whether the addition of biomarkers to a model based on traditional risk factors improves risk prediction and patient selection for revascularization in atherosclerotic renovascular disease.
Methods
Patients in the Salford Renovascular Study who had the following biomarkers analysed on a baseline sample were included in this study: FGF-23, Cystatin C, kidney injury molecule-1, myeloperoxidase, neutrophil gelatinase-associated lipocalin, N-terminal prohormone of brain natriuretic peptide (NT-proBNP), high-sensitivity Troponin T and anti-apolipoprotein A1 IgG. Cox proportional hazards models and net reclassification index were used to study the effects of either individual or a panel of biomarkers on predicting death, end-stage kidney disease and cardiovascular events.
Results
A total of 112 patients were followed up for a median 59.9 months (IQR 33.6–86.9). In total, 75 patients died, 21 reached end-stage kidney disease and 36 suffered a cardiovascular event. Only NT-proBNP maintained a statistically significant association with all end-points (death: HR 1.62 [95% CI 1.26–2.10], P < 0.0005; end-stage kidney disease: HR 1.51 [95% 1.19–1.91], P = 0.001; cardiovascular event: HR 1.56 [95% CI 1.23–1.97], P < 0.0005). Risk reclassification improved with addition of all biomarkers as a panel to the base model. Only patients with NT-proBNP concentrations above 300 ng/L gained benefit from revascularization with regard to all adverse end-points compared with medically managed patients.
Conclusions
NT-proBNP is independently associated with increased risk for all adverse events in atherosclerotic renovascular disease. Novel biomarkers may have an incremental risk predictive value when used in combination with traditional risk factors, and NT-proBNP may have value in patient selection for revascularization. Given the small size of this study, larger multicentre studies are required to validate these findings.
Introduction
Atherosclerotic renovascular disease (ARVD) typically exists in the context of systemic atherosclerosis-related cardiovascular disease (CVD), as well as in chronic kidney disease (CKD), and these accumulative risk factors are usually the principal determinants of adverse outcomes in ARVD patients.1,2 Most patients with ARVD have silent disease, and only a small proportion develop high-risk features such as uncontrolled blood pressure, rapid deterioration in renal function or flash pulmonary oedema. It is often difficult to confirm the haemodynamic and functional significance of ARVD but even clinically silent disease has prognostic significance, with a four-fold increased risk of cardiovascular events 2 and a three-fold increased risk of death. 3 Indeed, global risk stratification in this heterogenous condition is complex and still remains an unmet clinical need. It is hoped that early identification of patients at higher risk would not only encourage intensification of medical management but also optimize patient selection for revascularization, enhancing ARVD treatment efficacy. Large randomized controlled trials (RCTs) showed that renal revascularization in ARVD patients does not provide overall clinical benefit in the populations studied.4,5 Although debated, this could be partly due to selection bias related to under-representation of ‘high-risk’ ARVD patients who have been shown to gain benefit from revascularization in observational studies.6,7
Traditional cardiovascular risk factors and routine laboratory parameters have been shown to correlate with adverse events in the CKD population and have been used to create risk stratification tools to facilitate individualized clinical decision-making with regard to renal replacement therapy (RRT) planning.8,9 As expected, similar risk factors are associated with adverse outcomes in patients with ARVD, 10 although to date, there are no equivalent risk stratification tools for this specific patient group. 3 In addition, the only conventional cardiovascular risk factor that has been shown to potentially predict outcomes postrevascularization is baseline proteinuria.11–13 Several novel biomarkers related to important biological processes that underpin cardiac, renal and vascular injury have recently been shown to be independently associated with adverse outcomes in patients with CKD; however, their value in risk prediction in ARVD patients is unclear.14–16 Only a few studies have investigated the pathogenic role of some of these biomarkers in the context of ARVD,17,18 and their validity for long-term risk prediction in patients with this specific condition has not yet been evaluated.
The biomarkers chosen for analysis were those with high clinical justification in patients with CKD. We aimed to determine whether these biomarkers, when considered individually or as a panel, were associated with long-term adverse outcomes in a population of patients with ARVD and whether their addition to a conventional model based on traditional cardiovascular and renal risk factors could aid risk prediction in this specific patient cohort. Finally, we explored whether any of these biomarkers can help identify patients who respond beneficially to revascularization.
Materials and methods
Patients diagnosed with ARVD on radiological imaging and referred to the Salford renal department have been recruited into the Salford Renovascular Study for several decades. 19 Ethical approval for this observational study was granted from the North West – Greater Manchester South Research Ethics Committee (REC 15/NW/0818). The study database is updated on an annual basis from hospital records. Data collection has been described elsewhere. 19 In brief, data include baseline demographics, co-morbid conditions (diabetes, macrovascular disease [MVD], congestive heart failure [CHF]), presence of flash pulmonary oedema [FPE]), annualized prescribed medications, blood pressure, routine baseline biochemistry including serum creatinine (υmol/L), parathyroid hormone (PTH) concentrations (pmol/L), baseline proteinuria (g/24 h) and clinical outcome data. The degree of renal artery stenosis (RAS) was obtained from cross-sectional angiography (intra-arterial digital subtraction angiography, computed tomographic or magnetic resonance angiography). These images were reported by only two specialist radiologists over the entire study period, and quantified using a ‘patency score’, thus facilitating repeatability. A score of 200 was equivalent to 0% bilateral stenosis, while a score of 0 meant 100% bilateral occlusion. Estimated glomerular filtration rate (eGFR) was calculated using the Chronic Kidney Disease Epidemiology Collaboration equation. 20
Patients recruited into the Salford Renovascular Study have been managed in accordance with contemporary vascular protective advice and UK Renal Association blood pressure targets. 21 Renal revascularization has been performed in accordance with physician preference or after entry into an RCT.4,5 All revascularization procedures involved percutaneous transluminal angioplasty. Bare-metal stents were deployed in all procedures, and no embolic protection devices were used.
Patients recruited into the current study were also recruited into a parallel epidemiological study based at our renal centre, the Chronic Renal Insufficiency Standards Implementation Study (CRISIS). This is a prospective observational study of outcome in non-dialysis kidney disease. Details of the CRISIS cohort have been published previously.15,22,23 The subgroup of patients with ARVD as a documented cause of their CKD was recruited into the current study. Patients recruited into CRISIS have blood samples drawn for standard clinical tests, and additional samples are immediately centrifuged and stored at –80°C for subsequent biomarker analyses.
The following biomarkers were analysed: fibroblast growth factor-23 (FGF-23) (RU/mL), Cystatin C (mg/L), kidney injury molecule-1 (KIM-1) (ng/L), myeloperoxidase (MPO) (ng/L), neutrophil gelatinase-associated lipocalin (NGAL) (ng/L), N-terminal prohormone of brain natriuretic peptide (NT-proBNP) (ng/L), high-sensitivity cardiac Troponin T (hs-cTNT) (ng/L)15,16 and anti-apolipoproteinA-1 immunoglobulin G (anti-apoA-1 IgG) (optical density [OD]).24–28 Patients with missing baseline data were excluded from analysis. The date of sampling was considered as time zero for clinical event analysis. New patients were entered into the database up until 31 August 2014, and data censoring was performed at the earliest of 11 May 2015, death, or last patient encounter if discharged or lost to follow-up.
Biomarker analysis
FGF-23 was measured using a second-generation, two-site enzyme linked immunosorbent assay (ELISA) supplied by Immutopics (San Clemente, CA, USA) detecting both intact FGF-23 and its carboxyl-terminal fragments. KIM-1, NGAL and MPO were quantified with the MESO QuickPlex SQ 120 Automate using immuno-electrochemiluminescence from Mesoscale Discovery Systems (Rockville, MD, USA). The lower limits of detection in ng/L were 0.49, 2.85 and 7.46 for KIM-1, NGAL and MPO, respectively.
The intra-assay variation coefficients (VC) were as follows:
For KIM-1, 3.04% (n = 34) at 312.5 ng/L and 2.5% at 78.1 ng/L (n = 34). For NGAL, 5.57% (n = 34) at 2500 ng/L and 3.87% at 625 ng/L (n = 34). For MPO, intra-assay VCs were 6.08% (n = 34) at 3125 ng/L and 7.75% at 781 ng/L (n = 34).
The inter-assay VCs were as follows:
For KIM-1, VCs were 5.45% (n = 17) and 3.02% (n = 17) at concentrations of 312.5 and 78.1 ng/L, respectively. For NGAL, VCs were 5.77% (n = 17) and 8.52% (n = 17) at concentration of 2500 and 625 ng/L, respectively. For MPO, VCs were 8.17% (n = 17) and 8.52% (n = 17) at concentration of 3125 and 781.25 ng/L, respectively.
NT-proBNP and hs-cTNT were measured on citrated plasma by electrochemiluminescence, using an assay supplied by Roche Diagnostics (Indianapolis, USA). The lower limit of detection for the NT-proBNP assay was 0.6 ng/L, and the upper limit of detection was 4130 ng/L. The manufacturer’s quoted inter-assay CV at 7.0 ng/L is 3.5% and at 62.6 ng/L is 1.8%. The lower limit of detection for the hs-cTNT assay is 0.01 ng/L and the maximum measured value is 25.0 ng/L. The manufacturer’s quoted inter-assay VC for concentrations of 0.04 ng/L and 0.65 ng/L were 3.4 and 1.6%, respectively.
Cystatin C was measured by the turbidimetric method (Gentian, Moss, Norway). Anti-apoA-1 IgG concentrations were quantified on citrated plasma samples, using an ELISA technique as described in previous studies.26–28
Clinical end-points
Predefined primary clinical end-points for this study include:
Date of ‘all-cause’ death as recorded in the hospital records Date of first cardiovascular event (CVE) after enrolment, defined as a composite of acute coronary syndrome or myocardial infarction, new arrhythmias, pulmonary oedema or decompensated heart failure, cerebrovascular events including transient ischaemic attacks. Date of patient reaching end-stage kidney disease (ESKD) defined as the earliest of the following events: initiation of RRT (including renal transplantation) or reaching eGFR <10 mL/min/1.73 m2, which is the approximate average eGFR at which RRT is commenced in the UK.
29
Statistical analysis
Baseline characteristics were compared between the study population and the patients in the Salford Renovascular study who did not undergo biomarker analysis. Comparison of baseline characteristics and biomarker concentrations was then performed for patients in the study population with CKD stages 3, 4 and 5, and for patients with different severity of RAS. Categorical data are presented as a number and percentage, normally distributed continuous data as mean ± standard deviation and non-parametric continuous data as median (interquartile range). Chi-square test was used to compare categorical data; Kruskal-Wallis or Mann-Whitney U tests was used to compare non-parametric continuous data, and Student t-test or ANOVA was used for parametric data. The number of clinical end-points and unadjusted incidence rates per 100 patient years were calculated manually.
The association of traditional risk factors and novel biomarkers with each of the clinical end-points was explored using Cox proportional hazards regression. Hazard ratios (HRs) for age and eGFR were scaled by exponentiation of the HR to 10 years and 5 mL/min/1.73 m2, respectively, to aid clinical interpretation. All biomarkers had a skewed distribution, as frequently observed for inflammatory and cardiac-related biomarkers 14 and were accordingly logarithmic-transformed before analyses. Biomarker values were graded into quartiles, and HRs are reported per quartile increase in biomarker level or per values above vs. below the predefined NT-proBNP cut-off. Assuming a conservative survival rate difference of 20% between patients with high vs. low NT-proBNP values previously reported in CKD patients, 30 post hoc power calculation showed that our sample size of 112 patients displayed a power of 86% at the alpha level of 5%.
A baseline multivariable model consisting of traditional risk factors associated with adverse events in patients with CKD and ARVD was created for each of the four clinical end-points. All covariates attaining a significance of P < 0.05 on unadjusted analysis were retained in the multivariate baseline risk model for the respective study end-point and the same variables were retained for all end-points. Each novel biomarker was then added individually to the each of the four base models to obtain adjusted HRs for each quartile increase in biomarker level; the additional predictive value for each biomarker, adjusted for traditional risk factors, was illustrated on Forest plots. Biomarkers that were individually significant in this analysis were then added as a panel to the baseline model to investigate the association between this combination of biomarkers and individual end-points.
Receiver operator characteristic analyses were used to determine whether the addition of novel biomarkers, either individually or as a group, to the base model, improved risk discrimination, which was quantified using the area under the curve (AUC). Goodness of model fit was assessed using Akaike Information Criterion. Net reclassification index (NRI) was used to quantify any improvement in risk discrimination; biomarkers were again analysed as quartiles. 31 Both continuous and three-category NRI results are presented, and NRI event and non-event rates were calculated from reclassification tables. Risk categories for categorical NRI were arbitrarily based on yearly event rates reported previously in an unselected ARVD population, given the lack of established risk categories in the ARVD population.10,32 Integration discrimination improvement (IDI) results are also presented. Given the small patient numbers, for the purposes of this analysis, progression to ESKD and CVE end-points were considered composite with death. Kaplan-Meier curves were used to analyse the effect of revascularization on time to end-points in patients with different concentrations of those biomarkers that were most strongly associated with adverse events on multivariate analyses. Patients were dichotomized either according to previously validated cut-off concentrations or according to the median biomarker level observed in the current study; the latter was used if standard cut-offs were not applicable to our study population or if the number of events in groups resulting from standard cut-offs was too small.
All analyses have been performed using SPSS version 22.0, Microsoft Excel and R version 3.2.1, and a P value <0.05 was considered statistically significant.
Results
Out of a total of 830 patients recruited into the Salford Renovascular study, 170 patients had biomarker analyses performed on a baseline plasma sample as part of another study.15,16 Only 112 patients had complete laboratory data-sets and these comprised the study population (Figure 1). With regard to clinical end-points, 75 (67.0%) patients died, 21 (18.8%) reached ESKD or started RRT and 36 (32.1%) suffered a CVE. Median follow-up was 59.9 months (33.6–86.9). In total, 13 patients were lost to follow-up over this period. Median age was 71.1 years (66.7–76.9), 66.1% were male and median baseline eGFR was 27.4 mL/min/1.73 m2 (18.8–39.0). Supplementary Table 1 shows that patients in the Salford Renovascular study who did not have biomarker analyses performed had similar characteristics to the 112 patients in this analysis, with the exceptions that the latter had a lower degree of proteinuria at baseline (0.3 vs. 0.6 g/24 h, P < 0.0005) and were more frequently established on a statin at the time of diagnosis (71.4% vs. 51.7%, P < 0.0005). In addition, the study population had a comparatively lower incidence of adverse events per 100 patient years.
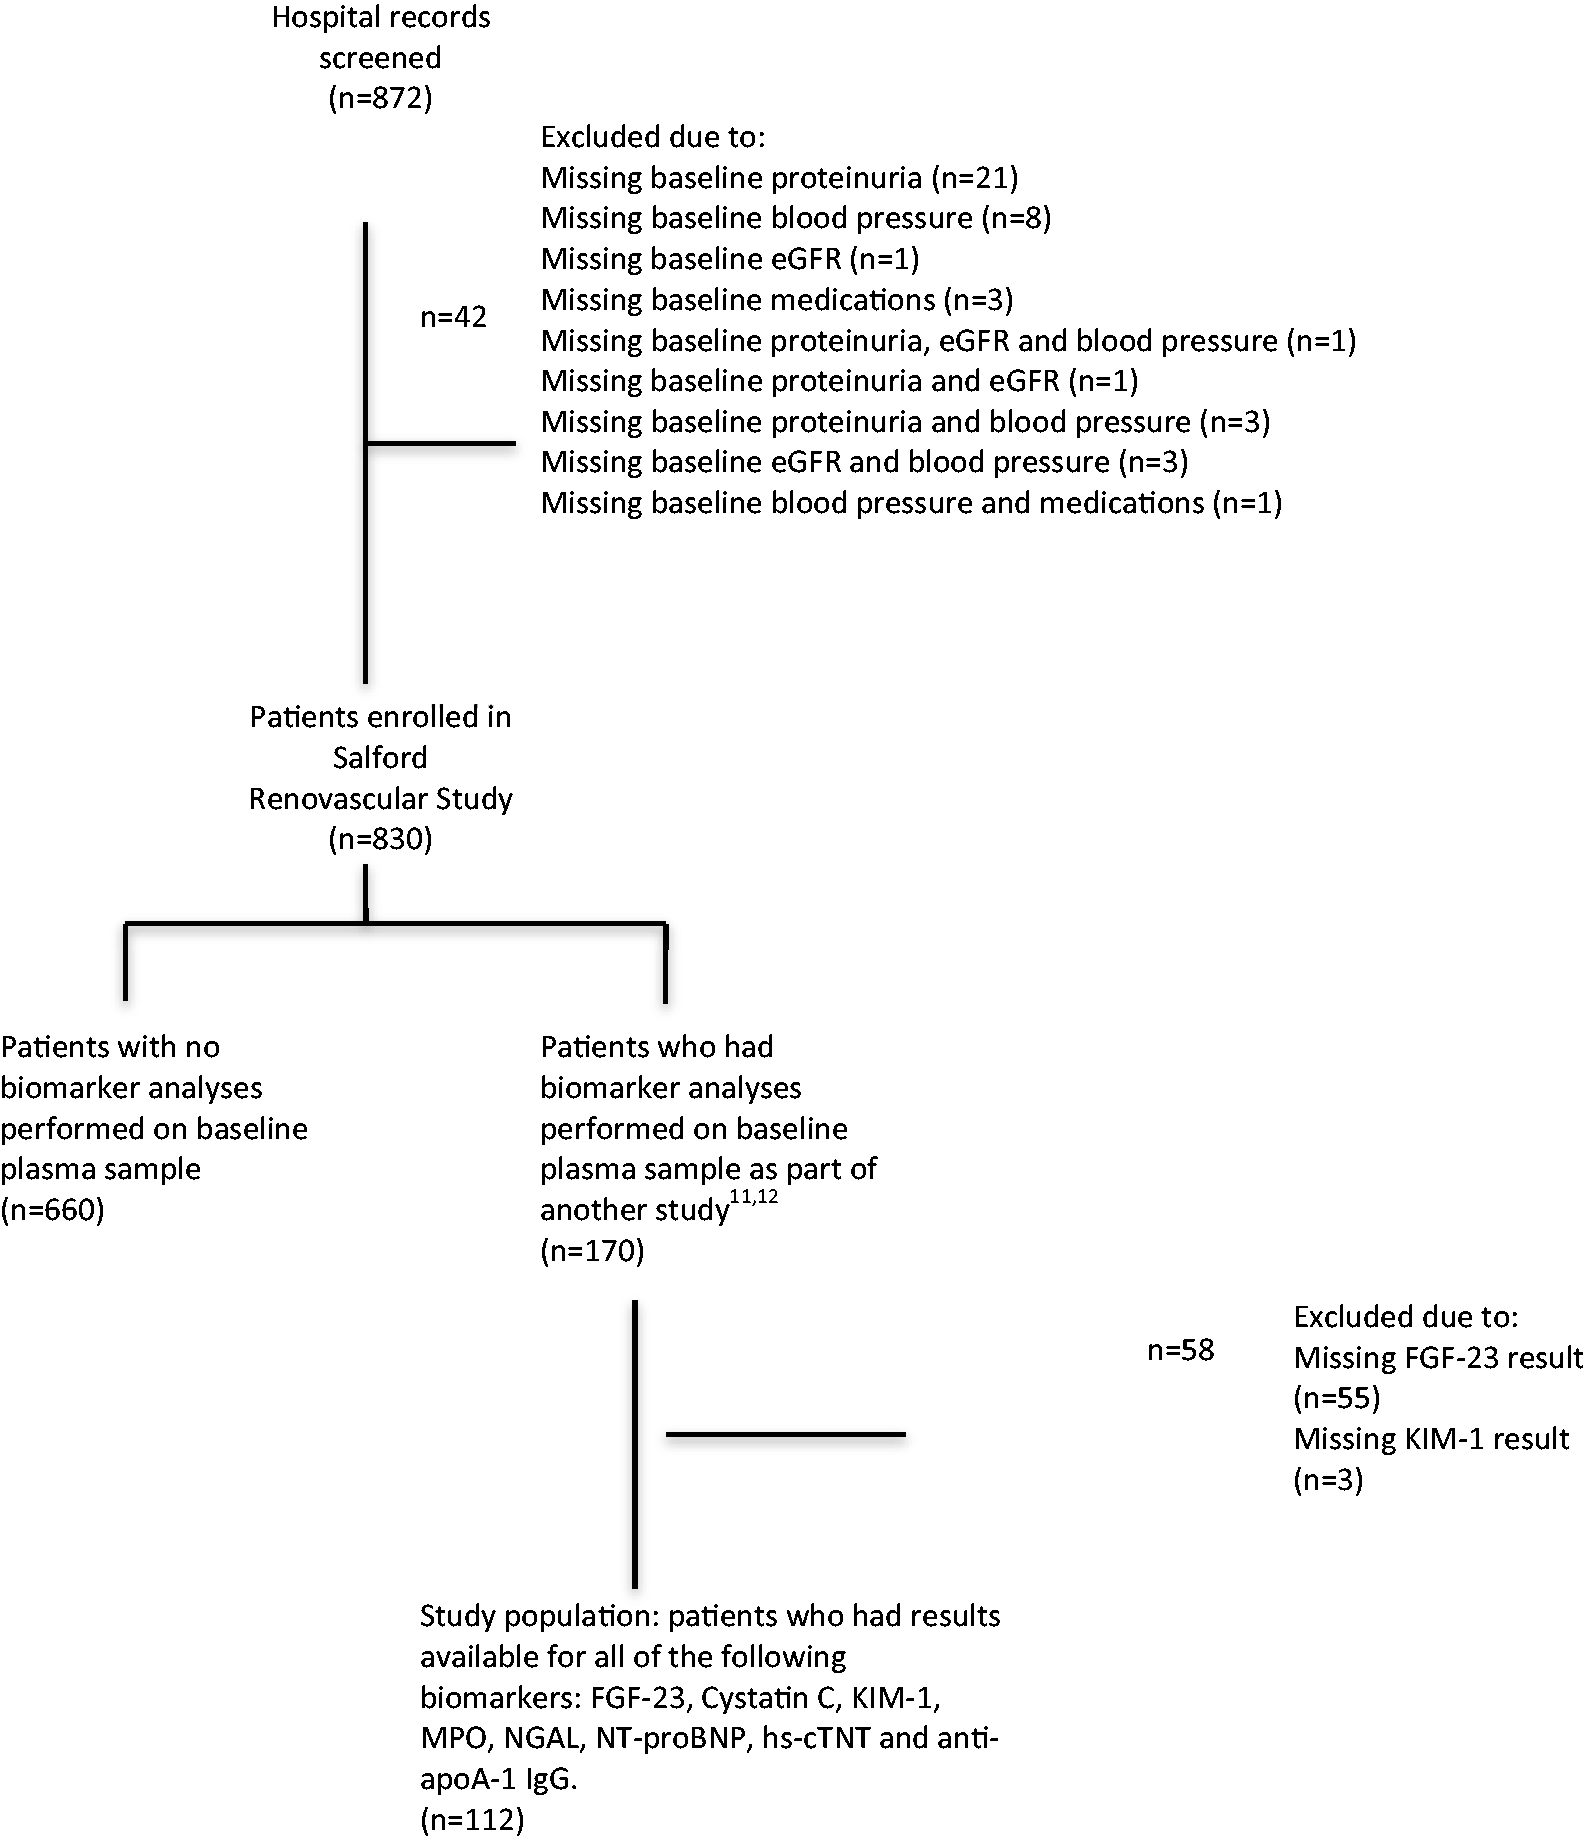
Flowchart describing the selection of study population.
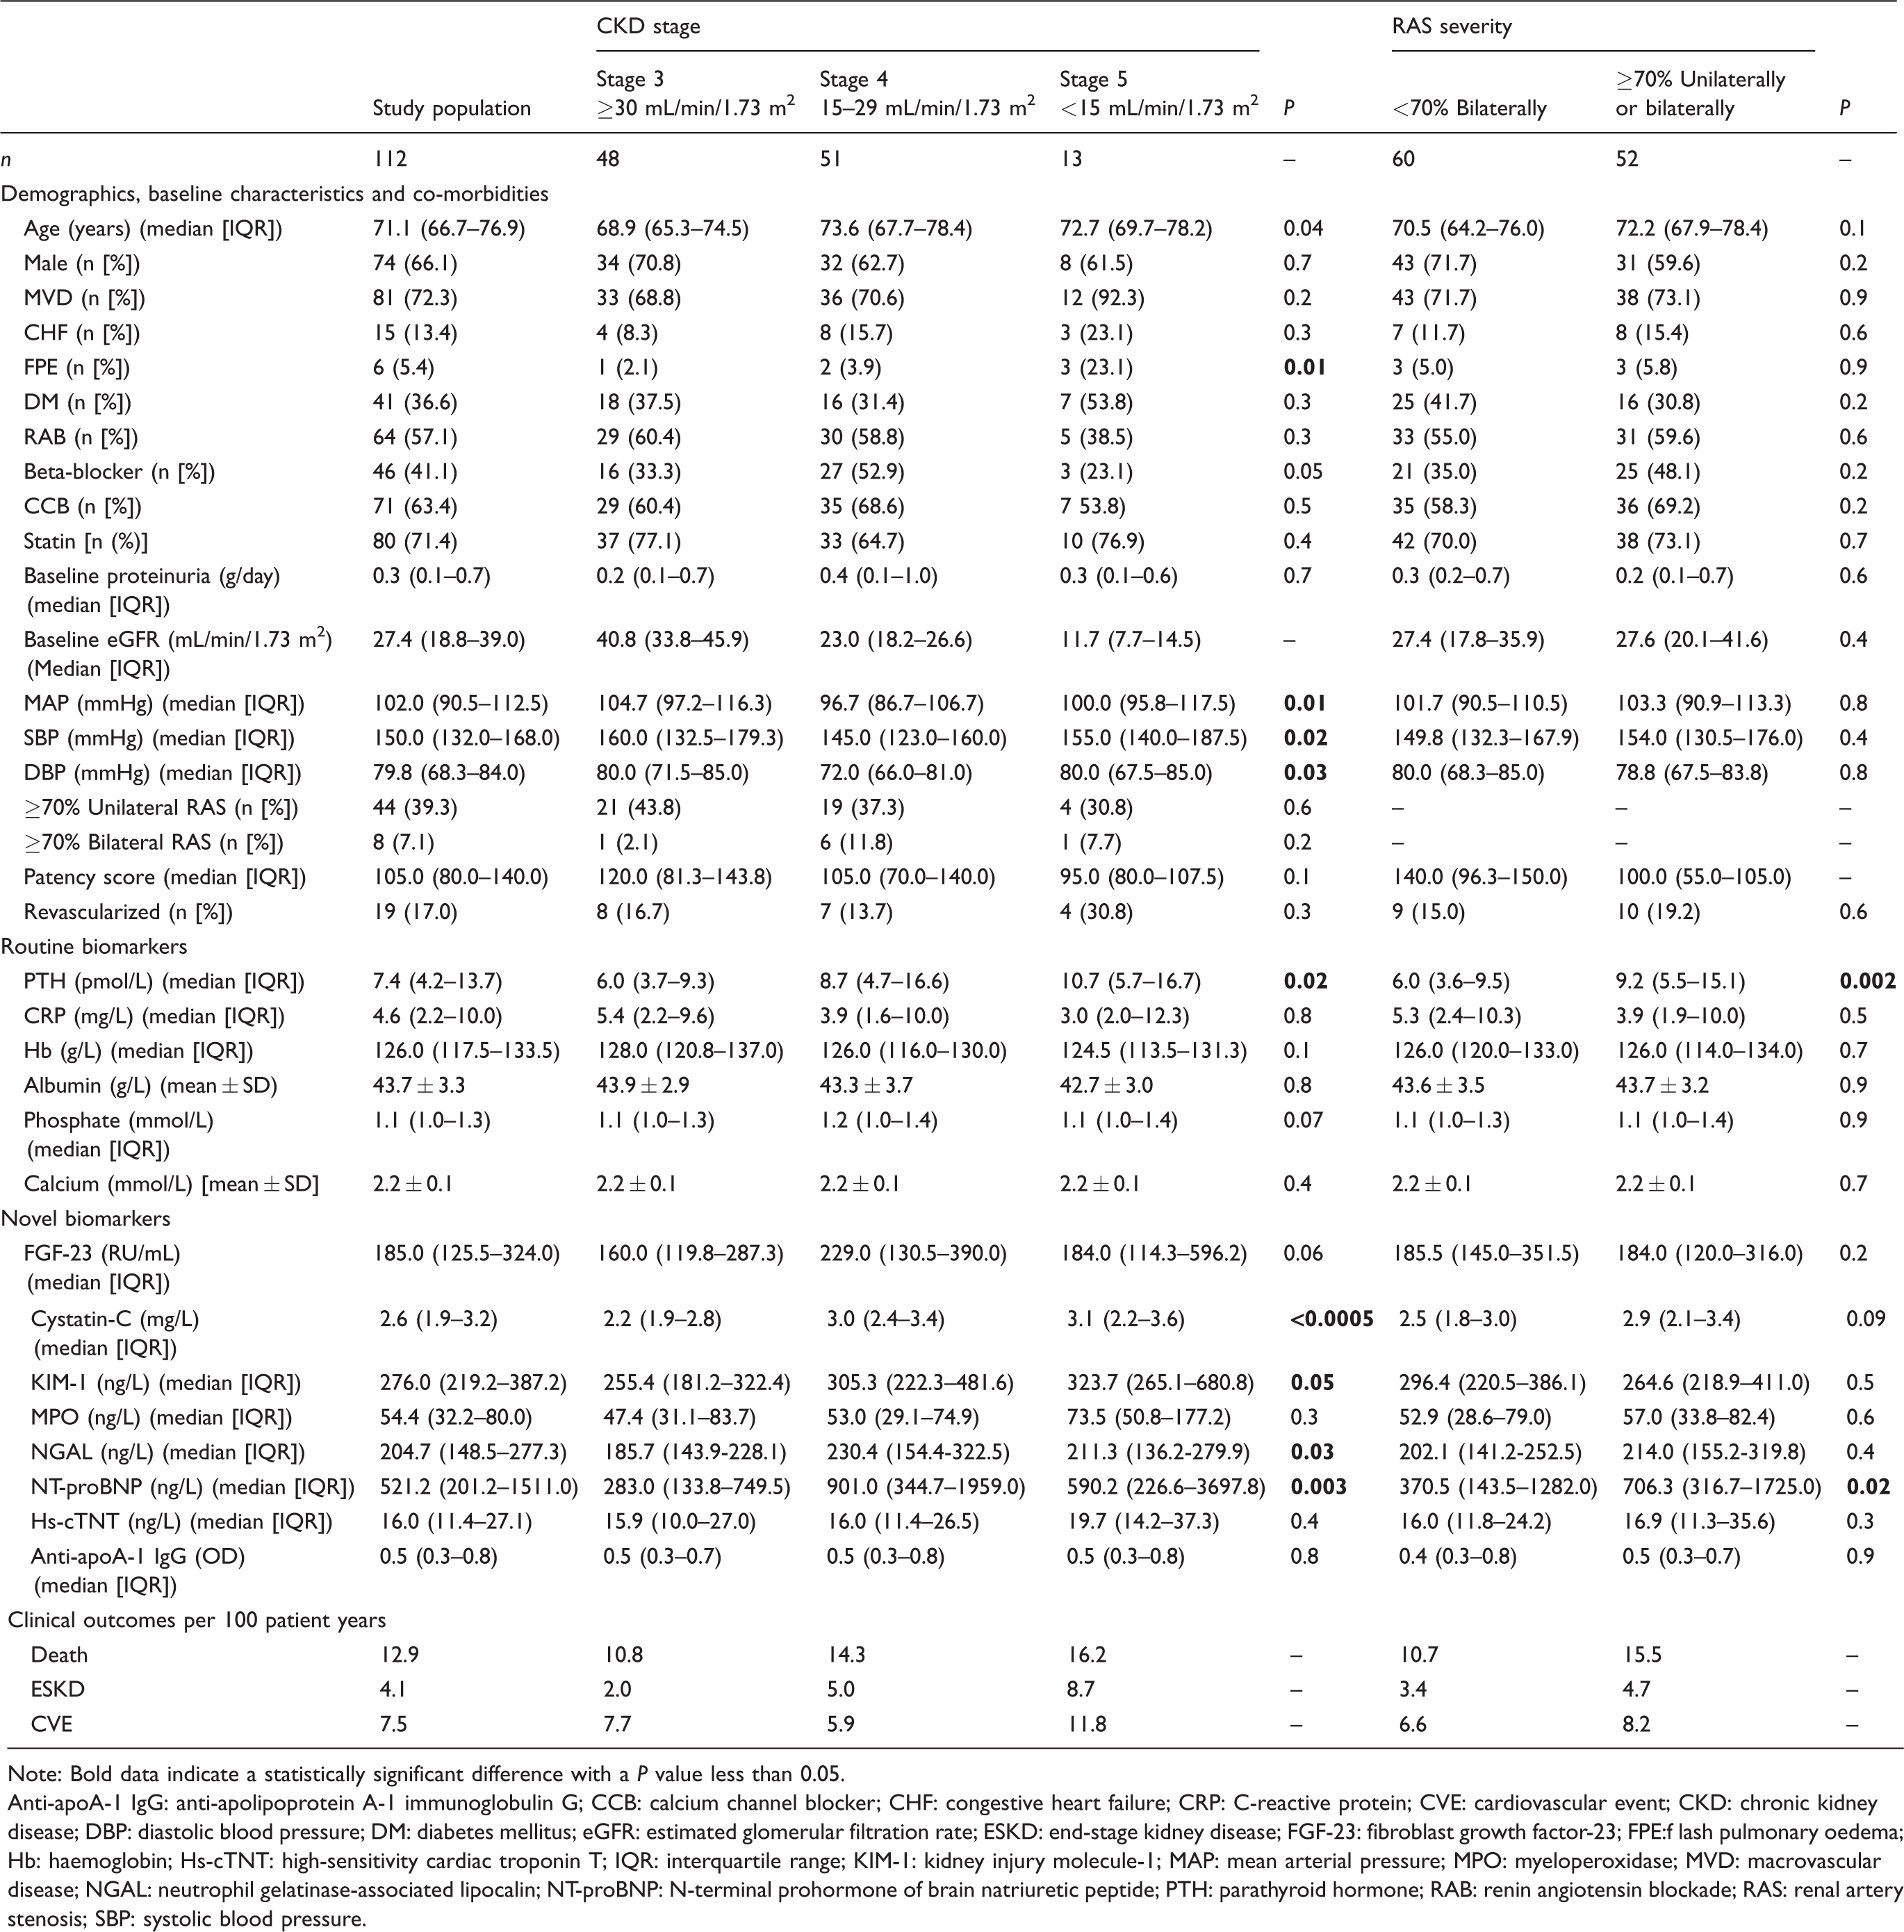
Baseline characteristics, serum biomarkers and clinical outcomes subdivided by chronic kidney disease (CKD) stage and renal artery stenosis (RAS) severity.
Note: Bold data indicate a statistically significant difference with a P value less than 0.05.
Anti-apoA-1 IgG: anti-apolipoprotein A-1 immunoglobulin G; CCB: calcium channel blocker; CHF: congestive heart failure; CRP: C-reactive protein; CVE: cardiovascular event; CKD: chronic kidney disease; DBP: diastolic blood pressure; DM: diabetes mellitus; eGFR: estimated glomerular filtration rate; ESKD: end-stage kidney disease; FGF-23: fibroblast growth factor-23; FPE:f lash pulmonary oedema; Hb: haemoglobin; Hs-cTNT: high-sensitivity cardiac troponin T; IQR: interquartile range; KIM-1: kidney injury molecule-1; MAP: mean arterial pressure; MPO: myeloperoxidase; MVD: macrovascular disease; NGAL: neutrophil gelatinase-associated lipocalin; NT-proBNP: N-terminal prohormone of brain natriuretic peptide; PTH: parathyroid hormone; RAB: renin angiotensin blockade; RAS: renal artery stenosis; SBP: systolic blood pressure.
Concentrations of PTH, Cystatin-C, KIM-1, NGAL and NT-proBNP increased with declining renal function, while the remaining biomarkers, including FGF-23, did not show any statistically significant change with progression from CKD stage 3 to stage 5. Of note, the number of patients who had CKD stage 5 at baseline was much smaller compared with the other two groups (Table 1). Patients with more severe RAS had similar baseline characteristics, including renal function and blood pressure control, to patients with less severe disease. The only statistically significant differences between these two groups of patients were NT-proBNP (706.3 ng/L vs. 370.5 ng/L, P = 0.02) and PTH (9.2 pmol/L vs. 6.0 pmol/L, P = 0.002; Table 1).
Baseline multivariable models for death, progression to ESKD and CVE are shown in Table 2. Older age at the time of diagnosis was associated with increased risk of death (HR 1.76 [95% CI 1.22–2.52], P = 0.003) and CVE (HR 1.55 [95% CI 1.10–2.18], P = 0.01), while higher degree of baseline proteinuria was associated with increased risk of progression to ESKD (HR 1.30 [95% CI 1.01–1.67], P = 0.04). Macrovascular disease and cardiovascular co-morbidities such as CHF and FPE at the time of diagnosis were not found to predict any adverse events. Renal function at the time of diagnosis did not appear to have a strong statistical impact on clinical outcomes, while HRs for all adverse events increased for every quartile increase in baseline PTH and phosphate concentrations. Higher calcium concentrations at the time of diagnosis were associated with reduced HRs for clinical end-points.
Multivariable model based on base model (shaded area) and combination of those biomarkers that are individually statistically significant when adjusted for base model.
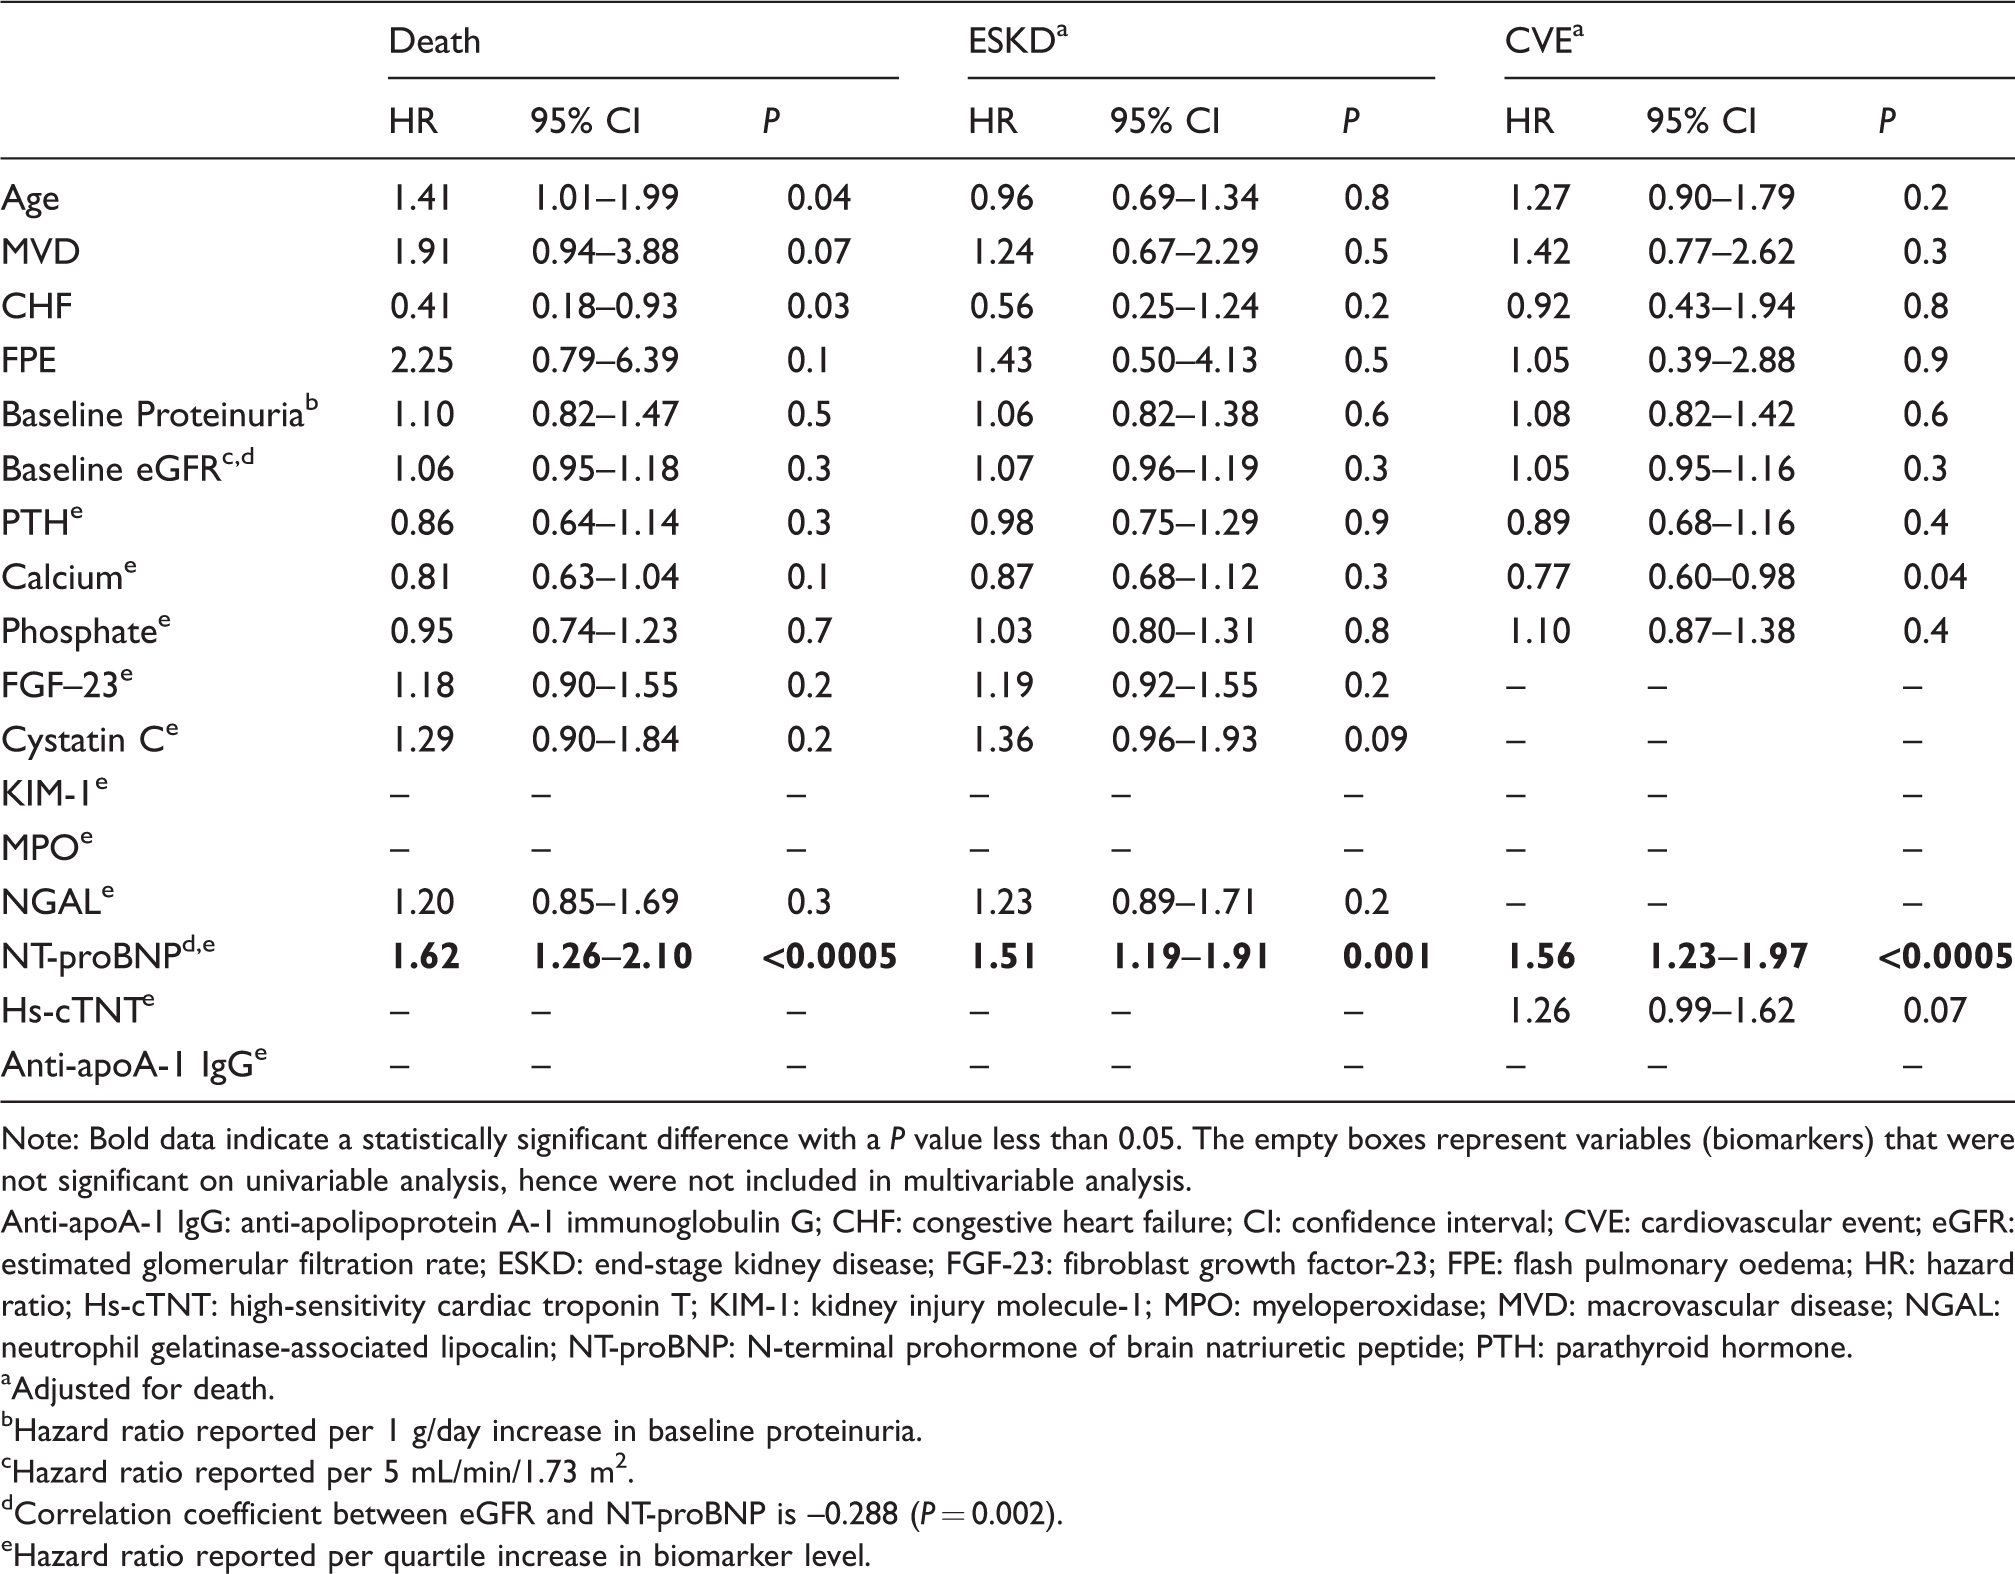
Note: Bold data indicate a statistically significant difference with a P value less than 0.05. The empty boxes represent variables (biomarkers) that were not significant on univariable analysis, hence were not included in multivariable analysis.
Anti-apoA-1 IgG: anti-apolipoprotein A-1 immunoglobulin G; CHF: congestive heart failure; CI: confidence interval; CVE: cardiovascular event; eGFR: estimated glomerular filtration rate; ESKD: end-stage kidney disease; FGF-23: fibroblast growth factor-23; FPE: flash pulmonary oedema; HR: hazard ratio; Hs-cTNT: high-sensitivity cardiac troponin T; KIM-1: kidney injury molecule-1; MPO: myeloperoxidase; MVD: macrovascular disease; NGAL: neutrophil gelatinase-associated lipocalin; NT-proBNP: N-terminal prohormone of brain natriuretic peptide; PTH: parathyroid hormone.
aAdjusted for death.
bHazard ratio reported per 1 g/day increase in baseline proteinuria.
cHazard ratio reported per 5 mL/min/1.73 m2.
dCorrelation coefficient between eGFR and NT-proBNP is –0.288 (P = 0.002).
eHazard ratio reported per quartile increase in biomarker level.
Figures 2(a) to (c) shows the effect of each quartile increase in individual biomarker concentration when added separately to the baseline multivariable models for each of the three end-points. Biomarkers that were individually statistically significant after adjusting for traditional risk factors were then added as a panel to each of the four base models. Table 2 shows that NT-proBNP was the only biomarker to remain strongly associated with all adverse events after adjusting for traditional risk factors and other biomarkers in the panel (death: HR 1.62 [95% CI 1.26–2.10] P < 0.0005; ESKD: HR 1.51 [95% CI 1.19–1.91] P = 0.001; CVE: HR 1.56 [95% CI 1.23–1.97] P < 0.0005).
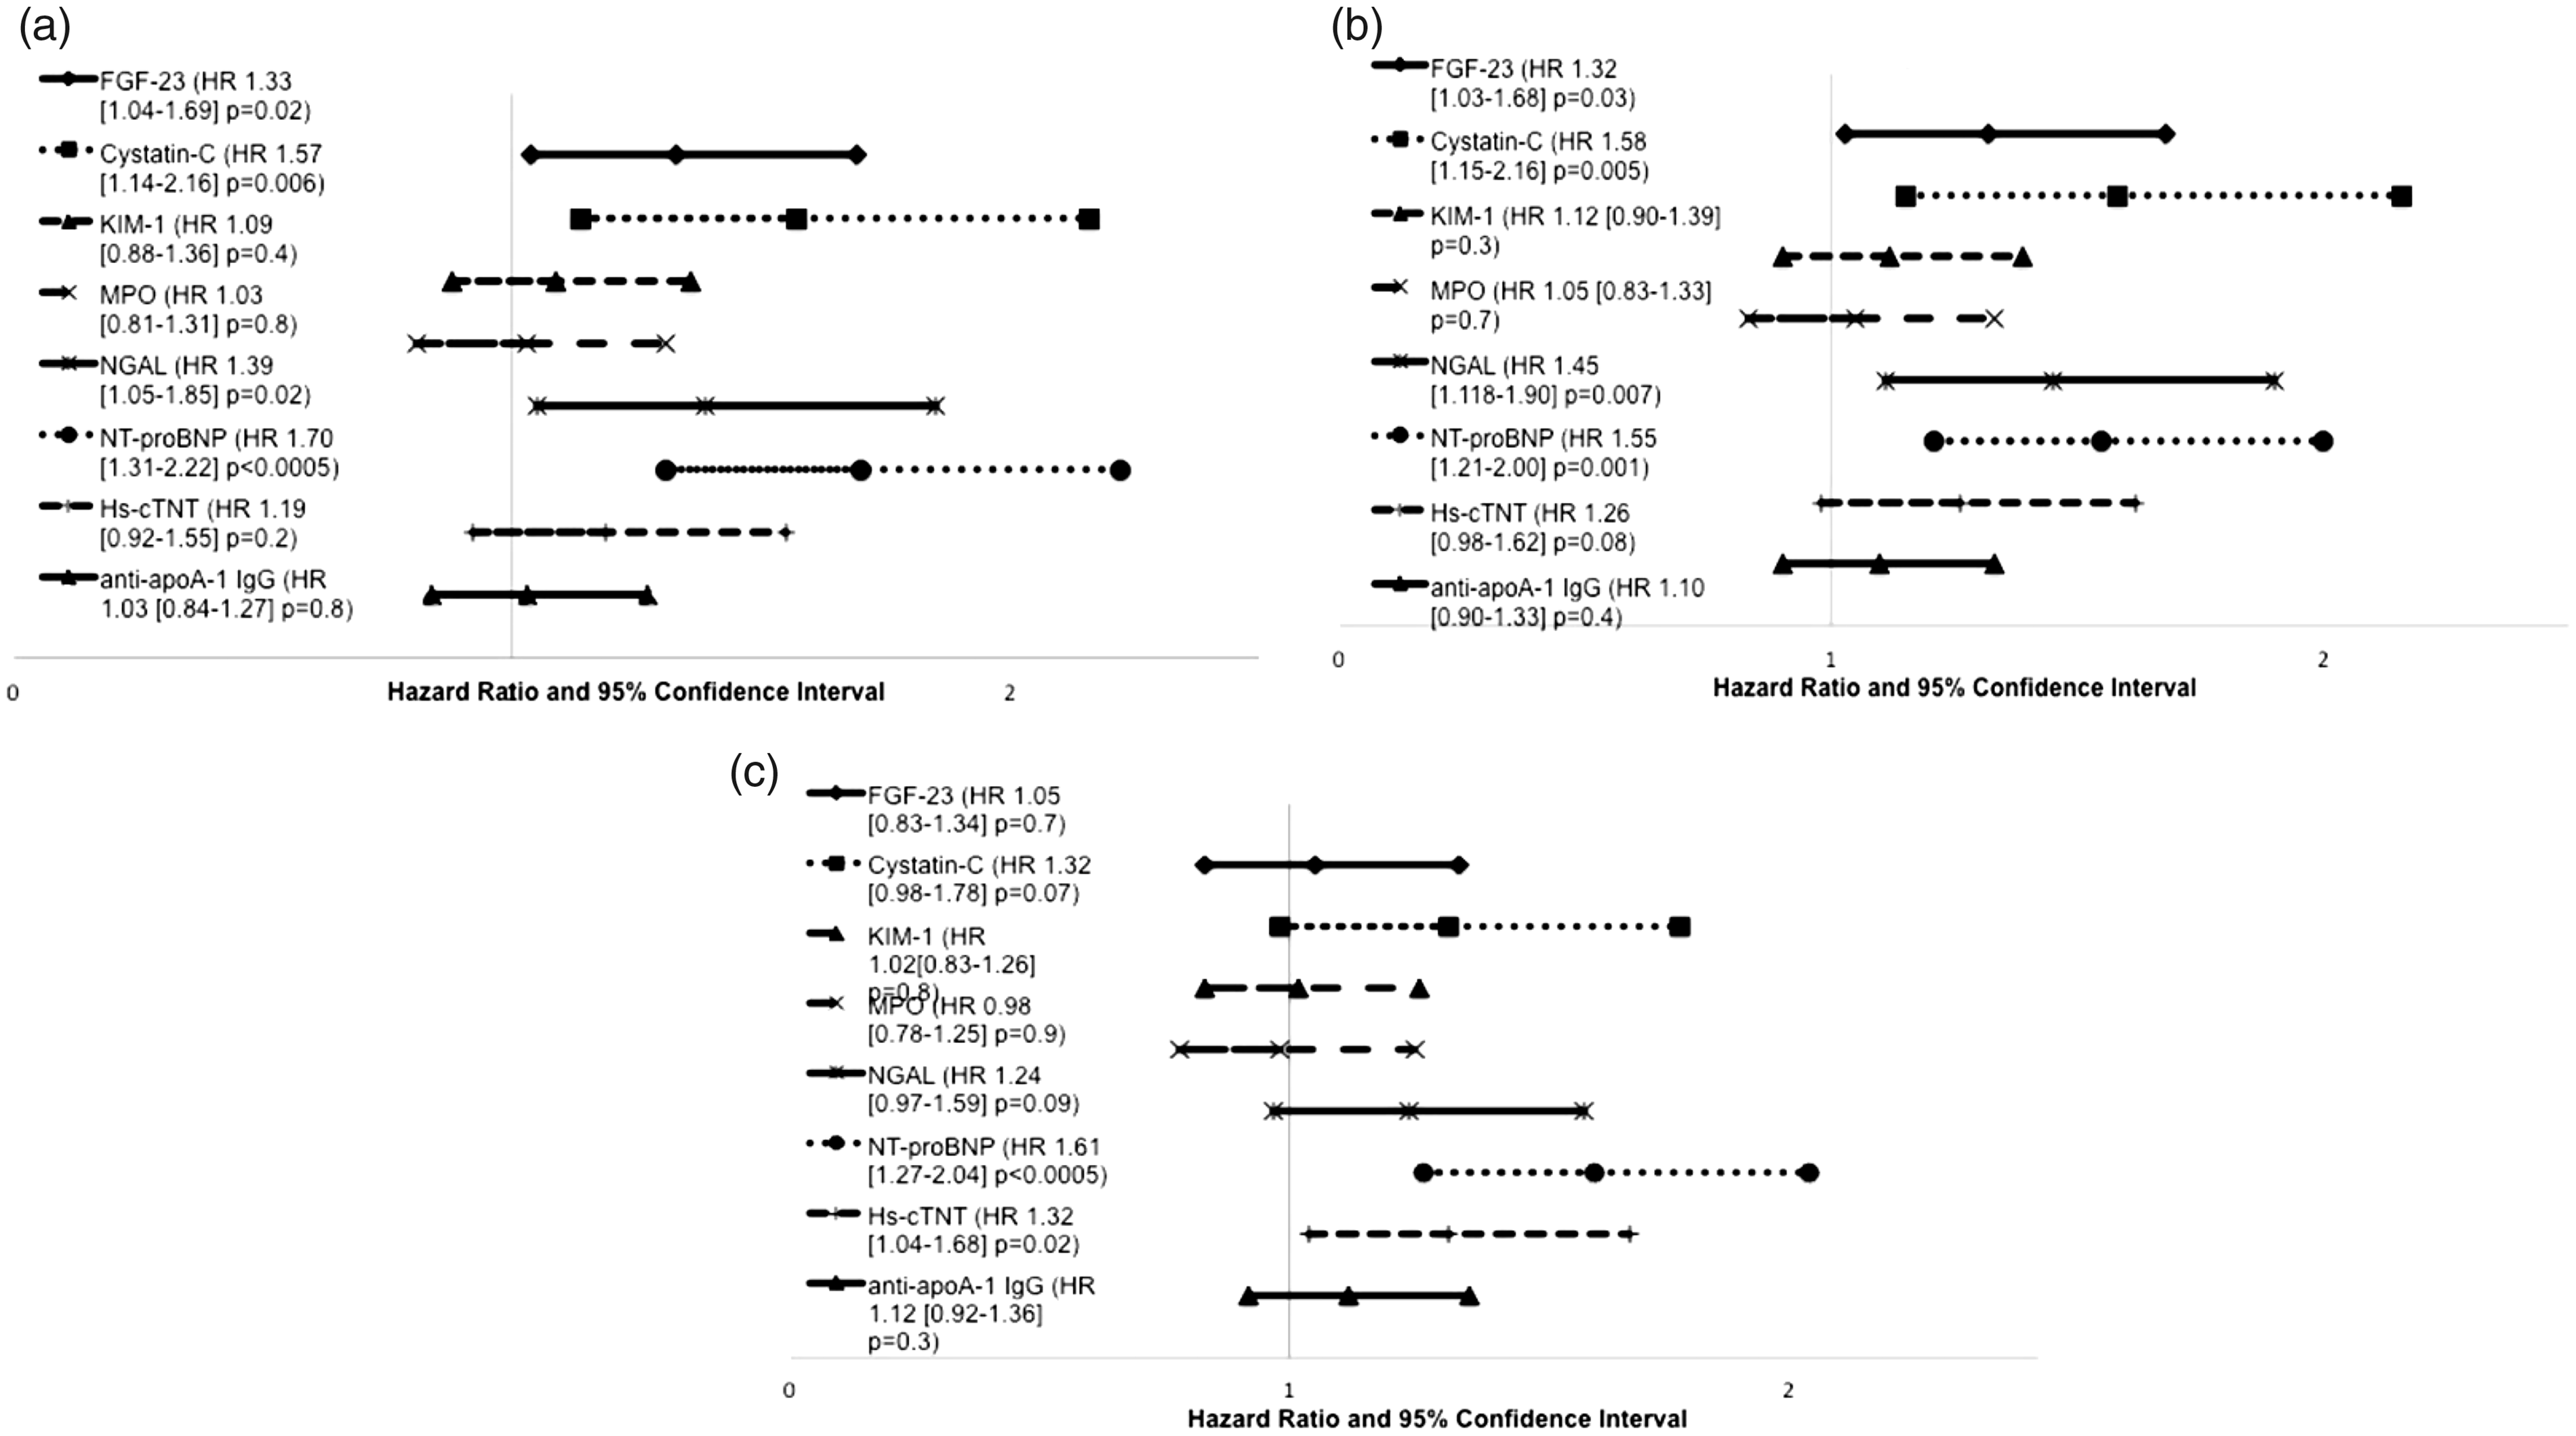
(a–c) Effect of individual biomarkers upon hazard ratio for death, progression to end-stage kidney disease (ESKD) and cardiovascular events (CVE) when added to baseline model.
Table 3 shows that the addition of all biomarkers as a panel to the base model improved model discrimination and net reclassification performance for all end-points; continuous NRI showed the strongest effect size. Despite the strong association between the NT-proBNP and the adverse events noted on multivariable analysis, this biomarker only exerted an intermediate prognostic effect on mortality when added individually to the base model (continuous NRI 0.42, 95% CI [0.03–0.8], P = 0.04). Supplementary Table 2 shows the event and non-event NRI components for the extended model composed of base model and the complete panel of biomarkers.
Model fit and overall net reclassification index for base model, the base model in combination with all biomarkers and base model with N-terminal prohormone of brain natriuretic peptide (NT-proBNP) only, for each clinical end-point.
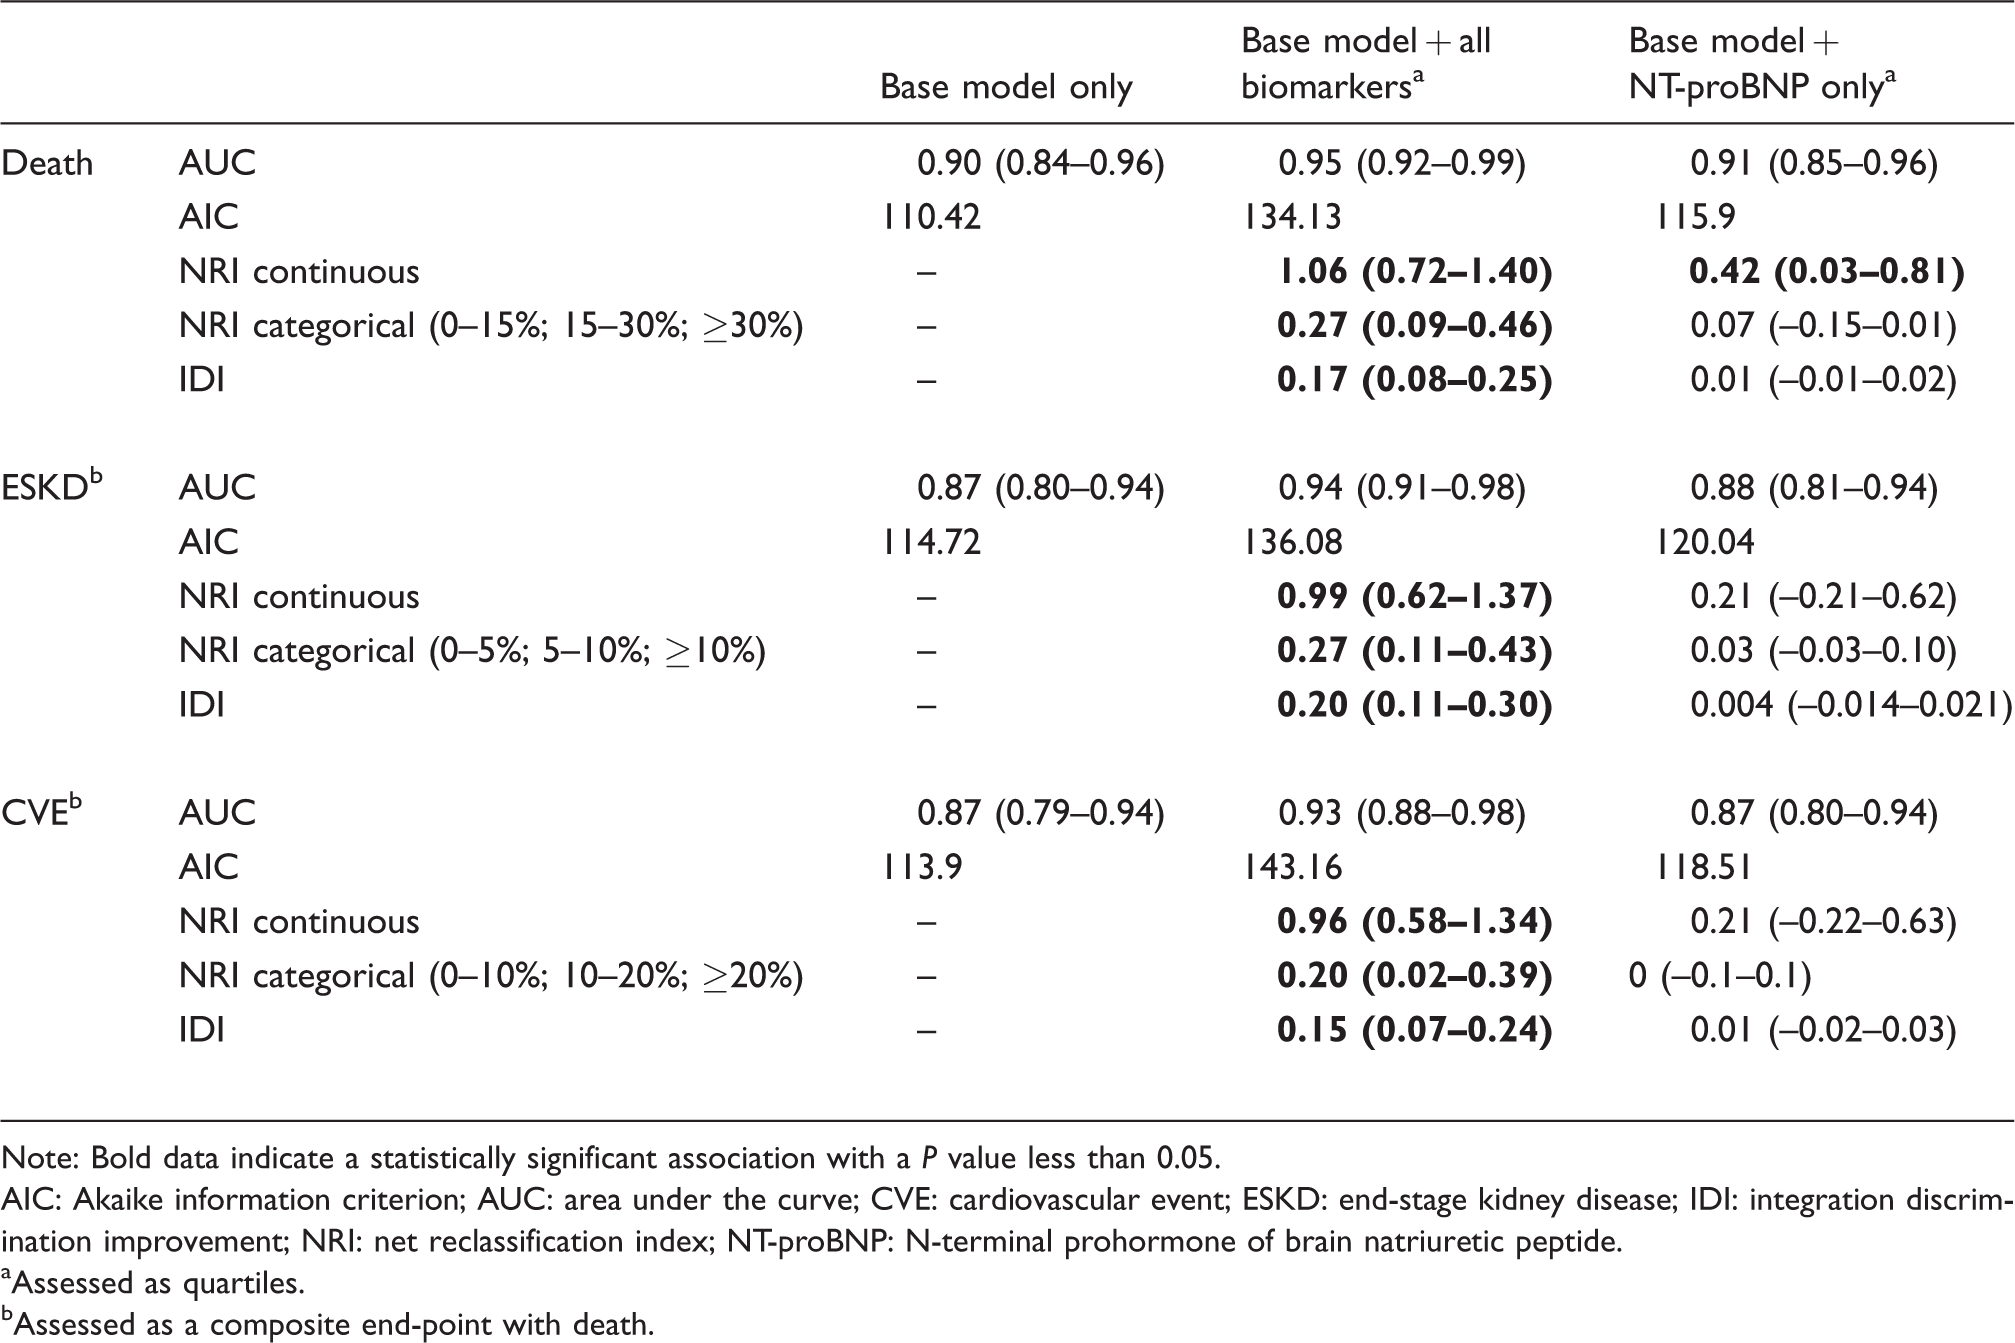
Note: Bold data indicate a statistically significant association with a P value less than 0.05.
AIC: Akaike information criterion; AUC: area under the curve; CVE: cardiovascular event; ESKD: end-stage kidney disease; IDI: integration discrimination improvement; NRI: net reclassification index; NT-proBNP: N-terminal prohormone of brain natriuretic peptide.
aAssessed as quartiles.
bAssessed as a composite end-point with death.
Figure 3(a) to (f) shows that revascularization may have a beneficial effect on time to all adverse end-points compared with medical management in patients with NT-proBNP concentration above a cut-off value of 300 ng/L33 at the time of diagnosis. This effect was not seen in patients with NT-proBNP below this cut-off level. This is despite the former patients having older age (median age 73.7 years vs. 68.8 years, P = 0.001), increased cardiovascular disease burden (CHF: 20.0% vs. 2.4%, P = 0.008), lower baseline eGFR (24.4 mL/min/1.73 m2 vs. 33.6 mL/min/1.73 m2, P = 0.002) and more severe degree of stenosis (patency score 100.0 vs. 132.5, P = 0.02) (Supplementary Table 3). Revascularization had no effect on time to clinical end-points when the study population was divided according to hs-cTNT and Cystatin C median concentrations (Supplementary Table 4).
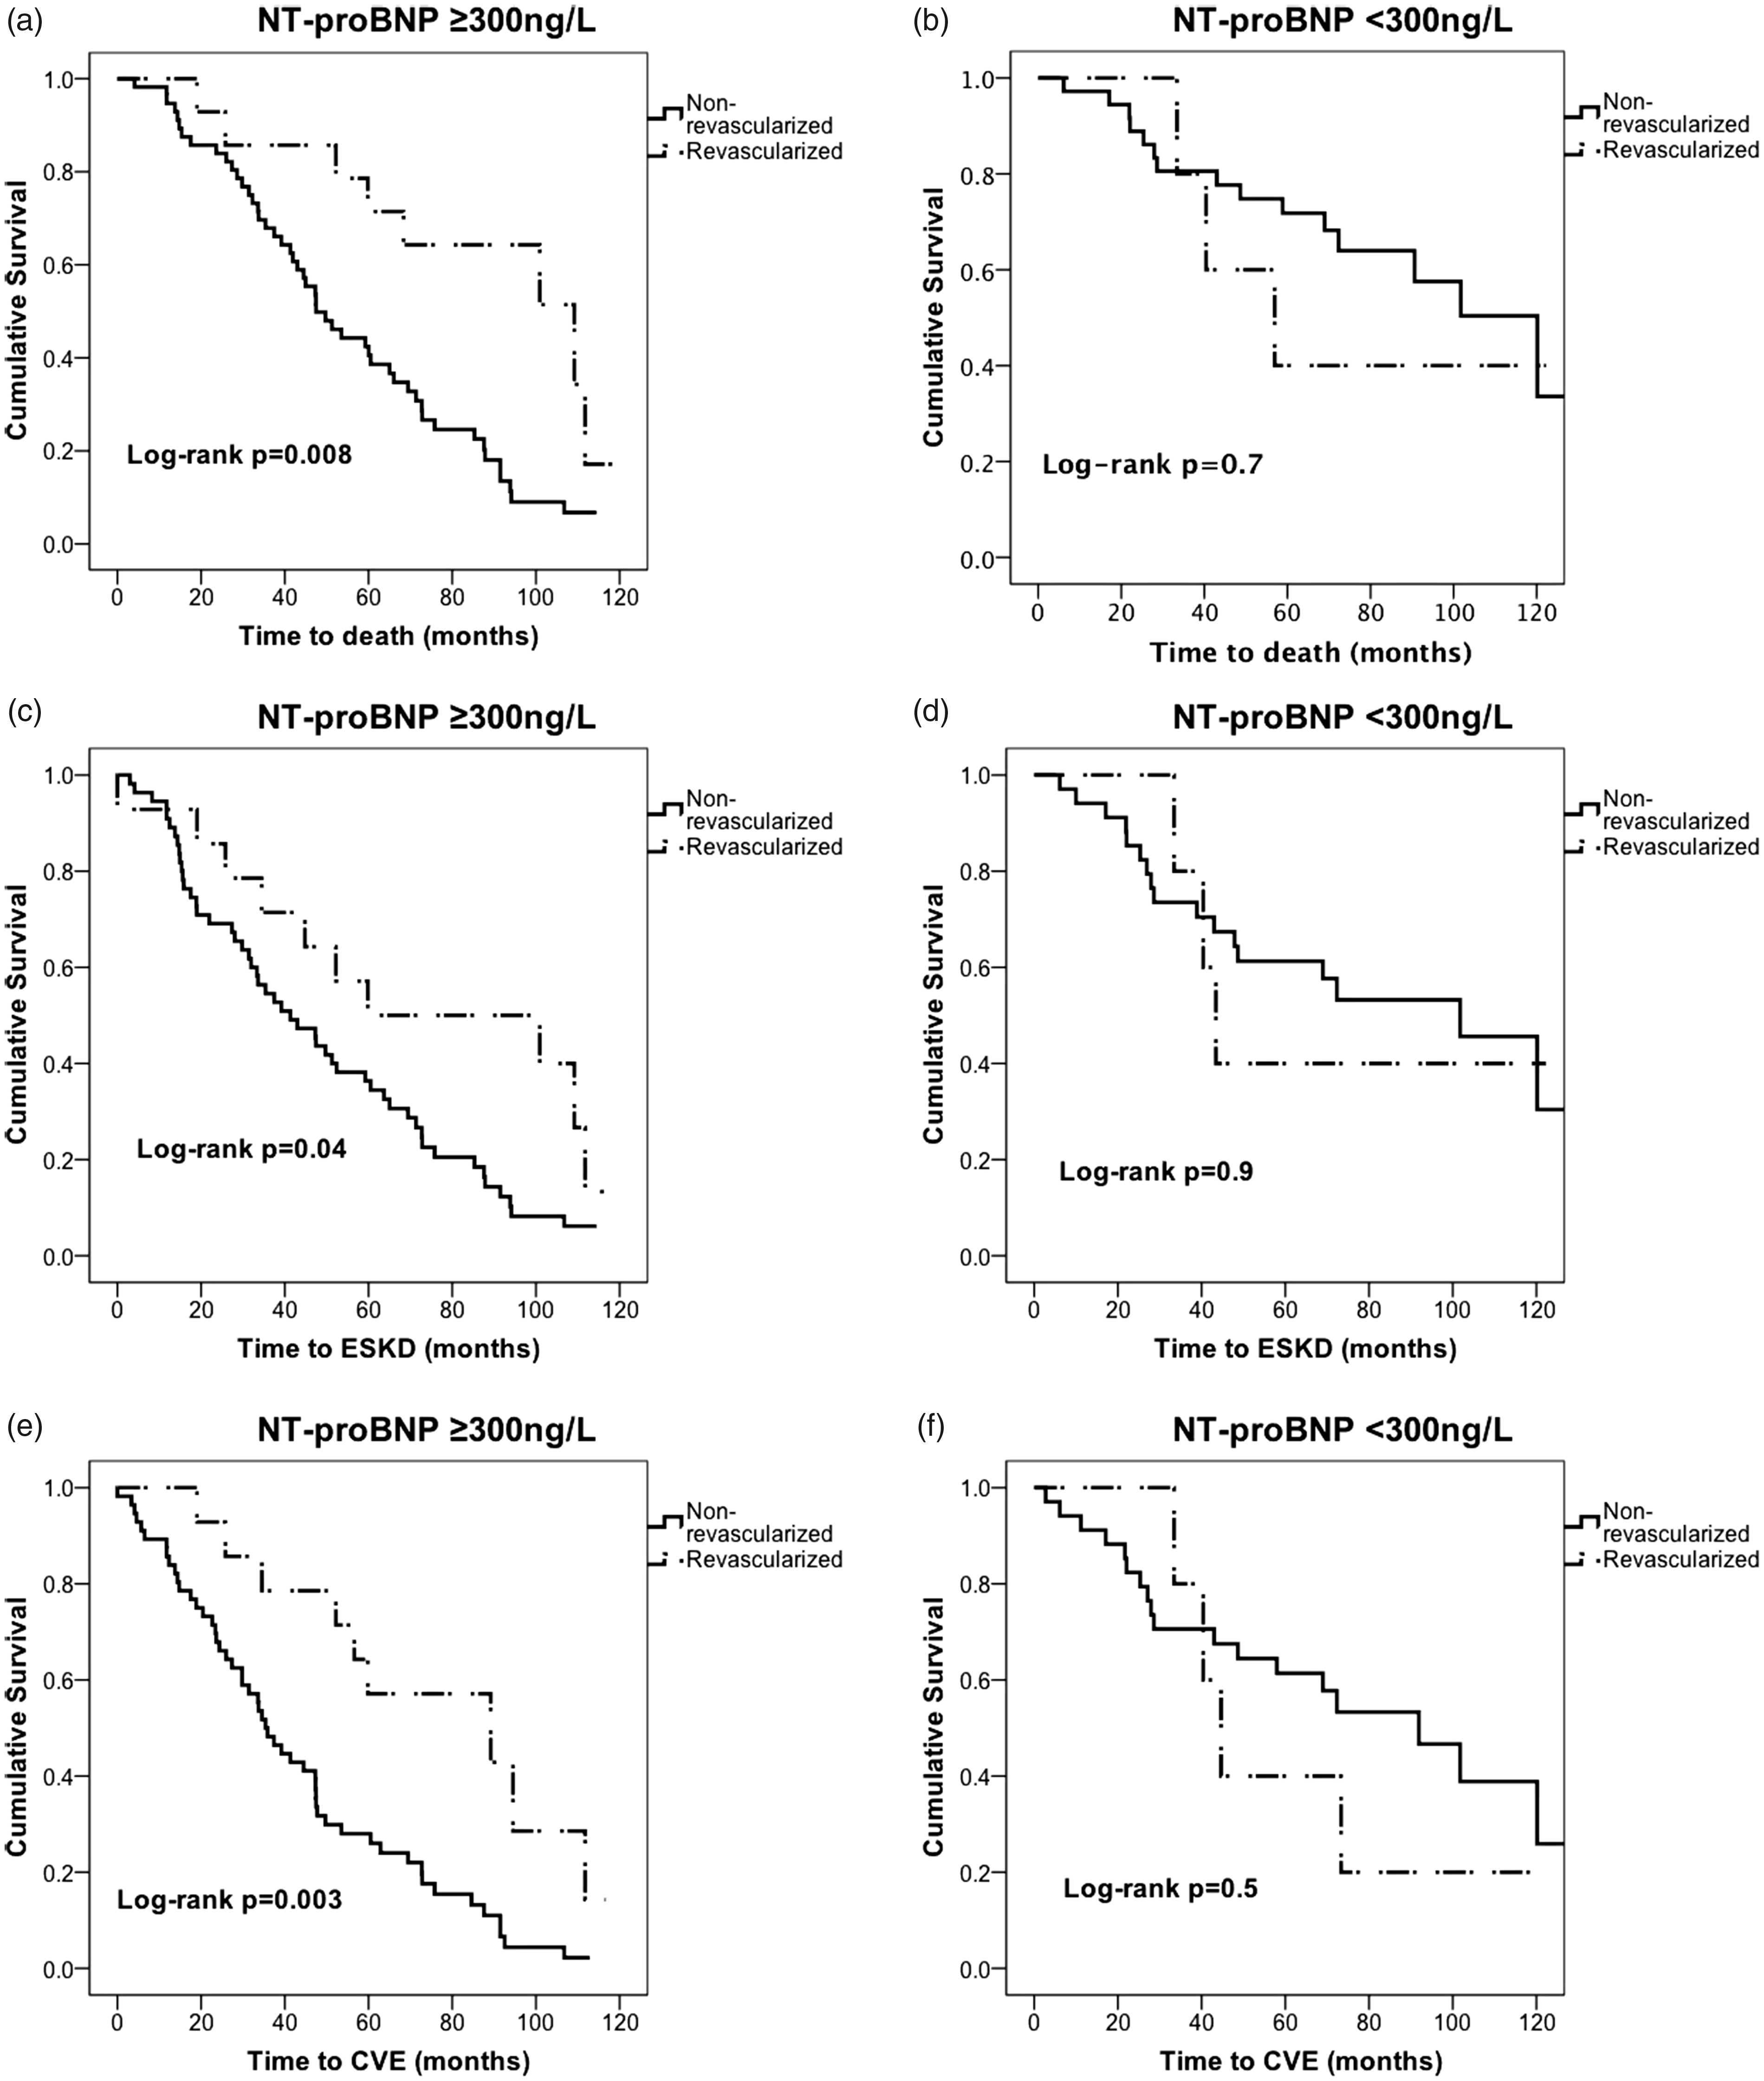
(a–f) Kaplan-Meier curves showing the effect of revascularization on death, progression to end-stage kidney disease (ESKD) and cardiovascular events (CVE) in patients with serum N-terminal prohormone of brain natriuretic peptide (NT-proBNP) concentrations above and below cut-off of 300 ng/L.
Discussion
To our knowledge, this is the first study that has analysed a diverse panel of serum biomarkers in relation to long-term outcomes in a population of patients with ARVD. Given our relatively small sample size, our findings require confirmation in larger cohorts; however, it appears that the use of an extensive panel of novel biomarkers in conjunction with more traditional risk factors can strongly improve risk prediction of adverse events. Based on the NRI tables, it seems that non-event NRI is generally larger than event NRI for all end-points. This translates into a better ability of these biomarkers in reclassifying controls into low-risk groups, than reclassifying cases into high-risk ones, thus highlighting the negative predictive value of the biomarker panel. In practice, this means that these biomarkers are more useful in excluding high-risk patients when their biomarker values are normal, rather than ruling in high-risk patients when their concentrations are abnormal, at least when considered as a panel. While NT-proBNP was the most strongly associated with increased risk for all adverse events, its value in individual incremental prediction was limited to prediction of death according to reclassification statistics. Nevertheless, Kaplan-Meier analyses performed on patient subgroups according NT-proBNP concentrations showed that patients with a NT-proBNP concentration above cut-off (≥300 ng/L) 33 significantly benefited from revascularization in relation to all adverse end-points during follow-up, whereas such benefit was not observed in patients with NT-proBNP below cut-off. Furthermore, such effect was not observed when dichotomizing patients according to other biomarker values.
These results extend the limited evidence in the literature, suggesting that BNP could help select ARVD patients for revascularization.30,34,35 In a small study of 27 patients with refractory hypertension and ≥70% RAS, there was a significant reduction in BNP concentrations postrevascularization and hypertension improved in 17 out of 22 patients (77%) with baseline BNP concentrations >80 ng/L. 34 In a similar study performed in 120 patients with confirmed haemodynamically significant RAS, revascularization in patients with a baseline BNP cut-off of >50 ng/L was associated with improved 24 h ambulatory blood pressure control at six months’ follow-up. 30 In contrast, in a third study, revascularization did not significantly affect concentrations of BNP or NT-proBNP postrevascularization, and baseline concentrations of these biomarkers did not correlate with blood pressure response postrevascularization. There was no difference in NT-proBNP concentrations between hypertensive patients with ARVD (n = 47) and those without ARVD (n = 44) at baseline, although average RAS severity is not quoted in this study, and inclusion criteria suggest that ARVD was less haemodynamically significant. 35 An earlier study published by our group also did not show any correlation between NT-proBNP concentrations and RAS severity, but patient numbers were very small. 36
Our results suggest that patients with more severe RAS may have a characteristic biomarker profile. As expected, concentrations of PTH and NT-proBNP were higher in patients with poor renal function,37,38 but they were also more elevated in those with anatomically more severe ARVD despite equivalent baseline renal function to those with less severe disease. Severe ARVD typically exists in the context of widespread vascular disease; elevated PTH concentrations represent disordered calcium and phosphate metabolism and may be a surrogate marker of reduced arterial compliance, which in turn can increase cardiac afterload, leading to left ventricular dilatation and elevated NT-proBNP concentrations. 39 Renin-angiotensin system activation can also directly lead to elevated NT-proBNP concentrations; angiotensin II can cause increased synthesis and release of BNP independent of myocardial stretch. 40
Observational evidence has consistently shown that ‘high-risk’ patients characterized by haemodynamically significant RAS, neurohormonal activation or cardiac instability are those most likely to benefit from revascularization.6,35 Despite the contradictory findings of previous studies, the present data indicate that stable ARVD patients with no overt signs of cardiac impairment but with biochemical evidence of myocardial strain warrant investigation for the presence of underlying haemodynamically significant disease with consideration for revascularization. Further risk stratification based on NT-proBNP values could allow the selection of apparently low-risk patients who could benefit from more aggressive management when compared with medical treatment alone. These findings could represent a simple way to foster precision medicine in this disease. It is nonetheless unclear whether our study findings are generalizable to the general ARVD population given the lower level of proteinuria, higher administration of statins at the time of diagnosis and lower incidence of clinical outcomes in this study population.
The small sample size may explain the lack of association between cardiovascular co-morbidities and adverse events noted in this study. The limited number of patients with CKD stage 5 may have also masked differences between groups and may partly explain why, contrary to the findings in general CKD populations, there was no significant differences in FGF-23 concentrations between successive CKD stages.14,15 Moreover, there was no difference in FGF-23 concentrations between patients with different RAS severity but similar baseline renal function; similarly, an observational study reported equivalent FGF-23 concentrations between healthy volunteers, patients with essential hypertension (EH) and those with renovascular hypertension (RVH, defined as defined as unilateral ≥60% RAS or renal artery Doppler peak systolic velocity >200 cm/s). 18 Concentrations of KIM-1 and NGAL were higher in patients with lower eGFR; again RAS severity did not influence concentrations. Systemic and renal concentrations of NGAL were, however, shown to be higher in RVH patients compared with EH patients or healthy volunteers, while KIM-1 concentrations were equally elevated in RVH and EH patients, suggesting that NGAL may be a marker of upregulated intrarenal and systemic inflammation. 17
We did not observe any significant associations between MPO and anti-apoA-1 IgG with any of the study end-points in ARVD patients despite the fact that both these molecules have been proposed to be promising markers and mediators of atherogenesis in different settings. MPO, a heme-containing enzyme produced by monocytes and neutrophils catalysing the production of a broad range of reactive oxygen species and protein carbamylation, is involved in the initiation and development of atherosclerosis by promoting oxidative stress, lipid peroxidation and HDL dysfunction. 41 In haemodialysis patients, higher serum MPO concentrations were associated with inflammation, advanced atherosclerosis and poorer prognosis,42,43 suggesting that MPO could be of relevance in ARVD too. Anti-apoA-1 IgGs have been associated with adverse cardiovascular risk factors and outcomes in different populations and were shown to represent active mediators of atherogenesis.22–26 Nevertheless, their existence and possible prognostic value in ARVD has been unexplored so far. Reasons underlying the lack of association with study end-points are still elusive but could be due either to a power issue or to the fact that these molecules may not be relevant as prognostic biomarkers in ARVD patients.
Important limitations of this study include the very small sample size that significantly limits its power and validity of results, together with its retrospective and observational nature which make it prone to selection bias and hidden confounders. The discrepancy in incidence rates between our study population and the remaining patients on the database is due to recruitment bias. Recruitment into the Salford Renovascular study started in around 1986, whereas recruitment into the CRISIS study started in 2002. Our study population consists of patients who were recruited into both CRISIS and Salford Renovascular study, so these patients may have had better clinical outcomes due to introduction of statins and overall more contemporary multitargeted medical therapy compared with the earlier pre-statin era. Another source of bias is those patients who underwent revascularization in accordance with physician preference rather than random allocation in an RCT setting.
The power calculation was limited to detection of a significant difference in NT-proBNP concentrations given that there is a paucity of similar data in the literature relating to all of the other biomarkers; thus, the study power of 86% had to be extrapolated to the other biomarkers. As discussed above, our results may not be directly applicable to all patients with ARVD, and mechanistic insights are at present unclear. To this respect, it would have been insightful to have other phenotypic CV-related data such as ankle-brachial index, pulse wave velocity or carotid intima-media thickness assessment, but these investigations were not systematically performed upon patient’s inclusion. Blood pressure was documented from office readings taken at the time of diagnosis, and baseline vitamin D concentrations were not available. Data about smoking status were also not available in the database. The arbitrary selection of NT-proBNP cut-off concentration in this study is another important limitation. The NT-proBNP cut-off concentration of <300 ng/L is highly sensitive and specific to rule out acute heart failure, whereas the rule-in cut-off values for confirmation of acute heart failure are typically age adjusted as follows: >450 ng/L for patients younger than 50 years, >900 ng/L for patients aged between 50 and 75 years, and >1800 ng/L for patients older than 75 years.33 Given that only 5.4% of patients presented with flash pulmonary oedema, the majority of patients in this study cohort can be considered as chronic ambulatory patients, and lower cut-off values are expected in these patients. We selected NT-proBNP >300 ng/L as the cut-off that is most representative of our study cohort; however, we appreciate that this reduces specificity in our study.
Another limitation of the analysis is that the log-transformed biomarker values (independent variable) did not have a perfectly linear relationship to the actual biomarker values (dependent variable) at the upper and lower limits of the assay in a regression analysis, although the overall model was sound. Linearity was assumed for all covariates, but the regression models did not account for non-linear and interaction effects of both biomarker and non-biomarker covariates. It is also important to acknowledge that in the regression models, some variables were highly correlated, and the resulting models demonstrate collinearity (e.g. CHF and NT-proBNP in Table 2). This is a common phenomenon in clinical work given that disease and clinical end-points can have interlinked risk factors and clinical measures. Although from these results we deduce that CHF does not add additional significant information to the prediction of adverse events when analysed together with NT-proBNP, we do not feel that this necessarily biases results or affects the overall fit of the model. 44 Although we were keen to use the same regression model for all end-points, the small number of events in comparison to the number of covariates included in the models limits the validity of our models and introduces the risk of over-adjustment especially with regard to CVE and ESKD end-points. Finally, given the short half-lives of the current biomarkers tested presently (NT-proBNP especially) and the study design, we were not able to assess biomarker fluctuations over time or concentrations immediately preceding clinical events. Therefore, we could not explore the possible incremental prognostic value of temporal changes vs. single time measurement to predict long-term clinical outcomes. However, we do not think that temporal profiling would have provided clinically relevant information especially in the context of biomarkers with a short half-life. Optimal time windows for repeat biomarker investigations are unclear and may be variable due to influences from renal clearance or concurrent treatment and may introduce delays in patient management.
Conclusion
Despite the limited sample size of our study, our results suggest that NT-proBNP is independently associated with an increased risk for all adverse events in ARVD patients. Novel biomarkers, especially NT-proBNP, may have an incremental risk predictive value when used in combination with traditional risk factors, but larger multicentre studies are now required to confirm that NT-proBNP measurements provide added value for risk stratification and patient selection for revascularization.
Supplemental Material
Supplemental material for Association of novel biomarkers with major clinical outcomes in a cohort of patients with atherosclerotic renovascular disease
Supplemental Material for Association of novel biomarkers with major clinical outcomes in a cohort of patients with atherosclerotic renovascular disease by Diana Vassallo, Helen Alderson, Nicolas Vuilleumier, James Ritchie, Darren Green, Sabrina Pagano, Julien Virzi, Constantina Chrysochou and Philip A Kalra in Annals of Clinical Biochemistry
Footnotes
Acknowledgements
The authors also thank Sister Beverly Lane for her assistance with data and sample collection and Dr Robert Oliver, Dr Kirk Siddals, and Mrs. Julie Hudson for assistance in relation to sample storage and transfer.
Declaration of conflicting interests
The author(s) declared no potential conflicts of interest with respect to the research, authorship, and/or publication of this article.
Funding
The author(s) disclosed receipt of the following financial support for the research, authorship, and/or publication of this article: The authors are grateful to Roche Diagnostic International Ltd (Dr Andre Ziegler) who supported the reagent costs related to NT-proBNP analyses.
Ethical approval
Ethical approval for this observational study was granted from the North West – Greater Manchester South Research Ethics Committee (REC 15/NW/0818)
Guarantor
DV.
Contributorship
DV – Study design, data collection, data analysis, primary author. HA – data analysis NV – co-author, data analysis SP and JV – laboratory analysis JR, DG and CC – co-authors PAK – study design, main editor.
References
Supplementary Material
Please find the following supplemental material available below.
For Open Access articles published under a Creative Commons License, all supplemental material carries the same license as the article it is associated with.
For non-Open Access articles published, all supplemental material carries a non-exclusive license, and permission requests for re-use of supplemental material or any part of supplemental material shall be sent directly to the copyright owner as specified in the copyright notice associated with the article.