
Abstract
Background
Fibroblast growth factor 23 (FGF23), a potent regulator of phosphate and vitamin D metabolism, is a new biomarker of kidney, bone and cardiovascular disorders. The aim of this study was to assess the biological variation of intact fibroblast growth factor 23 (iFGF23).
Methods
The within-subject (CVI) and between-subject (CVG) biological variations were assessed in 14 healthy volunteers in a six-week protocol (seven samples). Imprecision (CVA) was assessed by duplicate measurements and the EP15-A2 protocol. Intact FGF23 was measured using a fully automated chemiluminescent assay (Liaison XL, DiaSorin S.p.A., Saluggia, Italy). Two methods with different sensitivities to non-Gaussian distribution were used to estimate the CVI, SD ANOVA and CV ANOVA methods. We calculated the index of individuality (II) and reference change values.
Results
Depending on the statistical method used, the CVI and CVA were 14.2 and 3.7% (SD ANOVA) or 12.5 and 3.9% (CV ANOVA), respectively. The corresponding reference change values were 40.5 and 36.4%, respectively. The CVG was 13.4% (SD ANOVA was the only option), and the total imprecision (EP15-A2) was less than 7%.
Conclusions
The measurement of iFGF23 demonstrated a CVA less than 4% during the experimental estimation of biological variation. The total imprecision was less than 7% in the EP15-A2 experiment. The CVI values of iFGF23 in healthy persons were 14.2 (SD ANOVA) and 12.5% (CV ANOVA), respectively. The CVG was 13.4%, and the resulting index of individuality was 1.06. The reference change value was less than 41%. The availability of this automated assay for iFGF23 with well-characterized biological variation data delivers opportunities for improved availability and application of this assay clinically.
Introduction
Fibroblast growth factor 23 (FGF23) is a newly characterized biomarker with potential use mainly in nephrology, osteology and cardiology. FGF23 is a member of the fibroblast growth factor family and is mainly secreted by osteocytes in bone. 1 The receptor for FGF23 has a co-receptor called αKlotho, and the kidney–bone network is managed by the FGF23–FGF23 receptor/αKlotho pathway. The main action of FGF23 is phosphate excretion via the kidneys.
There are two circulating forms of FGF23: intact fibroblast growth factor 23 (iFGF23) (whole molecule) and the C-terminal part of FGF23 (cFGF23). Analytical methods for cFGF23 (based mostly on enzyme-linked immunosorbent assay [ELISA]) measure both the C-terminal fragment and whole-molecule FGF23 with different sensitivities.
The major interest of iFGF23 determination is the evaluation of inherited phosphate disorders. However, these disorders are extremely rare, and another field of interest of iFGF23 measurement is chronic kidney disease (CKD) with metabolic bone disorders, cardiovascular diseases and cardiorenal syndromes. Changes in the concentration of iFGF23 and cFGF23 differ because of the different pathophysiologies, half-lives, influences of diet and phosphate binders in CKD and peptide stabilities in blood samples and other factors. However, the measurement of iFGF23 reflects the bioavailability of this phosphaturic hormone and its biological effect.
Some significant papers have described preanalytics, analytical performance of available methods including iFGF23 and biological variation.2–10 The biological variation of iFGF23 and cFGF23 can differ due to both biological (molecular distinctions, different half-lives) and analytical (different specificities of detection antibodies, different detection systems) factors. Data published previously have described the biological variation of cFGF23 or iFGF23 measured by ELISA. Intact FGF23, measured using an automated platform, can enhance the clinical use of this molecule. The new assay can potentially improve the performance characteristics, and data describing the biological variation of the intact molecule will help clinicians in the diagnostic procedures and monitoring of patients.
The determination of biological variation components has also methodological aspects. Røraas et al. have described three methods to estimate the CVI. 11 The first is a standard nested ANOVA performed on the raw data; the second is ln-ANOVA with a natural logarithm transformation of the data followed by ANOVA on an ln-transformed data and back transformation and the third, the coefficient of variation (CV) ANOVA method. The CV ANOVA method uses a CV transformation (individual data are divided by individual means) and then ANOVA on these CV-transformed data. However, it is impossible to determine the CVG using CV ANOVA because each subject has a mean value close to 1. The problem of the second method is that data must be perfectly ln-normal. 11
The aim of our study was to verify the analytical performance and evaluate the biological variation of iFGF23 in healthy volunteers as measured on a fully automated chemiluminescent platform. For this purpose, we used two statistical methods to estimate the CVI with different sensitivities to non-Gaussian distribution: SD ANOVA and CV ANOVA method.
Study subjects and methods
Study subjects
Fourteen apparently healthy persons (seven men and seven women; Caucasian race) were invited to participate in a study to evaluate the biological variations of iFGF23 (CVI and CVG).
All the study subjects were aged 20–50 years (median age: 32 years; interquartile range: 28–40) and were healthy non-smokers with a common lifestyle. 12 All the study subjects met the conditions necessary for inclusion in the study, such as subjectively good health, no acute or chronic illness, no medication and no excesses in diet or lifestyle. Blood samples were taken at equidistant intervals. The study lasted for six weeks; thus, seven venous blood samples were available from every study subject.
All the participants were instructed to avoid any physical exercise for at least 24 h prior to sampling and to be in a fasting state (no food intake for at least 12 h before sampling). Complete descriptions of the health status of all subjects were available. Other laboratory tests revealed the absence of systemic inflammation during the entire experimental period: all the values of the soluble CD14 subtype (presepsin) were below the upper reference limit used in our laboratory for non-diseased subjects (320 ng/L); similarly, all the values of IL-6 were below the upper reference limit as specified by the manufacturer (7 ng/L).
Liver function tests (assessed as the serum bilirubin, alanine transaminase (ALT), aspartate transaminase (AST), gamma-glutamyl transferase (GGT) and alkaline phosphatase (ALP) concentrations, all within reference limits), nutritional status (serum albumin concentration within reference limits), renal function (serum creatinine below the respective sex-specific upper reference limit), humoral immunity (assessed by immunoglobulin determination) and parameters of iron status (assessed by soluble transferrin receptors, all values below the upper reference limits as specified by the manufacturer; 4.4 mg/L for females and 5.0 mg/L for males) were not unusual for the whole group of non-diseased subjects.
Sampling and sample preparation
The study subjects were in a sitting position for at least 5 min (but not more than 10 min) before and during sampling. Two randomly assigned phlebotomists were responsible for the sampling. Venous blood was taken between 08:00 and 10:00 a.m. on the same day of the week (Tuesday). A Vacuette system (VACUETTE® TUBE K3EDTA cat. No. 454087; Greiner Bio-One GmbH, Frickenhausen, Germany) was used together with 21-gauge needles (Greiner Bio-One GmbH, Frickenhausen, Germany). Separation of blood corpuscles was performed within 60 min after sampling at 3000g for 10 min (centrifuge Beckman Allegra; Beckman, Indianapolis, IN, USA). EDTA plasma aliquots of 500 µL were prepared within 60 min after centrifugation; CryoKing tubes were used (Biologix Group Limited, Jinan, China). The plasma aliquots were stored at –80°C before analysis for less than 12 months and were thawed only once before analysis. The samples were inspected for haemolysis, icterity and chylosity prior to storage.
Analytical methods
We used a fully automated chemiluminescent immunoassay to measure iFGF23 using a DiaSorin Liaison XL analyzer (DiaSorin S.p.A., Saluggia, Italy). The assay uses three monoclonal antibodies (against the N-terminal part of FGF23, against the C-terminal part and an isoluminol-bound antibody against fluorescein). The diagnostic kit, calibrator and control materials used to measure the intact FGF23 plasma concentrations were also DiaSorin products. The kit lot was 247005X, with a control 1 (lot 7009020) of 129.8 ng/L (range 60.0–300.0) for LIAISON XL and a control 2 (lot 7011020) of 676.1 ng/L (range 251.0–1101.0) for LIAISON XL.
Repeatability (within-run CV), as declared by the manufacturer, was <5.3% (concentration range 218–3440 ng/L); intermediate imprecisions were <10.3% (concentration range: 179–3403 ng/L). The reference range declared by the manufacturer was 23.2–95.4 (2.5–97.5 percentile), based on 910 apparently healthy European adult persons, aged 18–89 years, with an estimated glomerular filtration rate (eGFR) above 60 mL/min according to the Chronic Kidney Disease Epidemiology Collaboration (CKD-EPI) equation. The measurement range was 5–5000 ng/L. Traceability was not provided by the manufacturer. The limit of detection was 5 ng/L, and the limit of quantification was 6.5 ng/L.
All measurements were performed in duplicate in one run during one day by the same laboratory technician. All 98 study subjects’ samples were measured in random order generated by a Microsoft Excel (2010) function.
Statistical evaluation
An algorithm recommended by Braga and Panteghini 12 was used. Briefly, the first test was performed to assess the homogeneity of individual variance (the only difference was the use of the Fligner-Killeen test instead of the Cochran test, as recommended by Røraas et al.).11,13 To detect outliers among the mean values of subjects, the Reed test was used. 12 In the second step, the normality of individual data-sets and normality of mean values of subjects were assessed by the Shapiro-Wilk test. The abovementioned tests revealed sufficient normality both within-subjects and between-subjects; therefore, the necessary condition to use ANOVA was fulfilled. Two methods were used to estimate CVI: SD ANOVA, standard ANOVA performed on raw data, and CV ANOVA performed on CV transformed data.11,13 The components of biological variation (CVI and CVG) were calculated using a mixed linear regression model with R software version 3.4.0. Reference change value (RCV) and index of individuality (II) (based on the CVI and CVG, without considering the CVA) were calculated. RCV was calculated by the formula 21/2 × 1.96 × (CVA 2 + CVI 2 )1/2 with the assumption of two-tailed probability. We added the calculation of the lognormal RCV for decreases and lognormal RCV for increases according to Fokkema et al. 14 Sex differences in iFGF23 were tested by the Harris-Boyd test. Precision was also assessed using the protocol EP15-A2 (five days, measurement in triplicates).
Results
Using the raw data, the Fligner-Killeen test detected two outliers of 14 subjects (S5 and S9). After CV transformation of the individual data, only one person (S9) was classified as an outlier. These subjects were not involved in the final calculation of the biological variation components. Figure 1 displays the medians and non-parametric percentiles 2.5–97.5. No statistically significant differences were found in the iFGF23 concentrations between men (S1–S7) and women (S8–S14). The concentrations of iFGF23 were within the reference interval (23.2–95.4 ng/L) except for those in subject S5 (values of 98.0 and 105.5 ng/L). The highest concentration in women was 93.0 ng/L.
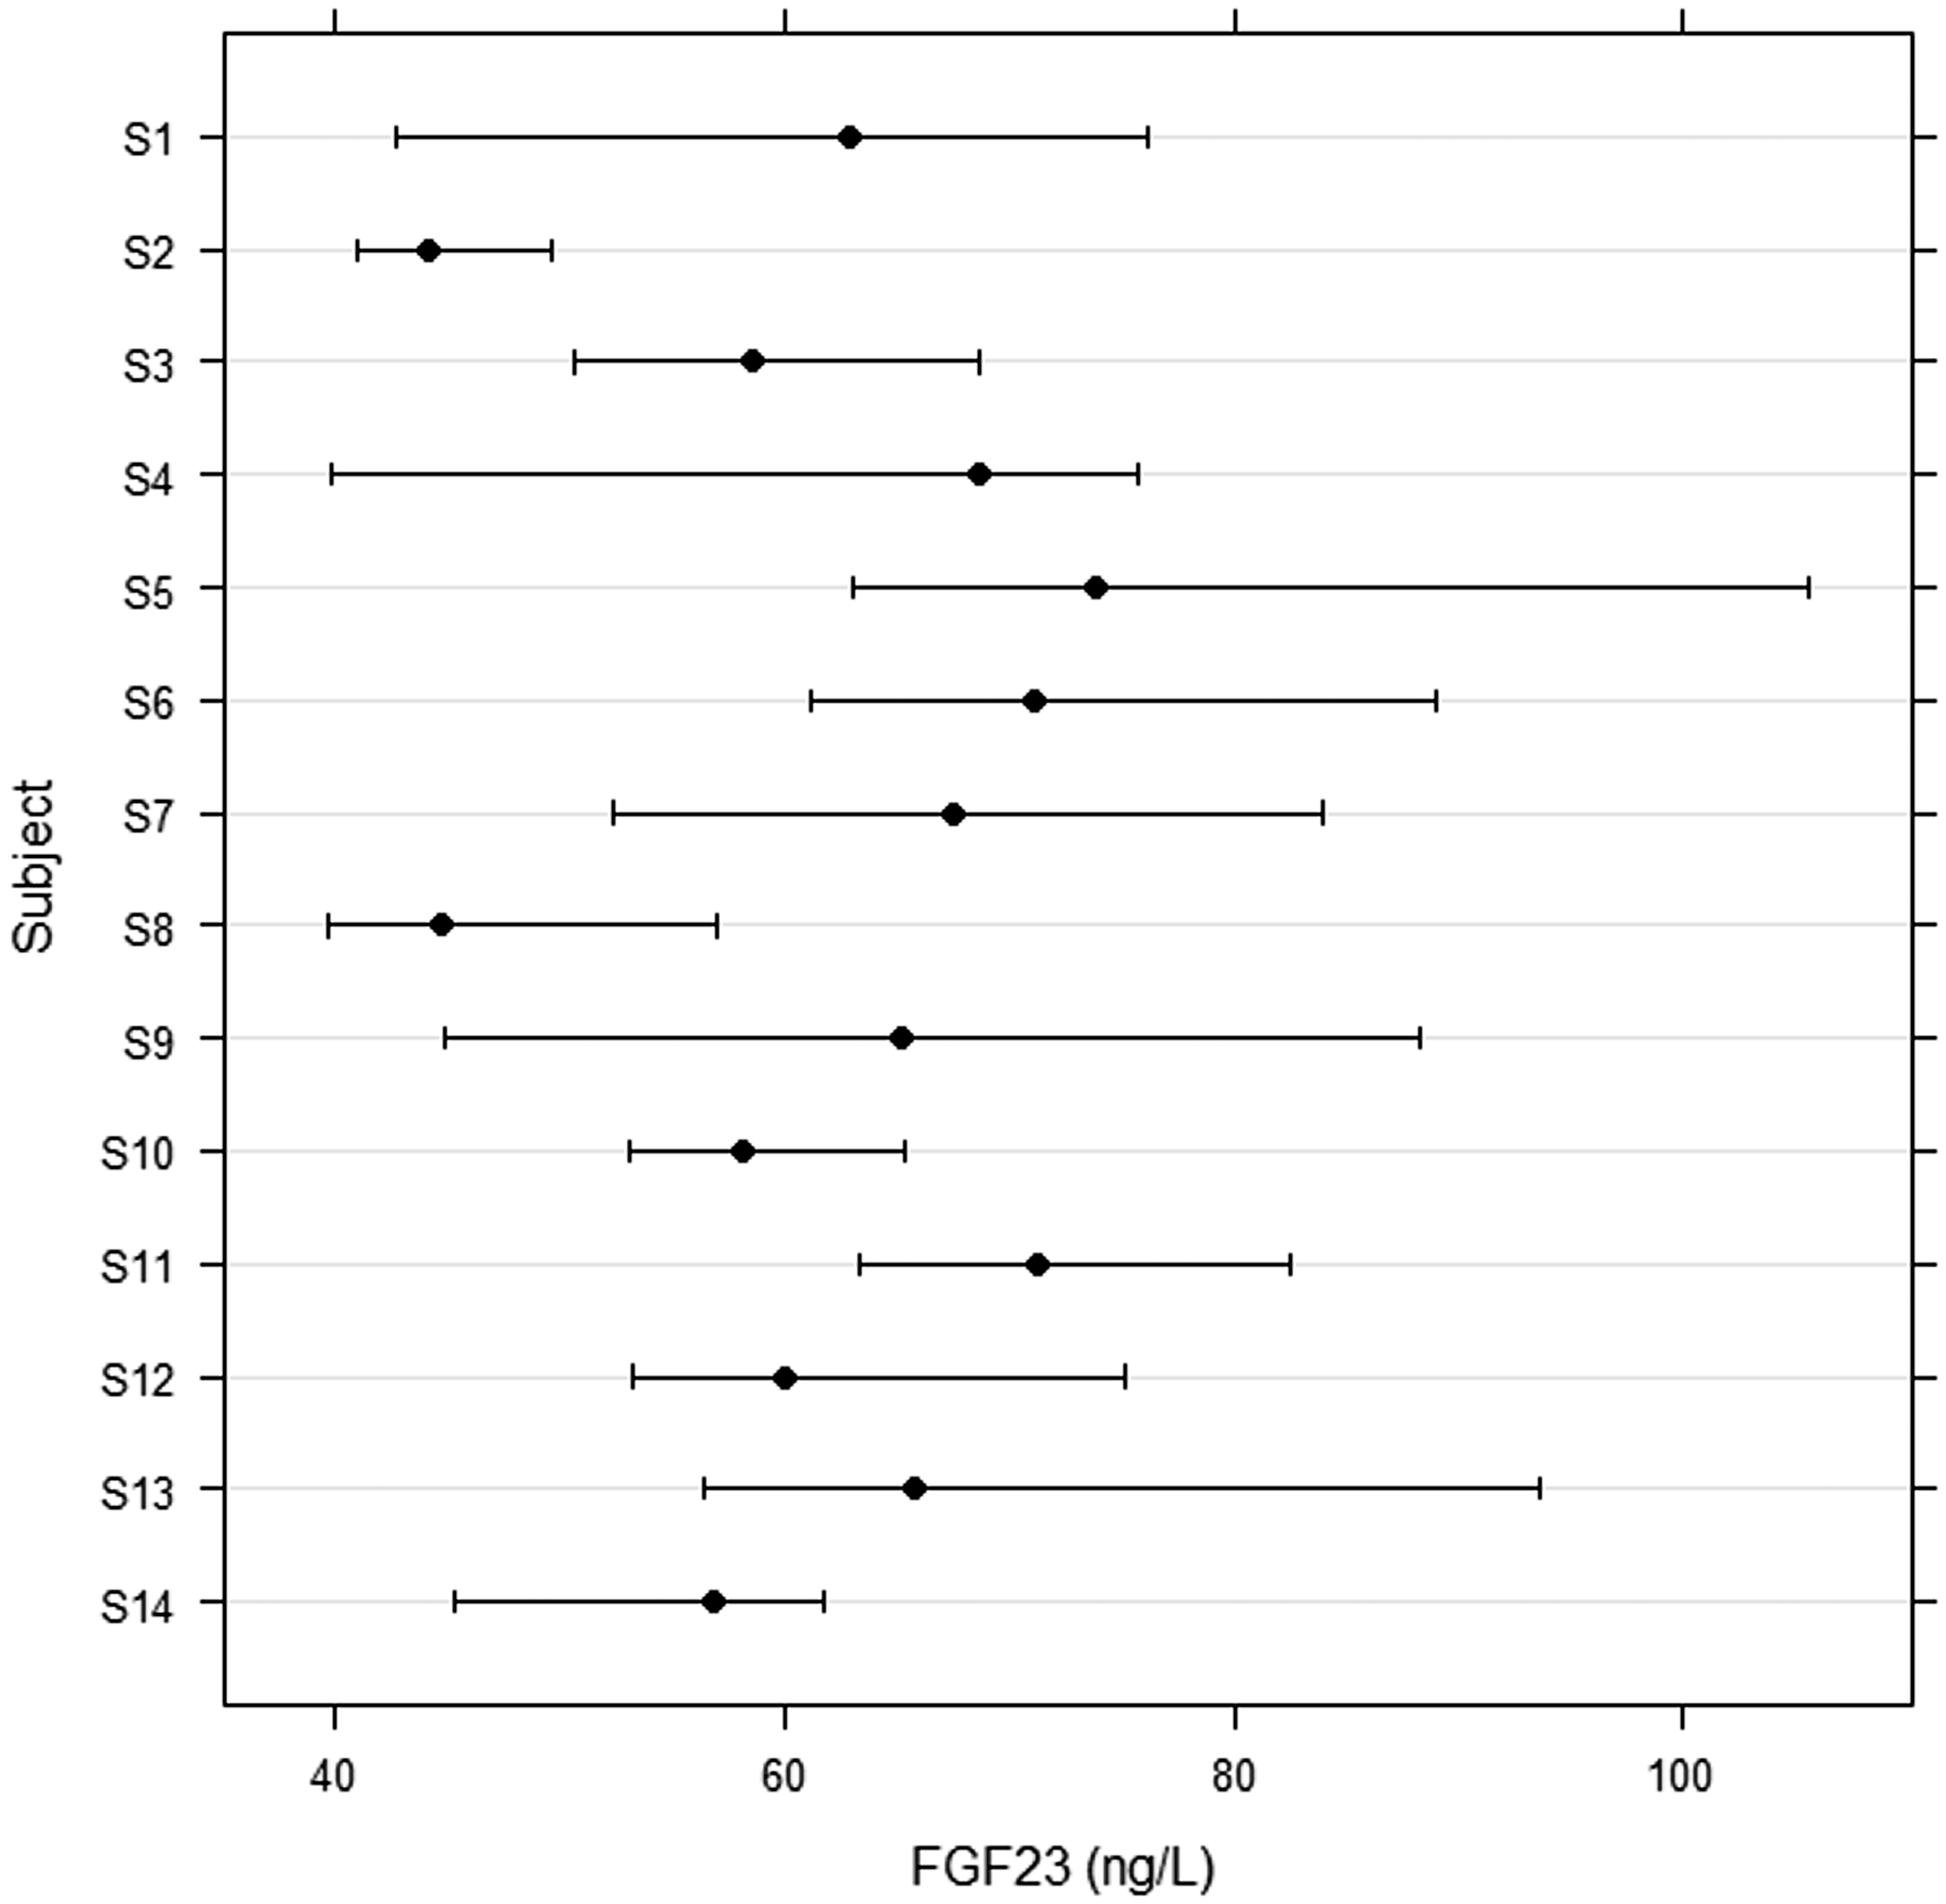
Biological variation of intact FGF23 in 14 healthy volunteers: six-week experiment, seven samples per person (S1–S7 men, S8–S14 women); medians and non-parametric percentiles 2.5–97.5.
The measurement in duplicates enabled both the calculation of the CVA and estimate of power of the study. The results of the biological variation are given in Table 1. Both methods to estimate the biological variation components revealed similar values of CVA, CVI and RCV, respectively: 3.7, 14.2 and 40.5% (SD ANOVA) and 3.9, 12.5 and 36.4% (CV ANOVA). Confidence intervals were given for the means, CVA, CVI and CVG. The CVG was calculated only using the SD ANOVA method, and the resulting value of 13.4% produced an II of 1.06. RCV minus and RCV plus were almost symmetrical around RCV, thus confirming the results of the Shapiro-Wilk test of normality.
Comparison of the two methods to estimate the biological variation of intact FGF23: CV ANOVA and SD ANOVA.
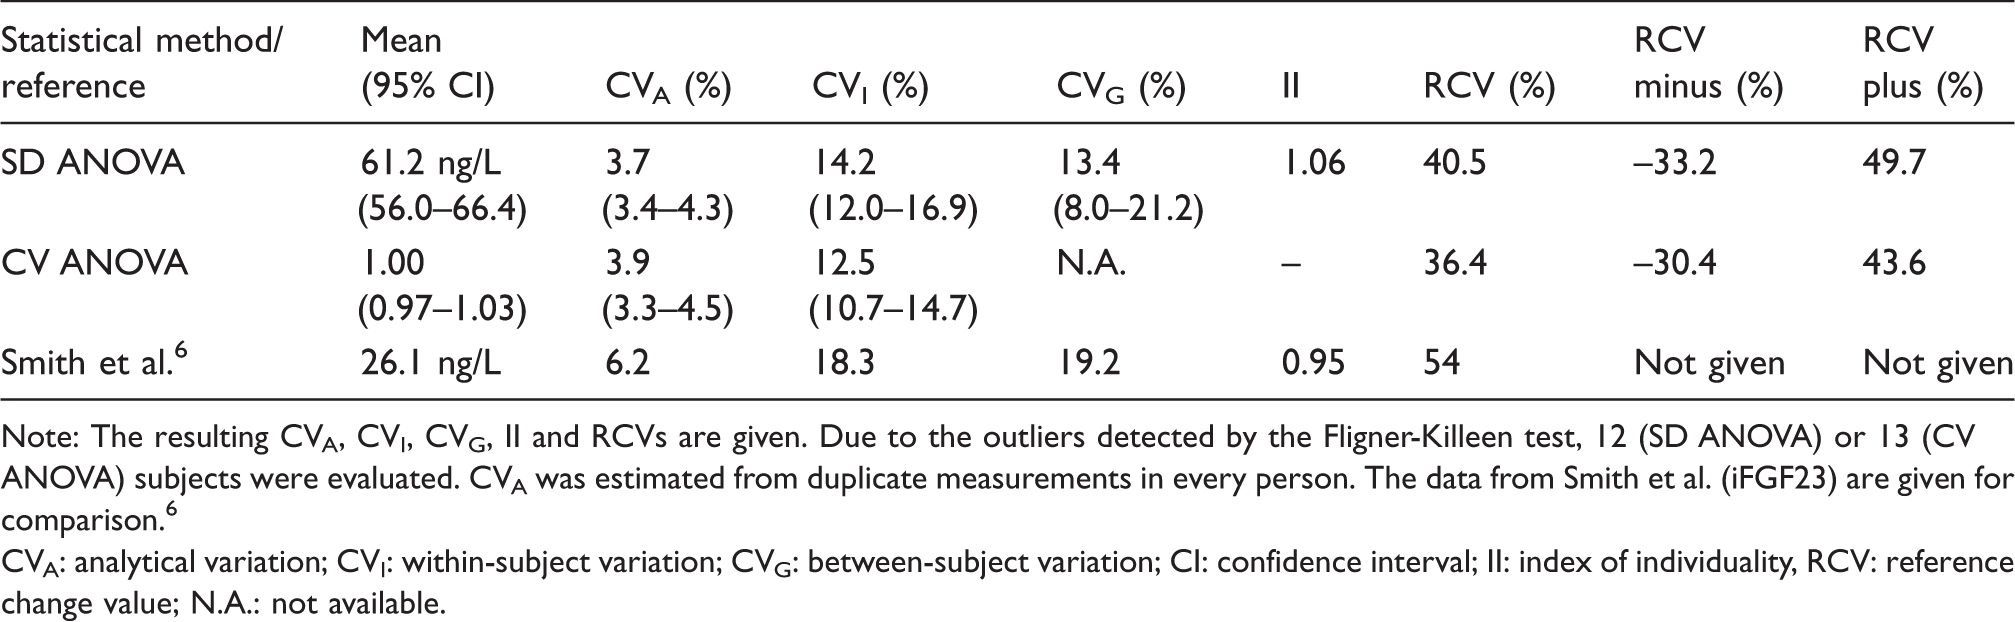
Note: The resulting CVA, CVI, CVG, II and RCVs are given. Due to the outliers detected by the Fligner-Killeen test, 12 (SD ANOVA) or 13 (CV ANOVA) subjects were evaluated. CVA was estimated from duplicate measurements in every person. The data from Smith et al. (iFGF23) are given for comparison. 6
CVA: analytical variation; CVI: within-subject variation; CVG: between-subject variation; CI: confidence interval; II: index of individuality, RCV: reference change value; N.A.: not available.
In the precision study according to the protocol EP15-A2, DiaSorin controls (level 1 and level 2, 129.8 ng/L and 676.1 ng/L, respectively, as declared by the manufacturer) were used. The resulting imprecision values were 5.18% (level 1, mean 106.0 ng/L) and 4.38% (level 2, mean 701.4 ng/L); the total imprecision values were 6.85% (level 1) and 4.20% (level 2).
Discussion
We evaluated the biological variation of iFGF23 measured on an automated platform in a group of 14 healthy subjects in a six-week experiment. We used two statistical methods with different sensitivities to non-Gaussian distribution of values – SD ANOVA and CV ANOVA. We revealed the power of the study to be almost close to 1.0. As the ratio between the CVA and CVI was sufficiently low, we measured in duplicates; there were seven samples per subject and 14 experimental subjects. 15 Moreover, the study was fully BIVAC compliant. 16
We used two methods to estimate the biological variation components: SD ANOVA and CV ANOVA. The results of the CVI were comparable (14.2 vs. 12.5%, Table 1). Comparison of our data with those published previously is difficult because different authors assessed biological variation in different populations, and different experimental designs and different analytical methods were used. Isakova et al. described changes in iFGF23 (ELISA), serum phosphate and other compounds after standardized meals in healthy controls and patients with CKD (stage G3a-G4) in a 4-h experiment. She concluded that iFGF23 was likely not involved in the acute regulation of serum phosphate both in patients and healthy controls. 7 In another experiment, the CVG of cFGF23 in CKD patients (stage G3a-G4) was higher than that in healthy control subjects. However, only small fluctuations of cFGF23 were found during this 16-h experiment. 8 Blau et al. recently described circadian rhythm and an early increase in FGF23 in response to the administration of canagliflozin, an SGLT2 inhibitor with a phosphate-retention effect. 9 Longer experiments on biological variation were published by Smith et al. (six-week experiment, healthy subjects) and Cavalier (six-week experiment, haemodialysis patients).6,10 Smith et al. used the ELISA Immutopics iFGF23 method with a CVA of 6.2%, CVI of 18.3% and a resulting RCV of 54% (Table 1). 6 However, with the ELISA Immutopics method for cFGF23, he found a CVA of 3.6%, CVI of 8.3% and resulting RCV of 25%. 6 Cavalier et al. published a CVA of 3.5% (cFGF23, Immutopics), CVI of 17.2% and RCV of 48% in a group of haemodialysis patients. 10 This highlights the difficulties in the transferability of biological variation components among different methods and possibly different populations.
Analytical quality specifications are hierarchized into several levels.17,18 Notably, biological variation data represent an important tool for setting requirements on analytical performance. The CVA of this new automated method was found to be less than 3.9% and meets the goal for CVA based on CVI.
Similarly, Souberbielle et al. found repeatability less than 2.9%. 4 Slightly higher values of CVA were found in our experiment based on the EP15-A2 protocol. We found total precision values of 6.9% (level 1) and 4.2% (level 2), which are similar to 6.4% reported by Souberbille as the reproducibility (inter-assay imprecision) of DiaSorin iFGF23. Similarly, Helden described an intermediate imprecision of iFGF23 (DiaSorin) of 5.8–7.1%, lower than that of ELISA iFGF23 (6.9 and 19.2%). 3
The RCV describes a statistically significant change in two consecutive measurements. CVI is the main component of RCV, together with CVA. Many components of human plasma have a non-Gaussian distribution; therefore, it is advisable to separately calculate RCVs in clinical situations where the concentration decreases or increases. These variables are called RCV– and RCV+. We found RCVs of 36.4 and 40.5%, depending on the statistical method that was used. Our RCVs– (–30.4 and –33.2%) and RCVs+ (43.6 and 49.7%) were almost symmetrical around RCV. In other words, if the iFGF23 concentration changes to about half of the previous value, the change is significant. A comparison of RCVs is given in Table 1.
The II is a ratio between CVI and CVG. If the II is in the range of 0.6–1.4, the reference ranges are of limited value and should be used with care. In our experiment (Table 1), we calculated an II of 1.06; similarly, an II of 0.95 was found by Smith et al. 6 The reference interval, as specified by the DiaSorin company, was 23.2–95.4 ng/L. An almost identical interval (22.7–93.1 ng/L) was published by Souberbielle et al. 4 In our cohort, only two values of 98 individual samples (mean from the duplicate measurement of plasma iFGF23 in one person) exceeded the 97.5 percentile. The median of all values was 62.8 ng/L without a significant difference between men and women (Figure 1). As shown in Figure 1, an individual result falling within the conventional population-based reference interval would be highly unusual for this individual but not unusual for the population. That result may carry some clinical significance for the individual in question.
Other factors
Other biological factors influence the concentrations of FGF23. These are circadian rhythm (with a peak in the morning), a diet rich in phosphate and calcium, iron deficiency, sex and age and possibly others.5,7–9,19–21 It is also important to use a suitable blood sample; only EDTA plasma should be used because the concentrations in serum are more than two times lower than those in plasma. 4 Thus, more data describing reference limits and cut-off values in defined populations and specific clinical situations are needed.
Conclusions
The measurement of iFGF23 (chemiluminescent automated platform) exhibited an imprecision of less than 4% during the experimental estimation of biological variation; the total imprecision was less than 7% in the EP15-A2 experiment. The CVI values of iFGF23 in healthy persons, as calculated by two statistical methods, were 14.2 (SD ANOVA) and 12.5% (CV ANOVA). The CVG was 13.4%. The similarity of CVI and CVG was quantitatively expressed by the II of 1.06. The RCV was below 41%, lower than that reported previously. However, the transferability of our results to clinical practice should be verified in diseased populations. The availability of this automated assay for iFGF23 with well-characterized biological variation data delivers opportunities for improved availability and valid application of this assay clinically.
Footnotes
Acknowledgements
We would like to thank Martina Matoušková and Štěpánka Strnadová for their technical assistance.
Declaration of conflicting interests
The author(s) declared no potential conflicts of interest with respect to the research, authorship, and/or publication of this article.
Funding
The author(s) received no financial support for the research, authorship, or publication of this article.
Ethical approval
The study protocol conforms to the ethical guidelines of the 1975 Declaration of Helsinki as reflected in a priori approval by the IKEM Ethics Committee. All subjects signed an informed consent form.
Guarantor
AJ.
Contributorship
AJ and JF were involved in the conception, protocol development, drafting of the manuscript and preparation of the final version. ZK was involved in protocol development, analysed the data and performed statistical evaluation. JK, TV and JV provided laboratory measurements and data processing. All of the authors reviewed and edited the manuscript and approved the final version of the manuscript.