
Abstract
Background
Equations to estimate glomerular filtration rate based on serum creatinine are commonly used in cancer patients to assess renal function. However, there is uncertainty regarding which equation is most appropriate for this population and the impact of different creatinine assays.
Methods
Measured isotopic glomerular filtration rate results from 120 oncology patients were used to evaluate and compare all four versions of the Wright equation, Cockcroft and Gault, Modification of Diet in Renal Disease (MDRD), Chronic Kidney Disease Epidemiology Collaboration and the Janowitz and Williams formula; using eight different creatinine assays (five Jaffe, three enzymatic).
Results
The enzymatic version of the Wright equation without creatine kinase performed better than the other versions for all eight creatinine assays. However, MDRD and Janowitz and Williams gave the best overall performance in this patient population. Performance was highly dependent on the creatinine assay used, for example, the percentage of results within 30% of the isotopic glomerular filtration rate (P30) ranged from 90.8% to 60.8% for MDRD.
Conclusion
The performance of any equation to estimate glomerular filtration rate is highly dependent on the creatinine assay used. Oncology units should assess the performance of glomerular filtration rate equations using their laboratory creatinine assay to determine whether they can be used safely and effectively in cancer patients.
Keywords
Background
The assessment of glomerular filtration rate (GFR) is frequently required in the treatment and monitoring of cancer patients. Indications include assessing renal function before and during nephrotoxic drug therapy, calculating optimal chemotherapy doses and monitoring patients participating in clinical trials.1–3 In clinical practice, GFR is most accurately measured using isotopic filtration markers such as 99mTc-DTPA or 51Cr-EDTA. 4 However, equations to estimate GFR based on serum creatinine offer a more convenient, cheaper and less time-consuming method to assess renal function and are therefore more commonly used. There is still uncertainty regarding which equation should be used in oncology though and whether the accuracy is sufficient for the safe and effective management of cancer patients.3,5–8
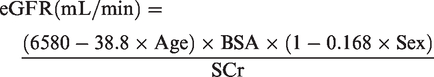
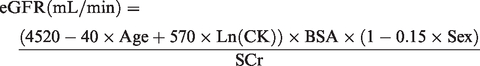
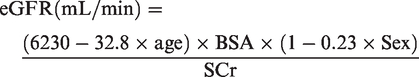
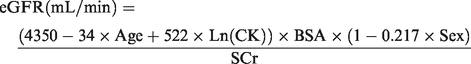
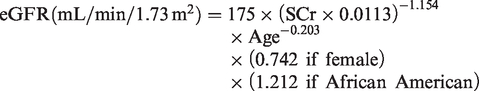
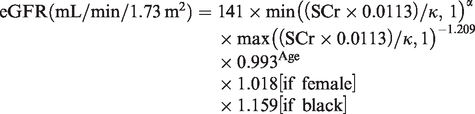
Equations which have been evaluated and recommended for the assessment of renal function include Cockcroft and Gault (CG) estimation of creatinine clearance (eCrCl) 9 and the estimated glomerular filtration rate (eGFR) equations MDRD (Modification of Diet in Renal Disease), 10 CKD-EPI (Chronic Kidney Disease Epidemiology Collaboration) 11 and Wright. 12 Of all these equations, only Wright was derived in cancer patients, and in 2010, the British Oncology Pharmacy Association recommended the use of the Wright formula to calculate eGFR in patients receiving carboplatin or cisplatin therapy. There are four versions of the Wright equation to allow for the use of different creatinine methods (Jaffe or enzymatic) and the optional inclusion of creatine kinase (CK). 12 Most recently, a new model formula for eGFR has been proposed by Janowitz and Williams (JW) based on data from a large cohort of patients with cancer. 13
Tertiary oncology units may consider using creatinine results from referring hospitals to assess renal function in order to avoid the inconvenience and delay of re-bleeding patients and awaiting analysis. However, referring hospitals may use different creatinine assays which do not measure creatinine by the same method or manufacturer. This can lead to variation in creatinine results, which may have implications for the interpretation and accuracy of any eCrCl or eGFR equation used in this scenario. The aim of this study was to use measured isotopic GFR (mGFR) results from oncology patients to evaluate and compare eGFR equations using eight different creatinine assays (five Jaffe, three enzymatic) in operation at hospitals within a regional oncology service. All four versions of the Wright equation were assessed and the version that gave the best performance was further compared to CG, MDRD, CKD-EPI and JW to determine which equation would provide the most accurate estimate of renal function for a tertiary oncology unit.
Materials and methods
Leeds Teaching Hospitals Trust approved this study as a service evaluation project and therefore ethical approval was not required. Written informed consent was obtained from all participating patients.
Patient selection
Consecutive adult (>18 years) oncology patients attending St. James’s Hospital Nuclear Medicine Department for isotopic GFR measurement (mGFR) between January and April 2012 were invited to participate. A total of 120 patients with a diverse range of malignancies were recruited.
Isotopic mGFR
A bolus injection of ∼10MBq 99mTc-DTPA radioisotope tracer (TechneScan DTPA; Covidien, Petten, Holland) was administered peripherally and two blood samples were taken at 120 and 240 min after injection. Samples were centrifuged and plasma counted for 20 min using a Wallac 1470–10 Wizard gamma counter (Perkin Elmer, Turku, Finland), to achieve a counting precision of better than 1%. Standard solutions and water samples were used for decay and background correction. The GFR was calculated using the slope-intercept method with correction made for the single pool approximation using the variant of the Brochner-Mortensen correction, as recommended by the British Nuclear Medicine Society (BNMS). 14 For the purposes of this study, the GFR was not corrected for body surface area (BSA) and was reported in mL/min.
Serum creatinine analysis
Immediately before the mGFR procedure, an additional 8 mL blood sample was collected into serum-separating tubes (Vacuette, Greiner Bio-one Ltd, Gloucestershire, UK) for serum creatinine analysis. Samples were treated as routine patient samples within the laboratory with typically 2–4 h delay before being centrifuged at 2000 × g for 10 min at room temperature, and then the serum was separated into eight aliquots. The first aliquot was analysed for creatinine and CK at the host laboratory before being frozen with the remaining seven aliquots at –20°C for up to five days. Frozen aliquots were sent on dry ice to be received the same day at all participating laboratories where they were subsequently defrosted and analysed. The results for the host laboratory were compared to the first ‘prefreezing’ analysis to ensure the results were consistent before and after the freeze–thaw cycle. All results were within the CV of the creatinine assay (2.5% at 63 μmol/L).
Laboratory methods and manufacturers
An aliquot of each patient sample was analysed by eight assays in seven different laboratories (one laboratory analysed the same aliquot by both Jaffe and enzymatic methods). All the laboratories were CPA accredited, and analysis was performed by HCPC registered staff. According to the laboratories, all creatinine assays were performing satisfactorily at the time of analysis as assessed by internal quality control procedures and external quality assurance schemes. All the creatinine assays used calibrators traceable to an isotope dilution mass spectrometry (IDMS) reference method using the National Institutes of Standards and Technology Standard Reference Material 967. Details of the assay method, manufacturer and analyser were as follows: 1J – Traditional Jaffe, Beckman Coulter (High Wycombe, UK) AU640 analyser; 2J – Compensated Jaffe, Siemens (Frimley, UK) Advia 2400 analyser; 3E – Enzymatic creatininase, Beckman Coulter AU2700 analyser; 4J – Modified kinetic Jaffe, Beckman Coulter AU2700 analyser; 5E – Enzymatic creatininase, Beckman Coulter AU2700 analyser, 6J – Kinetic Jaffe, Beckman Coulter AU2700 analyser; 7J – Compensated Jaffe, Abbott (Maidenhead, UK) Architect C8000; 8E – Enzymatic creatininase, Siemens Advia 2400. CK was analysed on Siemens Advia 2400.
GFR estimating equations
All eCrCl and eGFR equations were calculated using Excel (Microsoft). Serum creatinine (SCr) was measured in μmol/L for all the following equations:
Wright Jaffe
12
Cockcroft and Gault
9

Sex = 1 if female, 0 if male.
MDRD
10
CKD-EPI
11
Janowitz and Williams
13
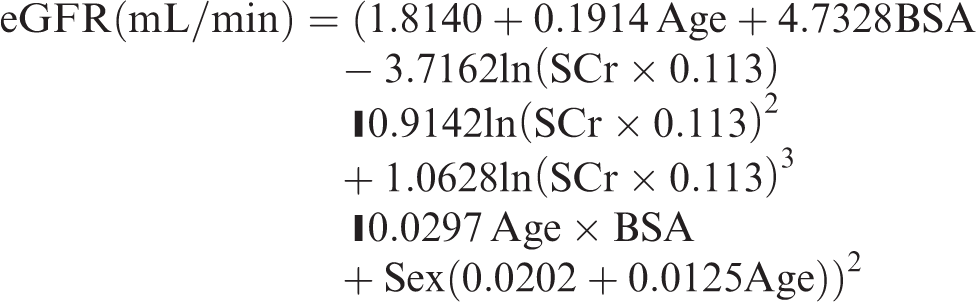
Sex = 1 if male, 0 if female.
BSA
All eGFR equations which calculate a normalized eGFR to BSA of 1.73 m2 were converted to mL/min by multiplying the result by BSA/1.73. BSA was determined using the Du Bois formula. 15
Statistics
Creatinine results were logged to the base 10 to normalize the data distribution for statistical analysis. The geometric mean creatinine for each laboratory was calculated from the inverse log to power 10 of the mean of the normalized data. ANOVA analysis was performed on the normalized data using Excel Analyse-it (Microsoft). Mean percentage error (MPE), mean absolute percentage error (MAPE) and percentage within 30% of target (P30) were calculated in Excel (Microsoft) as follows


Results
Patient demographics and samples
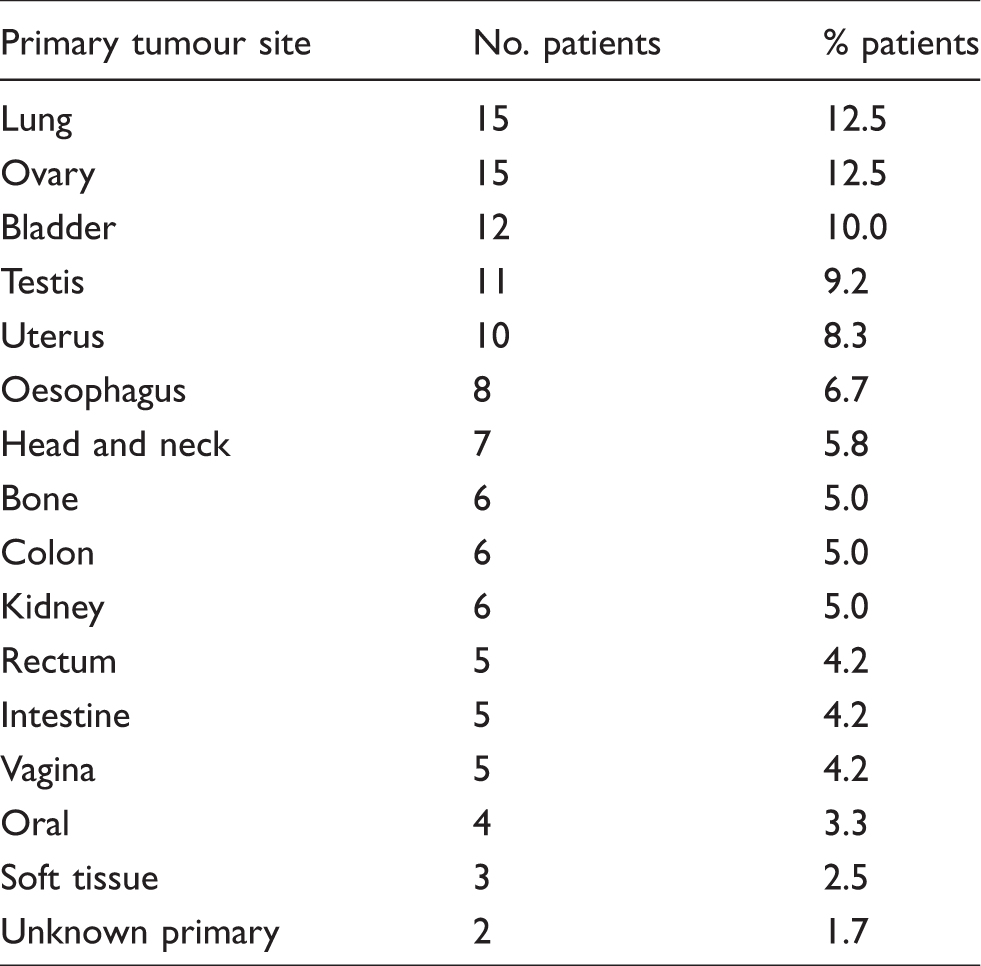
The demographics of the 120 participating patients (42 male, 74 female) are summarized in Table 1. The majority of patients were white British (72.5%). Many patients declined to include their ethnic group (20%) with the remaining patients being white other background, Asian or Pakistani. Patients had a diverse range of malignancies as shown in Table 2. A flow chart in Figure 1 shows how each patient sample was analysed and used to generate multiple creatinine and eGFR results in addition to the mGFR.
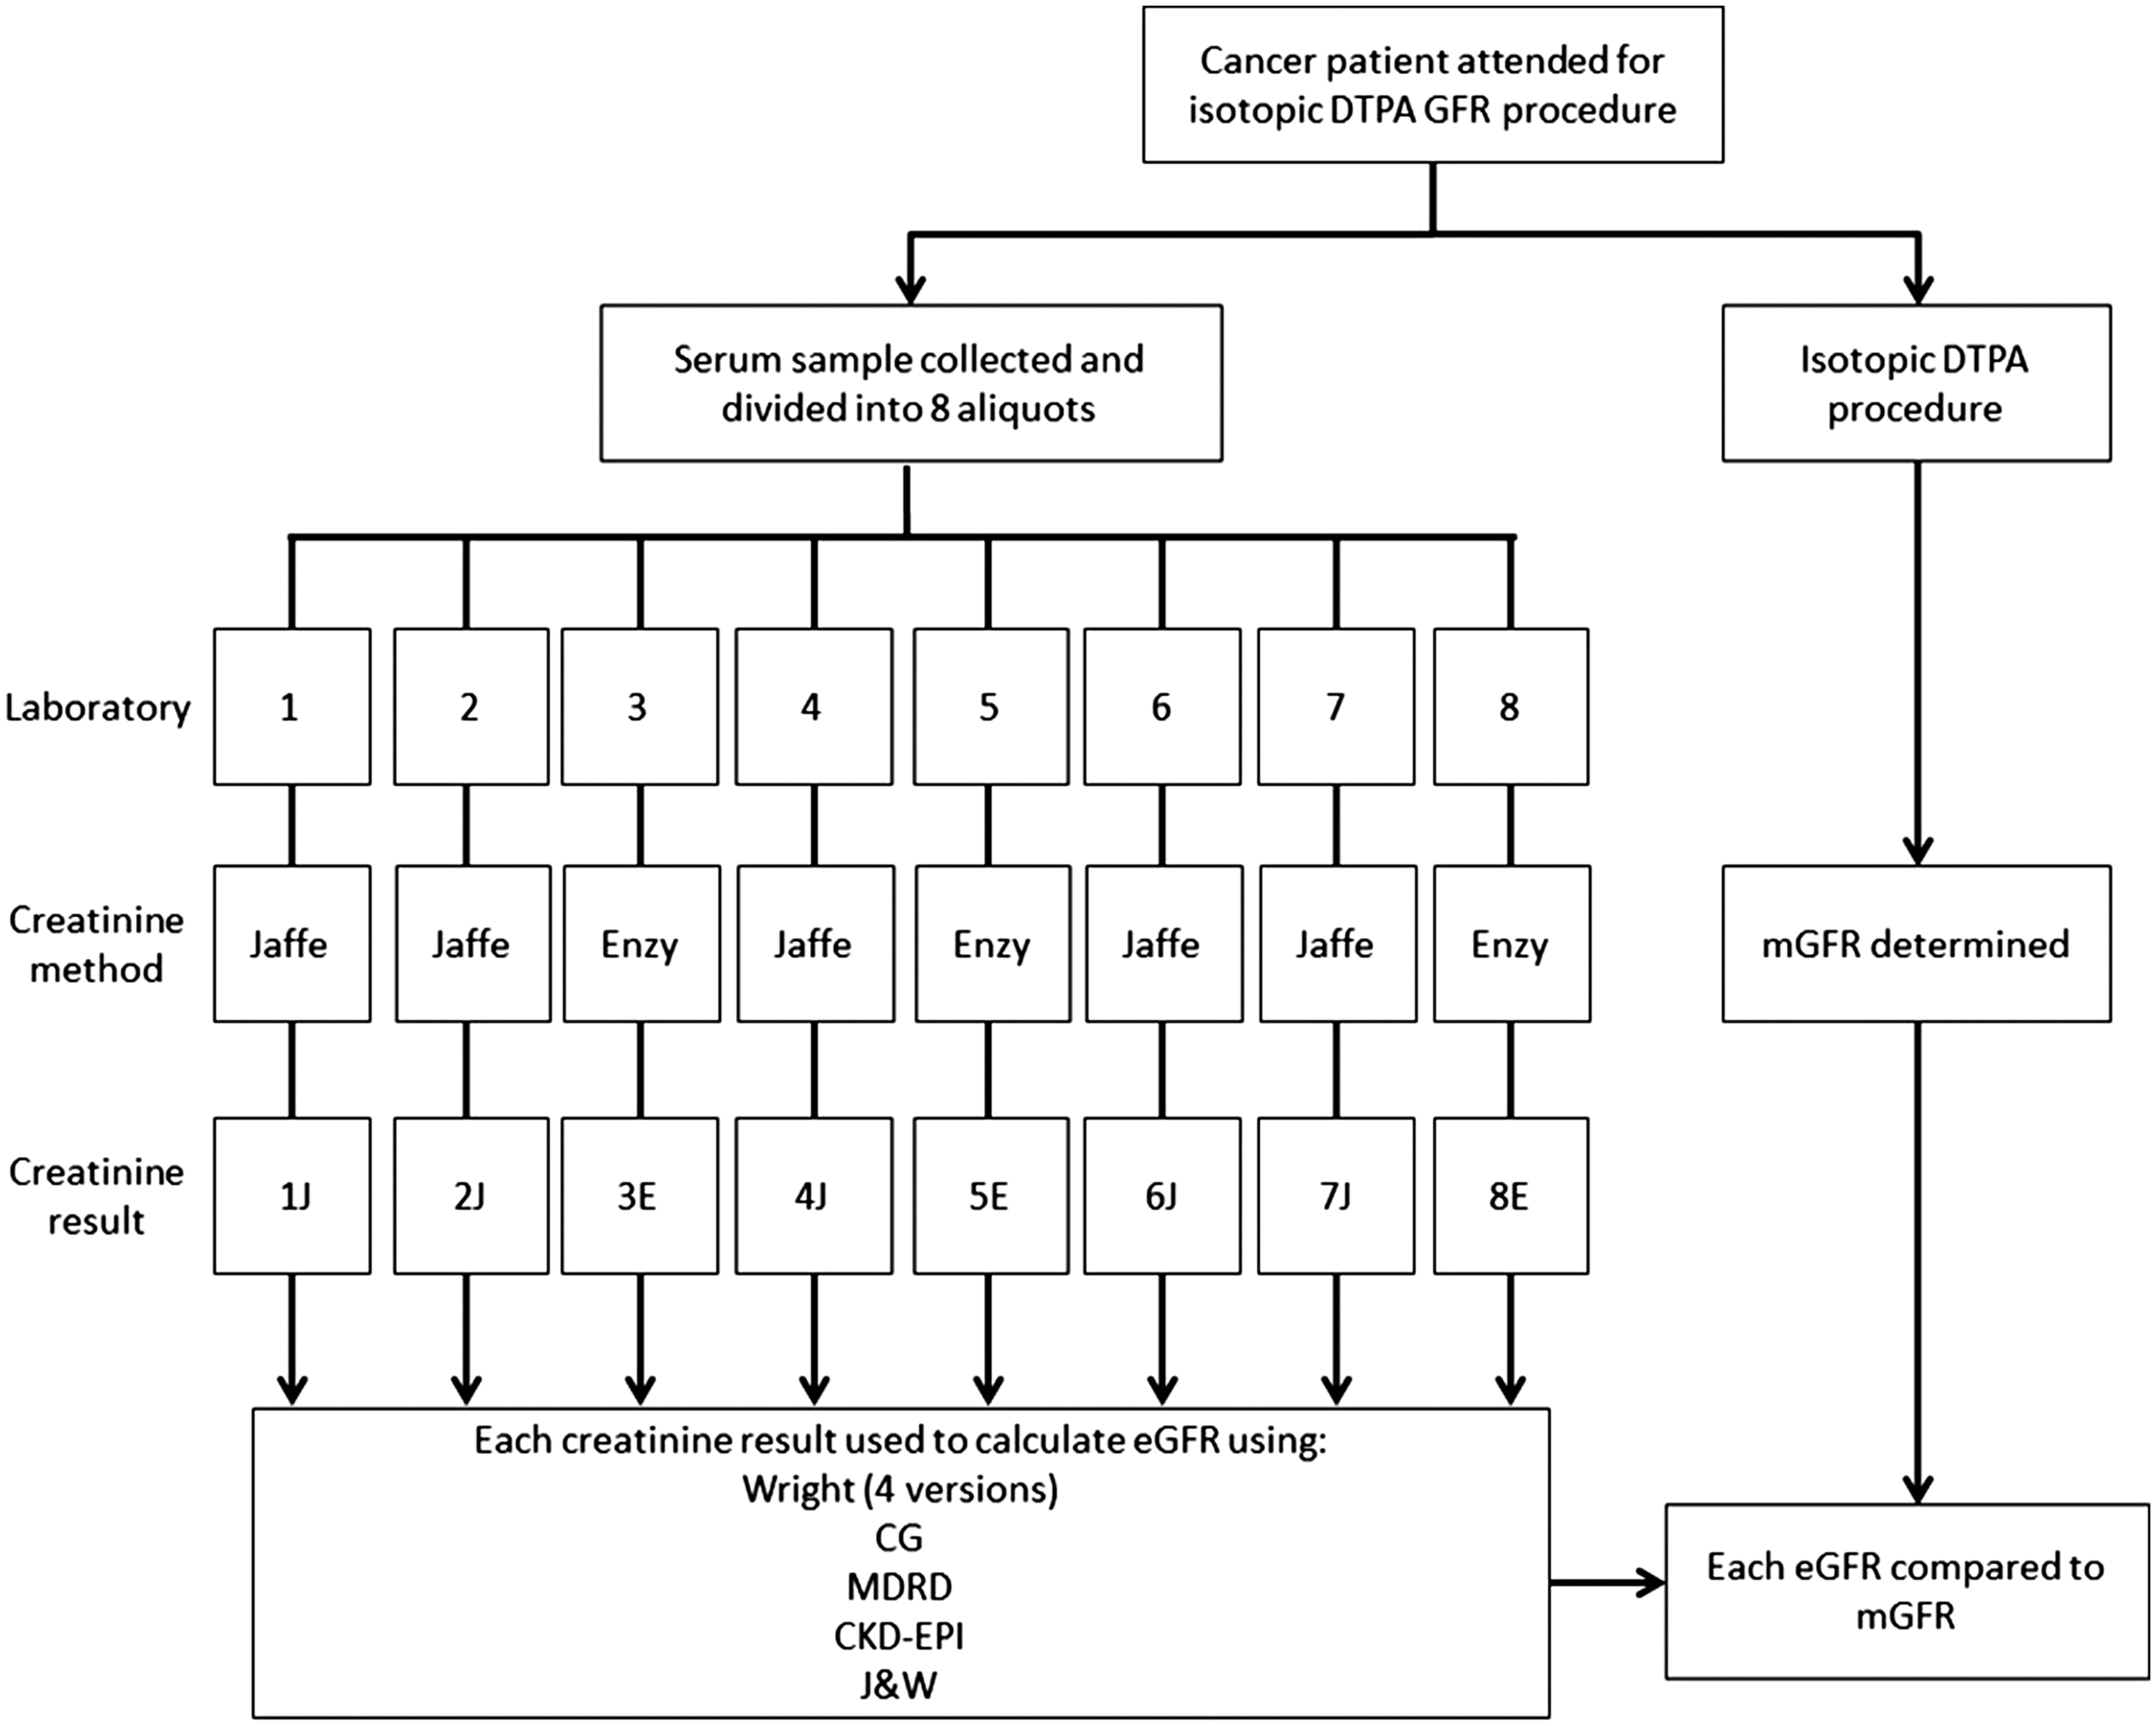
Flow chart to show sample collection, analysis and calculations for each participating patient.
Demographics for the 120 participating patients.
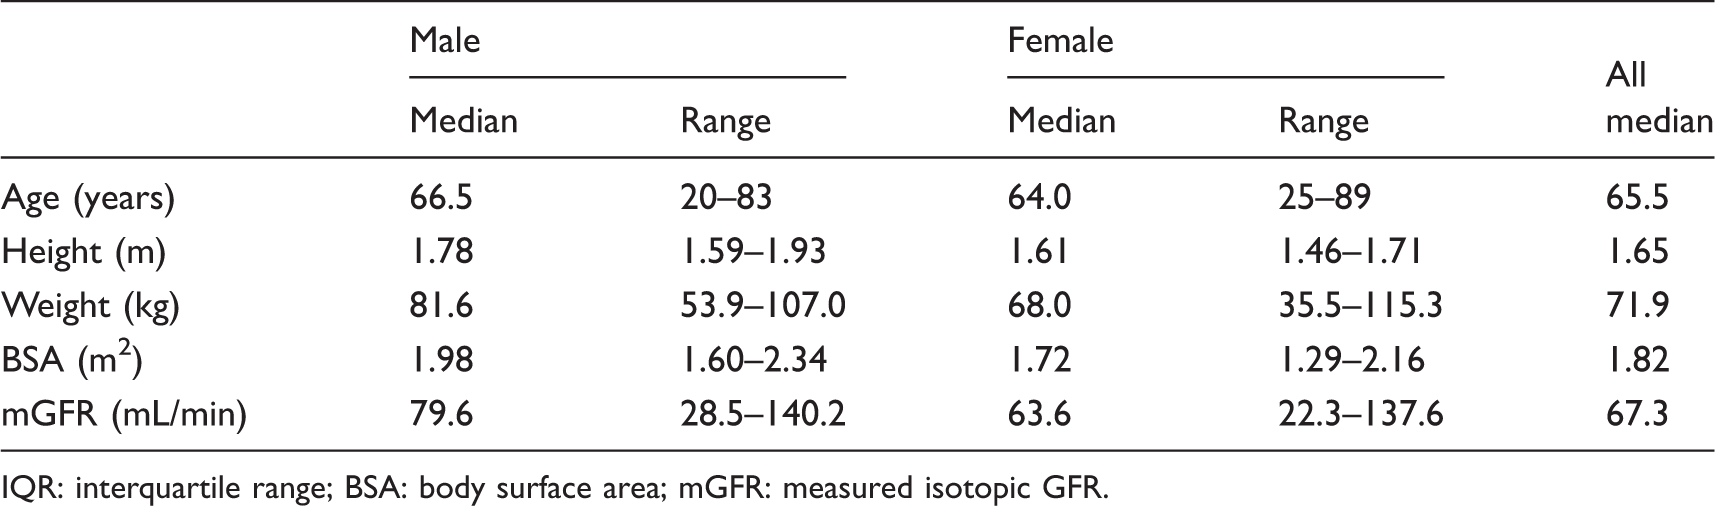
IQR: interquartile range; BSA: body surface area; mGFR: measured isotopic GFR.
Primary tumour site for the 120 participating patients.
Creatinine variation between laboratories
The creatinine results for 120 patient samples measured in eight laboratory creatinine assays are shown in Figure 2. The geometric mean was used to compare creatinine assays to account for the non-normal distribution of the data. Logged creatinine results gave a normal distribution and these data showed that there was a significant difference (ANOVA, P < 0.0001) between the mean creatinine results for all eight assays which ranged from 73.2 μmol/L in laboratory 8E to 92.8 μmol/L in laboratory 1J. There was no correlation between the creatinine method, Jaffe or enzymatic, and the creatinine mean as illustrated in Figure 2 with enzymatic assays in positions 3, 5 and 8 when arranged in decreasing geometric mean order.
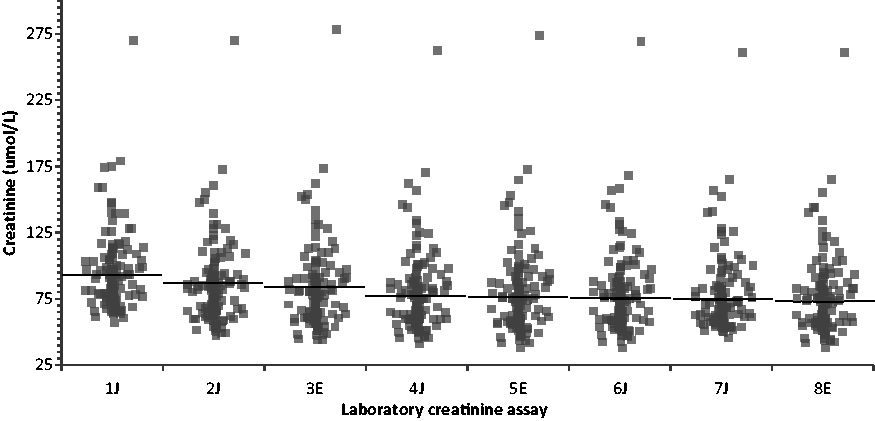
Scatter diagrams of the creatinine results for all 120 patients by each laboratory assay. Jaffe assays are identified with a ‘J’, enzymatic assays with an ‘E’. Assays have been labelled in order of descending geometric mean to facilitate comparison. Horizontal lines show geometric mean creatinine concentration for each assay.
Wright equation assessment
In order to assess the performance of each of the four versions of the Wright equation, the following parameters were calculated by comparing the eGFR to the mGFR for each patient: MPE to assess bias, MAPE to assess precision and P30 to assess accuracy. The results showed that the performance of each version of the Wright equation was highly dependent on which creatinine assay was used but was correlated to the geometric mean rather than the creatinine method of Jaffe or enzymatic. The Jaffe version of the Wright equation did not perform any better than the enzymatic version of the Wright equation regardless of whether the creatinine had been analysed using a Jaffe or enzymatic method. Furthermore, the addition of CK to the Jaffe or enzymatic versions of the Wright equation did not improve performance. Therefore, for all eight creatinine assays, the enzymatic version of the Wright equation without CK gave the best overall performance (see supplementary data).
Comparison of GFR estimating equations
Since the enzymatic Wright equation out performed all other versions of the Wright equation, it was the only version used for further comparisons. The performance of enzymatic Wright, CG, MDRD, CKD-EPI and JW equations were compared with each of the eight creatinine assays for the 120 patients (Figure 3). The performance of each equation was again highly dependent on the creatinine assay used, and for all the calculated performance parameters, there was more variation between different laboratories using the same equation than there was between the five different equations in a single laboratory.
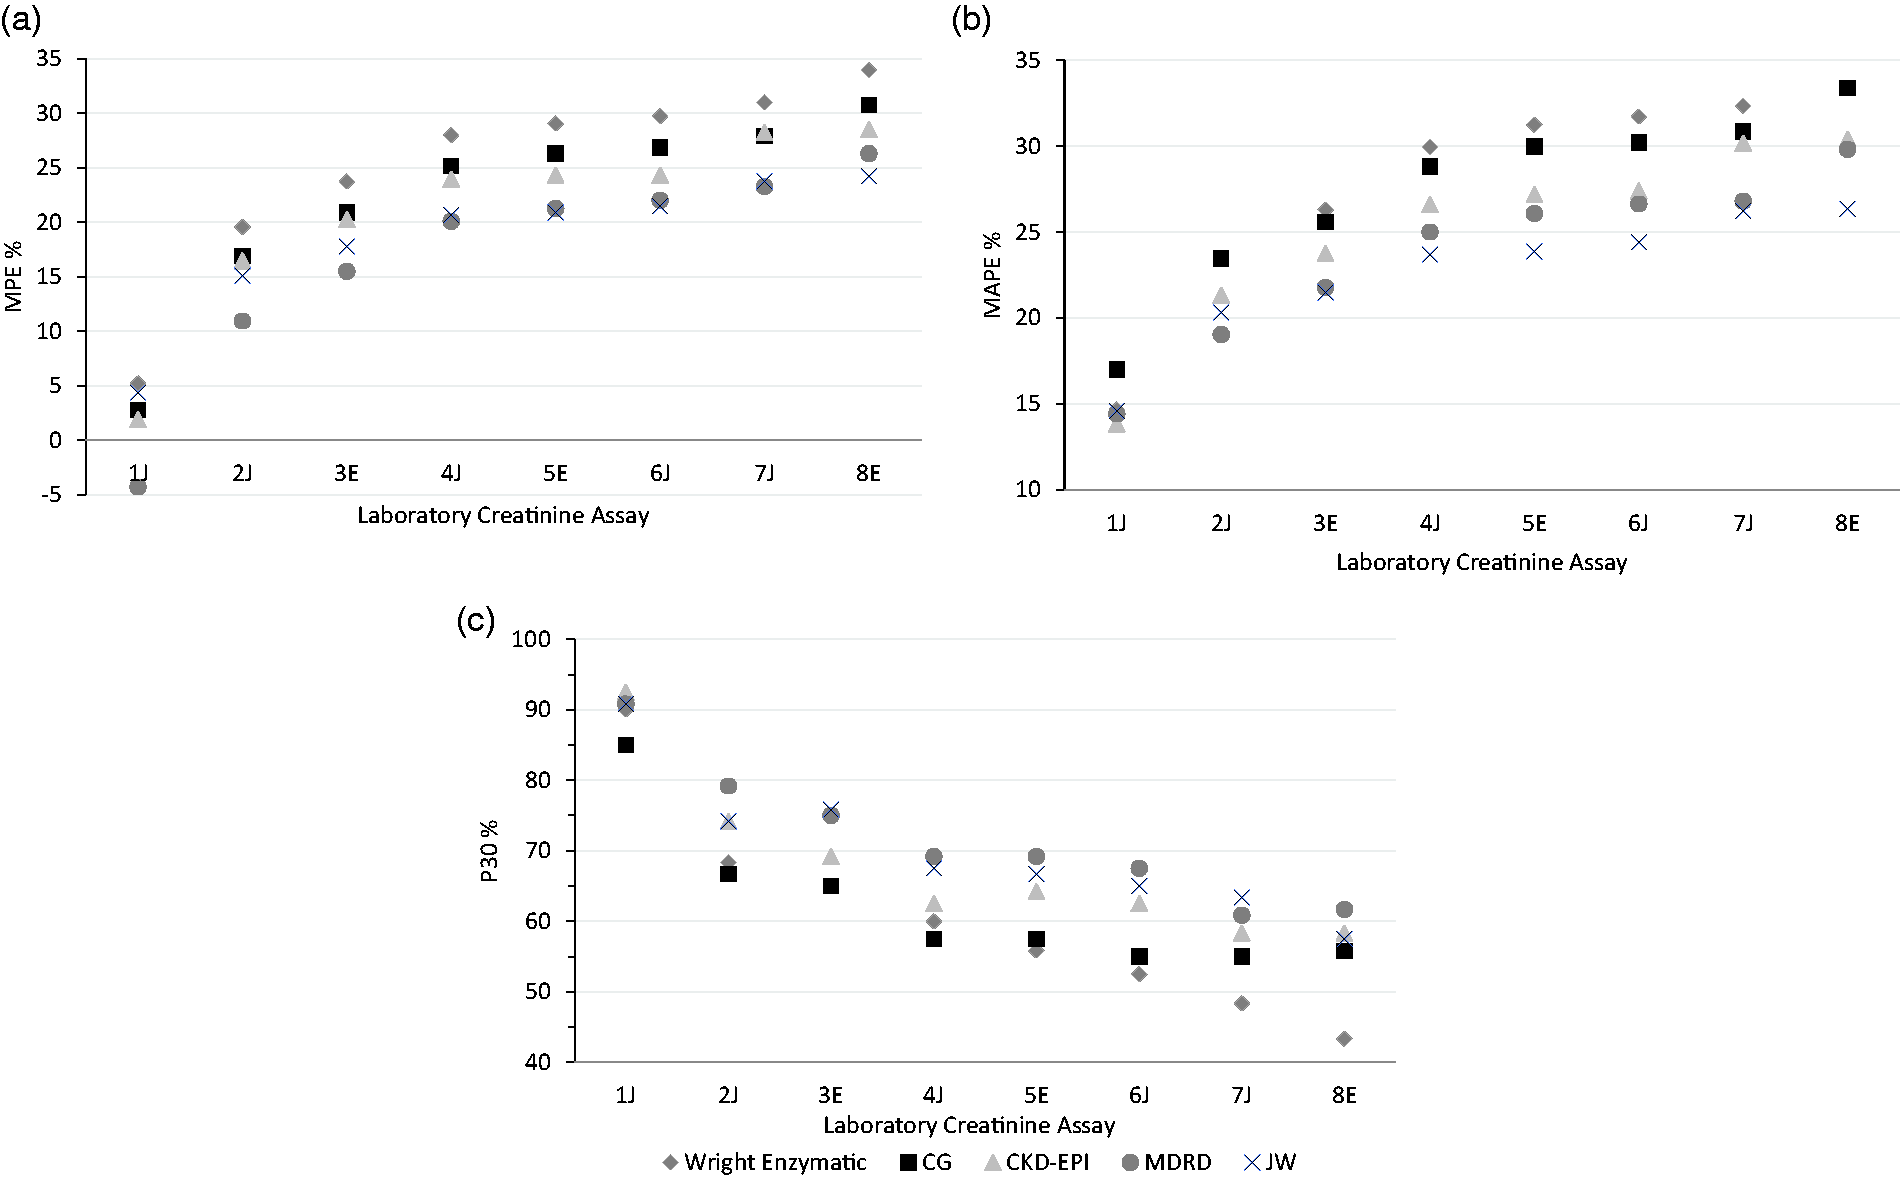
(a to c) Comparison of the performance of the renal function estimating equations using results from eight different creatinine assays.
The MPE shows that all the equations had an overall positive bias except for MDRD with creatinine assay 1J, which had a slightly negative bias (Figure 3(a)). With the exception of laboratory 1J, MDRD and JW were the best performing equations in terms of bias, precision and accuracy for estimating GFR as determined by MPE, MAPE and P30 (Figure 3). The CKD-EPI equation performed slightly better than the other equations for laboratory 1J. Enzymatic Wright and CG were the poorest performing equations with all eight creatinine assays for this set of patients.
Using mean parameters such as MPE and MAPE to evaluate an eGFR equation can mask the true performance of the equation for individual patients. Figure 4 demonstrates the wide variability in the accuracy of one of the best performing equations, MDRD, in the two laboratories with the largest difference in creatinine results, 1J and 8E. The greatest discrepancies are seen for patients with mGFR near 80 mL/min, where some eGFR results were overestimated by 63 mL/min or underestimated by 30 mL/min.
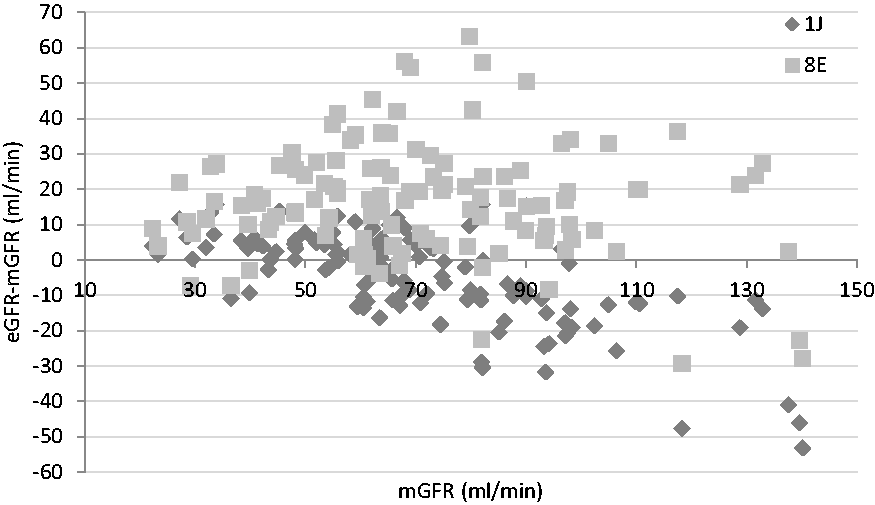
The difference between the MDRD eGFR and mGFR for individual patients using creatinine results from laboratories 1J and 8E.
Discussion
Guidelines for drug treatment or clinical trials for oncology patients will frequently state that a specific equation has to be used to estimate GFR without reference to the creatinine method. This study highlights that variation in results from laboratories using different creatinine assays within a regional service, can greatly influence the accuracy of any equation used to estimate renal function.
The variation in creatinine results between different assays and the impact this has on estimating GFR has been a long recognized problem. 16 Despite standardizing all assays to IDMS traceable calibrators, considerable variation was still observed in creatinine results from different laboratories, and it was proposed that this could be due to the non-specificity of the Jaffe method. 17 However, now that many laboratories have adopted the more specific enzymatic assays, there are still significant differences in results obtained from different enzymatic assays. A recent UK NEQAS report 18 showed that for a sample with a mean creatinine concentration of 102.2 μmol/L, the results from all enzymatic methods ranged from 90 to 114 μmol/L. This is similar to the range of variation observed in this study and highlights how variation between creatinine assays still persists nationally. It also supports the observation in this study that the mean results from the three enzymatic assays were no more similar to each other than they were to the Jaffe assays.
This is the first study, to our knowledge, to directly compare all versions of the Wright equation across multiple Jaffe and enzymatic assays. The results do not support the rationale for separate Jaffe and enzymatic versions of the equation, since the enzymatic Wright equation outperformed the Jaffe version of the equation regardless of whether the creatinine was measured in an enzymatic or Jaffe assay. Furthermore, the inclusion of CK did not improve the performance for either version of the Wright equations in this study. Since most publications assessing the performance of the Wright equation have used the Jaffe equation without CK,5–8,19,20 it is difficult to determine whether this is a common finding with current assays or if it is dependent on the characteristics of the population studied. It should be noted that CK was only measured in a single centre in this study so does not necessarily reflect the performance of the CK equations in multiple laboratories.
Until the recent publication of the JW equation, 13 the Wright formula was the only established eGFR equation derived in oncology patients. In 2010, the British Oncology Pharmacy Association recommended that the Wright formula should be used to estimate GFR in patients receiving carboplatin, and CG or Wright could be used for those on cisplatin therapy. 21 It also specifically stated that MDRD should not be used for this purpose. Some studies which have evaluated eGFR equations in cancer patients found CG to be more accurate than MDRD or CKD-EPI for estimating renal function and chemotherapy dosing in cancer patients,22–24 while several studies evaluating the Wright equation have found it to provide the best estimate in certain patient groups.5,7,19 However, our results suggest that MDRD, JW and CKD-EPI perform better than Wright and CG in the group of oncology patients investigated in this study when using creatinine results from eight different assays. Further studies have also found the MDRD equation to be better, or at least equivalent, to Wright and CG in cancer patients.6,8,20 Many factors may have contributed to these apparent differences in performance of the respective equations including the population studied, reference method and creatinine assay. In fact, our data demonstrate how different conclusions could be met using the same patient samples in different assays, since there was very little difference in the performance of Wright and MDRD in laboratory 1J (MAPE 14.7 and 14.4%; P30 90.0 and 90.8%, respectively), and therefore these equations could have been interpreted as equivalent. However, the differences in performance data were more significant for the other creatinine assays and since MDRD performed consistently better than Wright in all these assays, we have reached the alternative conclusion that MDRD provides a more accurate estimate of GFR than Wright in our population. Furthermore, the performance parameters for both Wright and CG were consistently the poorest with all eight creatinine assays for our set of cancer patients, despite these being the most commonly endorsed equations for this population.
It would be anticipated that an eGFR equation will be most accurate when applied to a population similar to that in which it was derived. As such, the JW equation derived from patients with cancer might be expected to provide the most accurate estimate of GFR for our set of cancer patients. Although it was one of the better performing equations, this study was unable to distinguish between JW and the MDRD equation in terms of the best overall performance accounting for bias, precision and accuracy with all eight creatinine assays. Considering that MDRD has already been established to calculate chronic kidney disease (CKD) and therefore most laboratories have an automated system to calculate it, the MDRD equation will presumably be more accessible for most oncology centres currently, although many laboratories may have switched from MDRD to the CKD-EPI equation to detect CKD as recommended by NICE in 2014. 25
This study found that the variation in the performance parameters was greater between different laboratories using the same equation than between the five different equations in a single laboratory. This demonstrates that the creatinine assay can have a greater impact on the accuracy of eGFR than the choice of equation used to derive it. This has important implications for tertiary oncology units when evaluating the performance of an eGFR equation using their local creatinine assay, as the performance of the same equation could be significantly altered if the creatinine results from referring hospitals were used. For example, the P30 ranged from a reasonable 90.8% to a potentially unacceptable 60.8% for MDRD using different creatinine assays within our referral region. Furthermore, the results suggest that some creatinine assays are unlikely to have acceptable performance with any of the eGFR equations evaluated in this study.
Even in the best performing laboratory, MDRD and JW were still significantly inaccurate for some individual patients in this study. Such results are not unexpected, since equations derived from population data are unlikely to accurately reflect every individual and this is evident even in the original validation data.10,13 However, the consequences of these inaccuracies are potentially serious when applied to chemotherapy dosing. Carboplatin is prescribed using the Calvert formula, 1 in which the calculated dose is directly related to the measured or estimated GFR. Clinical protocols recommend a dose of AUC5 (5× [GFR + 25]) when using a measured GFR or eGFR calculated by the Wright formula. A hypothetical patient with the median demographics from the population used in this study would have an mGFR of 67.3 mL/min, which would give a carboplatin dose of 461.5 mg according to the Calvert formula. However, if the enzymatic Wright formula was used to calculate eGFR using creatinine results from the different assays in this study, then the dose would range from 470.5 to 571.0 mg. This is a difference of over 100 mg and up to 24% more than the most accurate assessment using mGFR. For a drug with such a narrow therapeutic window and potentially life-threatening haematological toxicity, this potential variability may not be considered acceptable.
If an eGFR equation is going to be used as an alternative to mGFR procedures, then it is imperative that the eGFR equation used is as accurate as possible for the majority of patients. In light of the data presented in this study, this is unlikely to be achieved using creatinine results from multiple assays in a single equation, and we therefore do not recommend that tertiary oncology units use creatinine results from referring hospitals to calculate eGFR. Furthermore, the results from this study suggest that some creatinine assays may not have acceptable performance with any of the most commonly used equations. We recommend that each oncology unit should work together with their laboratories to establish the performance of eGFR equations with their creatinine assays and determine which, if any, equation is acceptable for their requirements. It is also important to ensure that all clinicians applying eGFR equations are fully aware of the performance and limitations of these equations in their setting.
This study was conducted in order to get a true representation of the impact of differences in creatinine assays on the clinical practice provided by a regional oncology service. As such, our study does have some limitations. Patients were not specifically selected to defined criteria other than having mGFR for oncology management, so the population studied had a diverse range of malignancies, included a greater proportion of females, was a predominately white British population and did not equally represent a wide range of GFRs. There may also have been bias in the type of patient who would have had mGFR requested as part of their routine care. There were insufficient numbers of patients to properly assess the performance of each equation at different levels of GFR or by specific criteria such as age and gender. This may have influenced which equation performed best in our study, since other publications have found that some equations perform better for certain cohorts of patients. For example, MDRD is reported to be most accurate for patients with GFR <60 mL/min/1.73 m2. 11 and Wright was found to be best for GFR >50 mL/min and patients over 70 years old.5,7,19 Another factor to consider is that all eGFR results were included in the performance analysis of the equations in this study, but in clinical practice, inaccuracies in eGFR >125 mL/min may not impact patient care since the Calvert formula used for drug dosing caps GFR at this level. 26
In conclusion, the performance of any equation to estimate GFR is highly dependent on the assay used to measure creatinine. Oncology units should assess the performance of these equations using their laboratory creatinine assay to determine whether they can be used safely and effectively in cancer patients.
Supplemental Material
Supplemental material for Comparing glomerular filtration rate equations and the impact of different creatinine assays on the assessment of renal function in cancer patients
Supplemental Material for Comparing glomerular filtration rate equations and the impact of different creatinine assays on the assessment of renal function in cancer patients by Ashley E Garner, Mark C Barnfield, Michael L Waller, Geoff D Hall and Mike P Bosomworth in Annals of Clinical Biochemistry
Footnotes
Acknowledgements
The authors would like to thank all the regional Clinical Biochemistry Departments involved in the study and their staff, for analysing the serum creatinine samples.
Declaration of conflicting interests
The author(s) declared no potential conflicts of interest with respect to the research, authorship, and/or publication of this article.
Funding
The author(s) received no financial support for the research, authorship, and/or publication of this article.
Ethical approval
This study was approved by our Leeds Teaching Hospitals Trust Research and Innovation office as a service improvement project, and therefore ethics approval was not required. Participation in this project did not alter patient care and written informed consent was obtained from all participants for the extra blood samples required.
Guarantor
AEG
Contributorship
GDH, MPB and AEG conceived the study. All authors contributed to the study design. MCB and MLW organized and supervised the mGFR measurements. MCB analysed and collated the mGFR data. AEG organized and coordinated creatinine analysis, collated and analysed data and wrote the first draft of the article. All authors reviewed and contributed to the final article.
References
Supplementary Material
Please find the following supplemental material available below.
For Open Access articles published under a Creative Commons License, all supplemental material carries the same license as the article it is associated with.
For non-Open Access articles published, all supplemental material carries a non-exclusive license, and permission requests for re-use of supplemental material or any part of supplemental material shall be sent directly to the copyright owner as specified in the copyright notice associated with the article.