
Abstract
Background
We evaluated the accuracy and precision of creatinine- and cystatin C-based prediction equations for estimating glomerular filtration rate compared to measured glomerular filtration rate in an antiretroviral-naive human immunodeficiency virus population.
Methods
The study population consisted of 100 treatment-naive HIV patients. Glomerular filtration rate was estimated using the Cockcroft–Gault, Modification of Diet in Renal Disease (MDRD) and Chronic Kidney Disease Epidemiology Collaboration (CKD-EPI) equations, as well as cystatin C-based equations (CKD-EPIcystatin C, cystatin Cvan Deventer and CKD-EPIcombined)) compared to 51Cr-EDTA plasma clearance-measured glomerular filtration rate. We calculated percentage bias, standard deviation of the differences, accuracy within 15 and 30% of measured glomerular filtration rate and sensitivity and specificity for predicting measured glomerular filtration rate <60 mL/min/1.73 m2.
Results
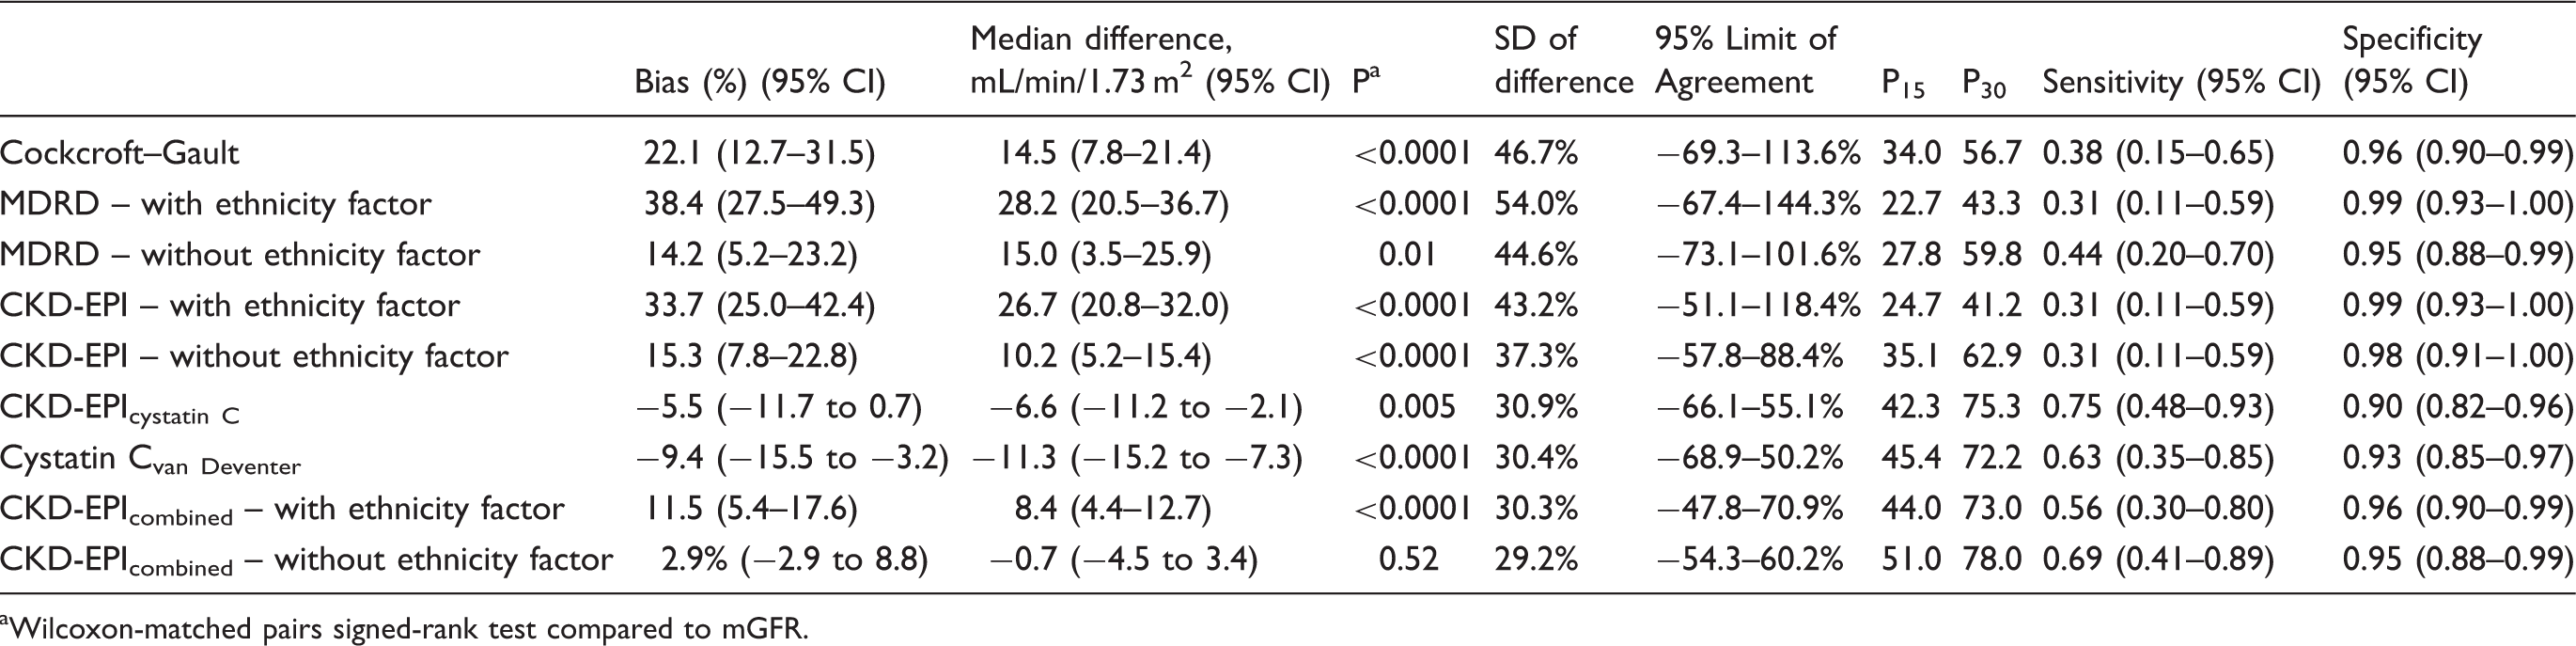
Bias for all estimating glomerular filtration rate equations ranged from −9.4% to 38.4%. The CKD-EPIcombined without ethnicity correction factor equation had the least bias, 2.9% (−2.9 to 8.8). Bias was higher for the Modification of Diet in Renal Disease and CKD-EPI equation with the African–American ethnicity factor (38.4 and 33.7%) than without (14.2 and 15.3%). Standard deviation of the differences ranged from 29.2% (CKD-EPIcombined without ethnicity factor) to 54.0% (Modification of Diet in Renal Disease with ethnicity factor). Accuracy within 30% of measured glomerular filtration rate ranged from 78% for CKD-EPIcombined without ethnicity factor to 56.7% for the Cockcroft–Gault equation. Sensitivity for creatinine-based equations was less than 50% and for the CKD-EPIcystatin C equation was 75%.
Conclusion
Sensitivity of creatinine-based equations for predicting glomerular filtration rate was poor in this group of patients. The CKD-EPIcombined equation performed better than creatinine-based equations.
Keywords
Introduction
Human immunodeficiency virus (HIV) infection affects almost 25 million people in Sub-Saharan Africa. 1 While the introduction of antiretroviral therapy has resulted in a significant reduction of acquired immune deficiency syndrome (AIDS)-related deaths,2,3 disease conditions such as chronic kidney disease (CKD) have emerged as important causes of morbidity and mortality in the United States and Europe. 4 Renal dysfunction progressing to end-stage renal disease is a common complication of HIV infection.5,6 In Africa, a wide spectrum of renal diseases has been described on biopsies obtained from infected patients.7,8 The classic kidney disease of HIV infection is HIV-associated nephropathy9,10 which results in accelerated progression to AIDS and increased mortality. Treatment of HIV and comorbidities may also lead to renal disease, e.g. the use of tenofovir disoproxil fumarate (TDF), a nucleotide reverse transcriptase inhibitor. 11
In addition to the effects of HIV infection and its therapy on the kidney, chronic diseases like diabetes and hypertension add to the risk of CKD in Africa. The impact of both infectious diseases like HIV and chronic diseases on the prevalence of CKD has huge public health implications for Africa. 12 Studies suggest that reduced glomerular filtration rate (GFR) is widely prevalent among HIV-infected people in Africa13,14 but there is substantial variability between the methods used to estimate GFR.10,13,15,16 In Africa renal function is most commonly assessed by either the Modification of Diet in Renal Disease (MDRD) study equation 17 or the Cockcroft–Gault equation. 18 More recently, the creatinine-based CKD-EPI equation (CKD-EPI) was shown to estimate GFR (eGFR) more accurately than the MDRD equation 19 and has replaced the MDRD equation for estimating GFR in some laboratories, but its use has not been validated in local populations. In 2012, Inker et al. demonstrated in a large cross-sectional analysis that a combined creatinine- and cystatin C-based equation (CKD-EPIcombined) estimated GFR more accurately than the CKD-EPI equation. 20
Cystatin C is a low molecular weight (13 kDa) non-glycosylated basic protein produced by all nucleated cells. 21 It is produced at a constant rate, is freely filtered by the glomerulus and does not re-enter the circulation after being filtered through the glomerulus. 22 It therefore meets many of the key criteria of an ideal endogenous glomerular filtration rate marker. Cystatin C production is independent of muscle mass and dietary influences and cystatin C-based prediction equations are therefore potentially not subject to some of the limitations of serum creatinine-based eGFR equations. 23 A previous study from our centre showed that cystatin C-based prediction equations are more precise than serum creatinine-based equations for patients in predicting eGFR in patients with measured GFR (mGFR) >60 mL/min/1.73 m2. 24 Cystatin C may therefore be of benefit in detection of early renal dysfunction. As patients with HIV are at increased risk for the development of CKD, it is important that eGFR equations can accurately estimate GFR and identify patients with possible CKD.
The aim of this study was to evaluate the use of commonly described eGFR prediction equations in an antiretroviral-naive HIV-positive population using 51Cr-EDTA plasma clearance as the reference mGFR.
Materials and methods
Sample collection
This cross-sectional study was conducted on samples collected from 100 treatment-naive HIV-positive adult medical in-patients at the Chris Hani Baragwanath Hospital, Soweto, South Africa. Exclusion criteria were: patients receiving Highly Active Antiretroviral Therapy (currently and those who defaulted treatment), pregnant or breastfeeding individuals and patients with one or more of the following conditions: hypertension, diabetes mellitus, oedema or presence of known renal complications with current admission. The Human Research Ethics Committee of the University of Witwatersrand (Clearance certificate number M10410) approved the study. We obtained written informed consent from all patients prior to enrolment. Participants’ clinical history, age, height and gender were available from medical records.
Patients were fasting from the night before; 5 mL of EDTA plasma and 5 mL of serum were collected from each participant for cystatin C and creatinine measurement, respectively, between 8:00 and 10:00. Samples were centrifuged at 3500 r/min for 10 min and stored at −70℃ until analysis.
GFR measurement
GFR measurement was performed by the Nuclear Medicine department using 51Cr-EDTA according to published guidelines. 25 After injection of 3.7 MBq 51Cr-EDTA intravenously blood samples were collected from the contralateral arm at 120 and 240 min postinjection. GFR was measured by the slope intercept method. The Brochner-Mortensen equation was used according to guidelines adopted by the British Nuclear Medicine Society to correct the obtained measurements. 26 The DuBois method BSA (m2) = (71.84 weight [kg] 0.425 * height [cm] 0.725)/10 000 was used to normalize GFR to the body surface area. 27
Creatinine and cystatin C measurement
Cystatin C was measured on a Siemens Advia 1800 analyser (Siemens Healthcare Diagnostics, Tarrytown, USA) by an automated latex-enhanced immune-nephelometric assay traceable to the IFCC reference method (ERM-DA471). Creatinine was measured spectrophotometrically using the kinetic-modified Jaffe method on the Siemens Advia 1800 analyser (Siemens Healthcare Diagnostics, Tarrytown). The creatinine assay is traceable to an isotope dilution mass spectrometry reference creatinine method. 28 All samples were analysed in duplicate.
GFR estimation
Glomerular filtration rate was estimated using the Cockcroft–Gault equation 18 normalized to 1.73 m2, MDRD equation (IDMS traceable) with 29 and without ethnicity factor, 30 the CKD-EPI equation, 19 the cystatin Cvan Deventer equation, 24 the CKD-EPIcystatin C equation and the CKD-EPIcombined equation. 20 (Refer to Supplementary material for full equations used.)
Statistical analysis
The Shapiro–Wilk test was used to assess normality of data. Continuous data variables were expressed as mean ± SD if parametric and median (interquartile range, IQR) if non-parametric. Difference plots were used for comparison studies. For the difference plots, mean percentage bias, SD of the difference and 95% limits of agreement were calculated for each of the equations. Wilcoxon matched-pairs signed-rank test was used to test for significance of bias compared to reference mGFR. Accuracy within 15% (P15) and within 30% (P30) was also calculated for each of the equations. The McNemar test was used to compare P15 and P30 values. Receiver operating characteristic curve analysis was used to calculate the sensitivity and specificity of equations in the prediction of mGFR <60 mL/min/1.73 m2. Statistical analysis was performed using the MedCalc Statistical program (MedCalc Version 11.6.1, Mariakerke, Belgium) and Analyse-It (Analyse-It Software Ltd Version 2.26, Leeds, UK).
Results
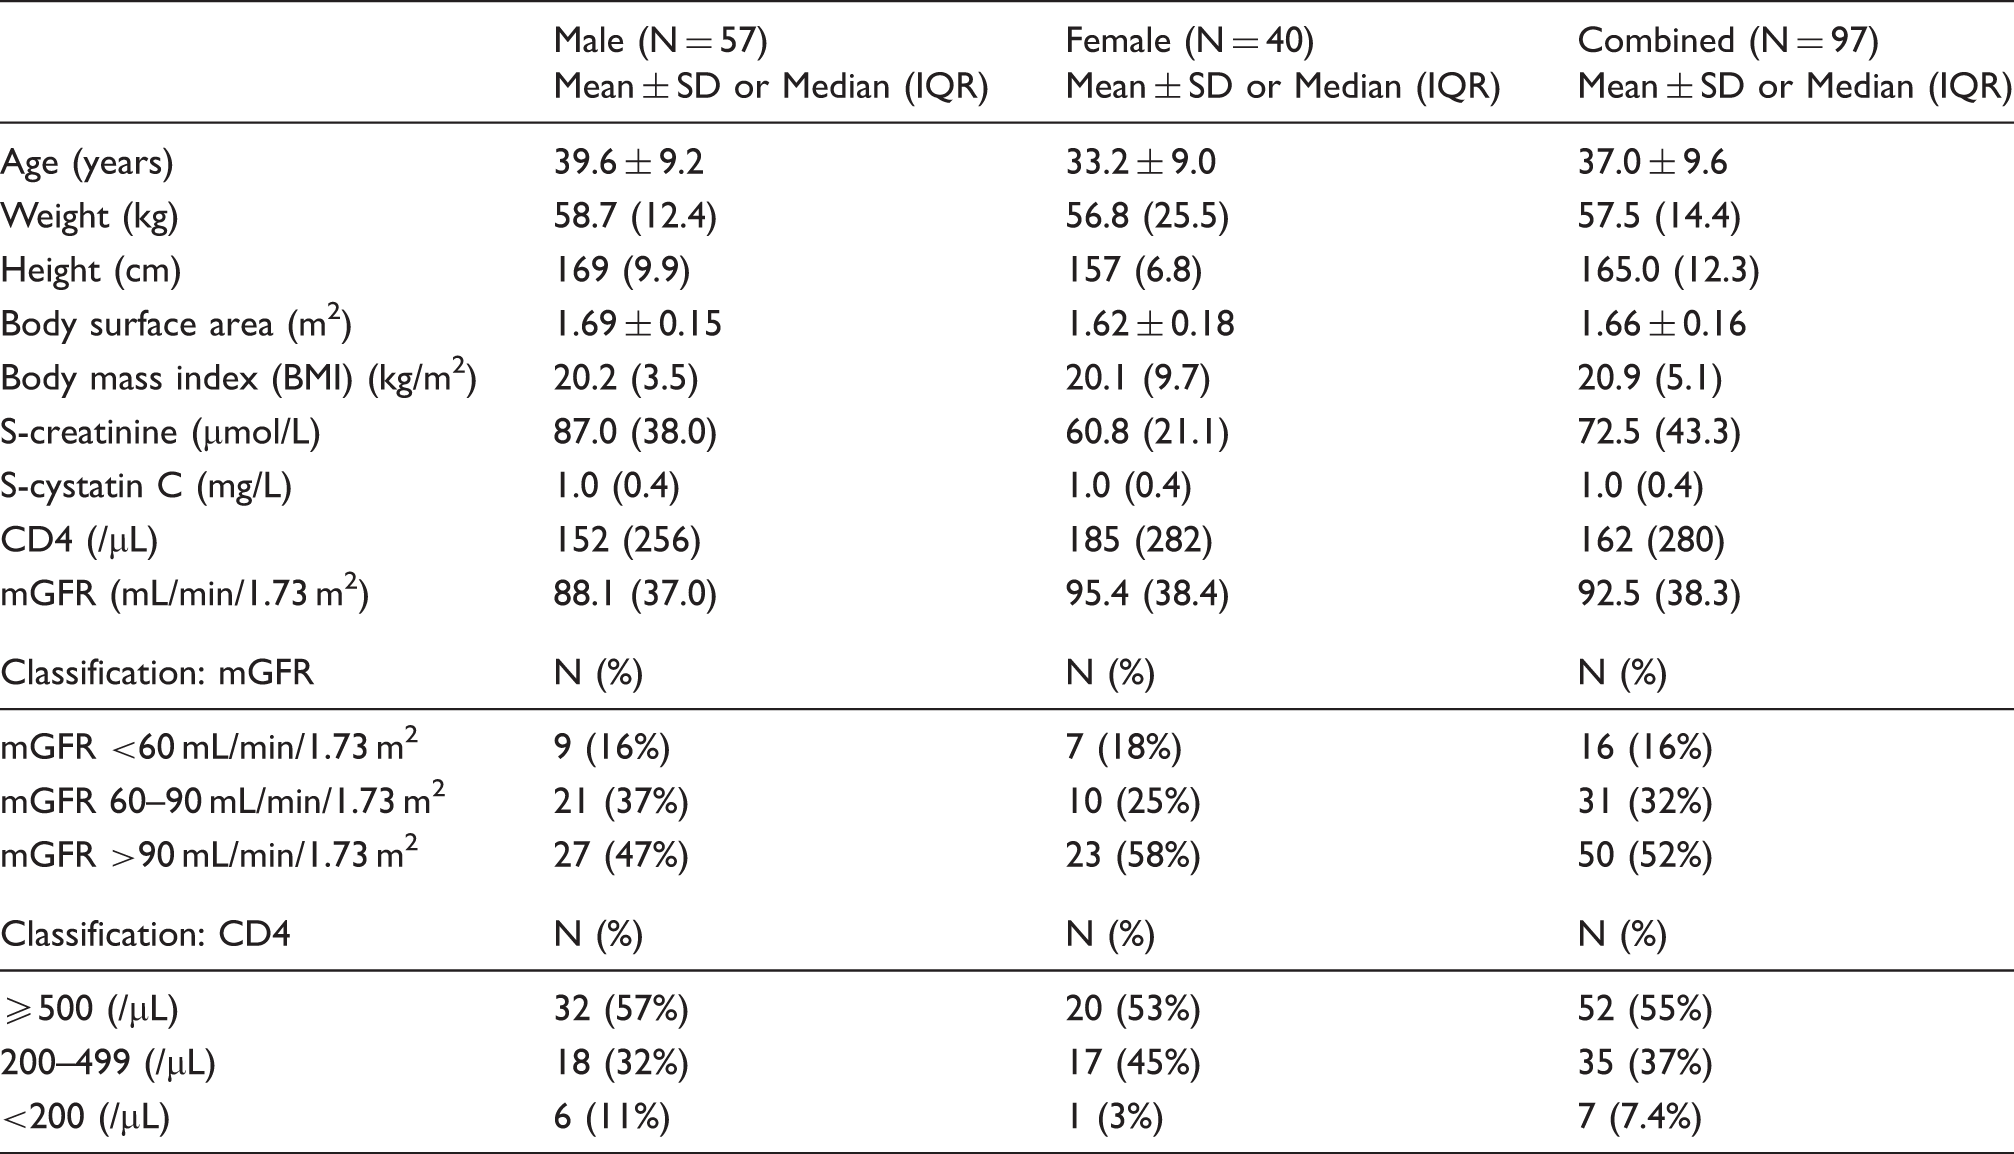
One hundred black South African HIV-positive patients were enrolled in the study. Results of 97 patients are presented. Three patient results were excluded due to incomplete data. All participants were in-patients admitted to the Chris Hani Baragwanath Hospital for a wide range of diseases except for primary renal disease. The majority (43/97, 44%) of the patients were admitted with lower respiratory tract infection, followed by tuberculosis in 25% (24/97) and opportunistic infections such as cryptococcal meningitis in 14% (14/97). A minority of patients had other diagnoses including lymphomas and bacterial and viral meningitis.
Participant characteristics.
Comparisons of the different eGFR equations
Bias and difference plots
Most of the creatinine-based equations evaluated overestimated mGFR in this population. Inclusion of the ethnicity factor resulted in a greater overestimation of mGFR as compared to when the ethnicity factor was excluded (Table 2 and Figure 1). The MDRD equation overestimation was 38.4 (27.5–49.3)% when the ethnicity factor was included versus 14.2 (5.2–23.2)% without ethnicity factor. The CKD-EPI equation overestimation was 33.7 (25.0–42.4)% with the ethnicity factor versus 15.3 (7.8–22.8)% without. For the CKD-EPIcombined equation overestimation was 11.5 (5.4–17.6)% with the ethnicity factor versus 2.9 (−2.9 to 8.8)% without the ethnicity factor. Using the Wilcoxon-matched pairs signed-rank test, only the CKD-EPIcombined without ethnicity factor equation had no significant bias when compared to mGFR. The cystatin C-based equations (CKD-EPIcystatin C and cystatin Cvan Deventer) underestimated GFR in this population, −5.5 (−11.7 to 0.7)% and −9.4 (−15.5 to −3.2)%, respectively.
Difference plots: a: MDRD with ethnicity factor b: MDRD without ethnicity factor. c: CKD-EPI with ethnicity factor. d: CKD-EPI without ethnicity factor. e: CKD-EPI cystatin C f: van Deventer cystatin C g: CKD-EPI combined with ethnicity factor h: CKD-EPI combined without ethnicity factor. Performance of the eGFR equations compared to mGFR. Wilcoxon-matched pairs signed-rank test compared to mGFR.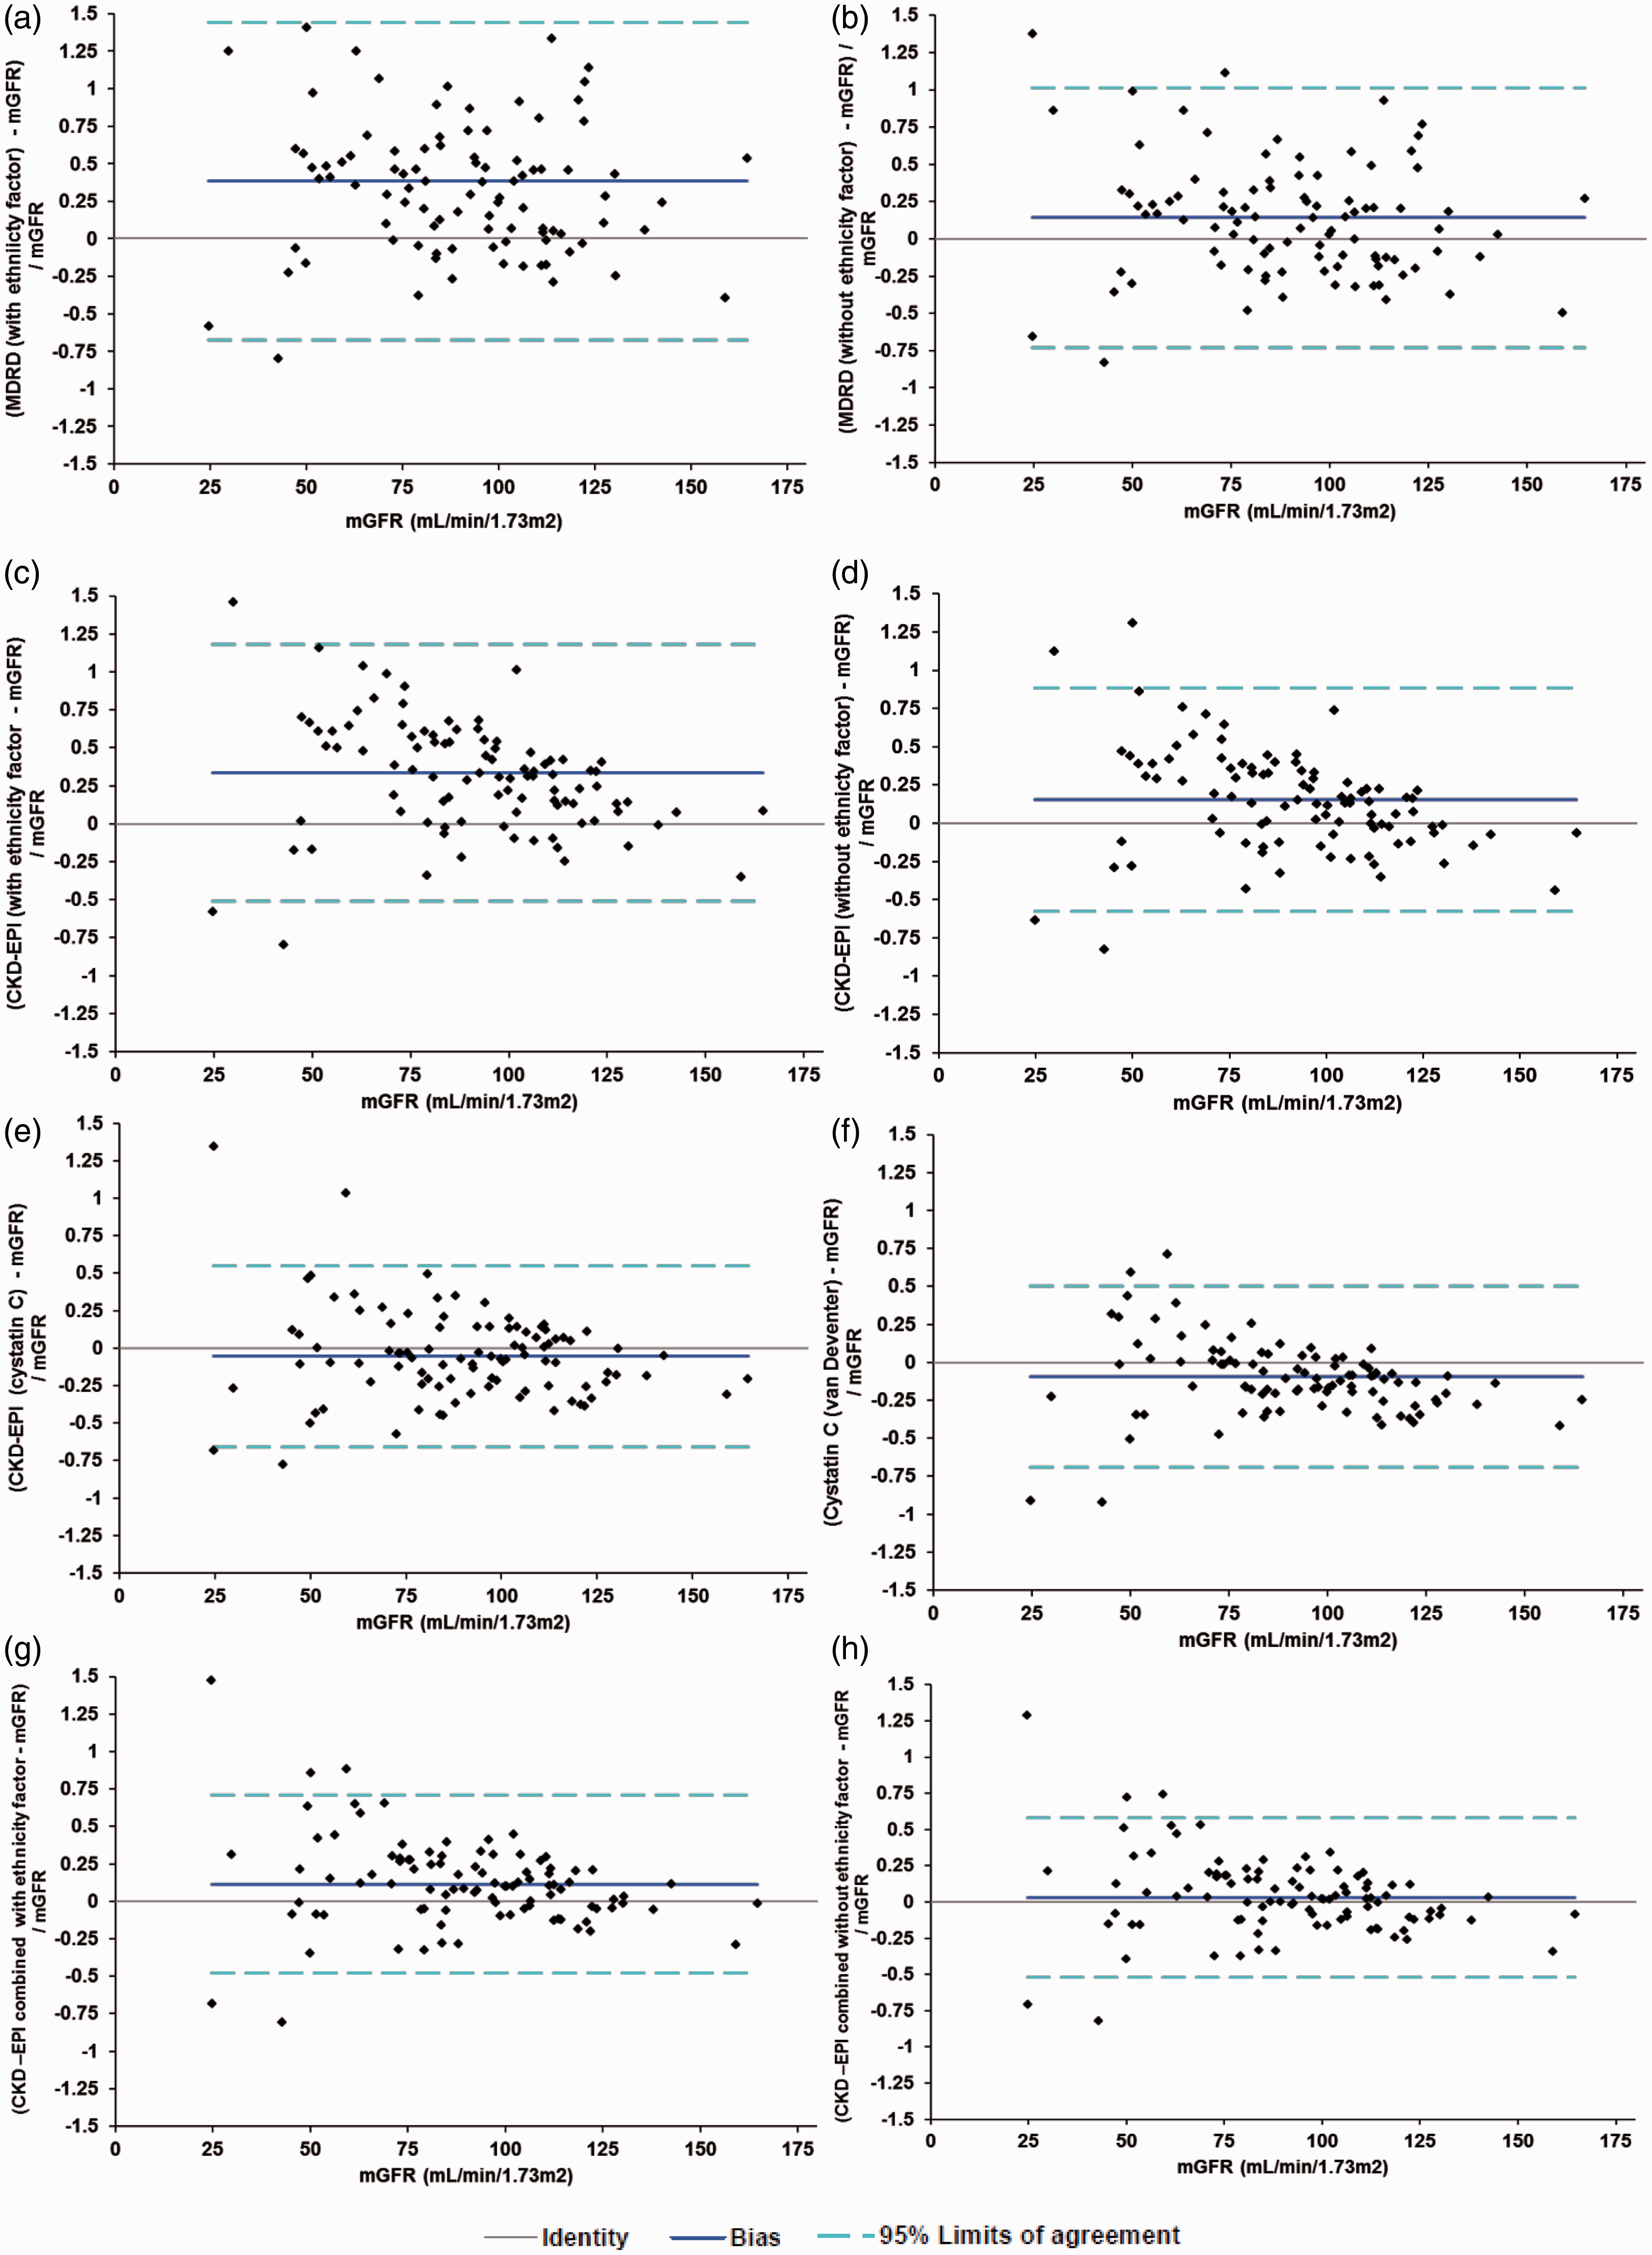
SD of the differences appeared to be higher for creatinine-based equations compared to cystatin C-based equations (mean SD of creatinine-based equations was 39.1% compared to 29.9% for cystatin C-based equations). The cystatin C-based equations (CKD-EPIcombined, CKD-EPIcystatin C and cystatin Cvan Deventer) showed a concentration bias effect, i.e. more positively biased at lower mGFR. There was no concentration bias effect for the MDRD or Cockcroft–Gault equation.
Accuracy within 15 and 30% of mGFR
Accuracy within 30% of mGFR ranged from 56.7% for the Cockcroft–Gault equation to 78.0% for the CKD-EPIcombined without ethnicity factor equation (Table 2). Using the McNemar test accuracy within 30% was higher for the MDRD equation without ethnicity factor (59.8%) than for the MDRD equation with ethnicity factor, 48.3% (P = 0.001). P15 and P30 were significantly better for the CKD-EPI equation without the ethnicity factor (35.1 and 62.9%) compared to the CKD-EPI equation with ethnicity factor, 24.7 and 41.2% (P = 0.05 and P < 0.0001, respectively). Using the McNemar test P15 and P30 were not significantly different between the MDRD equation without ethnicity factor and the CKD-EPI equation without ethnicity factor. P15 for the CKD-EPIcystatin C equation (42.3%) was better than for the MDRD equation without ethnicity factor, 27.8% (P = 0.007) but not statistically better than the CKD-EPI equation without ethnicity factor (35.1%). P15 and P30 were significantly better for the CKD-EPIcombined without ethnicity factor equation than for the CKD-EPI equation without ethnicity factor (P = 0.003 and P = 0.002, respectively) (Table 2 and Addendum Table 1).
Sensitivity for predicting mGFR <60 mL/min/1.73 m2
While none of the creatinine-based equations had a good sensitivity for predicting mGFR <60 mL/min/1.73 m2 (Table 2), sensitivity was higher for cystatin C-based equations. Sensitivity for the CKD-EPIcystatin C equation was 75% and for the CKD-EPIcombined equation without ethnicity factor was 69%. For all creatinine-based equations, sensitivity was less than 50%.
Discussion
Here we report on the performance of GFR estimating equations using creatinine and cystatin C with and without the ethnicity factor in a group of antiretroviral-naive HIV-positive patients. The results of this study show that eGFR varies depending on the equation used and that cystatin C-based equations perform better than creatinine-based equations. This is in keeping with a number of other studies that have shown cystatin C to be superior to creatinine-only based equations in the general population24,31 as well as in HIV-infected individuals.32,33 These results have implications for the clinical use of GFR estimating equations in the HIV-positive population.
In the context of HIV infection, impaired kidney function develops as a result of various risk factors including ageing, genetic factors and the burden of HIV infection itself. The World Health Organization recommends screening for renal disease using eGFR prior to initiation of therapy with TDF. 34 The most commonly used equations are the MDRD and the Cockcroft–Gault equations, which result in overestimation of mGFR. Following a review of the current literature, the authors could not find recommendations as to which eGFR equation should be used for patients initiating TDF therapy although all guidelines recommend that GFR should be estimated at the beginning of therapy and periodically thereafter.
The MDRD equations have been shown to have varying accuracy in different population groups.30,35,36 This has been attributed to variations in non-GFR determinants of serum creatinine such as muscle mass and diet which may be affected by acute and chronic disease. 37 In our study the CKD-EPI equation was not superior to the MDRD equation in antiretroviral naive HIV-positive patients. This is in contrast to Inker et al. who noted that the CKD-EPI equation performed better than the MDRD equation in HIV-infected patients on antiretroviral therapy. 20 They used iohexol clearance as a gold standard on clinic patients while we used 51Cr-EDTA plasma clearance and our patients were in-patients. A systematic review of estimating equations for GFR showed that neither the MDRD nor the CKD-EPI is optimal for all population groups but that the use of the CKD-EPI would lead to a smaller average bias in clinical practice. 38 It remains to be determined if this is true in African populations.
In this study, inclusion of the African–American ethnicity factor in the MDRD and CKD-EPI equations resulted in an overestimation of mGFR. This improved when the ethnicity factor was not included. An explanation for this may be the patient population selected, who are HIV-infected hospital in-patients and thus more likely to have decreased muscle mass due to muscle wasting and malnutrition.39,40 The MDRD ethnicity factor was based on an African–American population (largely descended from West Africa) with CKD and hence it may not be equally applicable to all African populations and those without CKD.
Wyatt et al. have previously investigated estimation of GFR in an antiretroviral-naive population, using iohexol clearance for measured GFR. 36 Accuracy within 30% of mGFR was 83% when the ethnicity factor was not used compared to 73% when it was. 36 This is higher than the accuracy shown in the present study. It is not clear if the alkaline picrate method used was IDMS-traceable. They used dried blood spot measurement of iohexol clearance as a gold standard on clinic patients while we used 51Cr-EDTA plasma clearance. Madala et al. have also shown, using (99 m)Tc-DTPA-measured GFR, that inclusion of the African–American ethnicity correction factor in black South Africans resulted in 17.1% overestimation of mGFR compared to 5% without the use of the ethnicity factor. 41
Cystatin C concentration is considered independent of muscle mass and dietary influences which may explain the better performance in our population subgroup. Of note, the mean BMI of the group was 20.9 kg/m2. While cystatin C is independent of muscle mass, it may be influenced by adiposity and by inflammation. 42 This may explain the different performance of cystatin C-based equations observed in a number of studies. In transplant patients, cystatin C-based equations gave better 30 and 50% accuracy compared with creatinine-based equations. 43 Only a few studies have looked at the performance of cystatin C-based equations in HIV patients, often with contradictory results. In HIV patients on treatment, Inker et al showed that cystatin C was less accurate for GFR <60 mL/min/1.73 m2, 44 while in a small group of HIV-positive patients the cystatin Cvan Deventer equation was more precise than the MDRD or the CKD-EPI equation. 24 Similarly, cystatin C eGFR was more precise than MDRD in a group of Thai HIV patients. 45 Driver et al. showed that cystatin C eGFR were more strongly associated with mortality risk than creatinine eGFR. 33
Our study has limitations, the first one being the relatively small sample size. As a result, there were very few patients within each CKD group and most of the study cohort did not have CKD. However, although most patients in the study did not have GFR <60 mL/min/1.73 m2, a study by Jose et al. examining the decline of renal function following initiation of TDF demonstrated that an eGFR of <75 mL/min/1.73 m2 at the start of therapy was associated with an increased risk of discontinuing TDF and an eGFR of <90 mL/min/1.73 m2 at the time of discontinuation was associated with an increased risk of incomplete reversibility. 46 Jose et al. advise renal monitoring during TDF therapy and discontinuation of therapy for those with declining renal function, 46 hence the importance of estimating GFR as accurately as possible in this group. Second, we did not measure urinary protein excretion. Third, the study was conducted in in-patients although GFR measurements were not carried out when they were acutely ill. Strengths of the study are that GFR was measured using a 51Cr-EDTA plasma clearance method and that the study was able to evaluate various commonly used eGFR equations (both creatinine-based and cystatin C-based) in a population (African HIV-positive antiretroviral-naive patients) for whom accurate eGFR measurement is important.
Epidemiological studies have shown that the prevalence of stage 3 CKD is about 10% in the western world.47,48 Whilst population-based data on the burden of CKD in Africa are lacking, a systematic review and meta-analysis of 21 medium- and high-quality studies from Africa noted a prevalence of 13.9% (95%CI 12.1–15.7). 49 In this study, using mGFR, 16% of all patients had GFR <60 mL/min/1.73 m2. The estimated prevalence varies depending on the method used to estimate GFR. 50 Among the elderly and in the general population, the prevalence was shown to be much higher when the MDRD formula was used compared to when cystatin C-based equations were used.51,52 We also showed that eGFR in our HIV-infected population differed based on the eGFR equation used. Moving from the MDRD equation to the CKD-EPIcombined would decrease the estimated prevalence of CKD, which has major public health implications. 53 In our study, cystatin C-based prediction equations had a smaller bias compared to creatinine-based equations and the smallest bias was observed for the CKD-EPIcombined equation. Given that cost is a prohibitive factor in Africa it may not be practical at this stage to recommend the widespread use of cystatin C-based estimation of GFR and the small size of our study did not allow identification of a subgroup to identify a subgroup that may benefit from it. In the South African context, the use of CKD-EPI or MDRD equations without ethnicity factor may be the most practical option for estimating GFR.
Footnotes
Acknowledgements
We thank the patients who participated in this study, the National Health Laboratory Service for funding mGFR and Siemens Diagnostics for the cystatin C assays.
Declaration of conflicting interests
None declared.
Funding
Siemens diagnostics supplied the kits for cystatin C determination and the National Health Laboratory Services funded measured GFR determination but neither funder played any role in study design, analysis or interpretation of data.
Ethical approval
The Human Research Ethics Committee of the University of Witwatersrand (Clearance certificate number M10410) approved the study.
Guarantor
JAG.
Contributorship
TS collected the data, obtained ethical permission and wrote the first draft. GPC carried out the radioactive studies and contributed to the final draft, VG and HED carried out statistical analysis, interpretation and revisions to the article and JAG conceptualized the study, interpreted data and revised the article. All authors reviewed and edited the manuscript and approved the final version of the manuscript
References
Supplementary Material
Please find the following supplemental material available below.
For Open Access articles published under a Creative Commons License, all supplemental material carries the same license as the article it is associated with.
For non-Open Access articles published, all supplemental material carries a non-exclusive license, and permission requests for re-use of supplemental material or any part of supplemental material shall be sent directly to the copyright owner as specified in the copyright notice associated with the article.