
Abstract
Background
UK Clinical laboratories have been routinely reporting an estimated glomerular filtration rate (eGFR) based on creatinine measurements using an eGFR equation since the early 2000s. Though there have been recommendations to use enzymatic based creatinine assays, and a recommendation of which equation to use, there still remains a high degree of variation in calculated eGFR results.
Methods
Data from the UK NEQAS for Acute and Chronic Kidney Disease Scheme have been reviewed to look at the CKD equations that are currently in use in the UK and the impact on eGFR results reported. The UK NEQAS for Acute and Chronic Kidney Disease has over 400 participants measuring creatinine across all major clinical biochemistry platforms.
Results
An audit of EQA registration against results returned showed that in February 2022 at most 44% of registered participants were correctly reporting the 2009 CKD-EPI equation. At higher creatinine concentrations (which give rise to lower eGFR results), the spread of eGFRs is tight and there is little difference between results from different method principles. However, at lower creatinine concentrations, where it is known that there is more variation in creatinine depending on method choice, both method principle and eGFR equation choice can influence calculated eGFR. In some cases, this can impact CKD Stage classification.
Conclusions
CKD is a serious public health issue that requires accurate assessment of eGFR. Laboratories should be in constant dialogue with their renal teams about their creatinine assay performance and impact on eGFR reporting across their service.
Introduction
Estimating a patient’s glomerular filtration rate (eGFR) is widely used not only to assess whether they have any form of kidney disease (by assessing their current renal function), but is also used to assist with drug dosing when renal clearance is required. The NICE Guidelines of 2014 on chronic kidney disease (CKD) management in adults recommended that clinical laboratories report an estimate of glomerular filtration rate (eGFR) on all creatinine requests. 1 However, equations are not applicable to some sub-populations, for example, pregnant women. Calculations for eGFR pre-date this NICE guidance and partly assisted the drive for standardisation of creatinine assays in the noughties.2,3 The 4-variable Modification of Diet in Renal Disease (4V-MDRD) equation was developed in 1999 and was later proposed as the best estimate of eGFR.4,5 The 4V-MDRD equation uses the patient’s laboratory creatinine result, gender, age and ethnicity to determine an eGFR. The 4V-MDRD equation changed the multiplier factors from 186 to 175 in 2006. The 175 variant required laboratories to use standardised creatinine assays – where the assay is specific for creatinine and the calibration is traceable to Isotope Dilution Mass Spectrometry (ID-MS), whereas the 186 doesn’t require standardised creatinine assays. The main problem mid-noughties was that creatinine assays were not standardised.6-8
UK NEQAS (United Kingdom National External Quality Assessment Services) were asked by the Department of Health, in 2005, to address the national variation in eGFR reporting and method specific slope and intercept equations were developed to harmonise the creatinine results across methods. 9 This was only ever intended to be a temporary solution because at the same time manufacturers were reviewing and standardising their creatinine assays. 10 An External Quality Assessment (EQA) Scheme was also developed at this time to externally monitor the quality of creatinine assays and the reporting of eGFR. This was known as the UK NEQAS for GFR Estimations but in 2021 changed its name to the UK NEQAS for Acute and Chronic Kidney Disease Scheme when the AKI element was added. 11
In 2009, the Chronic Kidney Disease Epidemiology Collaboration developed a new equation for the estimation of eGFR, the 2009 CKD-EPI equation. 12 This equation is more complicated than the 4V-MDRD equation as it uses a 2-slope ‘spline’ which takes into account the creatinine concentration, but still requires the patient’s gender, age and ethnicity. Due to the complexity of the equation, uptake by laboratories was limited as it was difficult to integrate into some Laboratory Information Management Systems (LIMS). The 2009 CKD-EPI equation was found to be more accurate at eGFR values >60 mL/min/1.73 m2. 12 The National Kidney Disease Education Program recommends only reporting numeric eGFR values when <60 mL/min/1.73 m2. 13 This wasn’t the case with the NICE Guidelines for Chronic Kidney Disease 14 or the Scottish Intercollegiate Guidelines Network (SIGN) for Chronic Kidney Disease. 15 The SIGN Guidelines were withdrawn in June 2018.
By 2014, the NICE Guidance on Chronic Kidney Disease in adults recommended that clinical laboratories should use the Chronic Kidney Disease Epidemiology Collaboration (CKD-EPI) creatinine equation to estimate GFR for adults and should use creatinine assays with calibration traceable to standardised reference material. 1
Two significant events happened in 2021. NICE reviewed and updated their guidance on Chronic Kidney Disease – the ethnicity factor of the 2009 CKD-EPI equation was removed. 16 At a similar time, the Chronic Kidney Disease Epidemiology Collaboration reviewed and updated their CKD equation, also removing its ethnicity factor but more significantly changing other parts of the equation too. The 2021 CKD-EPI equation was released and recommended for use in USA.17,18 The 2009 CKD-EPI equation with the ethnicity factor removed is not the same as the 2021 CKD-EPI equation. A review of the removal of ethnicity adjustment is given in this journal. 19
It is a likely assumption that clinicians and other users of laboratory services believe that all clinical laboratories are using enzymatic creatinine assays since this has been advocated by UK NEQAS and by the Department of Health Creatinine Advisory Group for over fifteen years. Unless they have been informed otherwise, they may also assume that laboratories are reporting eGFR values using the 2009 CKD-EPI equation. Likewise, it may be assumed that there is little or no variation within a laboratory, hospital network or even across the entire service level. There is currently no guidance on what is an acceptable variation in eGFR, nor any mandatory monitoring or surveillance of this variation. Within an organisation, multiple manufacturers/multiple creatinine assays, or a single manufacturer/single assay system may be in use and it is incumbent on the laboratory, by means of a risk based approach, to define what is ‘acceptable performance’. Analytical bias within and between sites necessitate a requirement for managed control and assessment of the performance characteristics of ‘analytes’ and how they are going to be used. Systematic bias could lead to a significant shift of patients between CKD groups on comparison of the tested population. This could result in clinical consequences on how eGFR values are interpreted and how they are used within ongoing research studies. One such area of upcoming interest is the use of eGFR in the Kidney Failure Risk Equation (KFRE) which is included in the 2021 update to the NICE Guidance on chronic kidney disease: assessment and management. 16 eGFR is one factor of a derived equation that also utilises a patient’s urinary albumin creatinine ratio together with the patient’s age and gender.
Methods
Scheme Design for the CKD element of UK NEQAS for Acute and Chronic Disease Scheme
Three serum specimens are distributed monthly to participant laboratories that are enrolled in the Scheme. A single set of patient demographics (gender, age and ethnicity) are provided; these change every month. The laboratories are instructed to book the three specimens into their Laboratory Information Management Systems (LIMS) using the associated patient demographics as if they were from a patient. The laboratories then analyse the serum specimens for creatinine and each creatinine result should be processed through the eGFR equation which is stored within the LIMS. The laboratories then report both the serum creatinine and corresponding eGFR value for each specimen on the Birmingham Quality Results and Reports website.
Data analysis
Creatinine and eGFR are processed separately. In the UK NEQAS for Acute and Chronic Disease scheme outliers are removed by Healy trimming which is applied to all data. 20 This essentially leads to the highest and lowest 5% of data being removed from statistical calculations of means at the specimen level.
Creatinine results are evaluated at both method principle (for example compensated kinetic Jaffe or enzymatic) and at the manufacturer analyser level (Abbott Alinity, Roche Cobas etc). A mean, standard deviation and coefficient of variation is calculated for each method. However, the Target Value for all laboratories irrespective of the method that they are using for creatinine is the enzymatic method mean. The enzymatic method mean is considered to be the best estimate of the truth, as it is more specific for creatinine, which is one of the requirements of the NICE Chronic Kidney Disease recommendations for creatinine assays (and has been since 2014).1,16 This enzymatic method mean is periodically checked by the analysis of specimens using a Reference Method accredited to ISO/IEC 17025:2017. It is worth noting that interferences have been identified for enzymatic creatinine assays, for example negative interference with elevated catecholamines 21 and spuriously high enzymatic creatinine results on the Abbott Architect system with underfilled Lithium Heparin tubes. 22 Individual specimen percentage biases are combined to form a six month average bias score (B-score) with its corresponding six month consistency of bias score (C-score). The C-score is essentially the standard deviation of the individual bias score data. The B-score and C-scores can be interpreted individually by the laboratory, as part of an overall spread in box and whisker plots at a single distribution or multiple distributions (the so called Seismograph plot), or together in a Penalty Box plot – B-score on x-axis and C-score on y-axis – to allow assessment of an individual laboratory’s performance or that of an individual method.
Similarly, eGFR results are handled identically to creatinine results except the Target Values are specific for the equation being used and are calculated using the enzymatic method mean together with the relevant patient demographics when applied to either the 4V-MDRD or the 2009 CKD-EPI equations.4,12 To assist a laboratory in determining if it has been using the correct equation, the Scheme also calculates the participant’s expected eGFR value based on their own reported creatinine and the eGFR equation that they say that they are using. At Distribution 183 (February 2022), the patient demographics were a 50 year old white female.
Creatinine and eGFR data is displayed to participants, for each specimen, both in tabular and histogram format. They are also informed of their expected eGFR value for each specimen.
Audit of CKD equation use in February 2022
An audit was undertaken in February 2022 (Distribution 183) of data within the CKD element of the UK NEQAS for Acute and Chronic Kidney Disease scheme. At this point in time, 92% of participants were registered in the UK, 7% from the Republic of Ireland and less than 1% from overseas. The aim of the audit was to compare the eGFR values that were returned at that Distribution to the eGFR values that were calculated based on the eGFR equation that the participant reported that they were using. For every returned creatinine result, eGFR was calculated using the 4V-MDRD, 2009 CKD-EPI (both with and without ethnicity correction) and 2021 CKD-EPI equations. These results were compared to the actual eGFR values that were returned by the participant. The difference between the actual and the reported results was calculated. If the difference was −1, 0 and +1 it was deemed that there was a ‘match’ between the actual and the reported results and the participant was registered for the correct equation. A tolerance of +/− 1 was used to take into account any rounding issues for the creatinine in either the participant’s LIMS or on our system. If the difference was more than +/− 1 the reported eGFR values were reviewed to check comparability to the other eGFR equations. If there was no match with any of the three equations, it was determined that the laboratory had either made an error or was using a non-standardised equation.
Review of variation of eGFR
Variation of eGFR has been reviewed using both (i) eGFR data submitted through the scheme and (ii) that calculated by Birmingham Quality based on the creatinine result submitted by the laboratory and the corresponding eGFR equation that they have informed us that they are using–this is known as the expected eGFR result. (i) Actual eGFR value reported by participants
Ten different, but representative specimens, five for male and five for female scenarios (from 66 specimens distributed between March 2020 and March 2022) were selected for assessment of variation of reported eGFR. For each gender a similar range of creatinine concentrations (60–220 umol/L), and similar patient demographics (50–90 year old) were chosen. The ethnicity for all scenarios was ‘white’. The reason for this is that in the majority of LIMS ethnicity is not taken into account in the eGFR equation, but instead a comment is added to multiply the eGFR value by 1.159 if ‘black’.
12
The 10 specimens were prepared from different pooled serum (National Health Service Blood Transfusion, Filton, UK and TCS Biosciences, Buckingham, UK). Four specimens of native sera (no additions) were included and the remaining six specimens were serum with added creatinine (Merck Life Science UK Limited, Gillingham, UK). In total, eight different base pools were included in this evaluation to ensure composition of serum did not impact any method related biases. Data were evaluated using Microsoft Excel. Participants have the opportunity to amend their submitted EQA results for up to one month after they have received their EQA report; therefore, the majority of typographical and use of erroneous patient demographic data will have been corrected. Obvious outliers due to any remaining typographical errors were removed before data analysis. (ii) Expected eGFR calculated by Birmingham Quality
Expected eGFR values have been calculated by Birmingham Quality using the eGFR equation that the participant has registered for and which we assume it reports clinically, together with their submitted creatinine result. The expected eGFR value is then compared to the expected eGFR target (different targets for 4V-MDRD and 2009 CKD-EPI equations) to calculate B-scores (bias scores) and C-scores (consistency of bias scores). Data has been evaluated by manufacturer and method. The B-score and C-scores are rolling time average scores and include six months data which corresponds to 18 individual data points. The data shown in the so called penalty box plots of B versus C-scores is that at Distribution 184 (October 2021–March 2022) has one dot per participant. The seismograph plots are box and whisker plots (5th, 25th, 50th, 75th and 95th centiles) and uses data from March 2019 to March 2022. (iii) Data modelling on Specimen 183B by Birmingham Quality
The reported creatinine results for specimen 183B were used to calculate expected 4V-MDRD, 2009 CKD-EPI and 2021 CKD-EPI results for each returned creatinine based on the scenario of a 50 year old white female. All data, except obvious outliers due to typographical errors, were included.
Results
Audit of CKD equation use in February 2022
Paired Creatinine and eGFR results at Distribution 183 were returned by 441 participants out of a possible 451 registered laboratory codes (98% return rate). Figure 1 shows that 168 (38%) participants were using the 2009 CKD-EPI equation and were registered for the 2009 CKD-EPI equation in the UK NEQAS for Acute and Chronic Kidney Disease Scheme. There were a further 30 (7%) participants that registered themselves for both the 4V-MDRD and the 2009 CKD-EPI equations and 27 (6%) of these participants were correctly reporting 2009 CKD-EPI results. There were 5 (1%) of participants using the 2021 CKD-EPI equation and 8 (2%) participants who were returning 4V-MDRD results but were registered for the 2009 CKD-EPI equation. The 4V-MDRD equation was used correctly by 139 (32%) participants, 23 (5%) participants were returning 2009 CKD-EPI eGFR results but were registered for the 4V-MDRD equation and a further 60 (14%) participants were registered for the 4V-MDRD equation but were not returning results that were consistent with this or any of the three equations. In total, 335 (76%) participants were registered for the correct eGFR equation that they were returning results for. This meant that 106 (24%) of participants were not adequately monitoring their eGFR. Though this audit was based on a snapshot at a single distribution, for those participants where there were mismatches between results returned and the equation that they were registered for, the auditor reviewed results from the previous three distributions to make an assessment of whether there was a systemic problem. This was the case in all 106 participants recorded here. Range of eGFR equations in use in February 2022, in the UK NEQAS for Acute and Chronic Kidney Disease EQA Scheme, comparing returned results to those calculated using the equation that participants are registered for and creatinine results submitted at Distribution 183. There are four equations in use – 4V-MDRD, 2009 CKD-EPI, 2021 CKD-EPI and unknown equation.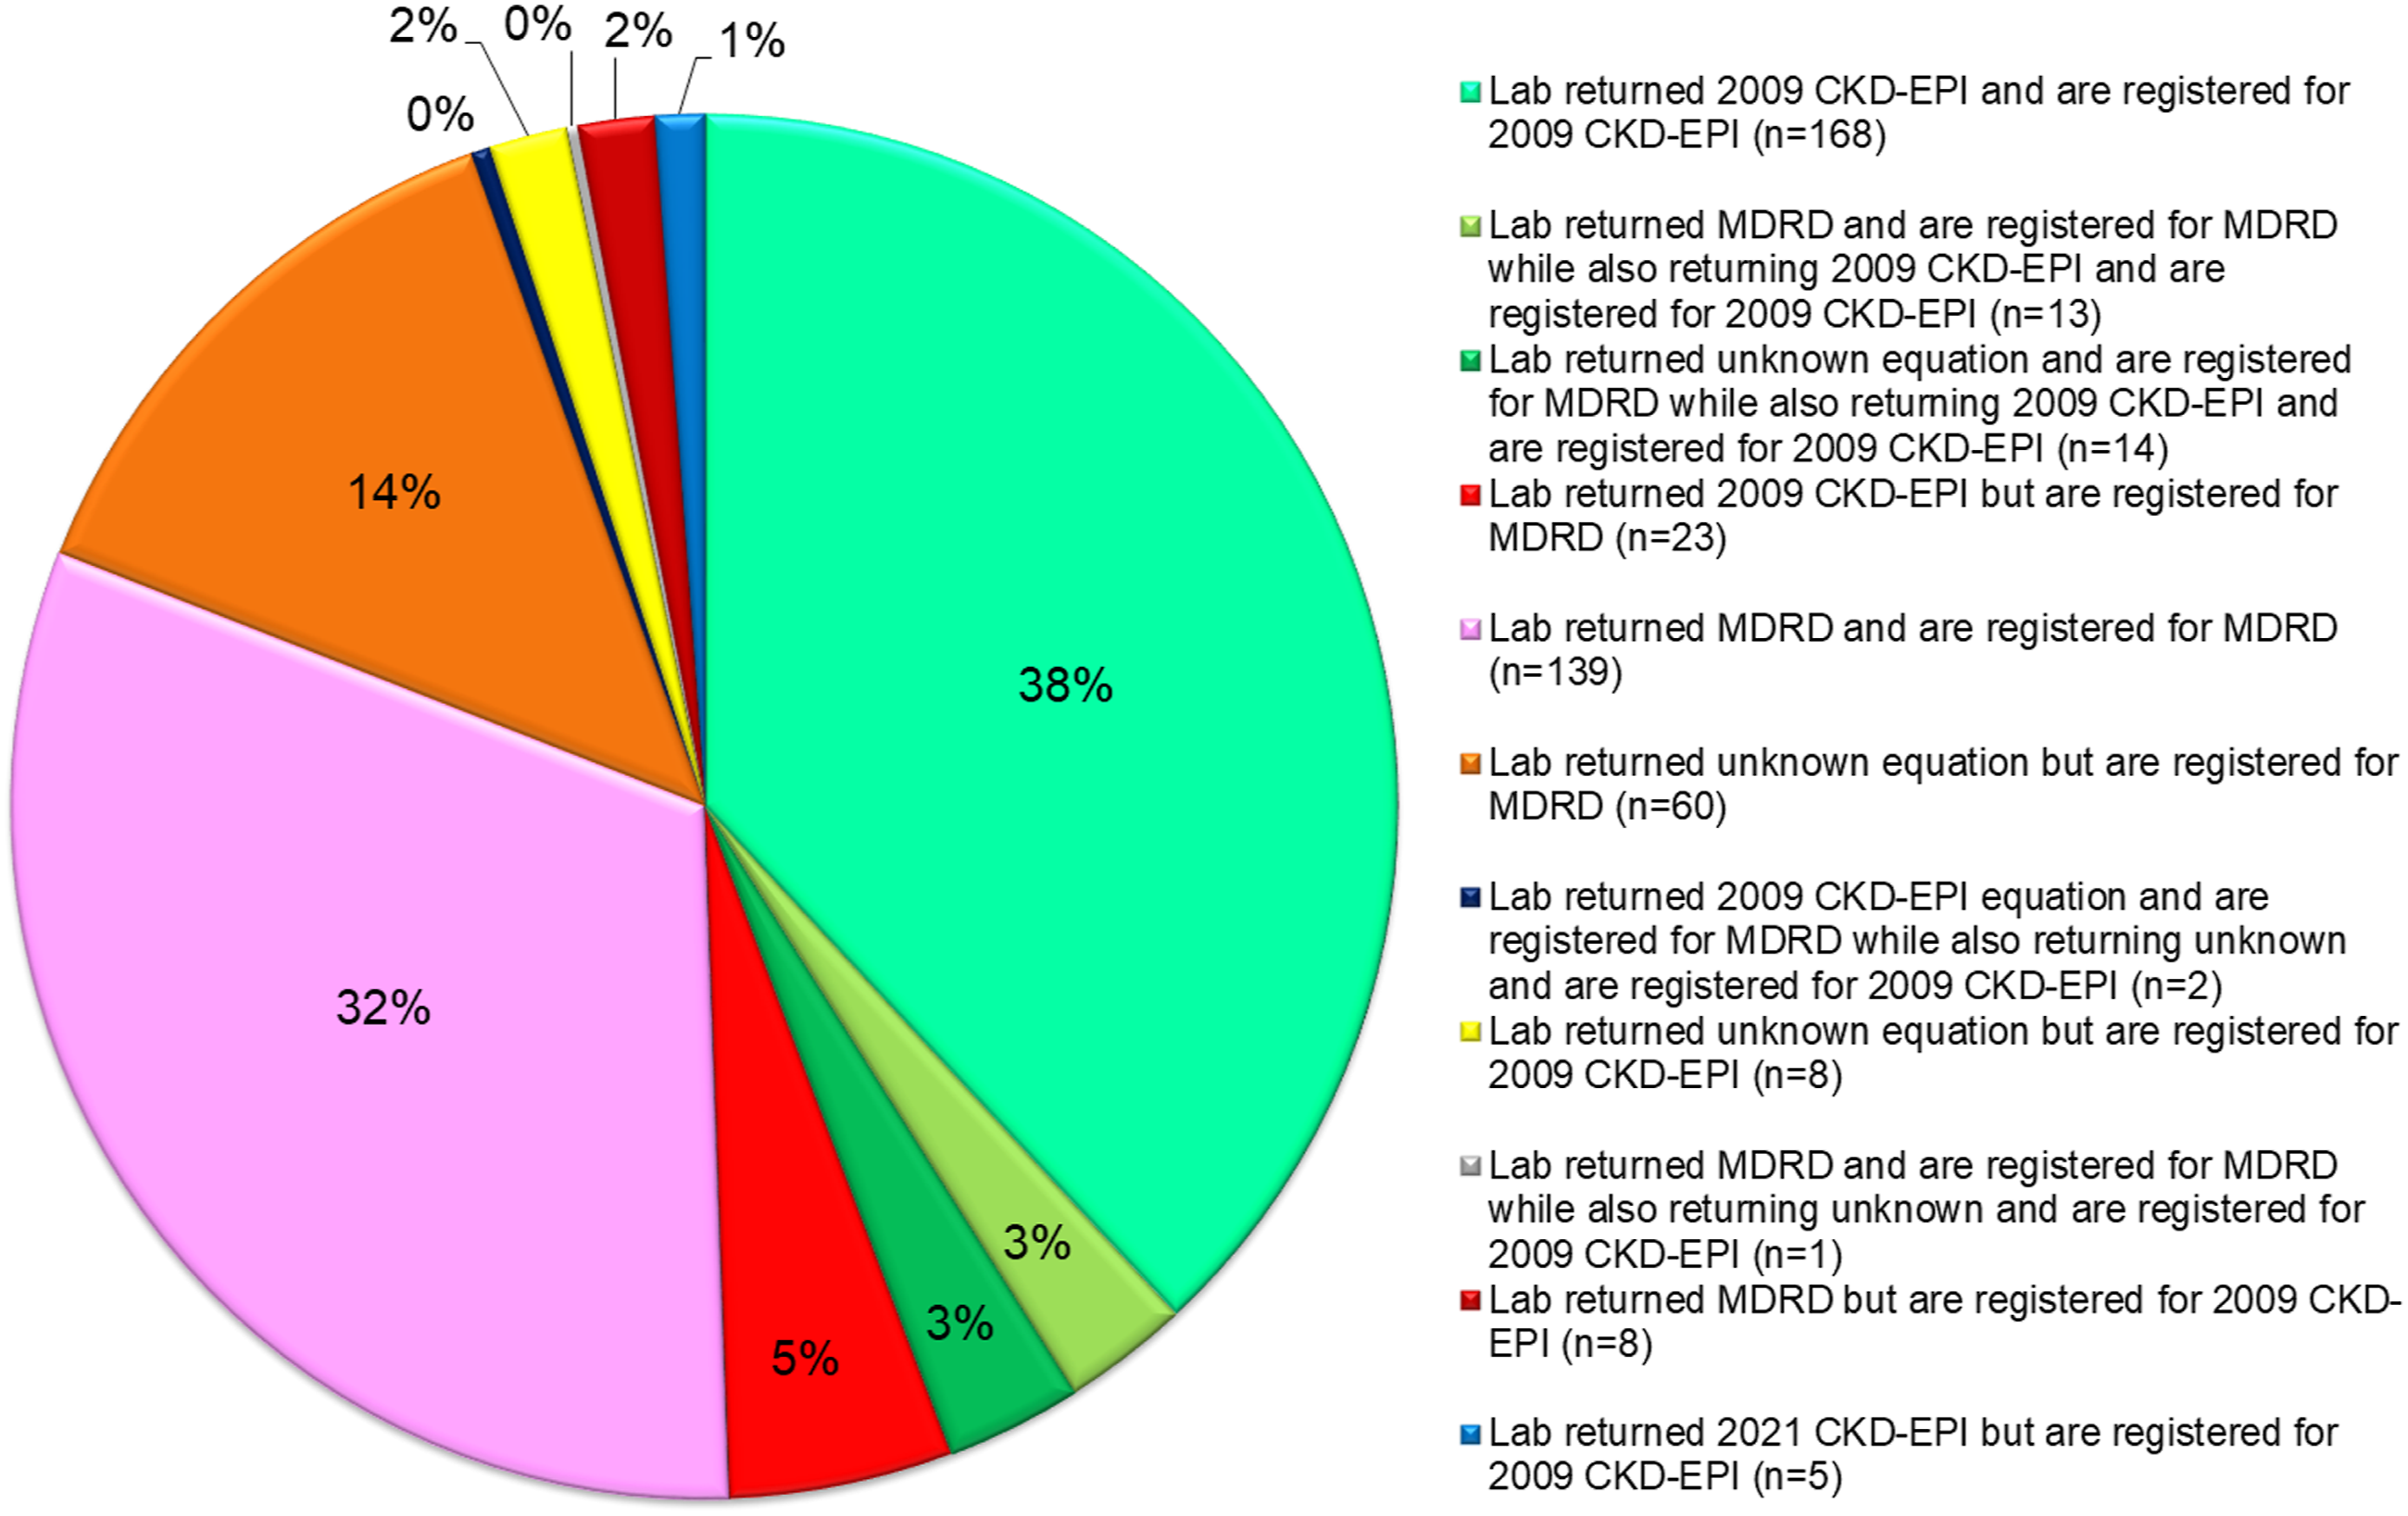
One of the major limitations of the audit is that it took the data in good faith as submitted through the UK NEQAS Scheme. A small number of participants may have made typographical errors with either of both the creatinine/eGFR results submitted or may have used incorrect patient demographics in the calculation of the eGFR result. This would only represent a small number of participants; therefore, the data has been included as this represents the true picture of what has been submitted for external quality assessment.
Review of eGFR Performance
eGFR performance has been reviewed in three ways: • Actual eGFR value reported by participants • Expected eGFR value based on reported creatinine • Modelled eGFR value based on reported creatinine (i) Actual eGFR value reported by participants
Review of actual eGFR is based on a representative selection of ten different specimens which were distributed to participants of the UK NEQAS for Acute and Chronic Kidney Disease scheme during March 2020–March 2022. Each specimen had a different patient demographic associated with it. The data from five male and five female scenarios is represented by box and whisker plots in Figure 2. The box and whisker plots show minimum to maximum reported eGFR with the box representing data within quartile 1 to quartile 3, which is the middle 50% of data. Data has been split by eGFR equation – 4V-MDRD (blue shaded) and 2009 CKD-EPI (not shaded), and within this Jaffe (squares) and Enzymatic (dots). The colour shading on the plot represent the different eGFR CKD Stages (CKD Stage 1 (dark green), 2, 3a, 3b, 4 and 5 (purples)). The first two specimens on each of the male and female scenarios are native pooled serum (no added analytes), whereas the specimens with creatinine concentrations greater than 100 umol/L had creatinine added. Eight different base materials of pooled serum, from two different suppliers, were used to ensure that any method related differences observed on the serum is not impacting the creatinine result and therefore eGFR performance. Box and whisker plots of eGFR results reported on 10 specimens (March 2020–March 2022) with different patient scenarios: (a) Male and (b) Female scenarios, broken down by 4V-MDRD (shaded blue) and 2009 CKD-EPI equation (non-shaded), and method principle, compensated kinetic Jaffe (squares) and enzymatic (dots). The colour shading on the plot represent the different eGFR CKD Stages (CKD Stage 1 (dark green), 2, 3a, 3b, 4 and 5 (purples)). Two different native serum specimens for each gender are included, and the remaining three specimens have added creatinine.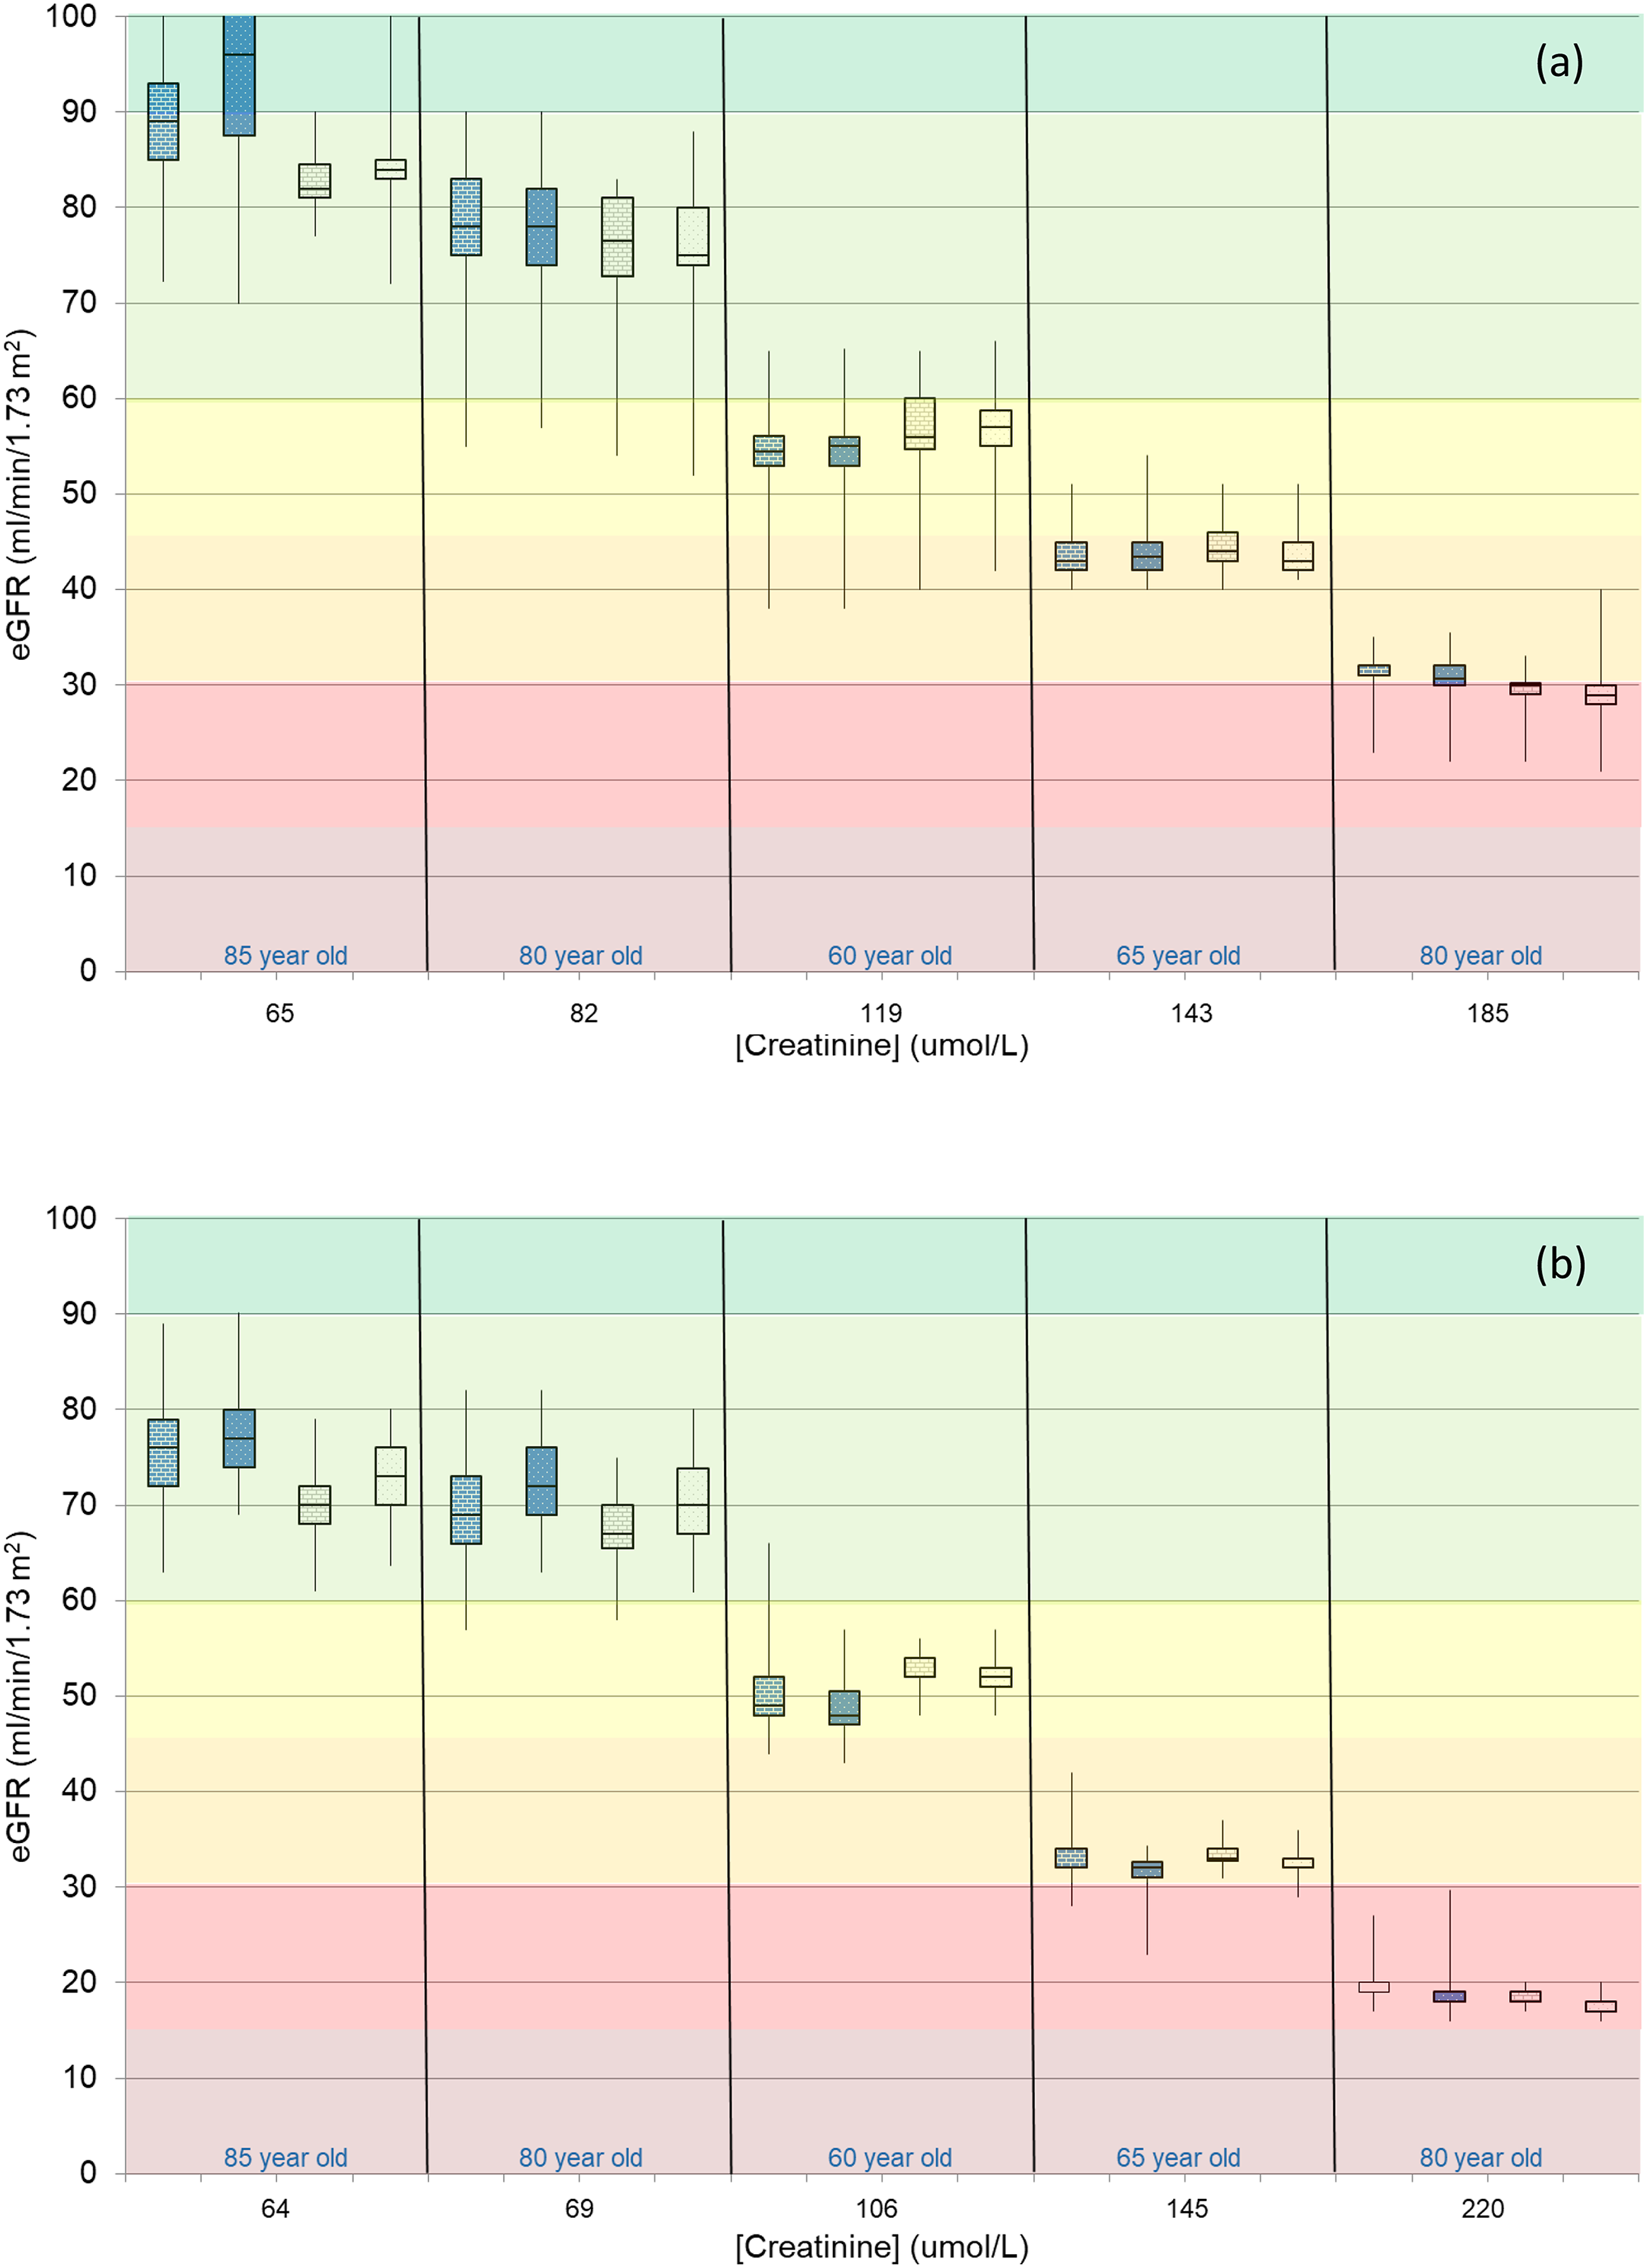
As the concentration of serum creatinine increases the reported eGFR decreases and for both males and females, the spread in eGFR values at higher creatinine (lower eGFR) is tighter than at lower creatinine (higher eGFR). Despite the tightness of the middle 50 percent of data at lower creatinine (higher eGFR), there is still a spread of results that in some cases spans more than one eGFR category.
When the data is reviewed for creatinine method principle, once again at higher creatinine concentrations there is minimal impact between the compensated kinetic Jaffe and the enzymatic method principles on the calculated eGFR, whether it is the 4V-MDRD equation or the 2009 CKD-EPI equation that is used. However, as the UK NEQAS for Acute and Chronic Kidney Disease Scheme has always shown, there are method principle related differences in the calculated eGFR at lower creatinine concentrations.
According to the 2014 NICE Guidance for Chronic Kidney Disease, clinical laboratories should report eGFR either as a whole number up to 90 mL/min/1.73 m,
2
or as greater than 90 mL/min/1.73 m
2
if above that. A number of participants (different for each specimen) have reported eGFR results as either >90 mL/min/1.73 m
2
or >60 mL/min/1.73 m
2
and this data is not included in the box and whisker plots of Figure 2. Conversely, a number of participants have reported numerical values >90 mL/min/1.73 m,
2
and this data has been included. This is particularly relevant for the first specimen in each plot. It is not known whether participants report actual numerical values >90 mL/min/1.73 m
2
to their users. At eGFR values of >60 mL/min/1.73 m,
2
the 4V-MDRD results are typically greater than the 2009 CKD-EPI result. This is to mitigate the known inaccuracy of the 4V-MDRD equation at higher eGFR values.
23
(ii) Expected eGFR value based on reported creatinine
The data shown so far has only been split by equation and over-arching method principle. eGFR data can also be reviewed by the manufacturer of the creatinine assay and the creatinine method used. The impact of variation caused by differences in eGFR equation has been minimised over the years by Birmingham Quality calculating and reporting back an expected eGFR from the participant’s reported creatinine result and the eGFR equation that they are reported to be using. This has allowed the laboratory to confirm that they are using the correct eGFR equation. Figure 3 shows Penalty Box plots for Expected eGFR, by the 4V-MDRD and 2009 CKD-EPI equations, for the major manufacturer-method combinations. Data are only shown where there are five or more users of a method. The y-axis shows the B-score (bias score) and the x-axis shows the C-score (consistency of bias score) all calculated using the expected eGFR results from 18 specimens over the previous six months, comparing the result to the equation specific target value determined by applying the enzymatic creatinine mean to the two equations. An ideal method has a low B-score and a low C-score. Two examples chosen to be representative of current laboratories are the Abbott Architect and the Roche Cobas compensated kinetic Jaffe assays. The Abbott Architect compensated kinetic Jaffe creatinine method for the 4V-MDRD equation shows a tight cluster for the 14 contributing participants. The bias is negligible and this is consistent as shown by a low B-score and low C-score. Conversely, the Roche Cobas compensated kinetic Jaffe creatinine method for the 2009 CKD-EPI equations shows a wider spread cluster for the 21 contributing participants. There is a negative bias with a median of 4.5% and the C-score (consistency of bias) has a higher value of 7.0. Penalty Box plots (Bias versus Consistency of Bias) for Estimated eGFR by 4V-MDRD and 2009 CKD-EPI equations for each of the major manufacturer-method combinations. Penalty Box plots are only included where there are 5 or more users of a method. A tilda (∼) is used when there is no data to show. Data shown for October 2021–March 2022.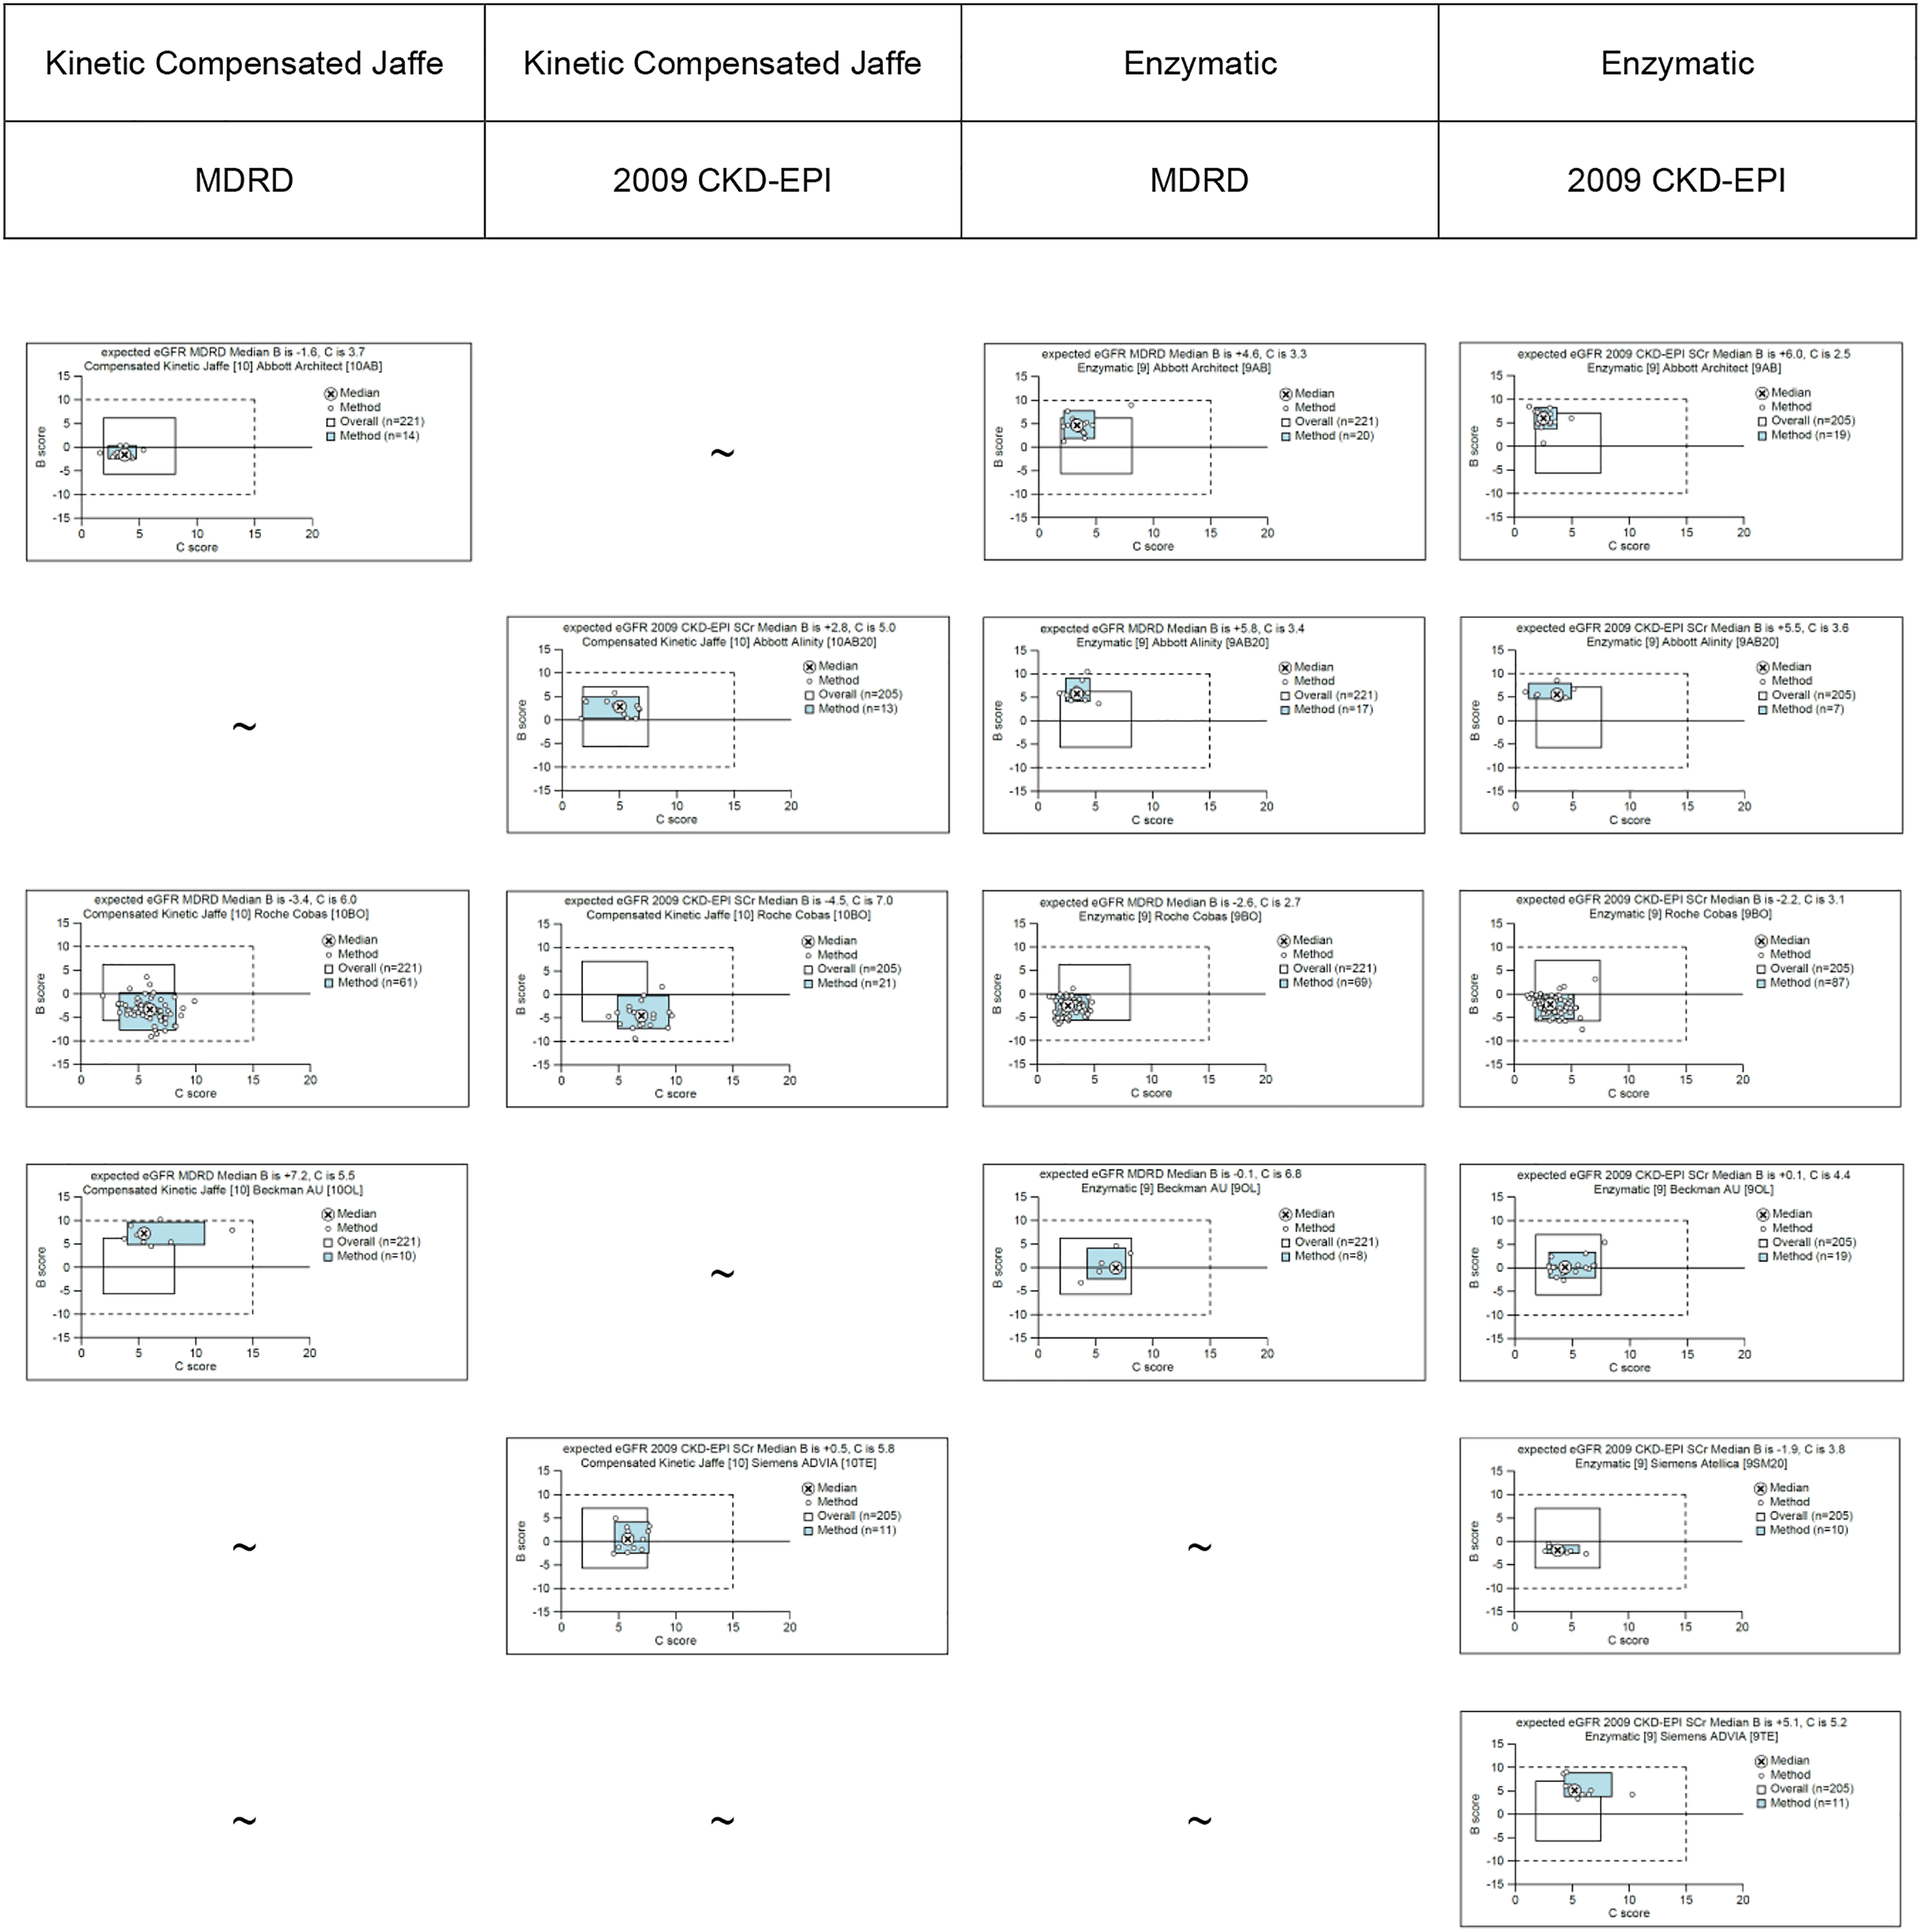
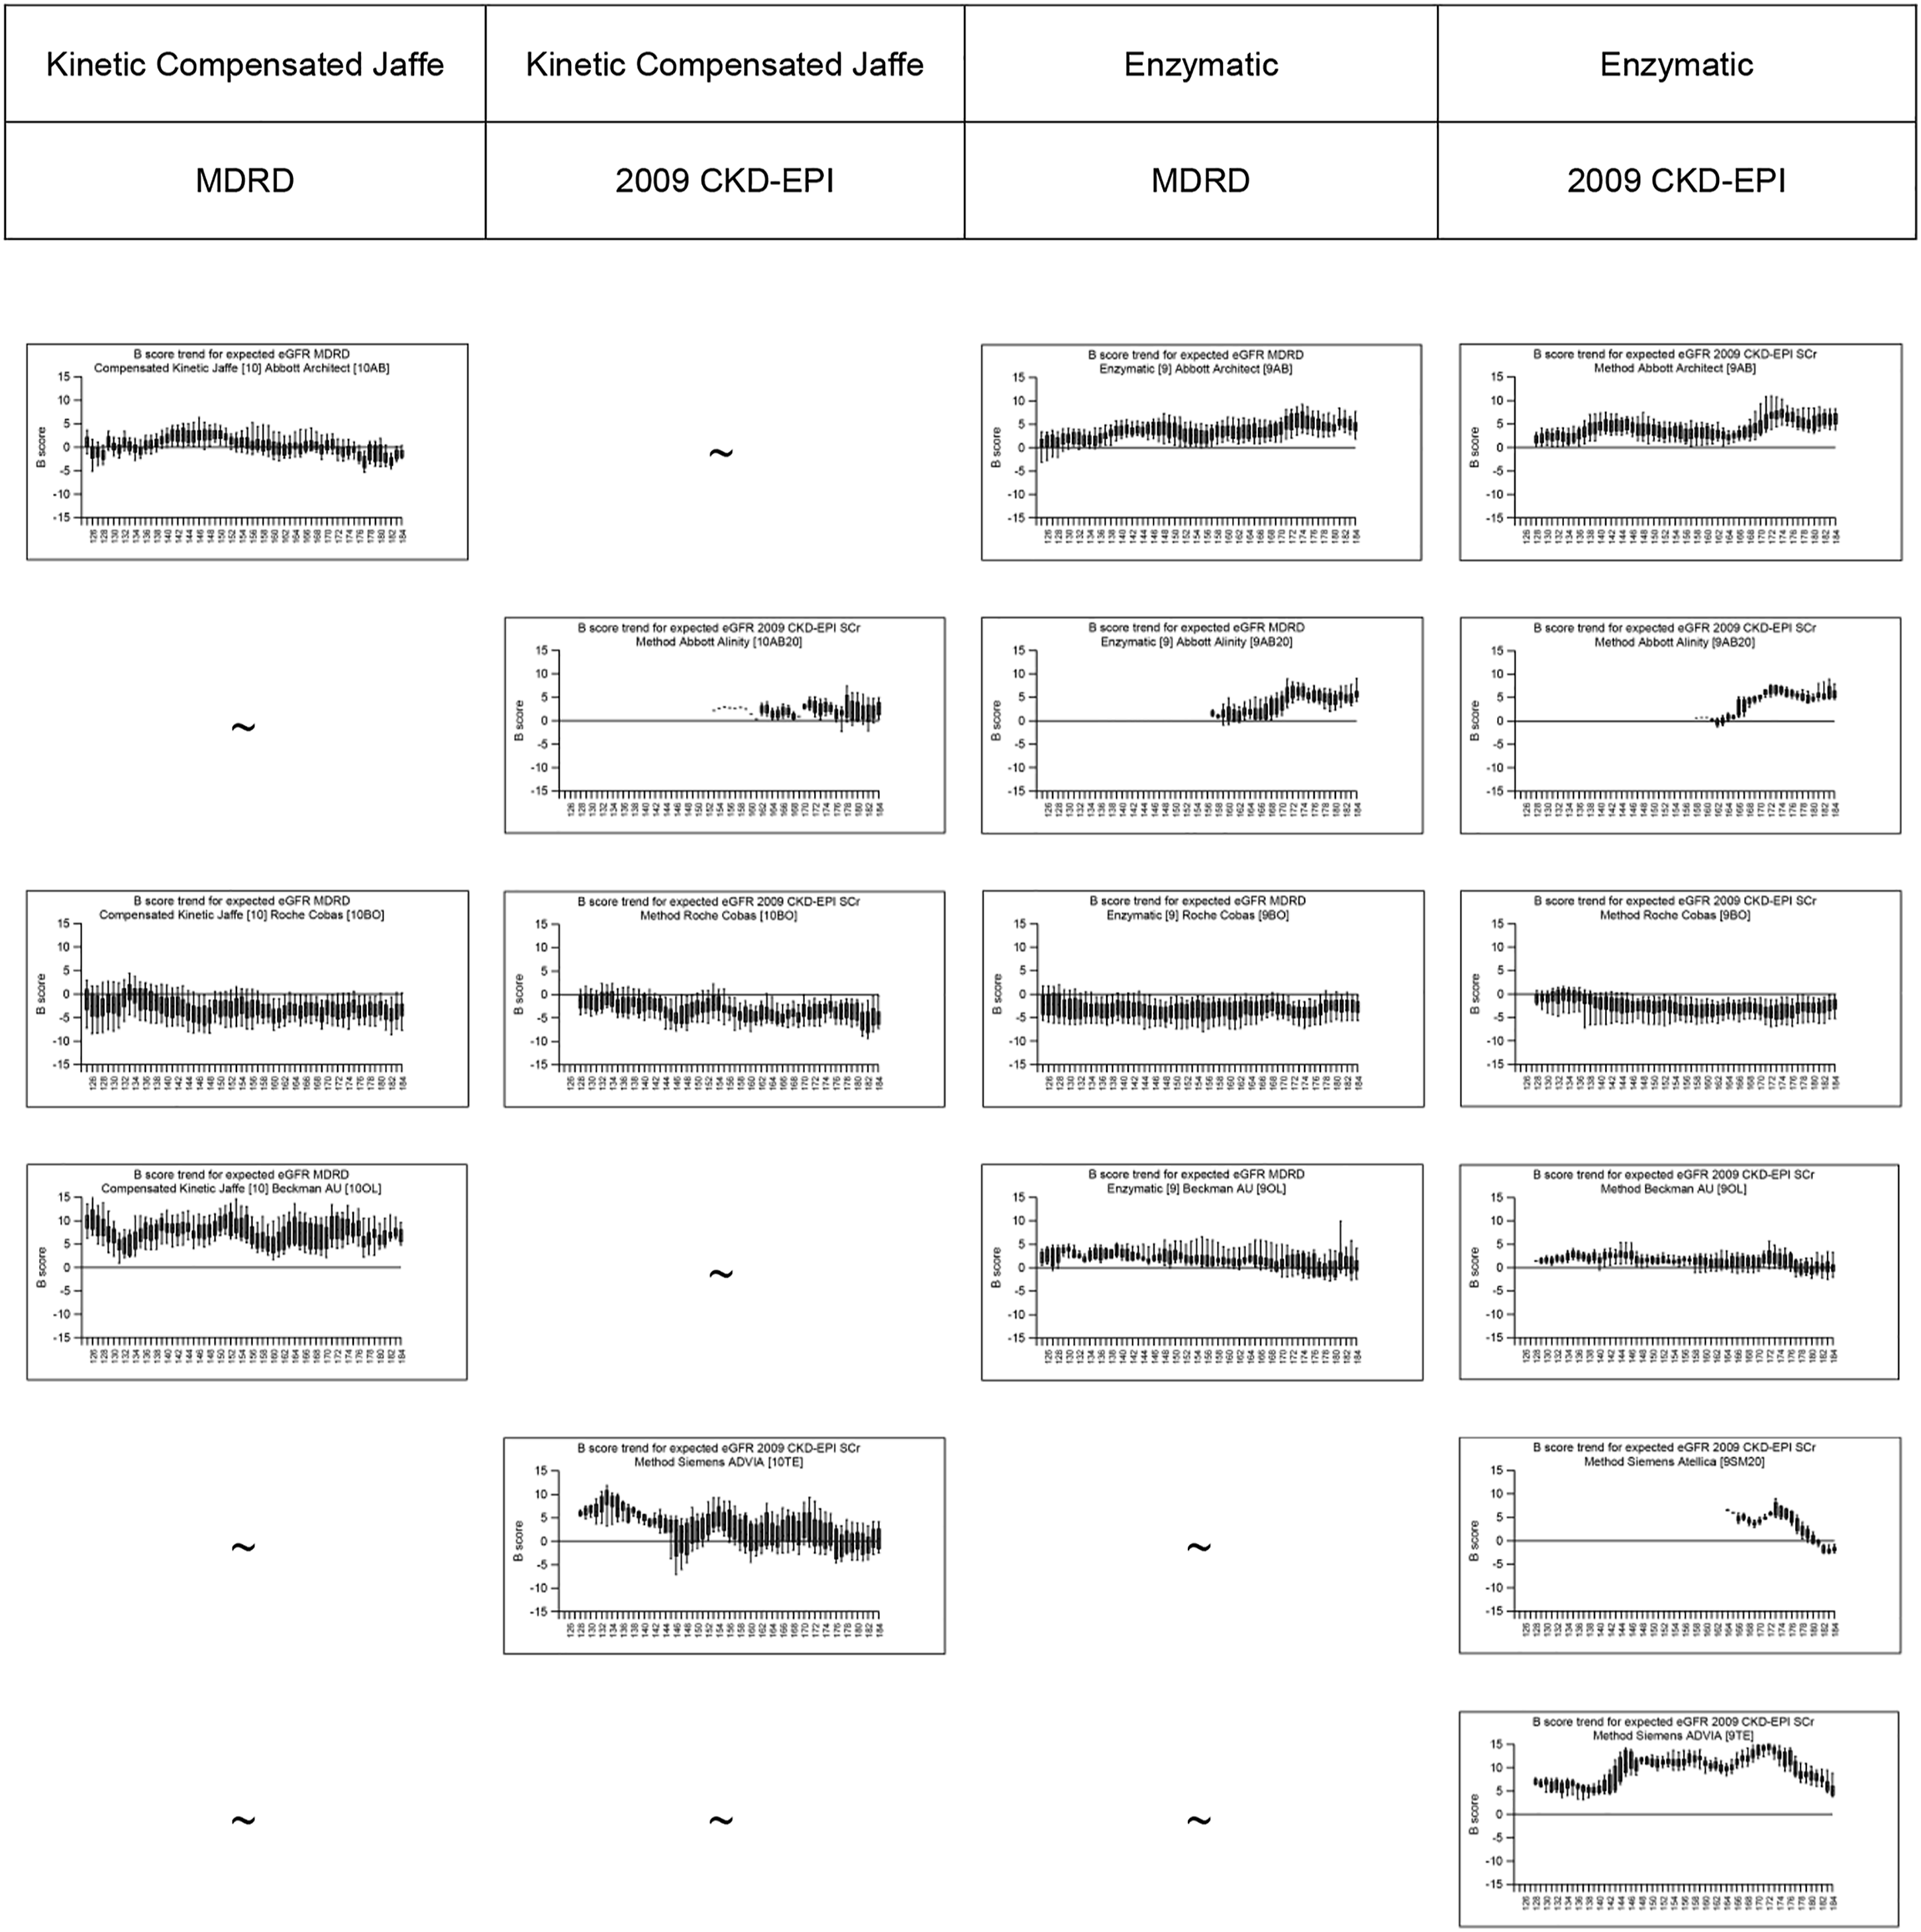
The Seismograph plots in Figure 4 show box and whisker plots of the spread of the B-score, for each manufacturer-method specific combination, for each of the two CKD equations, over the last five years. Once again data is only shown where there are five or more users of a method. This shows that there has been variation in the bias of the eGFR for a number of manufacturer-method combinations for both equations. The Roche Cobas enzymatic creatinine assay has given a 4V-MDRD eGFR with a constant negative bias over the last five years, which has remained fairly constant. However, the Siemens ADVIA enzymatic creatinine assay has given a 2009 CKD-EPI eGFR which has variable bias ranging from +5 to +15% over the last five years (more recently the bias has returned to +5% bias). (iii) Modelled eGFR value based on reported creatinine Seismograph plots (trend data of spread of B-scores over 5 years) for Estimated eGFR by 4V-MDRD and 2009 CKD-EPI equations for each of the major manufacturer-method combinations. Seisomogrpah plots are only included where there are 5 or more users of a method. A tilda (∼) is used when there is no data to show. [Note: Please view online to see in greater detail].
So far, eGFR data has been reviewed based on the eGFR reported and the expected eGFR calculated from reported creatinine results. This was expanded further to look at the potential impact of moving to the 2021 CKD-EPI equation. Figure 5 shows the range of eGFR values that would be calculated, for all three eGFR equations, based on the range of reported creatinine results on a single specimen (183B). The patient demographics were that of a 50 year old white female. The creatinine results ranged from 85 to 120 umol/L which translate to eGFR values ranging from 42 (4V-MDRD) to 73 (2021 CKD-EPI). This is a single example but the broad principle holds true for other scenarios and the UK NEQAS for Acute and Chronic Kidney Disease Scheme highlights the variation in reported eGFR, across the UK, every month. Spread of eGFR results that can be reported on a single specimen, using data modelling and applying the 4V-MDRD, 2009 CKD-EPI and 2021 CKD-EPI equations to all creatinine results that were reported on Specimen 183B. The scenario associated with this specimen was a 50-year-old white female. [Note: Please view online to see in greater detail].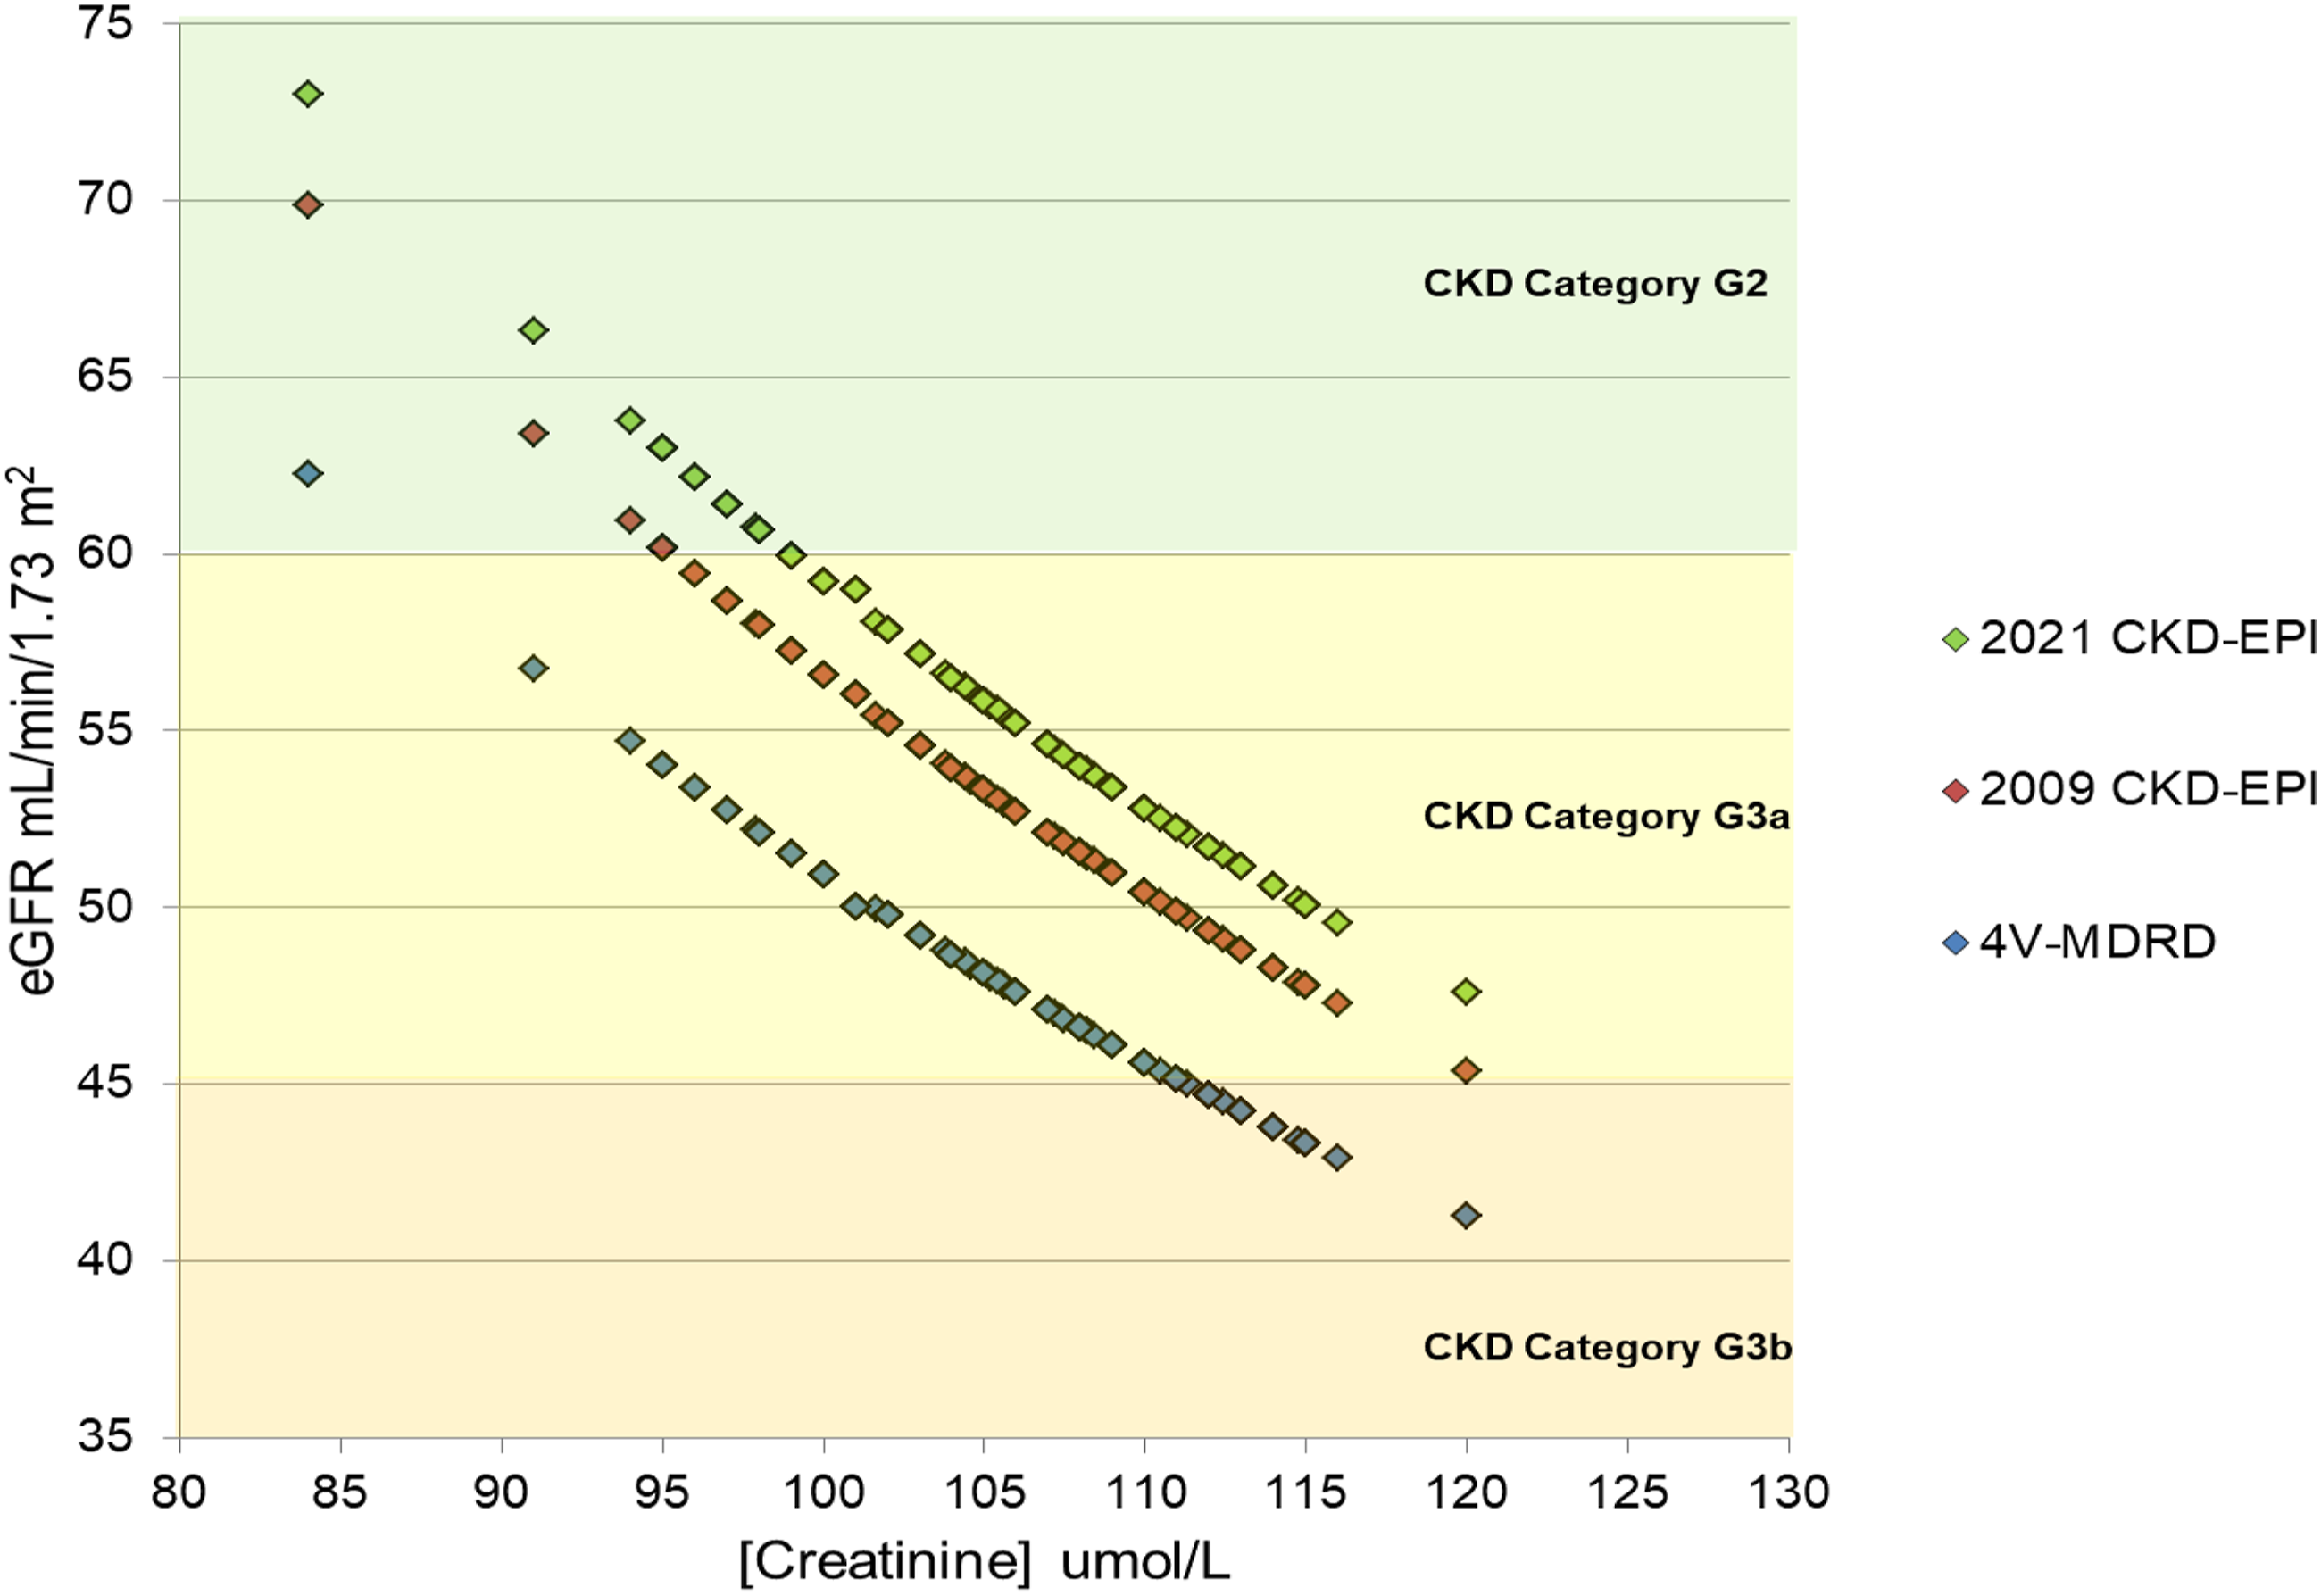
Discussion
Since the 2014 NICE Guidance for Chronic Kidney Disease: early identification and management of chronic kidney disease in adults in primary and secondary care (CG 182), 1 laboratories were recommended to use the CKD-EPI creatinine equation to estimate GFR creatinine for adults. This replaced the 4V-MDRD equation. 4 The UK NEQAS for Acute and Chronic Kidney Scheme showed that in February 2022 (Distribution 183) that at most 195 (44%) participants were registered for the 2009 CKD-EPI equation for eGFR and were reporting results that correlated with the eGFR expected based on the creatinine results that they had submitted. This is not what might have been expected based on the 2014 NICE Guidance. The NICE Guidance was updated in 2021 16 and the recommendation was still for clinical laboratories to use the CKD-EPI equation, but crucially it is not defined which CKD-EPI equation should be used. At the time of first publication, there was only one CKD-EPI equation, but by the time it was updated in November 2021, the 2021 CKD-EPI equation had been developed, published and recommended for use in America. 17 In our February 2022, audit 5 (1%) participants have already moved to the 2021 CKD-EPI equation. One of the major updates in the 2021 NICE Guidance 16 is the recommendation to remove ethnicity as a factor from the 2009 CKD-EPI equation. It may be unfortunate that this occurred at a very similar time to the release of the 2021 CKD-EPI equation as this may have led to some confusion amongst laboratories thinking that they were the same, or would give the same/similar results. They are not the same equation. The 2021 NICE guideline NG203 recommends use of the kidney failure risk equation derived using the 2009 CKD-EPI equation. A joint statement was issued on behalf of the ACB, NHS GIRFT, UK NEQAS and UKKA in early 2022 reminding laboratories that it is the 2009 CKD-EPI equation that should be used. 24
In February 2022, the UK NEQAS for Acute and Chronic Kidney Disease had 139 (32%) participants registered for the 4V-MDRD equation and returning the correct results for the 4V-MDRD equation. There are a further 60 (14%) participants registered for MDRD and returning results that do not match 4V-MDRD (or 2009 CKD-EPI) and 23 (5%) participants registered for MDRD but returning what appears to be 2009 CKD-EPI results. Though it may be comforting that there are another 5% of participants that appear to be using the 2009 CKD-EPI equation in their laboratory as they are registered for the 4V-MDRD analyte they are not adequately externally assessing the quality of the results that they are reporting by EQA as the Target Value will be that calculated for the 4V-MDRD equation. Also, the expected eGFR results that are reported back on reports will be those calculated based on the 4V-MDRD equation.
The 60 (14%) participants who are registered for the 4V-MDRD equation but are not returning eGFR results that match any of the three equations are of more concern. Birmingham Quality made contact with all laboratories that submitted eGFR results that did not correlate with the 4V-MDRD, 2009 CKD-EPI or 2021 CKD-EPI equation, based on the creatinine results provided. This identified a number of possible issues: • Continued use of the Method Specific Slope and Intercept Factors to adjust creatinine concentration so that the 4V-MDRD equation could be used • Use of the 4V-MDRD equation which was recommended prior to using standardised serum creatinine results — 186 factor used instead of 175 • The LIMS set code for requesting an eGFR for EQA specimens was different to that used for patients and had not been updated to reflect the correct equation
By far, the most common issue was the continued use of method specific slope and intercept factors introduced in 2006. This should have been stopped when laboratories moved to ID-MS traceable assays which are likely to have been before 2010. This is harder for laboratories to identify as the slope and intercept factors would have been put in place in 2005/2006 so would have been based on the creatinine assays that were in the laboratory at that point in time. If there has been no review, or no update of the LIMS in this time, it could be that the creatinine assay and/or manufacturer has changed potentially more than once since then, but the slope and intercept factors have remained within the system. It is difficult to assess the overall clinical impact of the continued use of incorrect slope and intercept factors as they were manufacturer specific. Siemens had an intercept factor of 17.78 and Roche Modular 3.08 so there is a wide difference in what could be erroneously calculated. 9
The results from our audit support that found in a 2019 survey by the College of American Pathologists, when 23% of 6200 laboratories reported eGFR using an incorrect equation, 34% use the 2009 CKD-EPI equation and 43% used the 4V-MDRD equation. 25
The variation in reported eGFR was reviewed by looking at reported eGFR values, expected eGFR values calculated based on reported creatinine results and the modelling of the impact of the differences of the 4V-MDRD, 2009 CKD-EPI and 2021 CKD-EPI equations when applied to a single specimen. All cases showed that there is a wide variation in eGFR values reported.
The non-specificity of creatinine assays at low creatinine concentrations means that there is more uncertainty in normal creatinine concentrations which results in higher imprecision at these lower concentrations as evidenced by the imprecision profiles of Creatinine through the UK NEQAS for Acute and Chronic Kidney Disease Scheme (data not shown). This corresponds with wider variation observed in eGFR values. Crucially, wide variation is still observed at creatinine concentrations about 100 umol/L which could translate to eGFR values <60 mL/min/1.73 m2. As creatinine concentrations increase the variation decreases but EQA shows that in some cases the reported eGFR value could span more than one eGFR category.
There are currently five major manufacturers providing creatinine assays in the UK – Abbott, Beckman, OCD, Roche and Siemens – within these there are sometimes more than one type of analyser. Apart from OCD, they all offer both compensated kinetic Jaffe and enzymatic creatinine assays (OCD utilises dry slide technology which is the enzymatic method principle). Laboratories will have the choice of whether they provide a compensated kinetic Jaffe creatinine assay or an enzymatic creatinine assay, but usually the manufacturer is determined by that used in the laboratory. All creatinine results can and are applied to either the 4V-MDRD, 2009 CKD-EPI or in a handful of cases the 2021 CKD-EPI equation. Variation in creatinine bias which is usually due to calibration or lot-to-lot variation is also seen in the CKD bias. Some assays are stable, some are not. EQA data can be used by laboratories to show this. Creatinine and eGFR stability is important for monitoring CKD as clinicians are looking to see if differences in results over time are due to a change in the patient’s renal function not assay variability.
Conclusion
It is well known that there are differences in the eGFR result calculated depending on which CKD equation is used. This is likely to be of little clinical significance for a patient that is routinely have their bloods taken for monitoring purposes. However, for a newly, undiagnosed patient, getting their correct GFR Category will be of the upmost importance if it affects their initial investigation, diagnosis and management. eGFR data is also widely used as part of clinical studies; therefore, for the validity of the study, it is important that the source of the eGFR equation is correctly identified and users are aware of this as well as limitations of the creatinine assays that are in use.
There is both an individual and a population impact of misclassification of patients in terms of CKD. Patient care and health economics of kidney disease outcomes needs to also be considered by laboratory service providers when they risk assess the specifications of the services that they provide.
The 2021 NICE Guidance for Chronic Kidney Disease assessment and management recommends that the 4-variable Kidney Failure Risk Equation is used to determine a person’s five year risk of needing renal replacement therapy (defined as the need for dialysis or transplant). 16 This equation requires eGFR to be calculated using the 2009 CKD-EPI equation. Currently, approximately 50% of participants in the UK NEQAS for Acute and Chronic Kidney Disease Scheme would not be able to provide this service. The Scheme does provide substantial coverage for EQA of eGFR across the UK; therefore, it can be extrapolated that potentially 50% of the UK will not be able to provide a KFRE risk result.
Monitoring CKD requires reliable, stable creatinine and eGFR results. EQA data shows that for some methods there is variation in the eGFR bias over time, which could impact patient management. We would advise that laboratories should be monitoring by EQA, or another mechanism, both the creatinine and eGFR performance on all analysers within a laboratory or hospital network. This provides laboratories with the most up to date information on their performance which they should be sharing with their service users. The renal clinician, laboratory relationship needs to exist and EQA data can be used to support discussions, whether for business cases, or discussions about the understanding of the risks in service provision.
Footnotes
Declaration of conflicting interests
The author(s) declared no potential conflicts of interest with respect to the research, authorship, and/or publication of this article.
Funding
The author(s) received no financial support for the research, authorship, and/or publication of this article.
Ethical approval
Ethical approval is not applicable.
Guarantor
RM.
Contributorship
Both authors contributed to the review of data, writing and review of manuscript.