
Abstract
Background
Infants with gastrointestinal conditions and poor weight gain are administered sodium supplementation based on urinary sodium concentrations. However, the reference range of urinary electrolytes is unknown. The aim of this study was to ascertain the normal values of urinary electrolytes in healthy, term infants. Secondary aims were to establish the relationship between urinary electrolytes with weight velocity and feeding practices.
Methods
Healthy, term (≥37 weeks’ gestation) infants were recruited. Parental questionnaires were completed before discharge and at six weeks. Electrolytes were quantified from a urine sample at six weeks. t-Tests and Mann-Whitney U tests were conducted for parametric and non-parametric electrolytes, respectively.
Results
A total of 200 infants were recruited before discharge. Twenty-nine follow-up questionnaires and urine samples were returned (nine female; mean gestational age 39 + 6 weeks [SD 9.9 days]; mean birthweight 3350 g [SD 483 g]; 17 breastfed, nine formula and three mixed; mean change in Z score for weight –0.914 [SD 0.814]). Majority (25/29) of infants had urinary sodium <20 mmo/L. Change in Z score for weight was similar between infants with sodium <20 mmol/L and >20 mmol/L (P = 0.78). All exclusively breastfed infants had sodium <20 mmol/L, however, not statistically dissimilar to formula-fed infants (P = 0.27).
Conclusion
Most term infants in this study had urinary sodium values <20 mmol/L with no identified relationship to weight velocity. Lower concentrations of sodium could be not quantified reliably because of the limitations of the analytical method that were used. More evidence is required to identify candidates for sodium supplementation.
Keywords
Introduction
Sodium is essential for somatic growth, and chronic deficiency may result in contraction of the extracellular compartment, failure to thrive and poorer neurodevelopmental outcomes.1,2 Sodium supplementation improves weight gain in preterm infants, and term infants where poor growth and increased sodium losses co-exist, such as the infant who fails to thrive after gastrointestinal surgery (e.g. ileostomy formation).3,4 The decision to start supplementation is usually determined by the sodium concentration of a urine sample; however, the concentration at which to start supplementation is variable because the range in normal, healthy infants is unknown. At our centre, the threshold for supplementation is <40 mmol/L. In many UK centres, a threshold of <20 mmol/L is used. 5 Our primary aim was to ascertain normal values of urinary sodium and potassium in healthy, term infants. Secondary aims were to establish the relationship of urinary sodium concentration to weight velocity and feeding practices.
Methods
A cross-sectional, observational study was conducted. Newborn infants were recruited prospectively from a maternity unit. Participants were term infants (37–42 weeks’ gestation) with no antenatal diagnosis, an uncomplicated postnatal course and exposed only to enteral nutrition. After consenting to participate, parents completed a questionnaire about their newborn before discharge from the maternity ward, determining gender, birthweight, gestation at birth, intended feeding method and medications. Parents were also given a similar questionnaire and an adhesive bag (Urinocol® bag, B Braun, Melsungen, Germany) to collect a spot urine sample. The questionnaire was to be completed and returned by post with the urine sample when the child reached six weeks. At six weeks, a routine community health check is scheduled for all infants. In an effort to obtain accurate measurements, parents were asked to record this weight in return questionnaires. No further contact was made with families after recruitment. Weight velocities were calculated as change in Z score for weight. 6
Urinary electrolytes (sodium and potassium) were determined in batch by in-direct (diluted) ion-selective electrodes using an Abbott Architect C16000 analyser. This CE marked method is only valid between 20 and 400 mmol/L. Imprecision of sodium and potassium assays was <3%, and %CV was 1.6 and 1.8, respectively. Urine creatinine was measured using kinetic alkaline picric acid method and results <0.4 mmol/L are not reported.
A power calculation determined a sample size of 135 and, to account for an anticipated participant drop-out rate, the target recruitment was 200 infants. t-Tests, Mann-Whitney U and Fisher’s exact tests were conducted.
Results
From 17 October 2016 to 4 December 2016, 200 infants were recruited (105 female; mean gestation 39 + 5 weeks [SD 8.7 days]; mean birthweight 3491 g [SD 488 g]; 119 breastfed, 62 formula and 19 mixed; six were administered medications other than vitamin K before discharge – in all cases, cefotaxime for sepsis risk factors [e.g. prolonged rupture of membranes] although no babies had subsequent confirmed sepsis). Twenty-nine completed second questionnaires and urine samples were returned (nine female; mean gestational age 39 + 6 weeks [SD 9.9 days]; mean birthweight 3350 g [SD 483 g]; 17 breastfed, nine formula and three mixed; median age in days at collection 47 (IQR 7); seven infants were administered medications regularly – six on Infacol® and two on Gaviscon® Infant). There were no significant differences between participants who completed the study (n = 29) and those who did not (n = 171) (Supplemental Table 1). The mean change in Z score for weight was –0.914 (SD 0.814).
Twenty-five of 29 infants had urinary sodium <20 mmol/L. Of the four infants with urinary sodium >20 mmol/L, one had a positive change in Z score for weight (Figure 1); however, there was a significant decline in Z scores for weight among the cohort overall. There was no significant difference in change in Z score for weight between infants with urinary sodium <20 mmol/L and >20 mmol/L (diff –0.40; CI –1.72 to 1.13; P = 0.78). All infants on regular medications had sodium <20 mmol/L. Mean urinary potassium concentration was 18.8 mmol/L (SD 11.7 mmol/L). Mean urinary potassium concentration of infants with positive and negative changes in Z score for weight was not statistically different (diff 2.58; CI –9.02 to 14.17; P = 0.62). All exclusively breastfed infants had urinary sodium <20 mmol/L; however, their urinary sodium values were not significantly different from infants fed with formula (P = 0.27). Electrolyte analysis results may be found within the supplementary material.
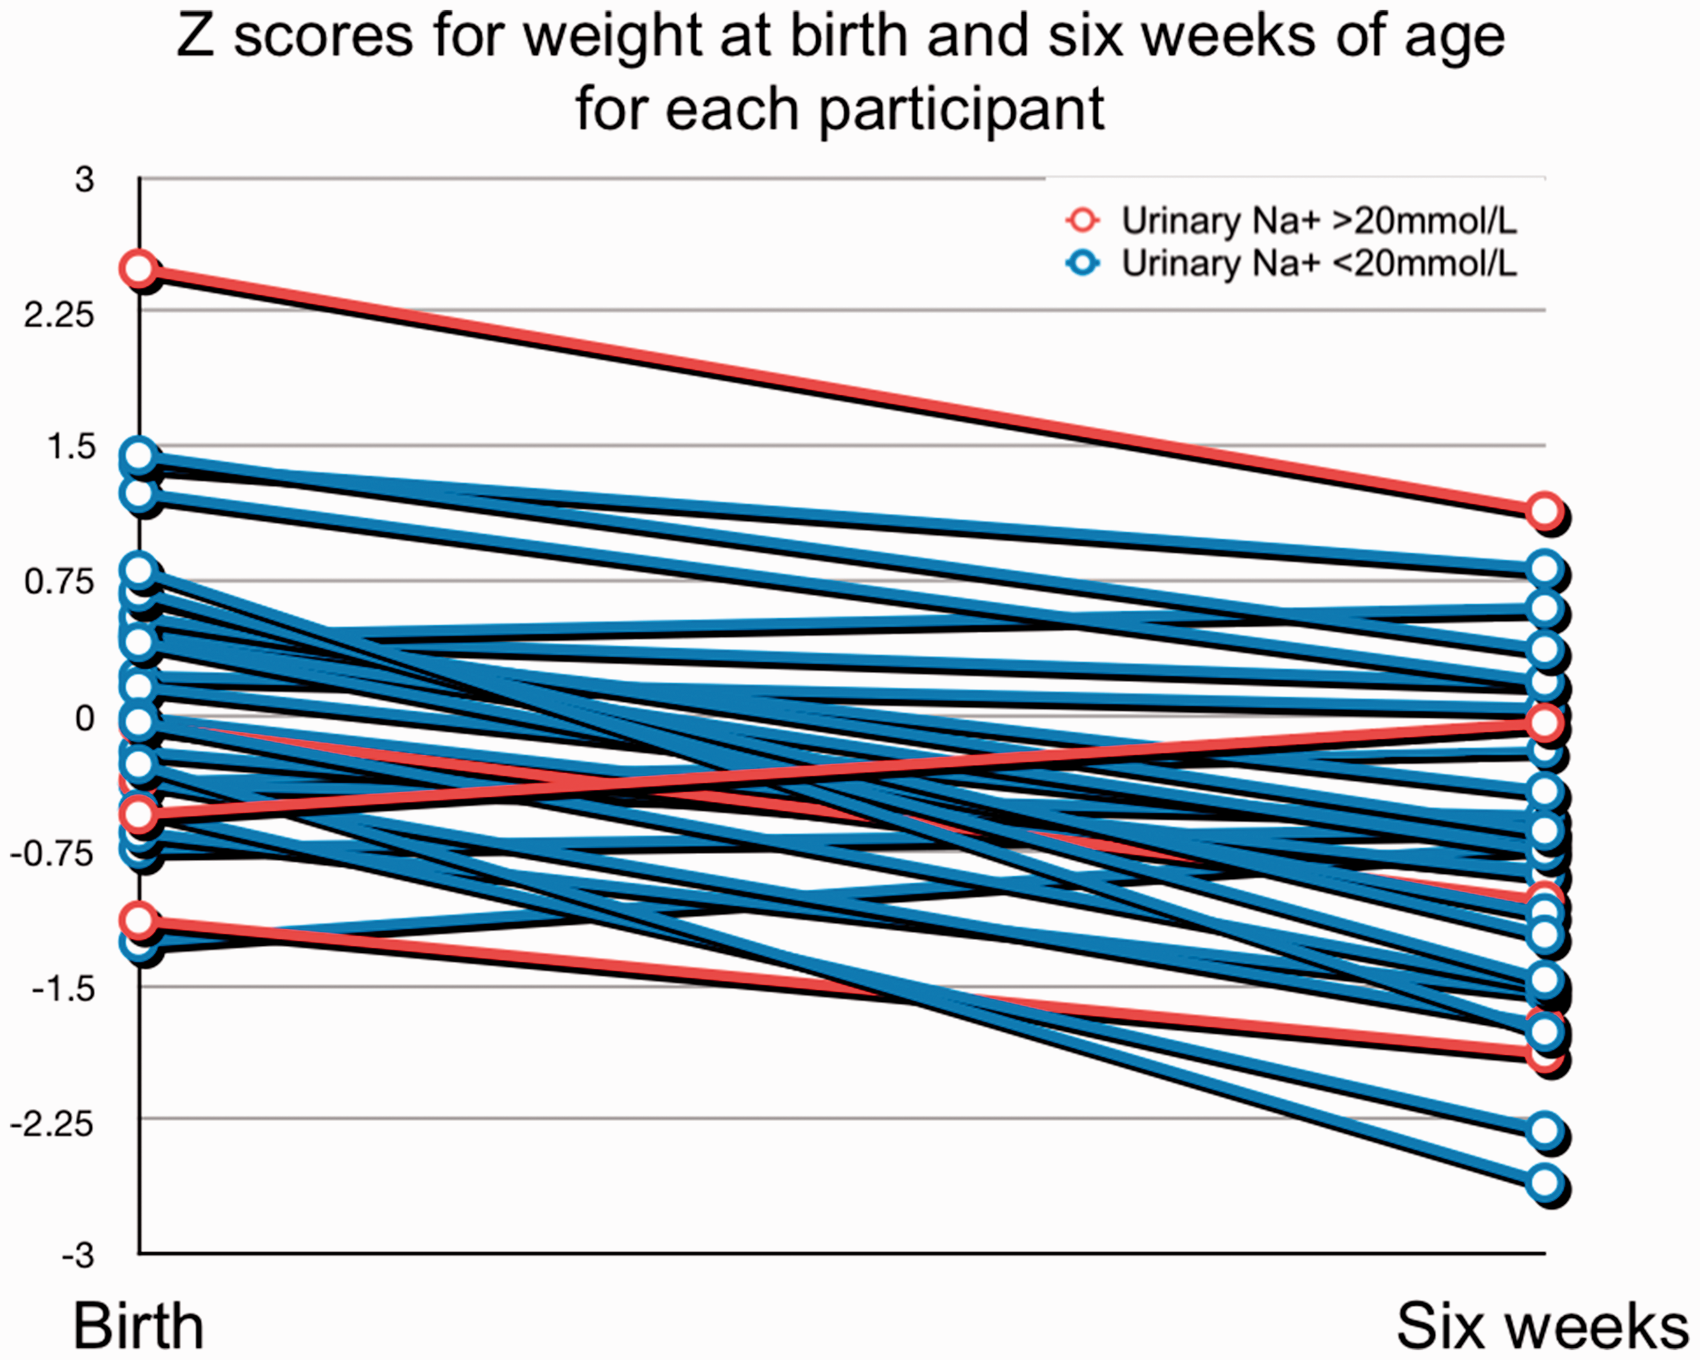
Weight velocities for infants with urinary sodium <20 mmol/L and >20 mmol/L.
Discussion
Healthy, term infants tended to have urinary sodium values <20 mmol/L at six weeks. This may be because intestinal absorptive capacity and renal tubular maturity are such that term infants should be able to retain sufficient sodium needed for growth. 2 This would also partly explain why no relationship was identified between weight velocity and urinary sodium concentration. Human breastmilk contains approximately 15 mg/100 mL sodium and supply is finite, while formula milks are of higher concentrations of sodium and are not limited. The small numbers in this study prevent us from making strong conclusion on this, and although the breastfed infants had lower urinary sodium values than formula-fed infants, this difference was not statistically significant. We are also aware that some medications contain sodium, in particular Gaviscon® Infant which can provide around 5 mmoL additional sodium per day. Only seven infants in the study were being administered medications and only two were receiving Gaviscon.
There are several limitations to our study. With a lower-than-expected return rate of questionnaires and urine samples (14.5%), we did not achieve our target statistical power. While we successfully recruited 200 families, ethical approval did not permit patient contact after initial recruitment, so we were unable to remind families to return questionnaires or samples. An amendment was not possible as anonymized data were gathered for participants (unique identification numbers were allocated, but no readily identifiable information). Secondly, urine samples were too dilute for accurate quantification by the means we employed. We were unable to determine sodium <20 mmol/L with accuracy. Given many samples had creatinine <0.4 mmol/L, urinary sodium/creatinine ratios could not be determined but may have been a useful method of quantifying sodium values, to compensate for the spot nature of samples. While it could be possible to alter methods to improve sensitivity, it was considered inappropriate to deliver results which would not be laboratory accreditation compliant. Given the drive to maintain international ISO 15189 standards, the method used is fully CE marked and had appropriate IQC and EQA performance throughout. The UK National External Quality Assessment Service’s urine chemistries scheme lowest sodium sample in the last 12 months was 29 mmol/L, so that lower concentrations are not being assessed by external quality assessment throughout the UK. Furthermore, an overall significant reduction in Z score was noted among our cohort. While this may represent type one error, we believe that the most likely explanation is that parents documented return questionnaire weights from their routine community check, while providing the date in which the questionnaire was completed or urine sample collected, both of which may have been somewhat later. This would therefore under-estimate return weights for age.
Despite these limitations, this study demonstrates that most healthy, term infants have spot urinary sodium concentrations <20 mmol/L at six week of age. More evidence is required to identify appropriate candidates for sodium supplementation.
Supplemental Material
Supplemental material for Quantification of urinary sodium concentrations in term infants
Supplemental material for Quantification of urinary sodium concentrations in term infants by Paul S Cullis, Frith Cull, Gordon Bruce, Allan Johnston, Hetal Patel, Lesley Jackson, Peter Galloway and Gregor Walker in Annals of Clinical Biochemistry
Footnotes
Acknowledgements
We are grateful for the families who agreed to take part in the study, local midwifery staff for help in identifying participants, and staff at the biochemistry department for sample analysis. We would like to thank Ms. Jacqueline McEnaney for collection and storage of questionnaires/samples, and Dr David Young for advice regarding statistical aspects of this study.
Declaration of conflicting interests
The author(s) declared no potential conflicts of interest with respect to the research, authorship, and/or publication of this article.
Funding
The author(s) disclosed receipt of the following financial support for the research, authorship, and/or publication of this article: The paediatric surgical department’s research fund contributed towards study materials.
Ethical approval
National NHS ethics committee approval (IRAS Project ID: 90596) was granted and the summarized protocol made available online (clinicaltrials.gov – NCT03016195).
Guarantor
PSC.
Contributorship
GW, LJ and PG conceived the study and developed the protocol; GW and PSC gained ethical approval; PSC, FC, GB, AJ and HP conducted patient recruitment; PSC and PG arranged sample processing; PSC conducted data analysis and wrote the first draft of the manuscript; all authors reviewed the manuscript, edited its content and approved the final version.
References
Supplementary Material
Please find the following supplemental material available below.
For Open Access articles published under a Creative Commons License, all supplemental material carries the same license as the article it is associated with.
For non-Open Access articles published, all supplemental material carries a non-exclusive license, and permission requests for re-use of supplemental material or any part of supplemental material shall be sent directly to the copyright owner as specified in the copyright notice associated with the article.