
Abstract
Background
We compared the effect of haemolysis in sodium measurement using indirect and direct ion-selective electrodes to test the hypothesis that haemolytic effect on sodium would be greater with indirect ion-selective electrode due to electrolyte exclusion effect from released intracellular proteins.
Methods
Plasma lithium heparin samples (n = 36) from four volunteers were prepared to give a range of haemolytic indices (H-indices). Samples were analysed for sodium by indirect ion-selective electrode, H-index and total protein on an Abbott Architect c16000 and sodium by direct ion-selective electrode on a Siemens RAPIDPoint 500. Percentage changes in sodium in paired direct and indirect ion-selective electrode values were compared.
Results
Abbott H-index, which represents haemoglobin concentration in g/L, correlated with percentage negative change in sodium by direct ion-selective electrode (ρ 0.995, P < 0.001) and indirect ion-selective electrode (ρ 0.991, P < 0.001). Percentage negative change was less when sodium was measured by direct ion-selective electrode compared to indirect ion-selective electrode (Wilcoxon signed-rank Z = 3.46, P = 0.01). The difference in percentage change in sodium between direct ion-selective electrode and indirect ion-selective electrode correlated with total protein (ρ 0.751, P < 0.001). The negative bias in sodium results exceeded the reference change value of 2.2% at an H-index of 8.31 for indirect ion-selective electrode and 9.26 for direct ion-selective electrode.
Conclusion
Haemolysis causes negative influence with sodium measured by both indirect and direct ion-selective electrode due to a dilutional hyponatremia. The additional interference in indirect ion-selective electrode is due to the electrolyte exclusion effect but this is unlikely to be clinically significant as it is small in magnitude.
Background
Serum sodium, one of the commonest requested laboratory tests, is under very tight physiological regulation with a within subject biological variation of 0.53% 1 and a relatively narrow reference range. Small changes may, therefore, be of clinical significance.
Haemolysis is the commonest pre-analytical error affecting laboratory results.2,3 Haemolysis may cause spectrophotometric or chemical interference from haemoglobin and may affect analyte concentrations by release of other intracellular substances. Release of intracellular contents may increase or decrease serum analyte concentration dependant on its intracellular concentration. 4 This method-independent change in concentration of an analyte is termed influence. 5
The laboratory measurement of sodium is by ion-selective electrode (ISE). Indirect ISEs measure activity of ions in a diluted sample. The ion activity and hence concentration are then related to total sample volume rather than to water volume. Within this lies the assumption that plasma consists of 93% of water and 7% dissolved solids. An increase or decrease in dissolved solids, such as proteins, reduces or increases the water fraction of plasma and measurement of sodium using indirect ISE in these circumstances causes erroneously high or low sodium results, respectively. This is known as the electrolyte exclusion effect (EEE). Direct ISEs, however, measure activity of ions in water which is directly proportional to their concentration and are unaffected by the EEE.
Negative error in sodium measurement from haemolysis is widely accepted as being due to a dilutional effect from the intracellular release of sodium deplete contents6–9 but this has only been studied using indirect ISEs. We hypothesized that sodium results in haemolysed plasma samples would be erroneously lower when measured by indirect ISE compared to direct ISE due to the EEE caused by the release of intracellular proteins. We, therefore, compared the magnitude of haemolysis error in sodium measurement using indirect and direct ISEs.
Methods
In an institution registered and approved service evaluation, we compared the effect of haemolysis on sodium results measured using direct and indirect ISE. Plasma samples with increasing haemolysis were prepared and sodium results analysed by direct and indirect ISE were compared taking into consideration method bias. To confirm the effect and its magnitude in real world haemolysed samples with up to 20 g/L of haemoglobin, we compared paired laboratory serum (indirect ISE) and emergency department venous blood (direct ISE) sodium results from serum and blood samples collected at the same time.
Eight lithium heparin blood samples (454084, Greiner, Kremsmünster, Austria) were collected from each of four healthy volunteers (two females) and anonymized. For each volunteer, seven of the samples were centrifuged at 1500 g for 10 min and the resulting plasma pooled stored at 2 to 8°C for 24 h and then aliquoted. The eighth blood sample was used to prepare haemolysate by a procedure adapted from a recently described method. 9 Essentially, the blood sample underwent three freeze (−20°C) thaw cycles, the first two consisted of a 2-h freeze and 1-h thaw and the third cycle was an overnight freeze followed by a thaw. The haemolysed samples were centrifuged at 1500 g for 10 min, the supernatant haemolysate collected and its haemoglobin concentration measured. Increasing volumes (25, 50, 75, 100, 150, 250, 350 and 500 µL) of haemolysate from each volunteer were added to 1000 µL aliquots of the respective volunteer’s plasma. Aliquots were analysed in duplicate for sodium by direct and indirect ISE, haemolysis index (H-index) and total protein on a single day and on the same analyser for each parameter and the mean was calculated.
Routine non-lipaemic serum samples (n = 40) with a sodium concentration in the range of 115 to 145 mmol/L, a total protein of 70 ± 2 g/L and an H-index <0.1 were identified, anonymized and analysed for sodium by indirect and direct ISEs to assess bias between the two methods in the absence of haemolysis and protein abnormalities.
Paired laboratory serum (indirect ISE) and emergency department blood gas analyser venous whole blood (direct ISE) sodium results were compared for the period June 2018 to June 2020 to investigate the relationship between direct and indirect ISEs in real-world clinical samples with a range of H-indices. Data on sodium and H-index results were collected from the laboratory information system (TD-NexLabs, Technidata, Montbonnot, France) and the Abbott Analyser Management System (AMS, Abbott Laboratories, USA). Samples were included if paired venous gas sample results were available up to 30 min before or 15 min after the laboratory serum sample receipt. Blood gas samples were presumed haemolysed and pairs excluded from analysis if the blood gas potassium was ≥2.0 mmol/L higher than the serum potassium result or >7.0 mmol/L with non-reported serum potassium. This cut-off value of 2.0 mmol/L was chosen to identify significantly haemolysed blood gas samples based on unit increase in potassium result per unit H-index. 10 When more than one venous gas result was available, the one nearest in time to the laboratory sample was included. Data were available on samples with H-indices ≤20.
Sodium and potassium (by indirect ISE), H-index and total protein were measured on an Abbott Architect c16000 (Abbott Laboratories, USA). The numeric H-index on Abbott Architect represents haemoglobin concentration in g/L. Sodium and potassium were also measured by direct ISE on a RAPIDPoint 500 blood gas analyser (Siemens, Erlangen, Germany). Haemoglobin concentration of the haemolysate was measured on a Sysmex XN-9000 (Sysmex, Kobe, Japan). Inter-assay coefficient of variation (CV) for indirect ISE sodium was 0.58% at 123 mmol/L and 0.49% at 146 mmol/L, respectively and for direct ISE was 0.70% at 116 mmol/L and 0.42% at 135 mmol/L, respectively. Inter-assay CV for H-index was 0.5% at 3.38 and 0.3% at 17.64, respectively. Inter-assay CV for total protein was 0.8% at 81 g/L and for haemoglobin was 0.8% at 147 g/L. All the laboratory assays were ISO 15189 accredited by the United Kingdom Accreditation Service (UKAS), whereas the point of care venous blood gas analysis was not UKAS accredited. However, all the assays were CE marked and had satisfactory internal quality control and external quality assurance performance during the study period.
A change in sodium exceeding the reference change value (RCV) for unidirectional change with 99% probability was considered significant. The RCV was calculated by formula [21/2 × 2.35 × (CVa2 + CVi2)1/2]. Where CVa was lowest of intra-assay analytic CV of sodium across the two analytical platforms of 0.42%, whereas CVi was median within-subject biological variation of sodium of 0.5% from EFLM biological variation database (https://biologicalvariation.eu/).
Data were tabulated in Microsoft Excel (Microsoft corporation) and statistical analyses performed using IBM SPSS Statistics for Windows, version 25 (IBM Corp., Armonk, N.Y., USA). The data were non-parametric (Shapiro–Wilk test) and therefore Spearman rank correlation was used to measure the degree of association between variables. Percentage change in sodium in paired direct and indirect ISE groups was compared by Wilcoxon signed-rank test. The threshold for statistical significance was 5%.
Results
The H-index correlated with the haemoglobin concentration of the haemolysate-spiked samples (ρ 0.994, P <0.001). The percentage change (negative error) in sodium measured by both direct ISE and indirect ISE correlated with H-index (ρ 0.995, P <0.001 and ρ 0.991, P <0.001 respectively) and with each other (ρ 0.992, P <0.001).
In non-haemolysed non-lipaemic serum samples with normal total protein, serum sodium measured by indirect ISE was approximately 2 mmol/L higher compared to direct ISE sodium (Figure 1(a)). Percentage change rather than absolute values was, therefore, used to assess effect in sodium ISE methods.
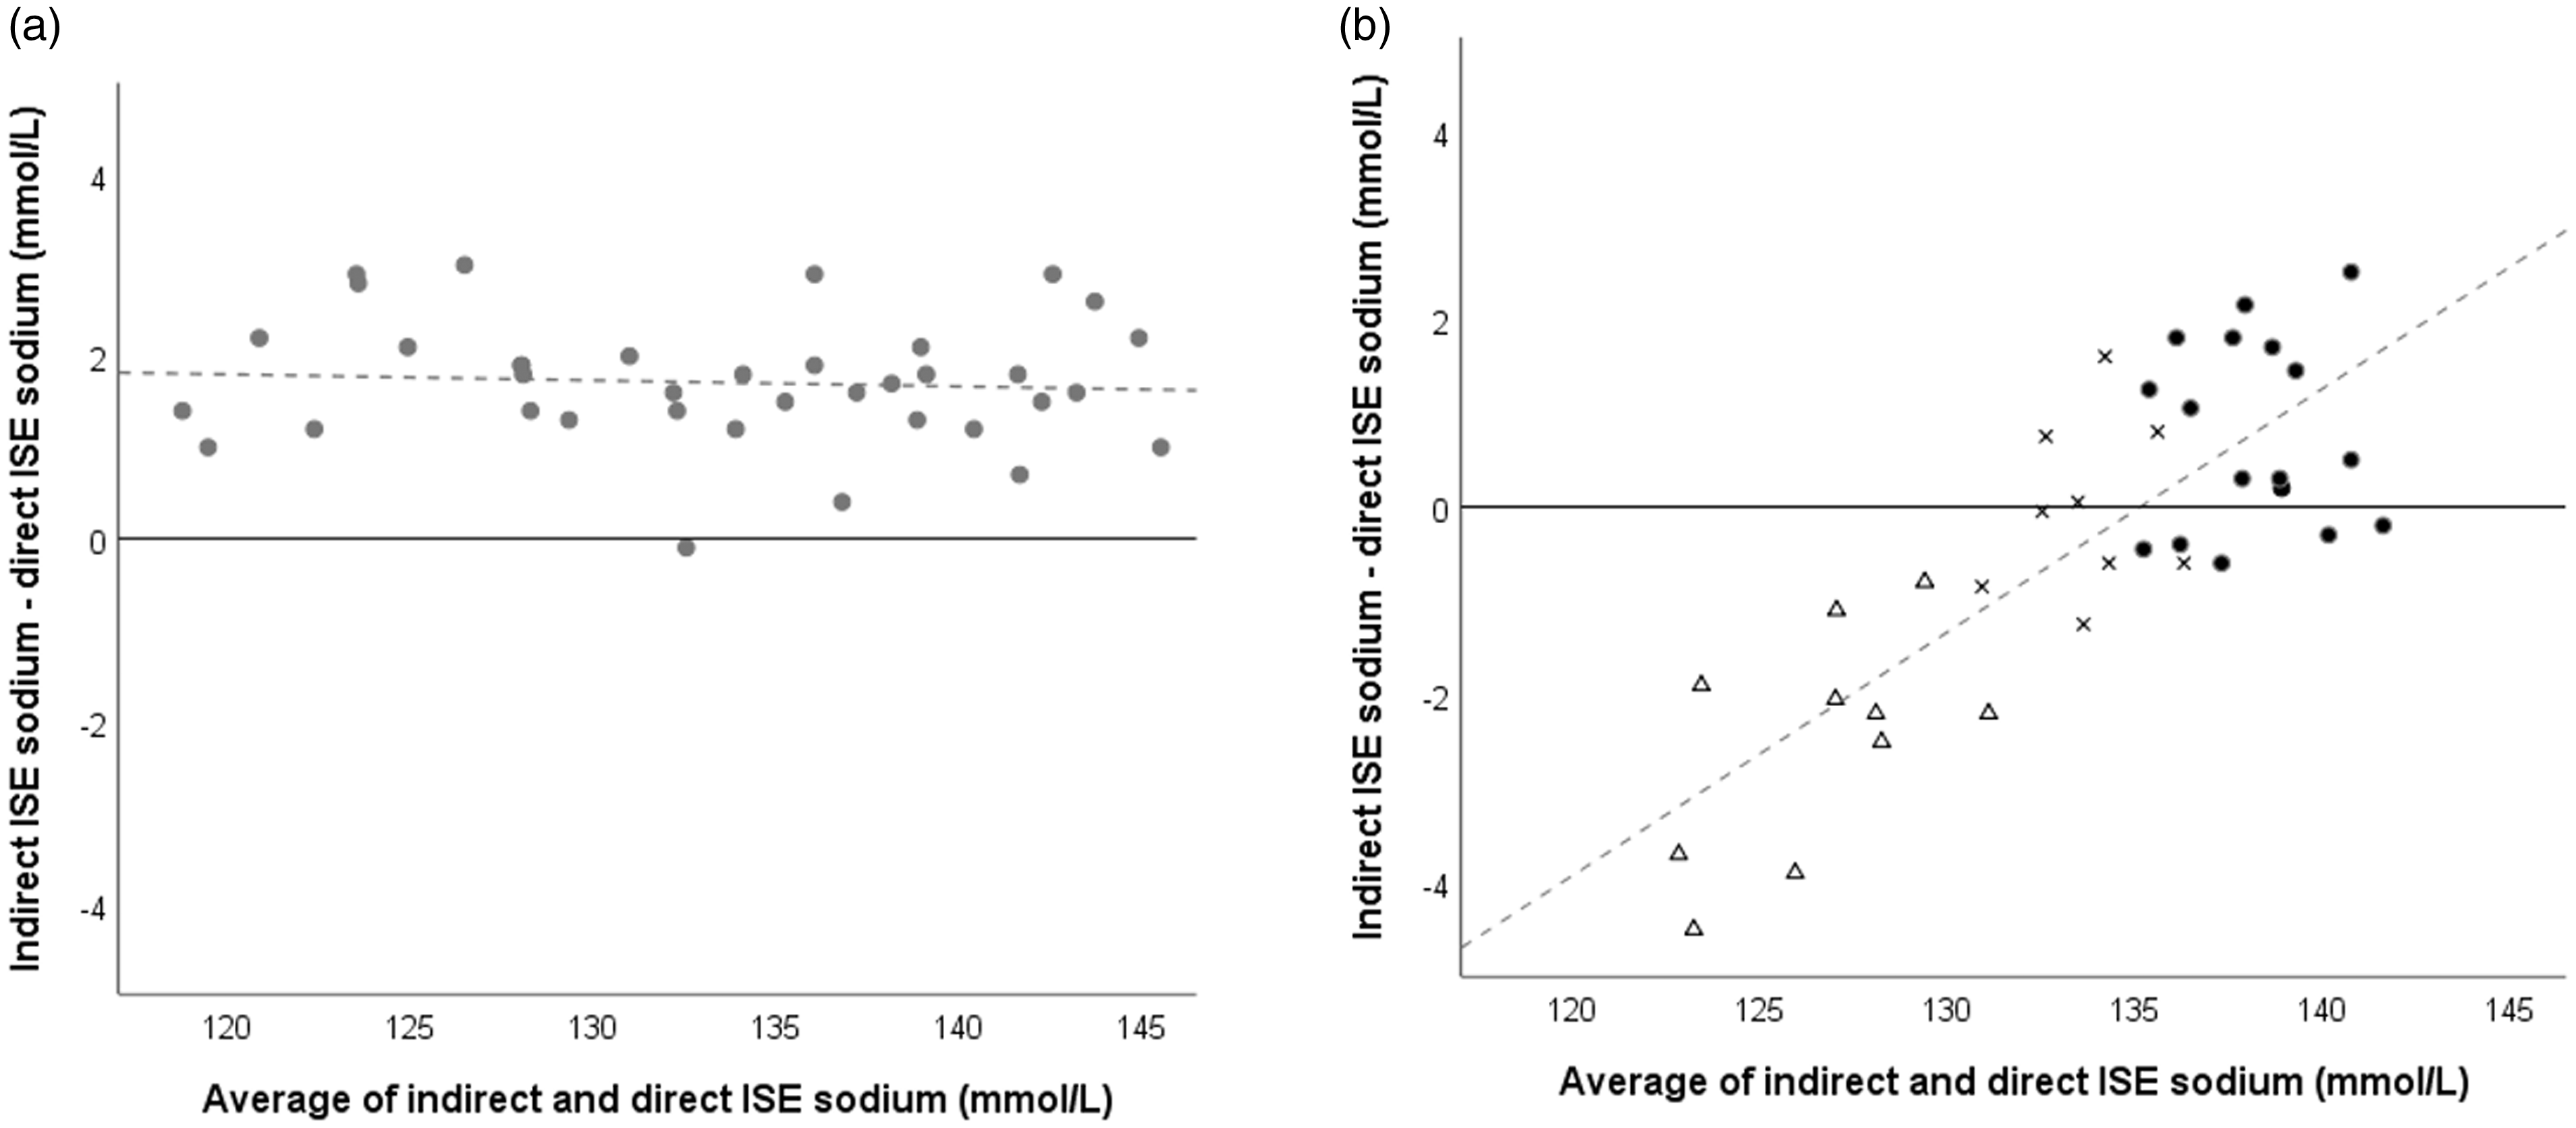
Bland–Altman plots of relationship between sodium results measured by direct and indirect ISE in absence and presence of haemolysis. (a) Serum samples (n = 40) with H-index <0.1 and total protein 70 ± 2 g/L. (b) Plasma samples (n = 36) with increasing haemolysis from the spiking study. Dark circles (●), crosses (x) and triangles (Δ) represent H-indices <15, 15 to <30 and ≥30, respectively. Lower sodium results were from the samples spiked with higher haemolysate volume and the same results are shown in Figure 2. Dotted lines represent lines of best fit.
In the haemolysate spiked samples, the method bias changed in proportion to the degree of haemolysis (Figure 1(b)). The percentage negative error caused by haemolysis was less when plasma sodium was measured by direct ISE compared to indirect ISE (Wilcoxon signed-rank Z = 3.46, P = 0.01) and the difference in negative error widened with increasing haemolysis (Figures 1(b) and 2). In haemolysed samples, the percentage difference change in sodium between direct and indirect ISE correlated with total protein (ρ 0.751, P <0.001) and H-index (ρ 0.791, P <0.001). Total protein correlated with H-index (ρ 0.991, P <0.001) in haemolysed samples.
The negative bias for sodium measurement exceeded the RCV of 2.2% (99% probability to detect unidirectional change) at H-indices of 8.31 (95% CI 8.14 to 8.48) and 9.26 (95% CI 9.16 to 9.36) for indirect and direct ISEs, respectively (Figure 2).
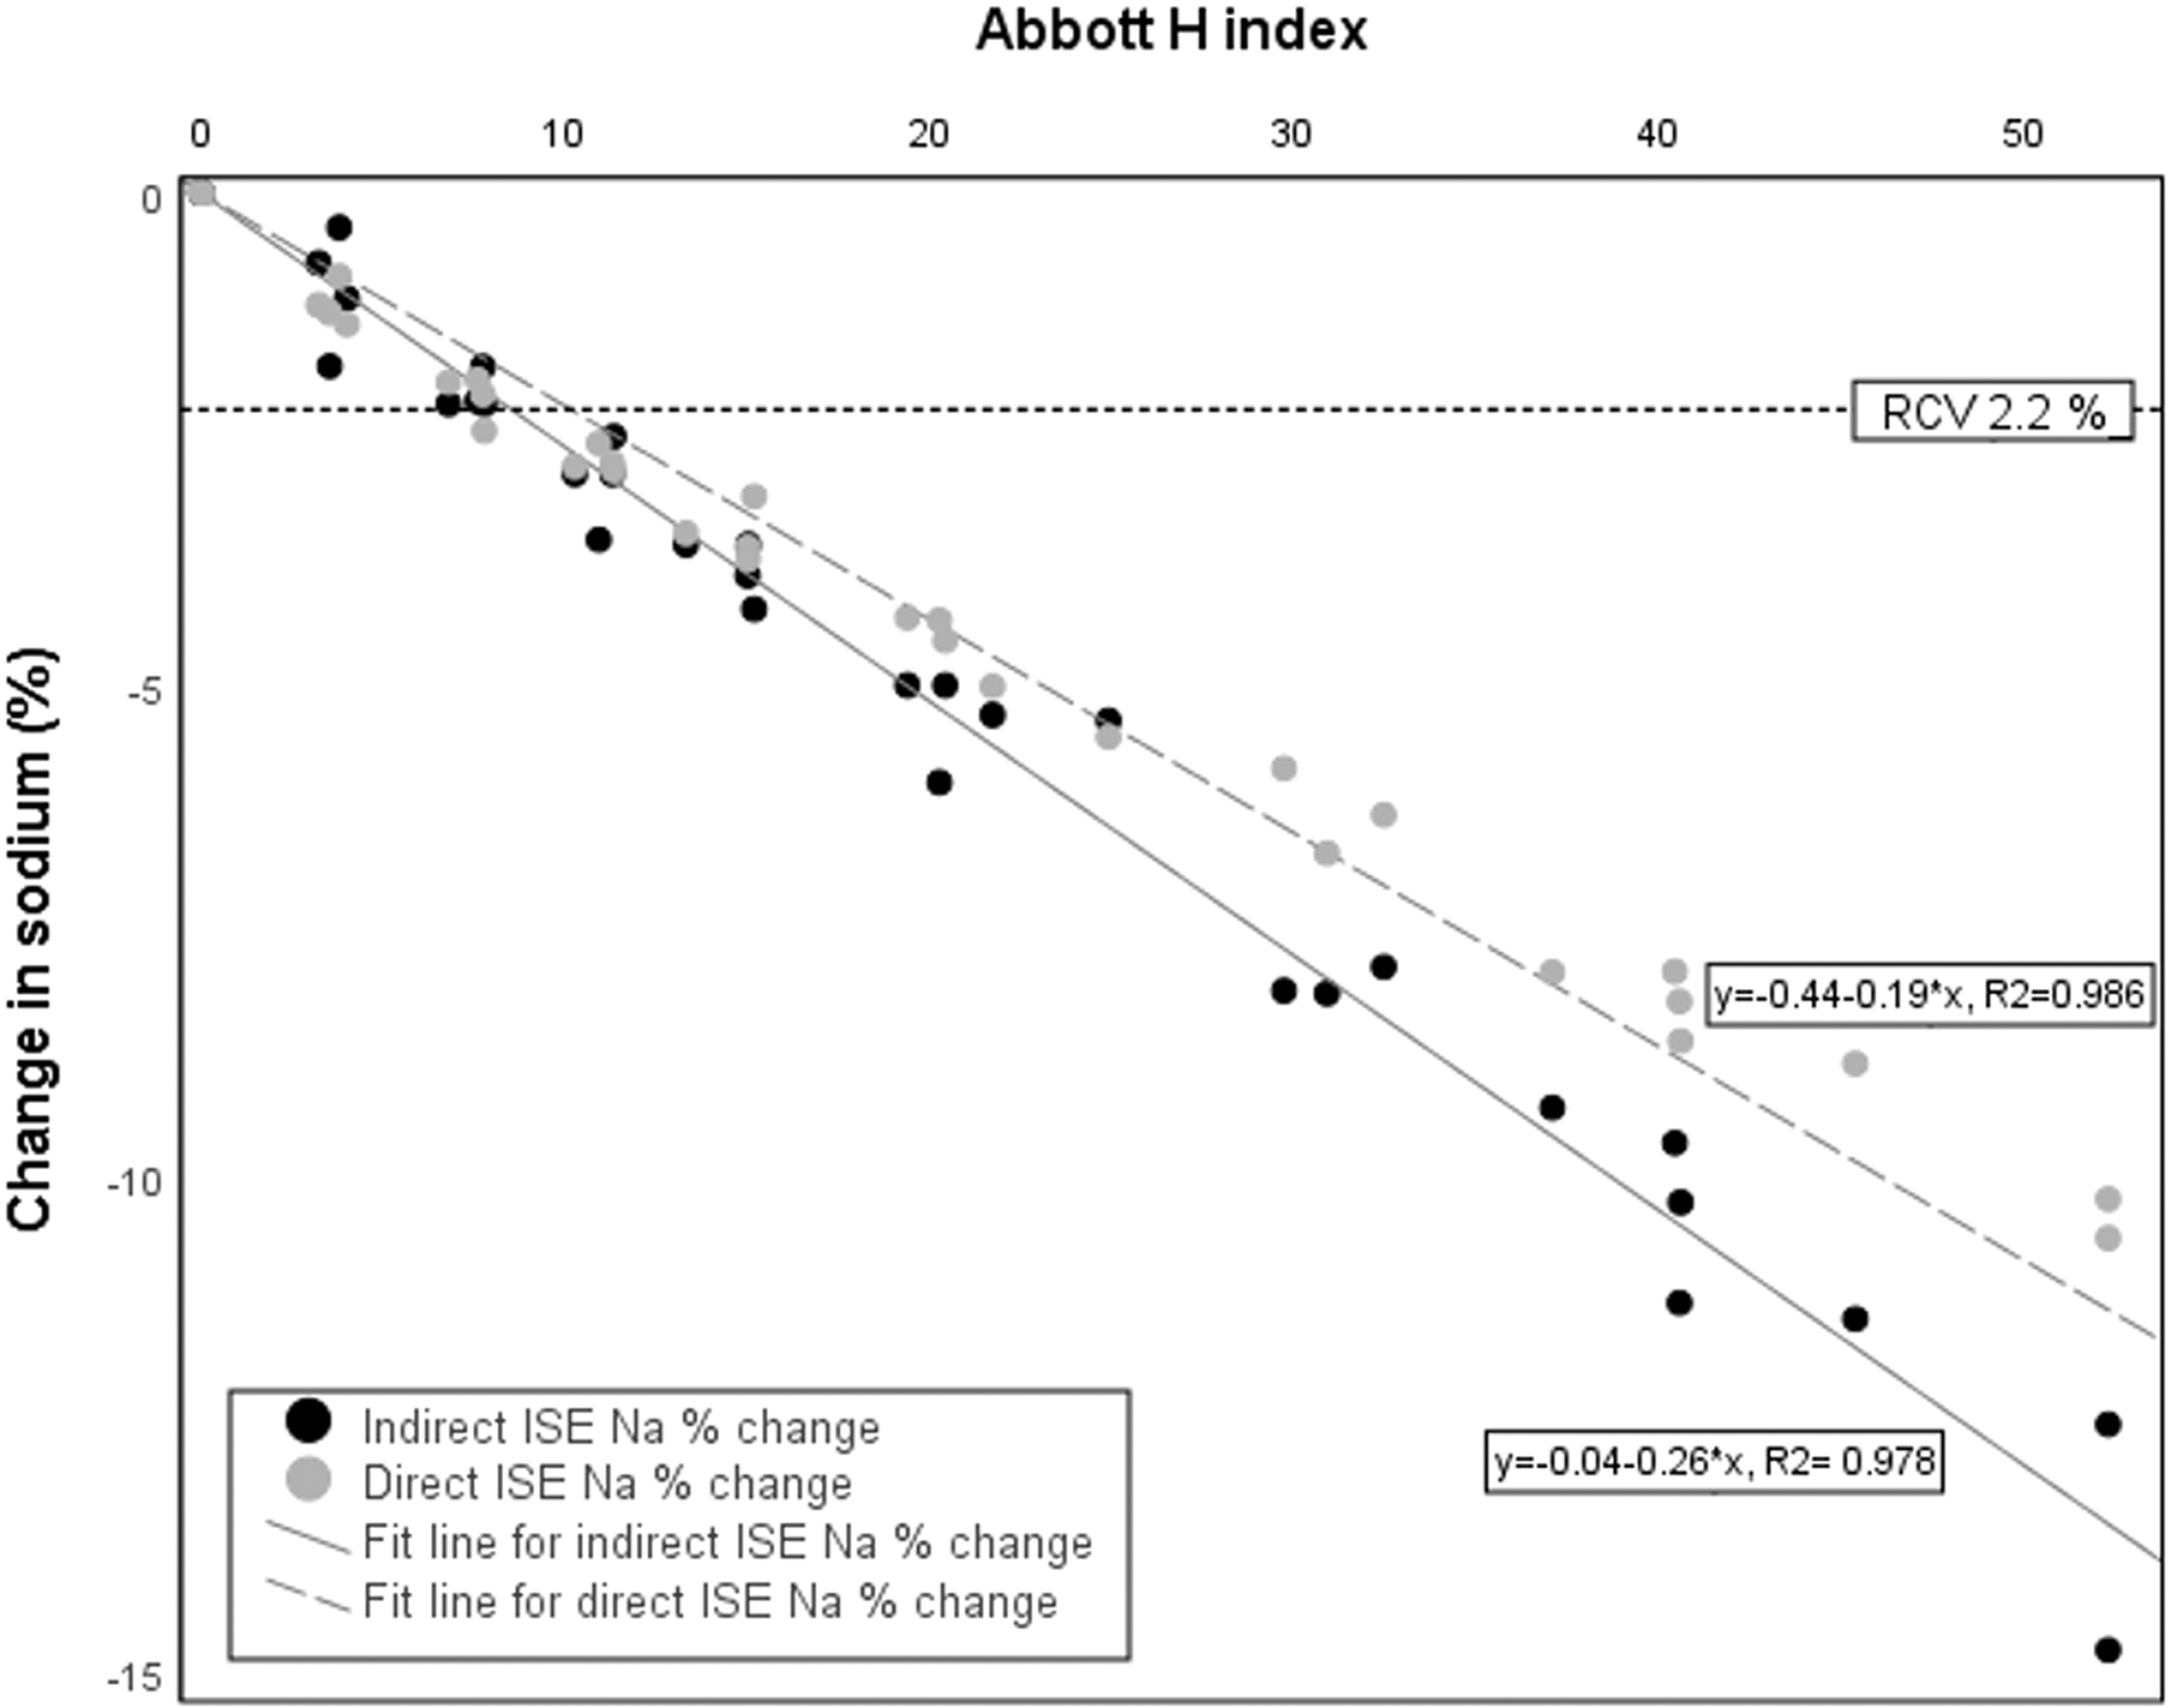
Percentage change in plasma sodium at different haemolytic indices for direct and indirect ISE methods from haemolysate spiked samples (n = 36). The dotted horizontal line indicates the reference change value (RCV) of 2.2%.
Between June 2018 and June 2020, data were gathered on 41,369 sets of paired laboratory serum (indirect ISE) and emergency department blood gas analyser venous whole blood (direct ISE) samples. Eighty-one samples had results for laboratory serum sodium measurements by both direct and indirect ISE. The paired sodium results of venous blood gas in ED and serum samples in the laboratory (Figure 3) confirmed a negative change of similar magnitude in sodium with increasing haemolysis in both indirect and direct ISE methods in the real-world clinical samples.
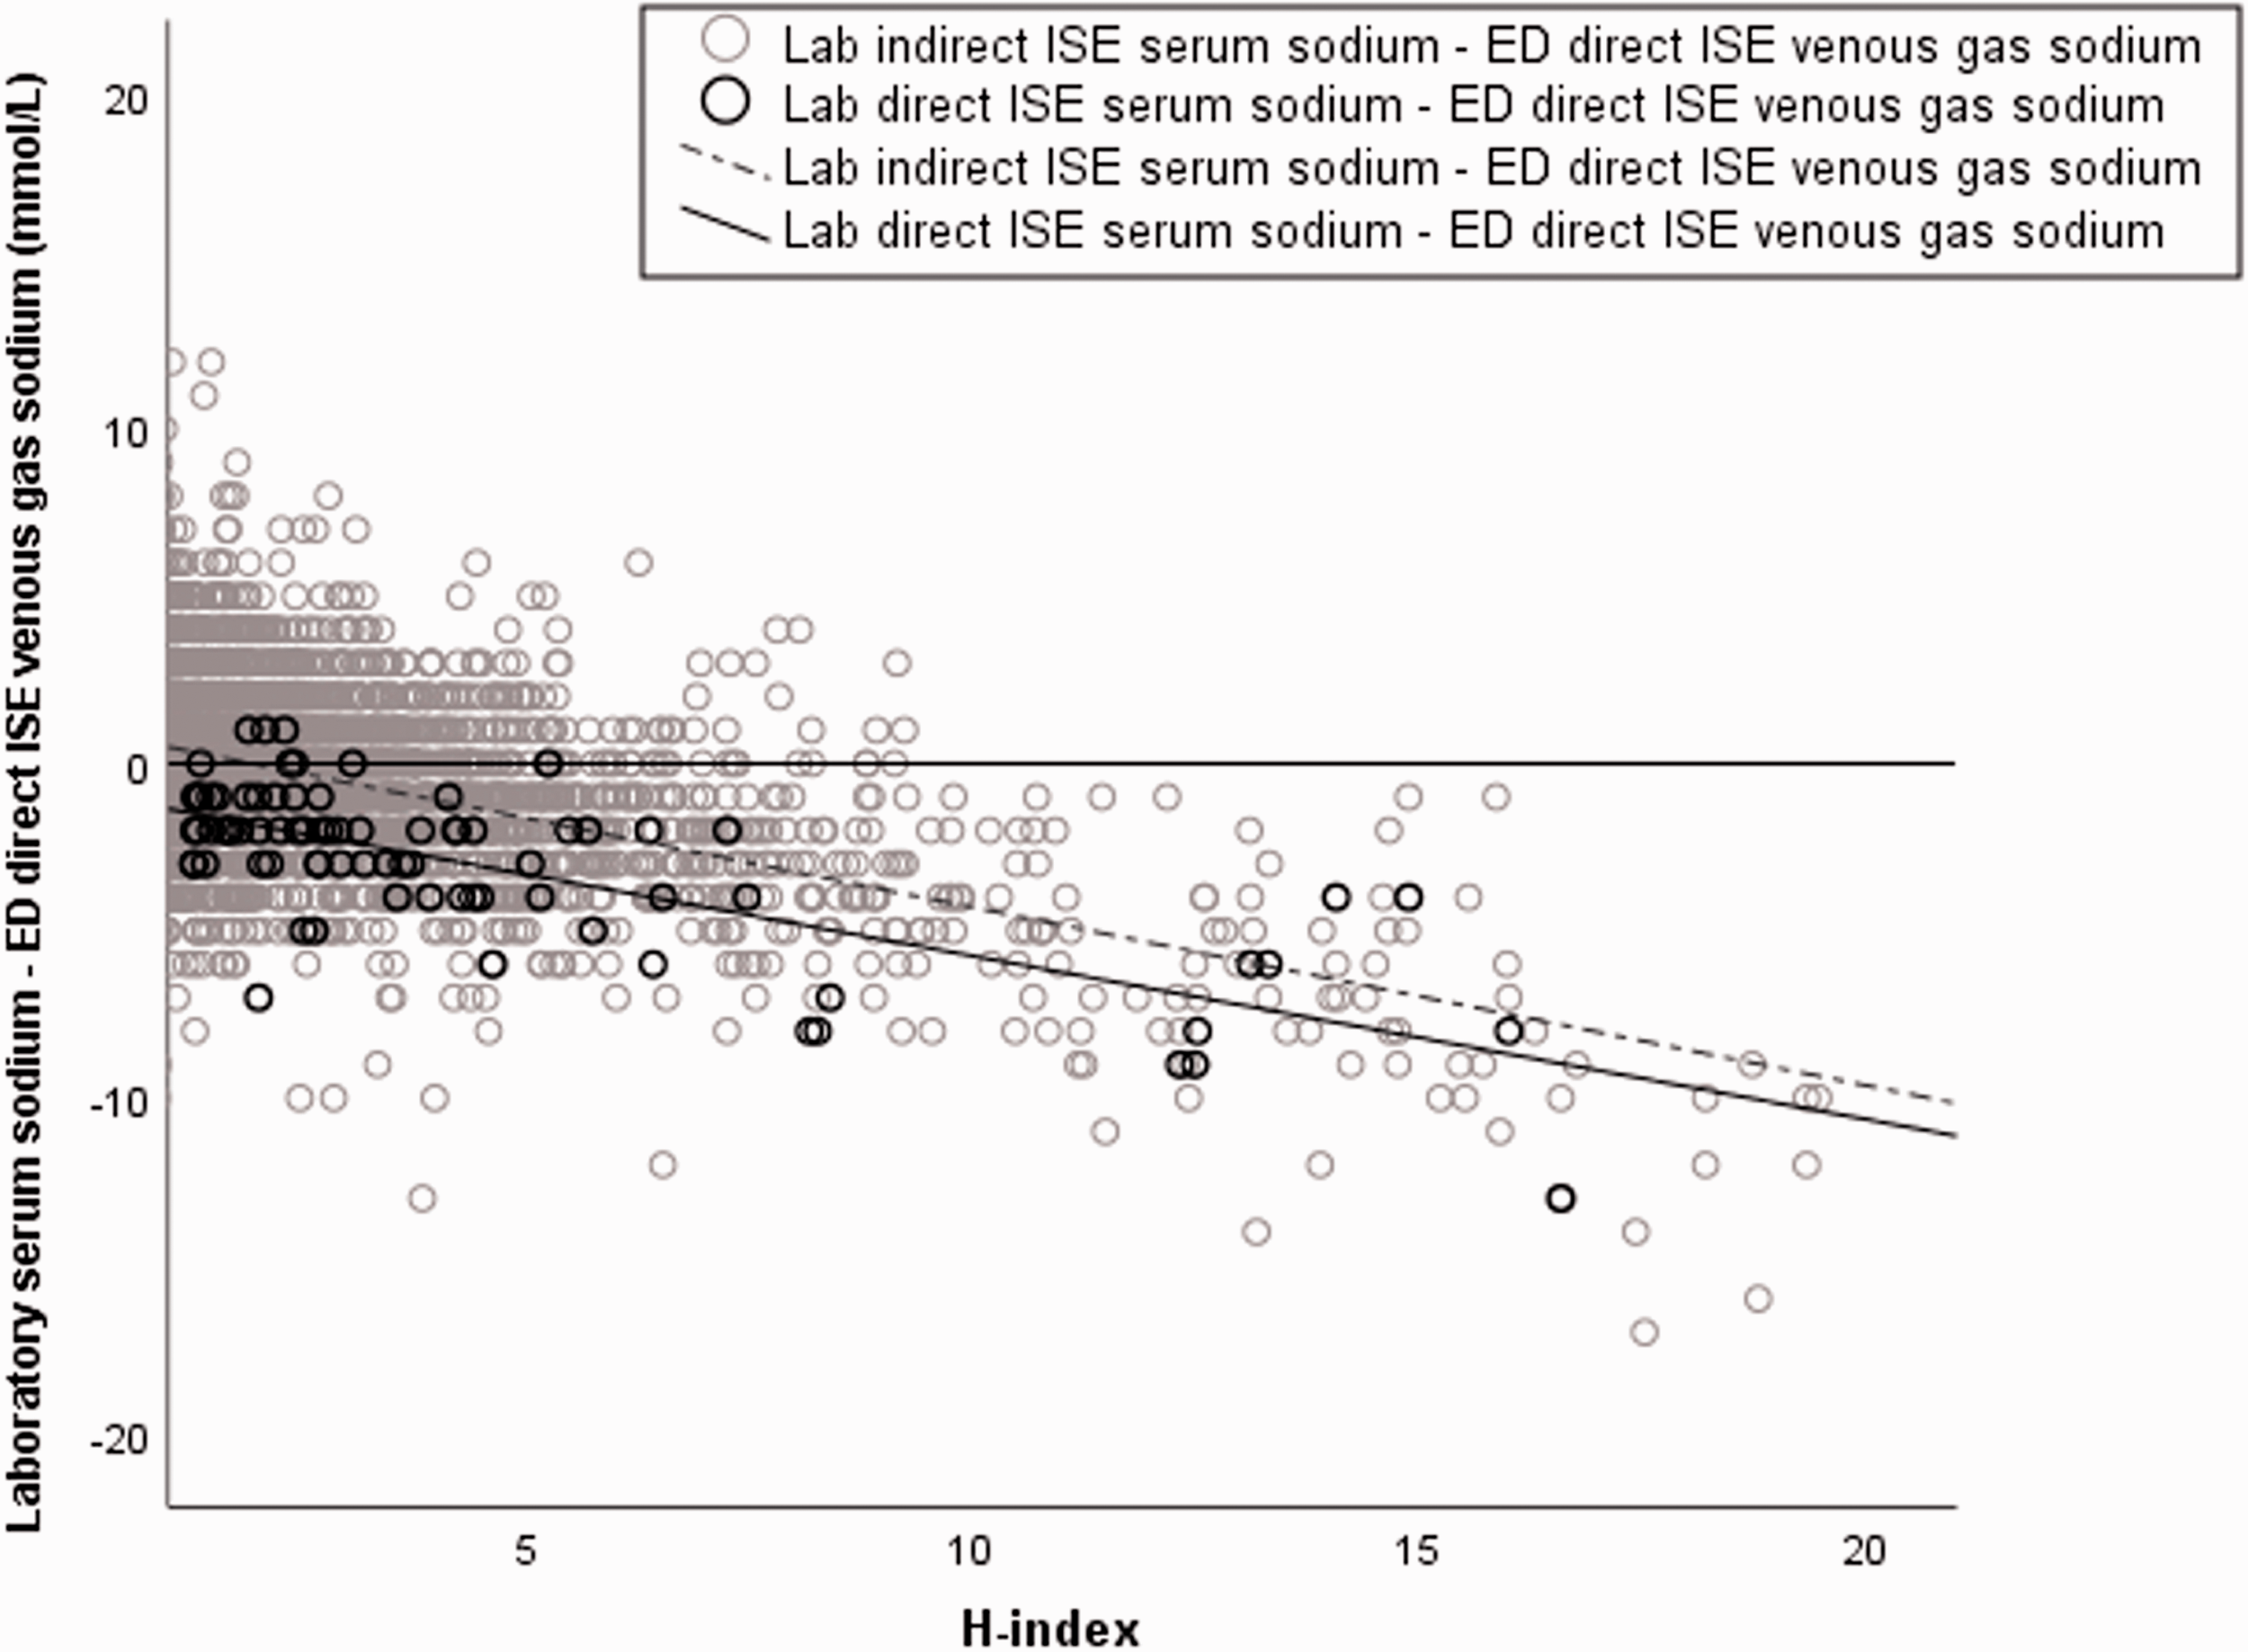
Relationship of laboratory indirect ISE (light circles) and laboratory direct ISE (dark circles) serum sodium results with paired emergency department direct ISE venous blood sodium results. Displayed results are for samples with H-indices 1 to 20.
Discussion
The spiking experiment and gather of historic paired clinical indirect and direct ISE data showed a decrease in both direct and indirect ISE sodium results with increasing haemolysis. The decrease was less with direct ISE compared to indirect ISE but the difference was marginal.
Our data are consistent with previous studies reporting a negative error in sodium measurement in haemolysed samples using indirect ISE8,9,11 but not others reporting no significant interference. 12 There are, however, no data comparing the effect of haemolysis on sodium when measured with direct and indirect ISE, most likely because indirect ISE is a component of high-throughput routine automated chemistry analysers and therefore the commonest method for sodium measurement.
We report that haemolysis causes a negative error in not only indirect ISE but also direct ISE sodium measurement. The error in sodium measurement, however, was less using direct ISE compared to indirect ISE. We therefore suggest that the release of sodium deplete intracellular content causes a dilutional negative influence in both the methods and the additional interference in indirect ISE is due to released intracellular proteins causing an EEE. The EEE is supported by correlation of the difference in percentage change between direct and indirect ISE sodium with total protein in the haemolysed samples. This additional negative interference in indirect ISE due to the EEE fulfils the definition of pseudohyponatremia. 13 In vitro haemolysis, however, is generally not included in the causes of pseudohyponatremia.
The difference in the effect of haemolysis on direct and indirect ISE was statistically significant and was of increasing magnitude with increasing haemolysis. It, however, is unlikely to be clinically significant as the difference was small at the H-indices where the RCV for sodium was not exceeded, and the H-indices at which the RCV was exceeded were similar for indirect and direct ISEs. Thus, for example, from the regressions equations (Figure 2), the percentage changes in sodium at H-index of 10 were 2.3% and 2.6% for direct and indirect ISE, respectively.
Our study also illustrates the importance of between method bias. In this study, the indirect ISE had a constant positive bias for sodium compared to the direct ISE. Although negative haemolysis error was greater than that for direct ISE, indirect ISE sodium results remained higher than direct ISE results for H-indices ≤20.
In summary, we confirm a negative haemolytic error for sodium measured by indirect ISE. We, for the first time, report that a negative haemolytic error for sodium measured by direct ISE is less than that for indirect ISE. These data support the notion that during haemolysis the release of intracellular sodium deplete contents causes a dilutional negative influence in sodium measurement by both direct and indirect ISE methods and the release of intracellular proteins causes added negative electrolyte exclusion interference when using indirect ISE. Although sodium measurement by direct ISE is less affected by haemolysis compared to indirect ISE, it is unlikely to be of clinical significance since the haemolytic error appears predominantly dilutional in nature.
Footnotes
Acknowledgements
We thank volunteers for participation in the service evaluation and thank Dr. Simon Whitehead for insightful suggestions about data collection from the laboratory information system.
Declaration of conflicting interests
The author(s) declared no potential conflicts of interest with respect to the research, authorship, and/or publication of this article.
Funding
The author(s) received no financial support for the research, authorship, and/or publication of this article.
Ethical approval
Institution registered and approved service evaluation with the Royal Wolverhampton NHS Trust (Wolverhampton, UK) with ID 5448.
Guarantor
RG.
Contributorship
TK and HG designed the service evaluation under the guidance of CF and RG. TK collected samples, helped with sample analysis, analysed data and wrote the first draft of the manuscript. HG analysed samples and helped with data analysis. SH collected and compiled data from the laboratory information system and middleware. All authors critically reviewed and revised the article and approved the final version of the manuscript.