
Abstract
Objectives
Autism spectrum disorders and intellectual disability present a challenge for therapeutic and dietary management. We performed a re-analysis of plasma amino acid chromatography of children with autism spectrum disorders (n = 22) or intellectual disability (n = 29) to search for a metabolic signature that can distinguish individuals with these disorders from controls (n = 30).
Methods
We performed univariate and multivariate analyses using different machine learning strategies, from the raw data of the amino acid chromatography. Finally, we analysed the metabolic pathways associated with discriminant biomarkers.
Results
Multivariate analysis revealed models to discriminate patients with autism spectrum disorders or intellectual disability and controls from plasma amino acid profiles (P < 0.0003). Univariate analysis showed that autism spectrum disorder and intellectual disability patients shared similar differences relative to controls, including lower glutamate (P < 0.0001 and P = 0.0002, respectively) and serine (P = 0.002 for both) concentrations. The multivariate model (P < 6.12.10−7) to discriminate between autism spectrum disorders and intellectual disability revealed the involvement of urea, 3-methyl-histidine and histidine metabolism. Biosigner analysis and univariate analysis confirmed the role of 3-methylhistidine (P = 0.004), histidine (P = 0.003), urea (P = 0.0006) and lysine (P = 0.002).
Conclusions
We revealed discriminant metabolic patterns between autism spectrum disorders, intellectual disability and controls. Amino acids known to play a role in neurotransmission were discriminant in the models comparing autism spectrum disorders or intellectual disability to controls, and histidine and b-alanine metabolism was specifically highlighted in the model.
Introduction
Autism spectrum disorder (ASD) is a group of neurodevelopmental disorders with a worldwide incidence of 1/88 and a male-to-female ratio of 3–4:1. 1 There is growing evidence that ASD may be influenced by genetic, 2 environmental, 3 immunological and biochemical factors.4,5 However, the clinical diagnosis is based solely on complex behavioural abnormalities, which are not evident before the age of 12–18 months.6,7 The pathophysiology of ASD is not yet fully understood and a better knowledge of the underlying mechanisms may help to improve early diagnosis and provide new perspectives for therapeutic drugs and dietary management. Approximately 40% of people with ASD have significant learning and intellectual disability (ID).8–11 The general prevalence of ID is between 1 and 3%, and approximately 4 to 28% of children with ID also meet ASD criteria.12,13 Many common genes have been shown to be involved in these two disorders.14,15 However, ID is not systematically associated with ASD and may present specific clinical signs and neurofunctional defects. 16 Biomarkers may help to better understand the underlying common and distinct mechanisms of ASD and ID, 16 and open new management perspectives.
Numerous metabolic diseases may induce symptoms similar to those observed in ASD or ID, such as phenylketonuria (OMIM261600), 17 adenylosuccinate lyase deficiency (OMIM608222), 18 creatine deficiency syndromes (OMIM300352) 19 and Smith-Lemli-Opitz syndrome (OMIM270400). 20 Thus, metabolic exploration, which minimally includes a blood amino acid (AA) profile, is frequently performed at the time of the initial examination. The analytical technique used for AA analysis gives the concentrations of the 20 AA and numerous derivatives. In routine practice, we only share the values of the approximately 15 AAs linked to the most frequent inherited metabolic diseases with the clinician. A new open strategy of metabolic exploration may hold promise: we propose not to only focus on inherited metabolic diseases (i.e. on specific AA) but rather to apply global analysis of AA profiles to obtain a comprehensive overview of this metabolic pathway. In this preliminary study, we re-analysed standard plasma AA profiles, considering all detected compounds, to identify specific metabolic profiles. The aim was to identify a specific metabolic signature for ASD and/or ID and to obtain a better understanding of the metabolic alterations in these disorders.
Methods
Patients
Plasma amino acid chromatographs (AAC) were collected between 2011 and 2016 from 81 children (<18 years old) undergoing routine metabolic exploration for aetiological investigations. We included ASD children without ID (based on ‘Diagnostic and Statistical Manual of Mental Disorders (V)’ criteria), and children with ID, without ASD (based on developmental delay, all levels combined). We also collected data from normally developing children matched for age, gender and body mass index, who were investigated for possible inherited metabolic disorders associated or not with epilepsy (i.e. controls). The controls were used in this study to assess the potential specificity of metabolites considered to distinguish between ASD and ID. Controls were not related to patients and subjects had no specific diet. The following data were collected: age, diagnosis, type of treatment, if any, fragile X research (Southern blot). Subjects with inborn errors of metabolism were not included in this study.
The global methodology of the study is shown (Figure 1).
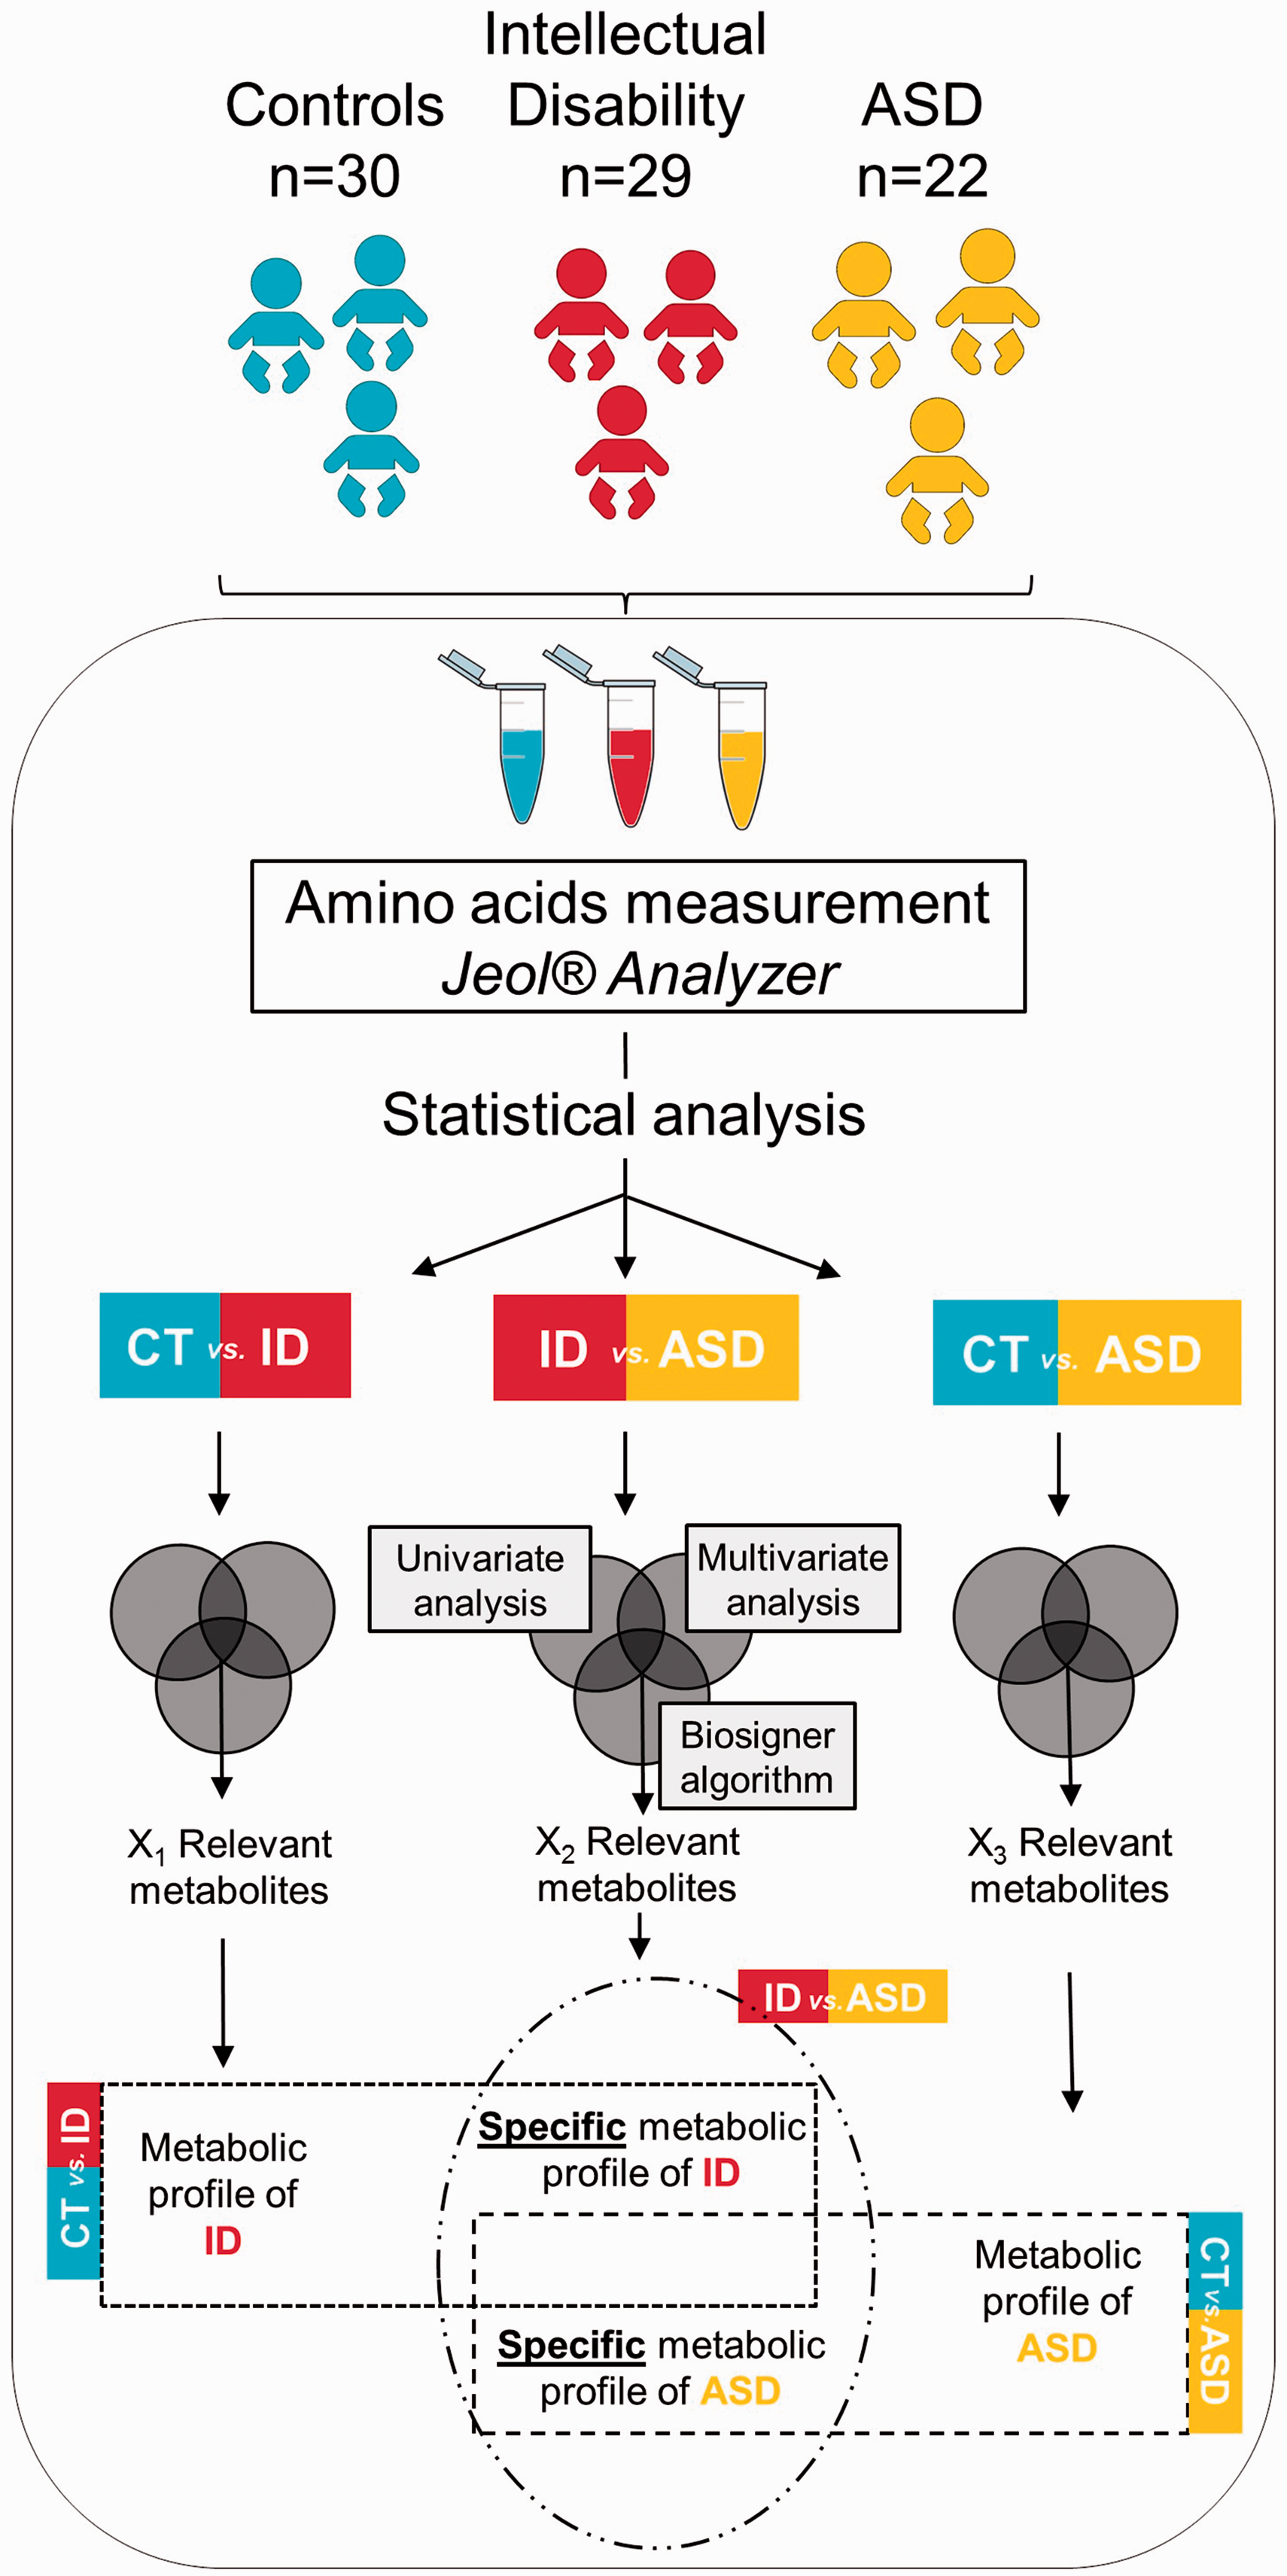
Global methodology of the study.
AA measurement
Samples were collected in the morning after 12 h of fasting, were transported at 4°C and centrifuged with a maximum delay of 2 h. Supernatant was stored at 4°C, and then analysed within 24 h or stored at −20°C for up to three days prior to analysis. Preanalytical and analytical conditions of AA chromatography analysis were based on the recommendations of the French Society of Metabolic Diseases, and only samples meeting these requirements were analysed. 21 Plasma AA profiles were performed by ion exchange chromatography and postcolumn ninhydrin derivatization using JEOL JLC-500/V AminoTac (JEOL [Europe] Croissy sur Seine, France). 22 This analytical method has been validated and conforms to the European external quality controls schedule.
Data preprocessing and processing
All detected peaks with an inter-assay variability <30% in the standard samples were integrated. Peaks were systematically weighted by the area of the internal standard. Concentrations of plasma metabolites were considered to be continuous variables for further analysis.
Statistical analysis
We compared three groups: ASD, ID and controls. The mean ± standard deviation (SD) values were obtained for all metabolites, and univariate analysis was performed by Kruskall-Wallis and Wilcoxon tests. Statistical analyses were performed using JMP software, version 7.0.2 (SAS Institute, Cary, NC, USA). Multiple comparisons were accounted for by the false discovery rate (FDR) method, 23 and each FDR was estimated using q-values (Benjamini–Hochberg correction).
Multivariable analyses based on principal component analysis (PCA) and orthogonal partial least square and discriminant analysis (OPLS-DA) were performed using SIMCA® software, as previously described and were performed blindly. 22 The significance of the OPLS-DA model was evaluated by the CV-ANOVA test, the Q2Ycum (goodness of prediction) and the R2Ycum (goodness of fit) values. We considered a model with Q2Y cum > 0.4 to be a good predictive model. The models were cross-validated by withholding one-seventh of the samples in seven simulations. We performed model optimization by variable exclusion to retain the most discriminant AA. The most relevant variables were determined from the variable importance for the projection (VIP) and loading values scaled as correlation coefficients (pcorr). VIP values represent the importance of the variable for the OPLS-DA models, and loadings characterize the relation between Y and X variables (AA).
We also used the biosigner script of R software to model the discrimination of groups by another analysis strategy (R Core Development Team, 2015; version 3.3.2, R Foundation for Statistical Computing, Vienna, Austria). 24 The algorithm is independently wrapped around different machine learning approaches: PLS-DA, Random Forest and support vector machines (SVM), as the performances of these approaches vary according to the data-set structure. The objective of this method is to find the significant feature subset necessary for a classifier to optimally discriminate between two classes. Given a machine learning methodology, this algorithm provides both the molecular signature and the trained classifier, which can subsequently be used for prediction on new data-sets. Feature selection is based on a backward procedure in which the significance of each feature subset is estimated by random permutation of the intensities. The data-set is then restricted to the significant feature subset, and the whole procedure is performed iteratively until, for a given round, all candidate features are found to be significant (in this case, the signature consists of these features), or until there is no feature left to be tested (in this case, the signature is empty). Finally, the algorithm returns the tier of each feature for the different classifiers: (1) Tier S corresponds to the compounds which are significant in all the selection steps; (2) Tier A is significant in all but the last selection, (3) Tier E regroups all previous rounds of selection. The algorithm thus consists of three steps: bootstrap resampling, feature ranking and selection of significant features.
We constructed a Venn diagram with the 10 best VIP identified from OPLS-DA models, comparing the three groups, and metabolites revealed by biosigner algorithm were also noted to highlight the most robust findings.
We used the KEGG pathway database (http://www.genome.jp/kegg/pathway.html) and MetaboAnalyst web application 25 to elucidate the highlighted metabolic pathways. The most relevant pathways are defined by different criteria: (i) the pathway impact value that is the cumulative percentage from the matched metabolite nodes (calculated from pathway topology analysis) and (ii) the statistical P values with the raw P that is the original P value calculated from the enrichment analysis and the Holm P that is the P value adjusted by Holm–Bonferroni method.
Results
Patients
Twenty-two ASD children (19 males and three females) without ID, 29 children (19 males and 10 females) with ID without ASD and 30 (19 males and 11 females) controls were included. The mean ages of the ASD, ID and control groups were 56.1 ± 70.8 months, 61.2 ± 38.7 months and 57.7 ± 29.3 months, respectively (Table 1). The results of fragile X testing were available for 77% ASD and 45% ID patients and were negative in each case. The demographic and clinical characteristics were not significantly different between the three groups. There was also no difference in the specific diet between the three groups, but a higher percentage of children were taking antiepileptic drugs in the control group (73%). Univariate and multivariate analyses performed in the control group to evaluate the association between medication and metabolic profile revealed no significant differences or specific patterns (Supplemental Figures 1 to 3).
Clinical characteristics of the study cohort.
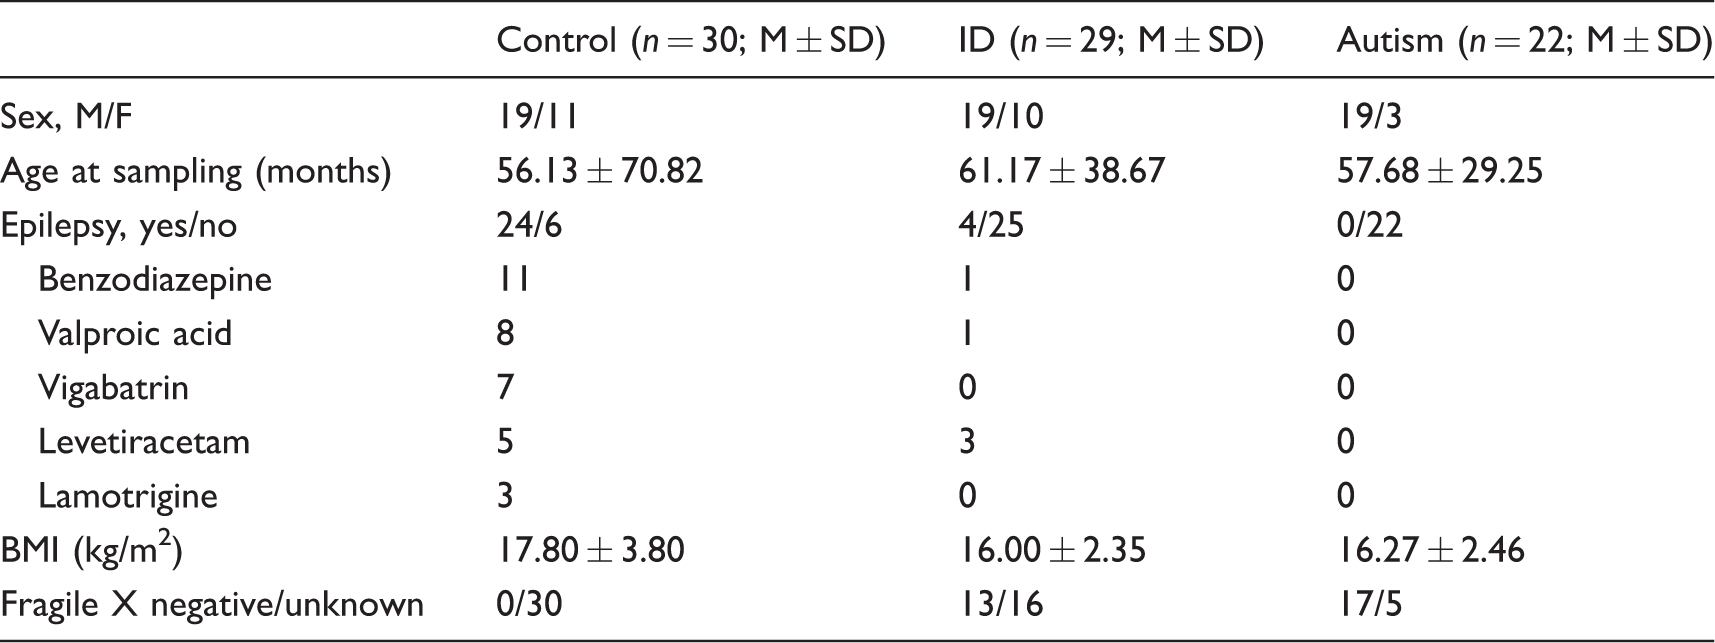
ASD: autism spectrum disorder; ID: intellectual disability; BMI: body mass index.
Metabolic pattern
Preprocessing and processing of the data enabled the integration of 47 metabolites. AAs and their derivatives represented 37 identified metabolites and 10 unknown peaks that were verified for a second time on each chromatogram.
Global comparison
Univariate analysis revealed significant differences between the groups for the concentrations of glutamate, serine, proline, beta-aminoisobutyric acid and urea (P < 0.0052 for each metabolite). Unsupervised multivariate analysis revealed no clusters (not shown).
Compared with controls, ASD or ID children display a specific metabolic signature
Multivariate analysis, based on 34 metabolites, resulted in correct discrimination between ASD and controls with R2X(cum) = 0.273, R2Y(cum): 0.689, Q2(cum): 0.536 and CV ANOVA = 2.01−7 (Figure 2(a)). The metabolites that contributed to the model are shown in Figure 2(b) and highlighted glutamate, beta-aminoisobutyric acid, proline, serine and beta-alanine. The comparison between ASD and controls by univariate analysis revealed lower glutamate (P < 0.0001), proline (P = 0.0005) and serine (P = 0.0015) concentrations, and a trend towards lower ornithine (P = 0.0065) concentrations in the ASD than control group (Figure 2(b)). According to biosigner analysis, glutamate passed all selection iterations to discriminate ASD from control with an accuracy of 0.75 on the final S signature for the PLS-DA and passed to the A tier, with an accuracy of 0.68 with the Random Forest (RF). No feature was selected to be significant in the last iteration with the SVM classifier.
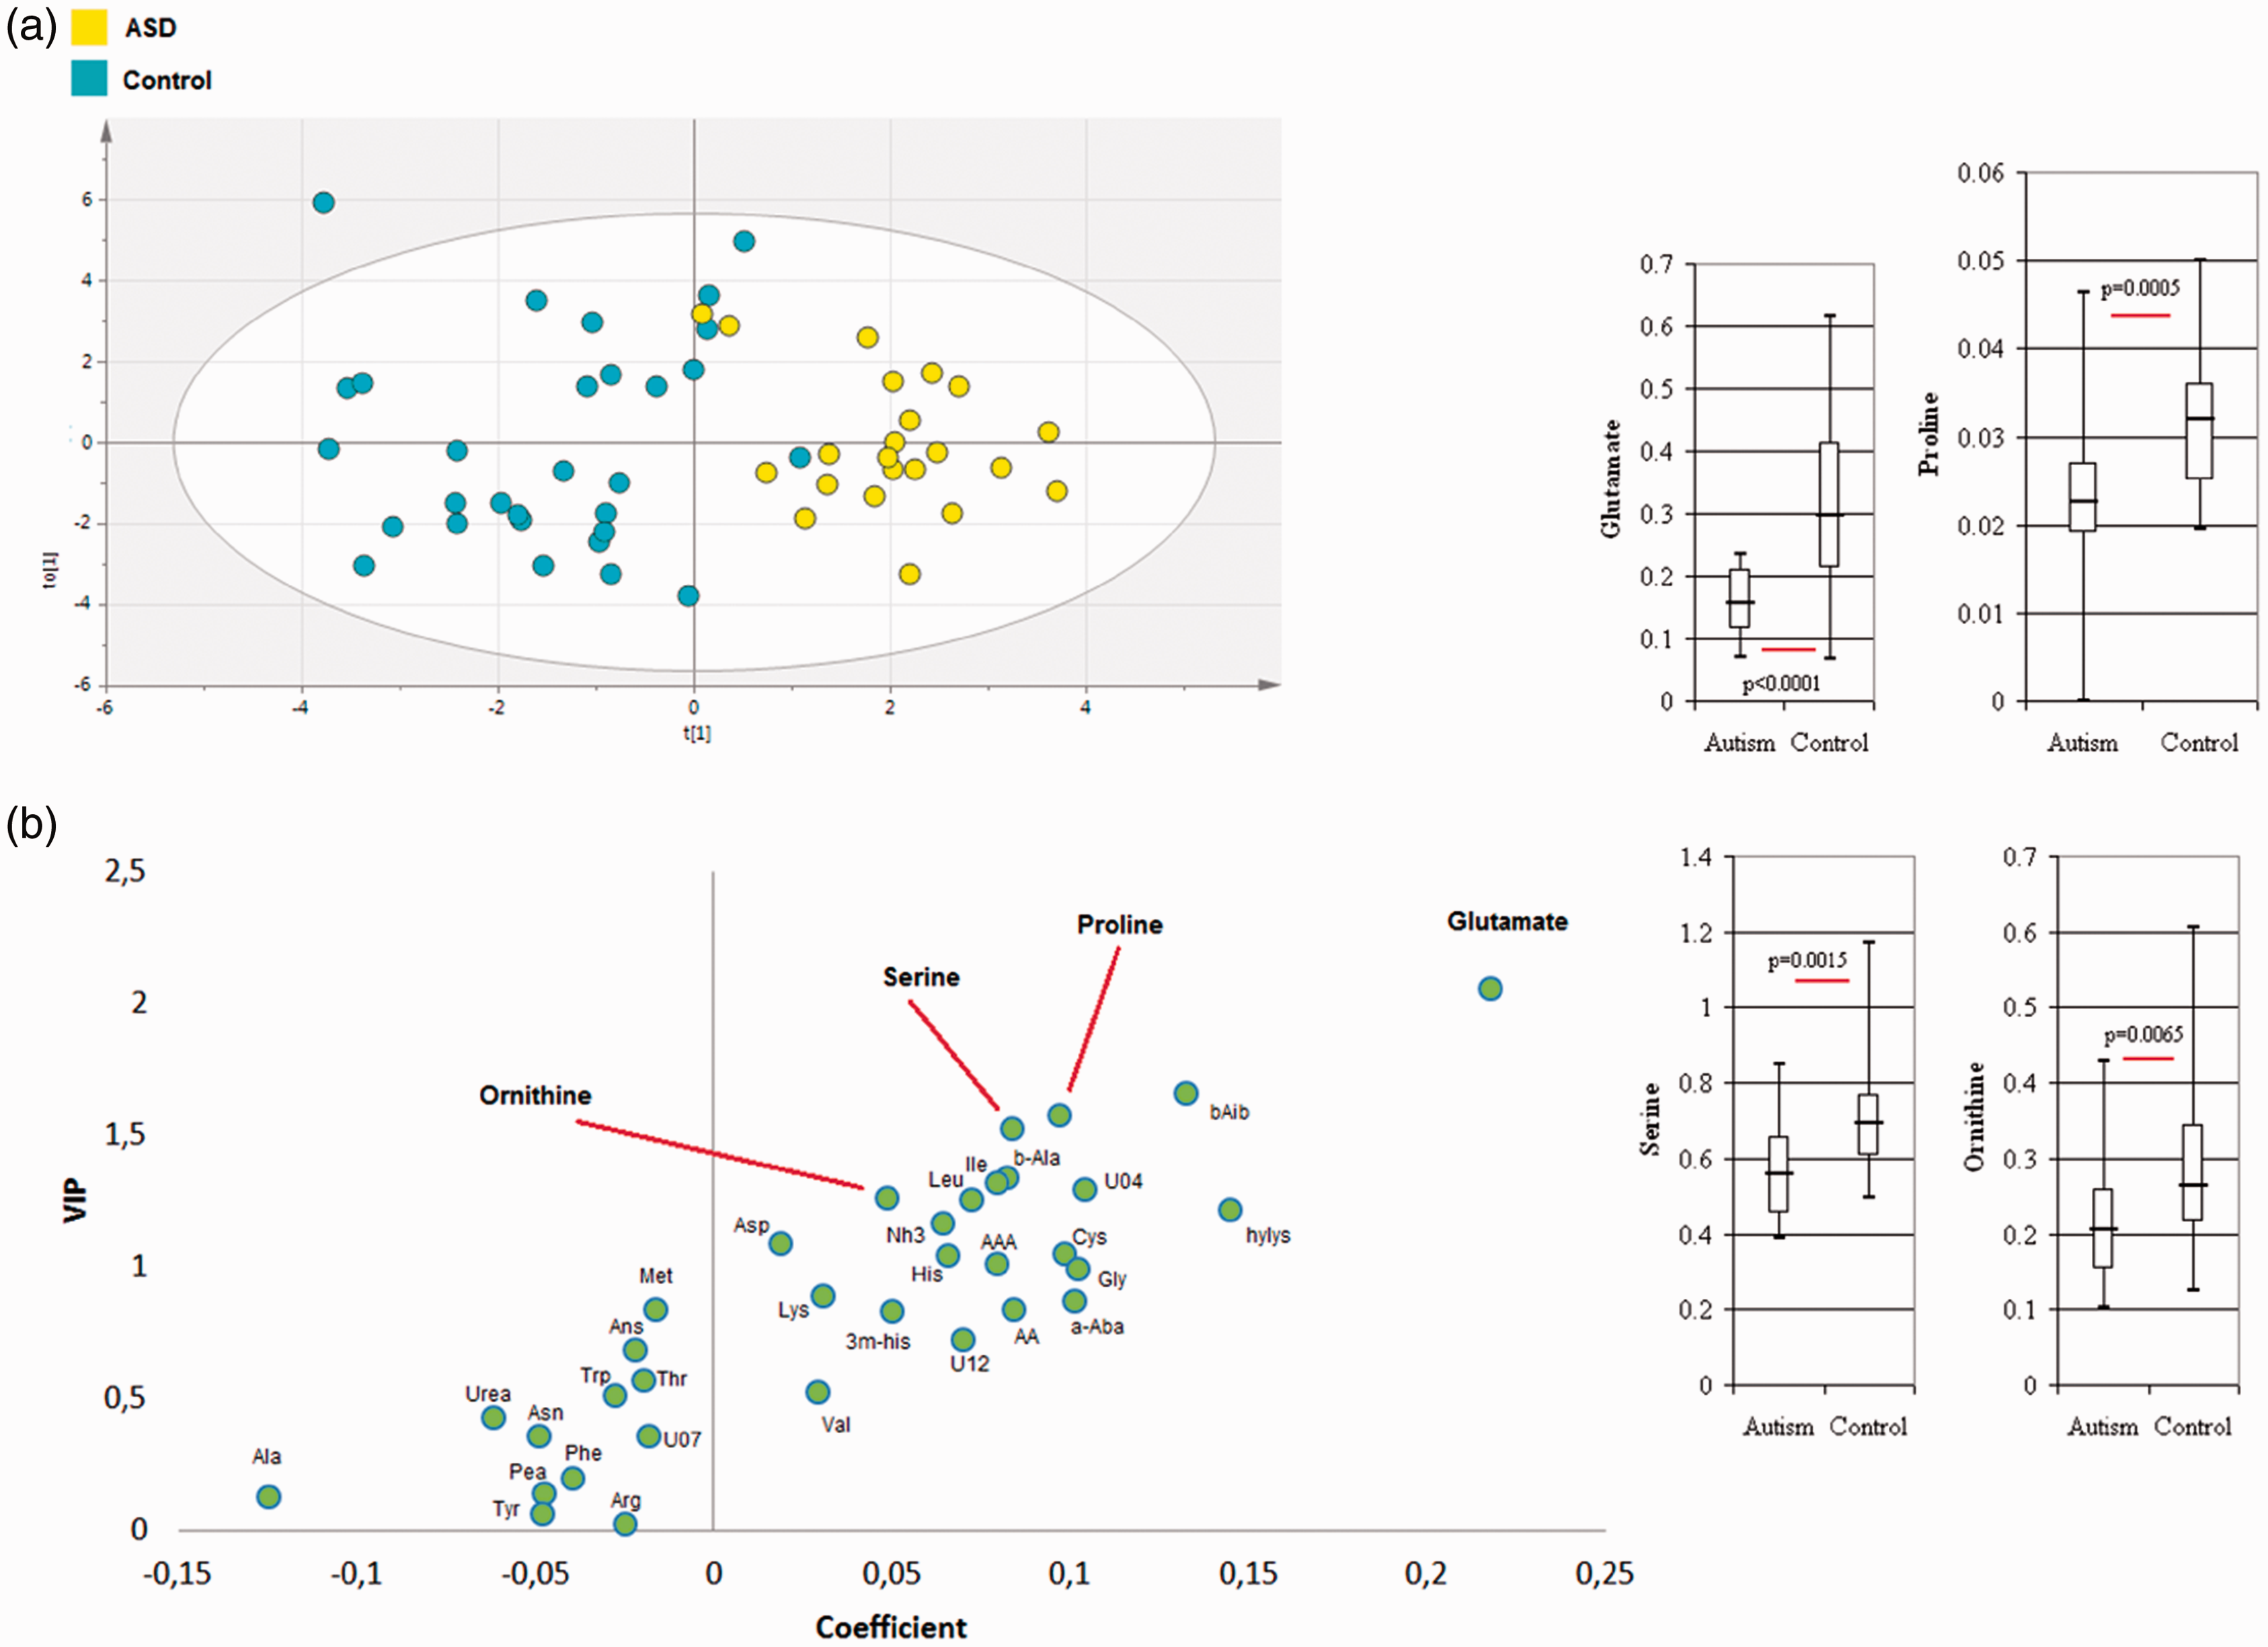
Multivariate analyses from the metabolome profile of: (a) ASD (n = 22) and controls (n = 30). Score plot of OPLS-DA model; 34 metabolites, CV ANOVA = 2e−7. (b) Loading plot of the OPLS-DA model highlighting glutamate, proline, serine and ornithine. Metabolite concentrations are represented by the median, upper and lower quartiles and minimum and maximum data values.
Multivariate analysis to compare ID and controls resulted in a correct model from 18 metabolites with R2X(cum) = 0.365, R2Y(cum): 0.507, Q2(cum): 0.315 and CV ANOVA = 0.0003 (Figure 3(a)). The metabolites that contributed to the model are represented in Figure 2(d) and especially revealed urea, glutamate, serine, ornithine, proline and 1-methyl-histidine. Univariate analysis showed lower glutamate (P = 0.0002) and serine (P = 0.0017) concentrations in the ID than control group (Figure 3(b)), and a significantly higher urea concentration (P < 0.0001) in the ID group than in controls.
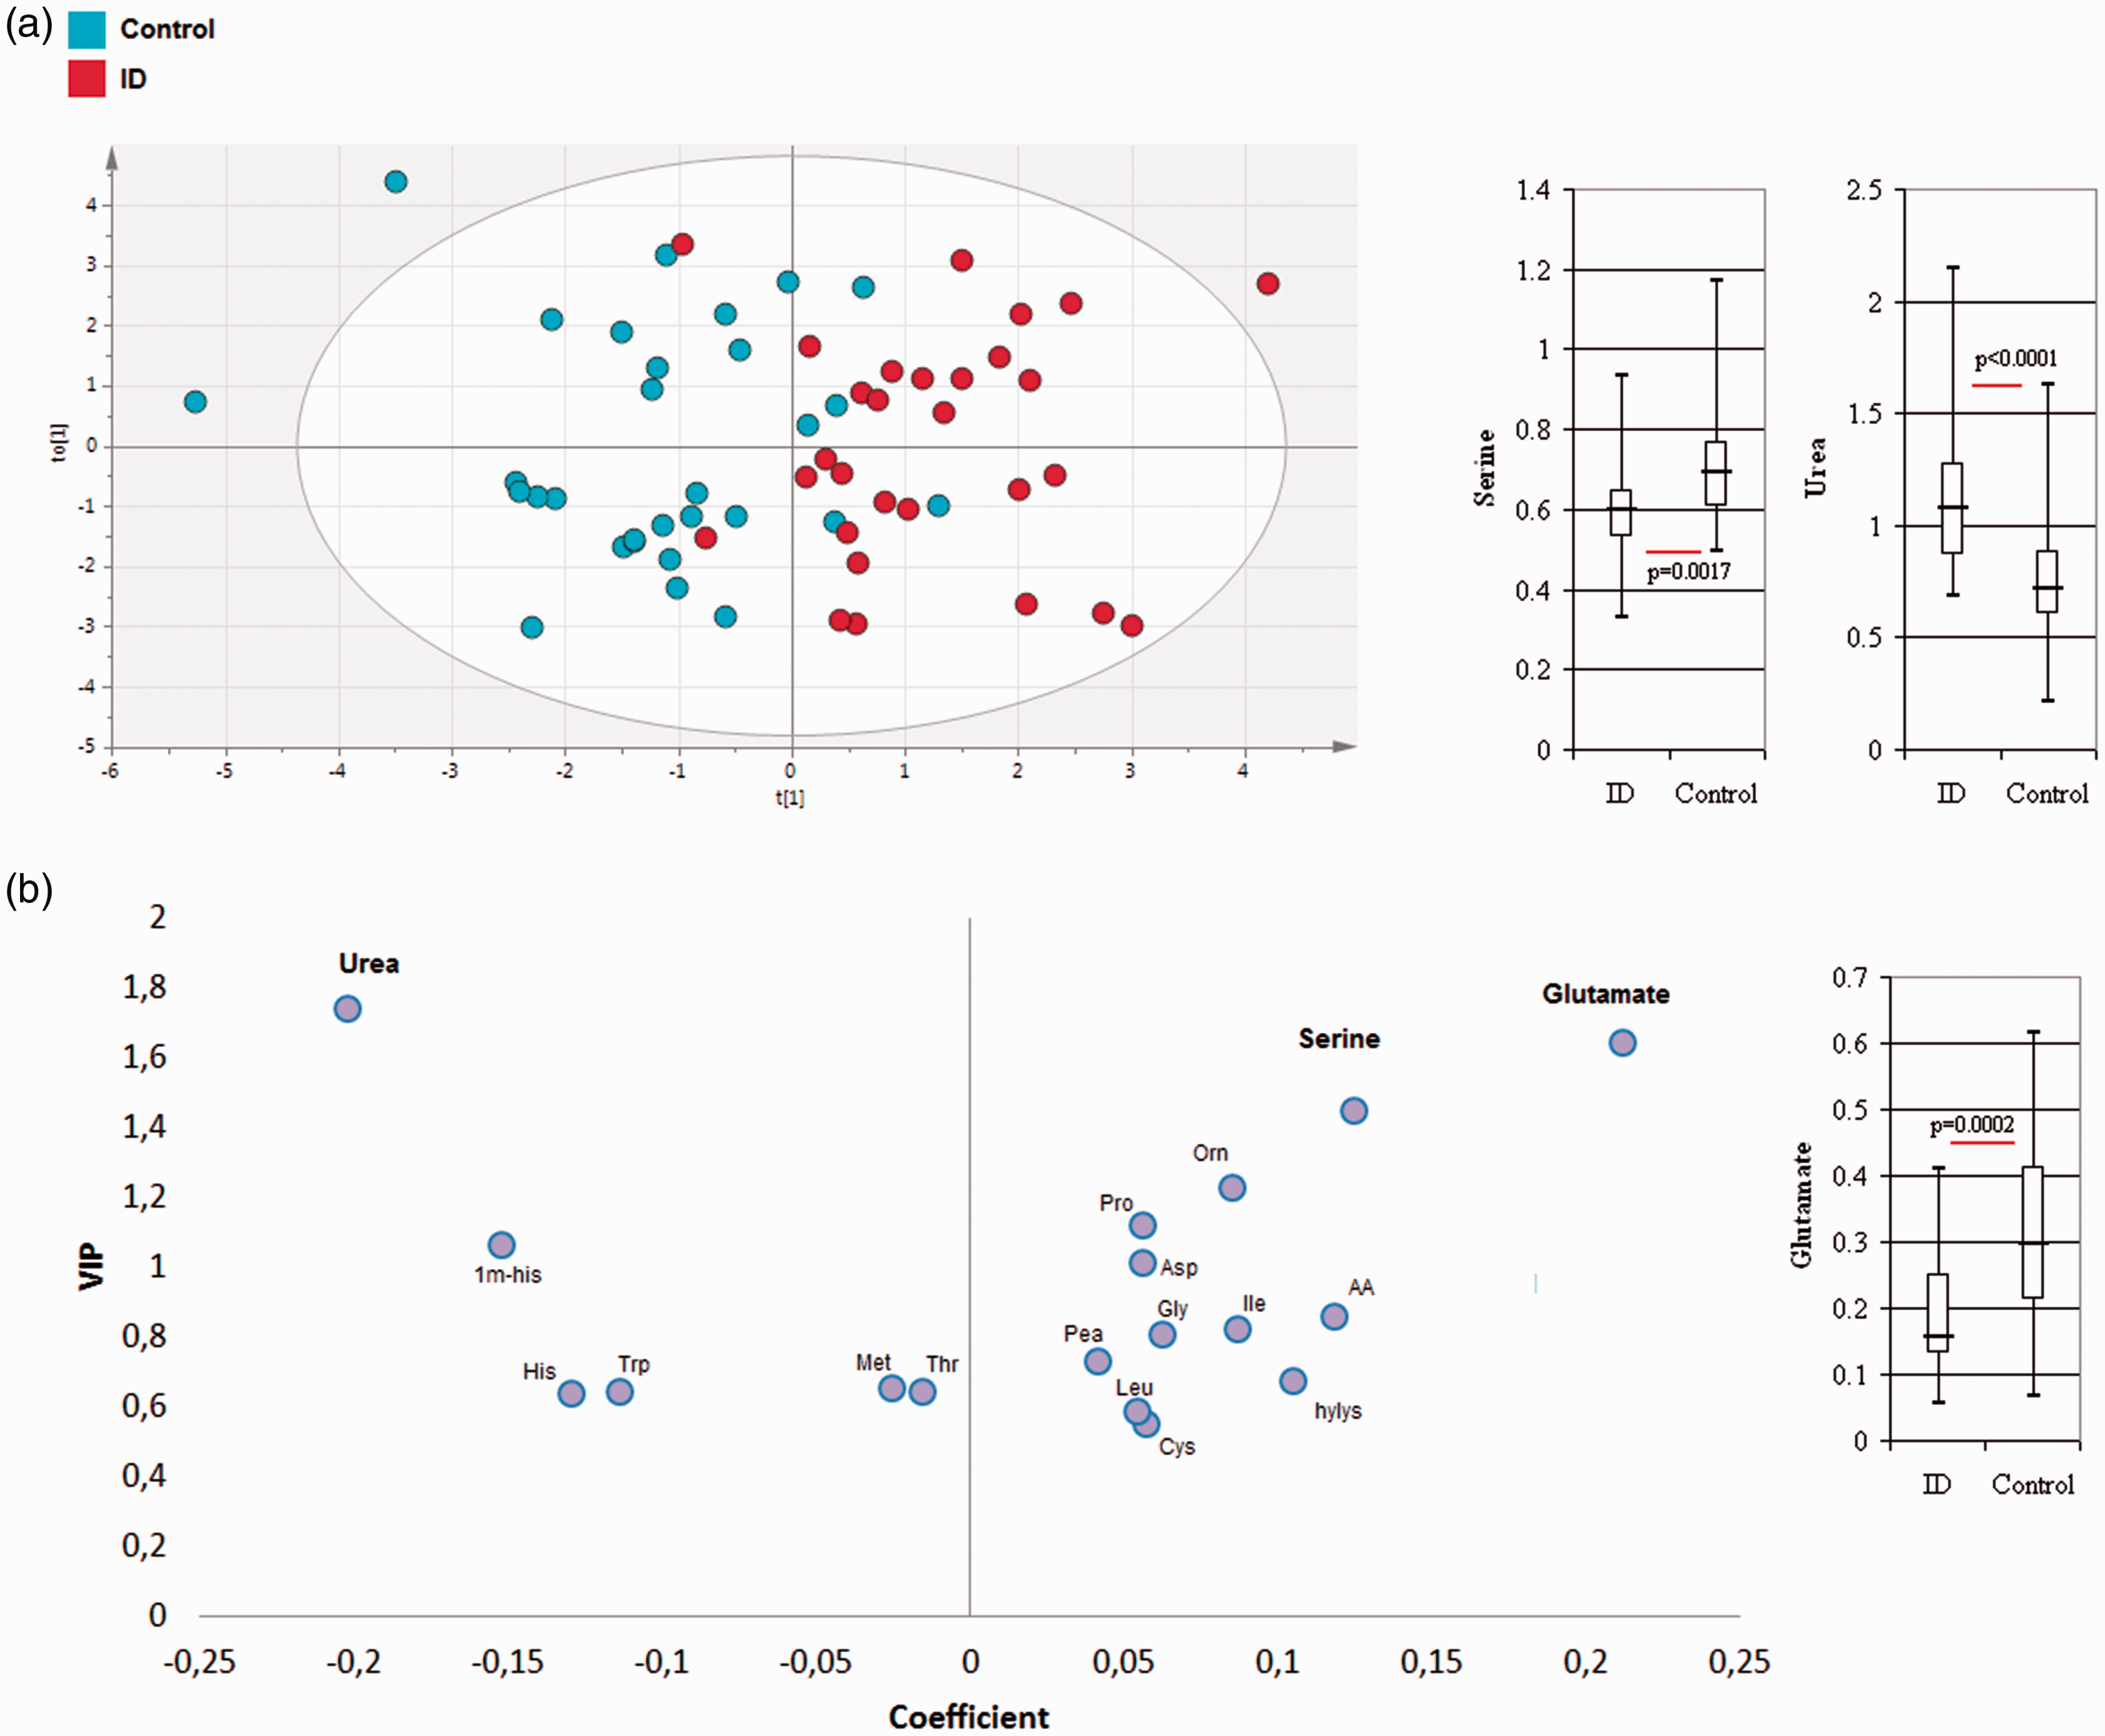
Multivariate analyses from the metabolome profile of: (a) ID (n = 29) and controls (n = 30). Score plot of OPLS-DA model: 18 metabolites, CV ANOVA = 0.0003. (b) Loading plot of the OPLS-DA model highlighting glutamate, serine and urea. Metabolite concentrations are represented by the median, upper and lower quartiles and minimum and maximum data values.
Biosigner analysis revealed that urea and alanine provided a prediction of the group with an accuracy of 0.79 on the final S signature for the SVM classifier. Urea passed the iteration to the A tier with an accuracy of 0.70 for the PLS-DA to discriminate between ID and control. No feature was selected to be significant in the last iteration with the RF classifier.
Metabolic signature discriminating between ASD and ID children
Multivariate analysis, based on 21 metabolites, resulted in a correct model that could discriminate between ASD and ID with R2X(cum) = 0.339, R2Y(cum): 0.749, Q2(cum): 0.576 and CV ANOVA = 6.12.10−7 (Figure 4(a)). The metabolites that contributed to the model shown in Figure 4(b) highlighted urea, histidine, lysine, ammonia and beta-aminoisobutyric acid. Univariate analysis showed higher 3-methyl-histidine (P = 0.0038), histidine (P = 0.003), urea (P = 0.0006) and lysine concentrations (P = 0.0018) in the ID (Figure 4(b)) than in the ASD group.
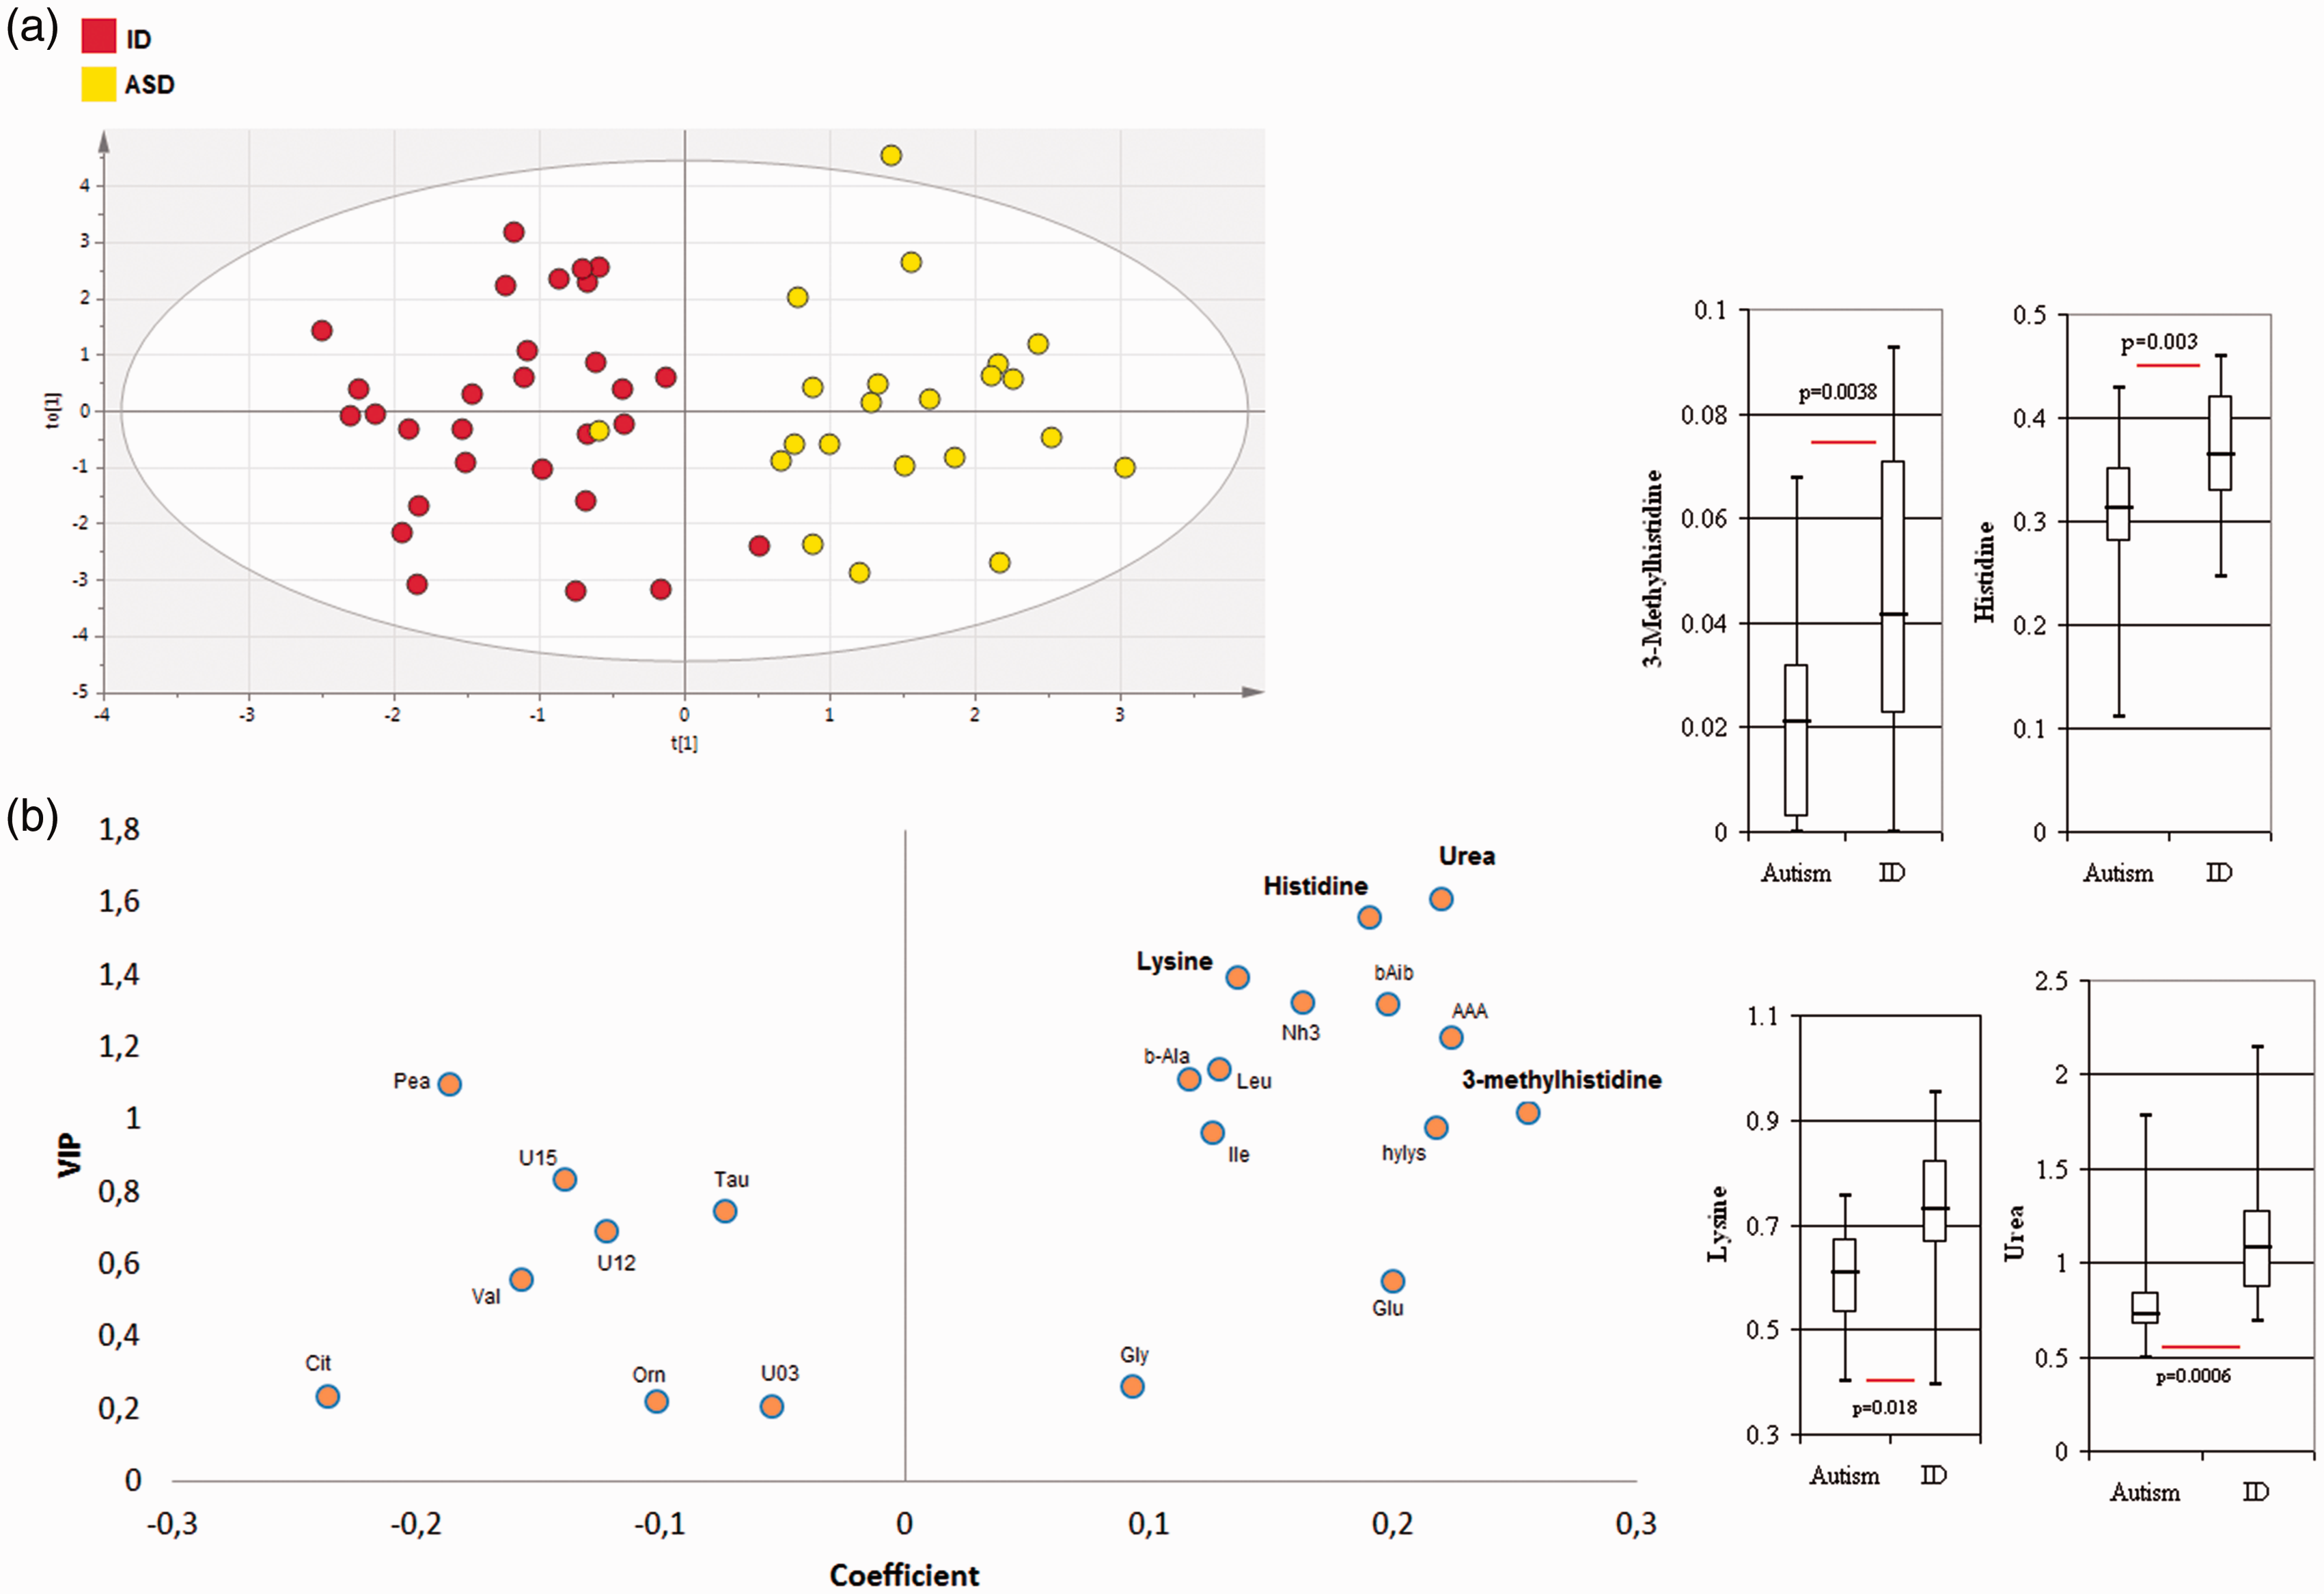
Multivariate analyses from the metabolome profile of: (a) ASD (n = 22) and controls (n = 30). Score plot of OPLS-DA model: 21 metabolites, CV ANOVA = 6.12613e−7. (b) Loading plot of the OPLS-DA model highlighting 3-methylhistidine, histidine and urea. Metabolite concentrations are represented by the median, upper and lower quartiles and minimum and maximum data values.
Biosigner script allowed the identification of different molecular signatures for ASD and ID. Urea, 3methyl-histidine and histidine passed all selection iterations and provided a prediction of the group with an accuracy of 0.79 on the final S signature for the PLS-DA. Urea passed the iteration to the A tier, with an accuracy of 0.68 with the RF, and no feature was selected to be significant in the last iteration with the SVM classifier.
Specific metabolites in ASD and ID and associated pathways
The most discriminant metabolites revealed by the three OPLS-DA models are shown in Figure 5(a) and revealed some specific metabolites (50% of the total metabolites): hydroxylysine and U04 observed in the model ASD–control, aspartate, U01 and glycine observed in the model ID–control and histidine, lysine, ammonia, aminoadipic acid and phenylethylamine observed in the model ASD-ID. The most relevant pathways involved in the different models are shown in Figure 5(b) and mainly correspond to the metabolism of arginine and proline, glycine, serine and threonine, alanine, aspartate and glutamate for the comparison ASD or ID vs. controls. The pathways corresponding to histidine and b-alanine metabolism were specifically revealed by the comparison ASD–ID.
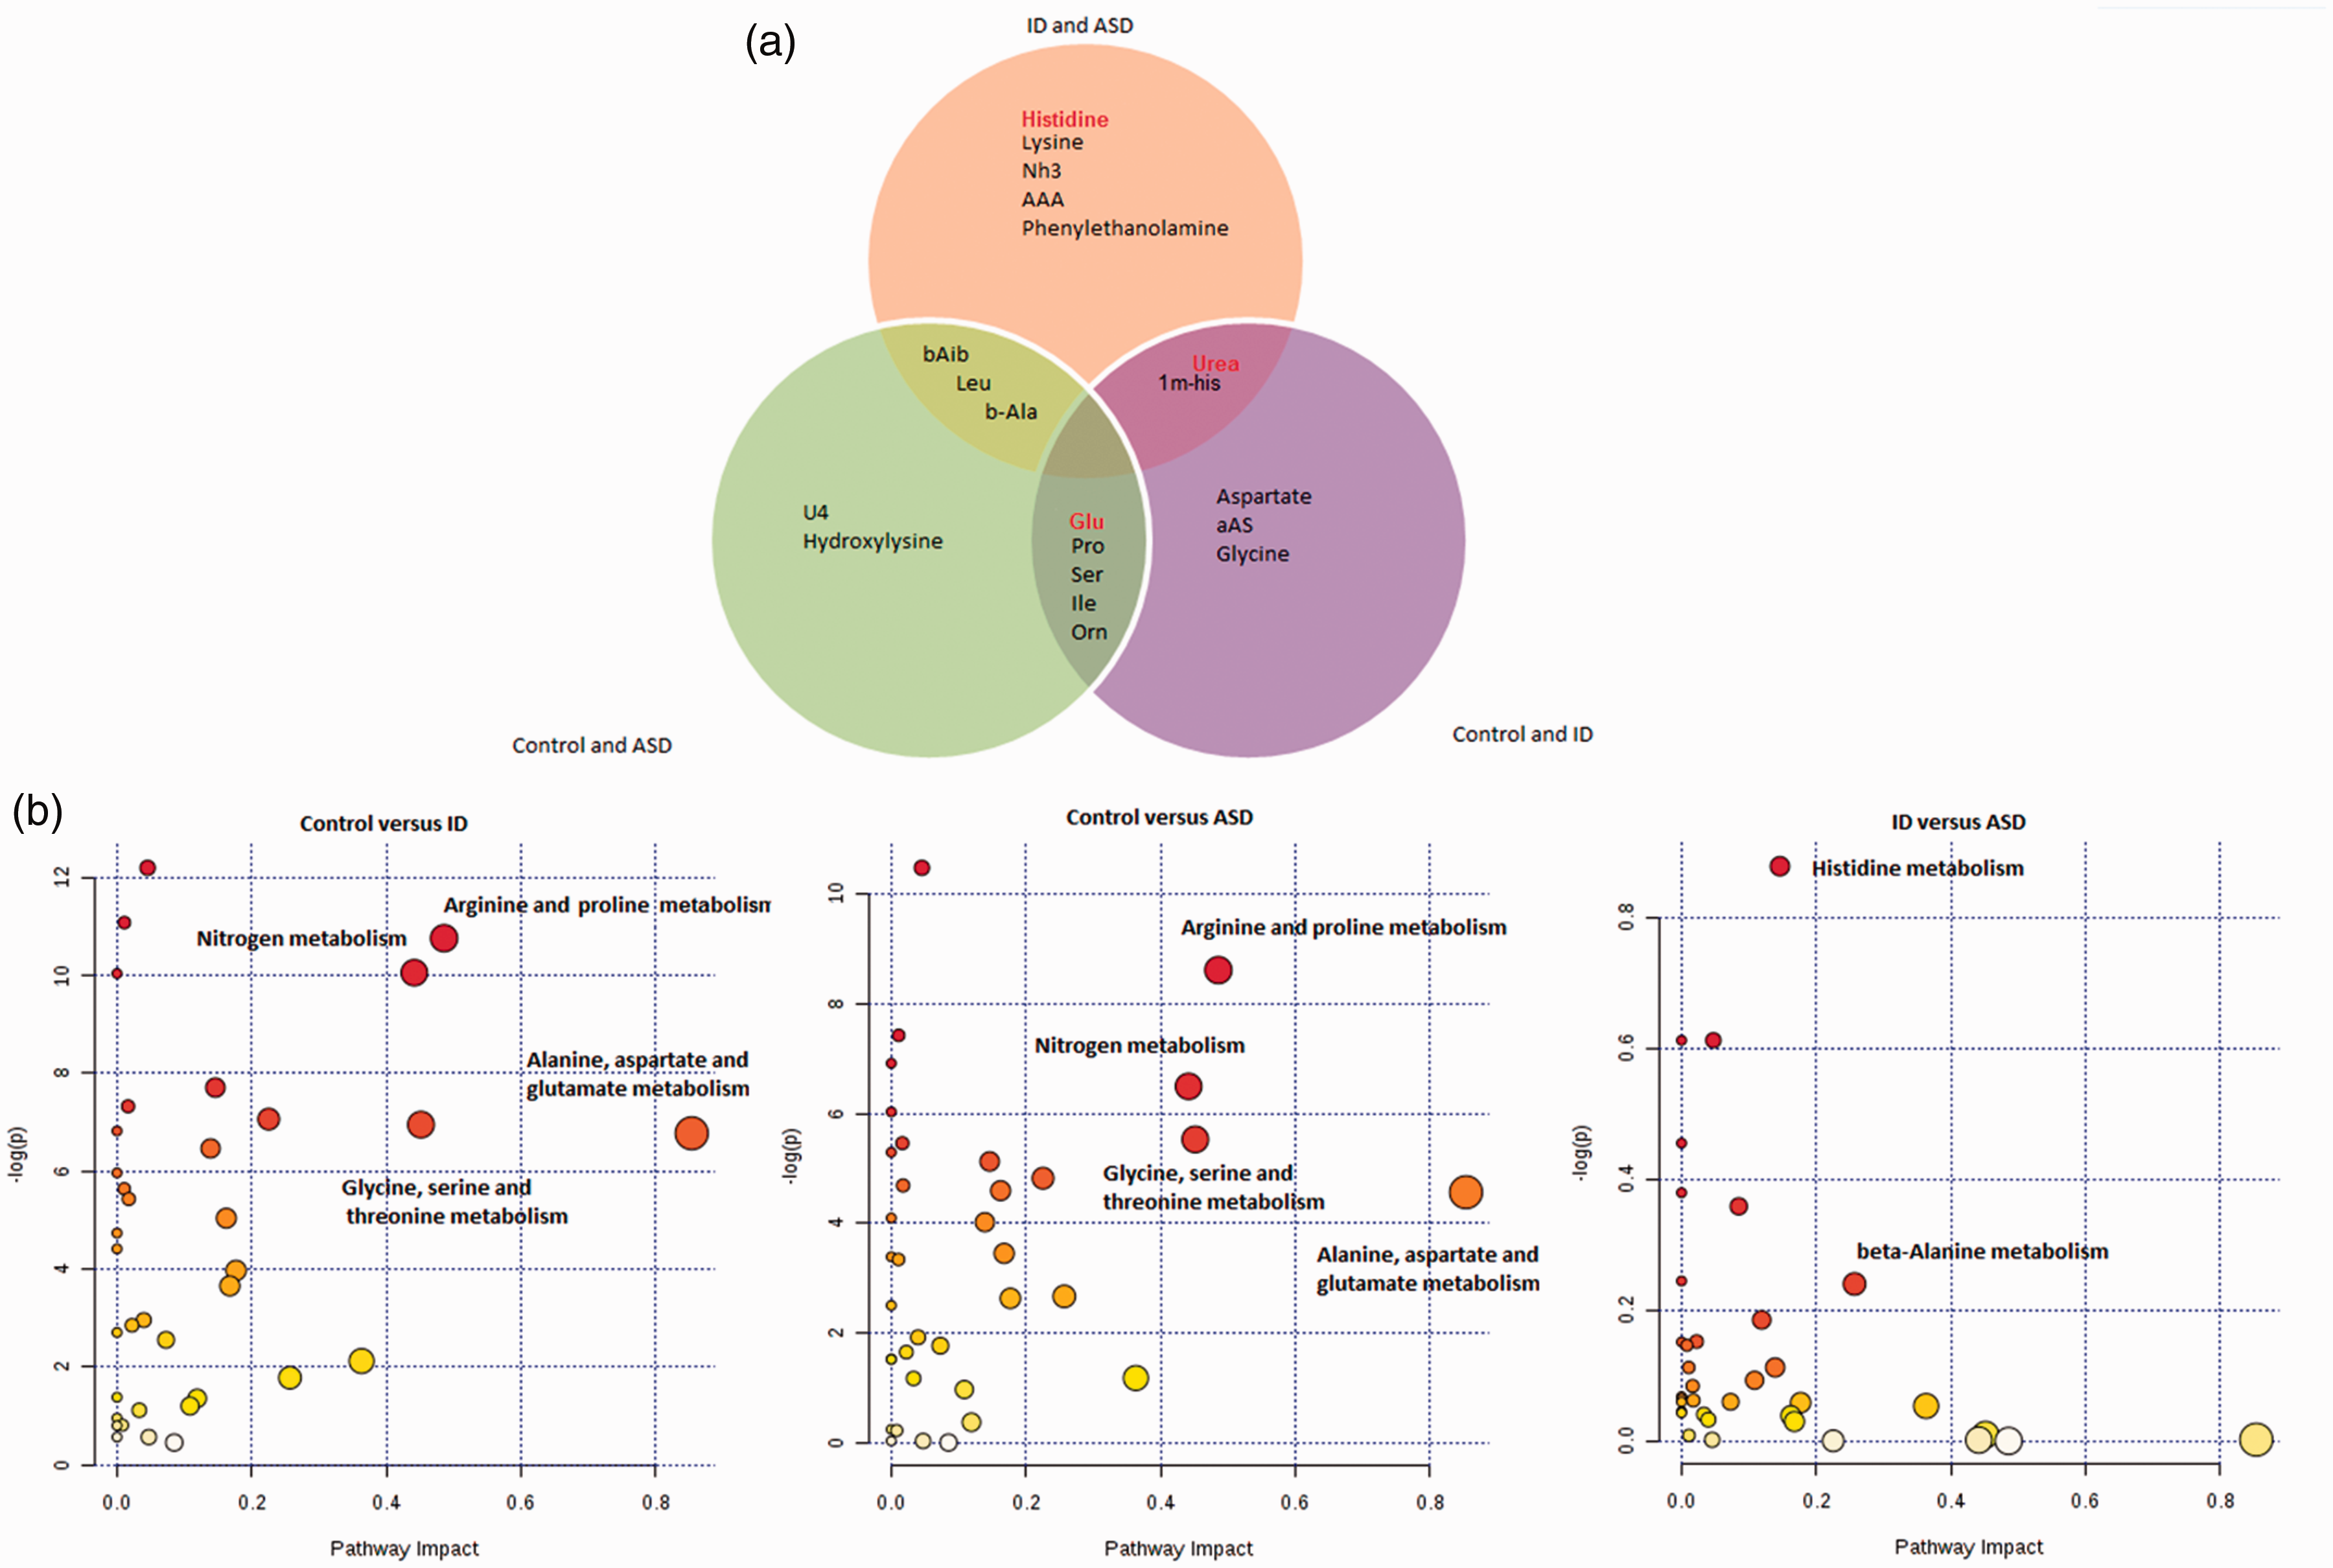
(a) Venn diagram showing the 10 best variable influence on projection (VIP) identified from the OPLS-DA for control versus ASD (left circle), control versus ID (right circle), and ASD versus ID (top circle). The red colour identifies the metabolites that were revealed by the biosigner script. (b) Metabolic pathways identified by METPA web application from the metabolites noted in the Supplementary Table 2.
Discussion
Metabolomics offers the ability to identify the molecular signatures of cellular processes, molecular interactions and metabolic pathways on a systems scale. This strategy holds promise for the investigation of complex diseases, such as neurodevelopmental disorders with multifactorial underpinnings. In the present study, we aimed to re-analyse exploratory AA analyses of ASD, ID and control patients based on a metabolic profile rather than independent metabolites. Our major findings were: (1) the identification of relevant metabolites that discriminate between ASD, ID and controls, (2) common metabolic pathways to discriminate between ASD or ID and controls (3) distinct metabolic pathways in the discrimination between ASD and ID.
Control samples for AA analysis from healthy children with no clinical suspicion of metabolic disease were not available. The main aim of this preliminary study was to re-analyse samples obtained from routine practice with a new emergent analysis method in order to improve our understanding of these diseases with a straightforward analytical tool, available in many laboratories. We recognize that a weakness of this preliminary study is that the control group did not comprise healthy subjects and that any future confirmatory study should include such a control group.
Robust statistical analysis and performant modelling
The best strategy of statistical analysis for ‘omics’ data (i.e. OPLS-DA and PCA) is still open to debate. A new method, the biosigner algorithm, based on various learning strategies and including bootstraps, appears to be robust for highlighting discriminant metabolites and judging the fitness of a model. The strength of our study is the data analysis strategy based on a combination of different analysis methods: univariate analysis with correction for multiple tests and multivariate analysis using OPLS-DA, PCA (SIMCA®) and the biosigner strategy. All the models built in this study reached excellent performances (R2X(cum) >0.27, R2Y(cum) >0.50, Q2(cum) >0.31 and CV ANOVA <0.0003). Again, although biosigner algorithm is highly restrictive, it provided significant models (for the three comparisons), with findings common to other statistical approaches.
Actors of neurotransmission involved in the metabolomic discrimination between ASD or ID and controls
Our study showed that the most relevant metabolites and pathways involved in the discrimination between ASD or ID and control groups were highly similar (Figure 5) and are consistent with pathogenesis of these disorders, such as neuronal activity and synaptic transmission. 26 Our study is focused on blood AA concentrations, but our results are likely to be relevant for neurotransmission due to AA transport across the blood–brain barrier by well-known mechanisms.27–29
A particular finding of note was the lower blood glutamate concentrations in ASD and ID relative to controls but with no significant difference between the ASD and ID groups. Although the interpretation of altered glutamate concentrations in ASD patients is open to debate, this pathway may play a putative key role. Indeed, some studies have reported that plasma glutamate concentrations were significantly higher in ASD patients than in healthy controls while others find no difference.30–35 It has also been suggested that blood glutamate concentrations may serve as a potential biomarker for the diagnosis of ASD. 36 Contrary to our findings, a recent study found that glutamate may help to distinguish ID from ASD. 31 Several confounding factors may explain this apparent discrepancy, such as the heterogeneity in the demographic and clinical characteristics of the study cohorts: inclusion of Asperger’s syndrome in ASD group, geographical origin with a predominance of Asiatic subjects, age, treatment.31,36,37 As blood glutamate concentrations positively correlate with those in the cerebrospinal fluid of humans, 38 our findings may indicate lower glutamate concentrations in brain of ASD/ID patients than controls, which is consistent with some proton magnetic resonance spectroscopy ([1H]MRS) studies. 39
Diverse mechanisms may be involved to link systemic metabolic disturbances and brain pathology, as suggested by biomarkers studies identified from urine or gut microbiota.40–44 Abnormal glutamate concentrations may be associated with a wide variety of neurobiological and behavioural alterations: 45 for example, the acquisition of a conditioned emotional response, 46 the imbalance of the excitation/inhibition equilibrium of cortical networks. 47 Interestingly, findings in animal research revealed that hypoglutamatergic animals displayed an autistic behavioural pattern. 48 Due to the potential impact of drugs on metabolic pattern, as reported in the literature, we investigated but did not find any relationship between specific antiepileptic drugs and metabolite profile (Supplementary Figures 1 to 3).
We also identified glycine and serine among the most informative metabolites. Glycine is a major inhibitory neurotransmitter in the central nervous system and may be involved in neurological disorders.49,50 Glycine induces membrane depolarization, acting as an excitatory neurotransmitter during prenatal development, 51 with a role of co-agonist at N-methyl-D-aspartate (NMDA) excitatory receptors, 52 with its role then changing from excitatory to inhibitory at birth and remaining inhibitory during maturation. As the activity and regulation of glutamatergic synapses are essential for normal cognition, 53 the identification of glycine in models discriminating between ASD or ID and controls is consistent with this. Similarly, serine is a potent NMDA receptor co-agonist in some mammalian brain regions and is possibly involved in the pathogenesis of several psychiatric and neurological disorders.54,55 Reduced concentrations of D-serine in serum and cerebrospinal fluid have been associated with cognitive impairment and L-serine itself has clear trophic effects on neuronal cultures with a role in the synthesis of lipid messenger molecules,56–58 such as phosphatidylserine and ceramide and the neuromodulators glycine and D-serine. 59 However, these findings must be interpreted with caution, as many of the control subjects were taking antiepileptic drugs that may interfere with AA metabolism.60,61 However, as described above, we did not observe any relation between metabolic profile and treatment (Supplemental Figures 1 to 3), suggesting that these findings may relate to the underlying condition. As previously published studies have rarely specified the type or duration of treatment (including antiepileptic drugs), the discussion in relation to previous findings remains also difficult.
Histidine and b-alanine metabolism specifically discriminant between ASD and ID
Among the several metabolites that allowed discrimination between ASD and ID, we observed that the most significant were histidine and beta-alanine. These findings may be related to the role of carnosine, which is a dipeptide containing beta-alanine and histidine that is able to modulate several biochemical changes associated with aging, 62 cognitive deficits, depression and ID. 63 Our study also identified urea and 3-methylhistidine as major discriminant metabolites between ASD and ID with higher levels in ID. We suggest that this observation may be associated with significant different protein catabolic rates or alimentary defects in these disorders, 63 and these surprising findings need to be further explored. Importantly, the pathways identified in the model discriminating between ASD and ID had both, low impact and ‘−log p’ (Figure 5(b)), compared with other models. We suggest that the findings highlighted in this model discriminating between ASD and ID relate to the metabolic pathway as a whole rather than a single metabolite. This finding reinforces the value of analysing data through a global metabolic pattern and not through a focus on individual metabolites. Limitations of this study included the small size of the cohort and the absence of healthy subject control group. We are currently recruiting a prospective cohort for LC/MSMS analysis of plasma from non-epilepsy patients and patients with attention-deficit hyperactivity disorder; this will allow further evaluation of the findings presented here.
Conclusion
We found discriminant AA profiles between ASD, ID and controls. We identified several metabolites that may be linked with glutamate neurotransmission for comparison between patients and controls. This preliminary study demonstrates the potential to develop an AA-based biological profile that may help in improving our understanding of the physiopathology or metabolic pathways of neurodevelopmental diseases. This work should be extended to a larger prospective cohort with inclusion of eating habits, dietary patterns, 64 functional gastrointestinal abnormalities and psychoactive medication.
Supplemental Material
Supplemental material for Post hoc analysis of plasma amino acid profiles: towards a specific pattern in autism spectrum disorder and intellectual disability
Supplemental material for Post hoc analysis of plasma amino acid profiles: towards a specific pattern in autism spectrum disorder and intellectual disability by Jean-Baptiste Delaye, Franck Patin, Emmanuelle Lagrue, Olivier Le Tilly, Clement Bruno, Marie-Laure Vuillaume, Martine Raynaud, Isabelle Benz-De Bretagne, Frederic Laumonnier, Patrick Vourc'h, Christian Andres and Helene Blasco in Annals of Clinical Biochemistry
Footnotes
Acknowledgements
The authors would like to thank the technical staff of the clinical biochemistry laboratory of Tours Hospital who performed the routine laboratory tests.
Declaration of conflicting interests
The author(s) declared no potential conflicts of interest with respect to the research, authorship, and/or publication of this article.
Funding
The author(s) received no financial support for the research, authorship, and/or publication of this article.
Ethical approval
Not applicable.
Guarantor
HB.
Contributorship
JBD: performed the statistical analysis, interpreted the data and wrote the first draft of the manuscript.
FP: performed the statistical analysis and critically revised the manuscript for important intellectual content.
EL: recruited the patients and critically revised the manuscript for important intellectual content.
OLT: collected data.
CB: collected data.
MLV, MR, IBB, FL, PV and CA: critically revised the manuscript for important intellectual content.
HB: designed the study, verified the statistical analyses and critically revised the manuscript for important intellectual content.
Supplementary material
Supplementary material for this article is available online.
References
Supplementary Material
Please find the following supplemental material available below.
For Open Access articles published under a Creative Commons License, all supplemental material carries the same license as the article it is associated with.
For non-Open Access articles published, all supplemental material carries a non-exclusive license, and permission requests for re-use of supplemental material or any part of supplemental material shall be sent directly to the copyright owner as specified in the copyright notice associated with the article.