
Abstract
Background
In cerebrospinal fluid (CSF) spectrophotometry, if the net bilirubin absorbance (NBA) and net oxyhaemoglobin absorbance (NOA) are both raised with a visible oxyhaemoglobin peak, the revised national guidelines for analysis of CSF bilirubin advise interpreting the results as ‘Consistent with subarachnoid haemorrhage (SAH)’ regardless of the CSF total protein concentration of the specimen. We wanted to study the range of CSF total protein concentrations found in confirmed SAH to establish if the CSF total protein value can give further guidance on the likelihood of SAH.
Methods
Consecutive cases from five different hospital sites were included if the CSF NBA was greater than 0.007 AU and the NOA was greater than 0.02 AU with a visible oxyhaemoglobin peak. For the cases identified, the laboratory information management system and patient records were interrogated to identify the total protein concentration of the CSF specimen and whether SAH had ultimately been confirmed or excluded by other methods and supporting evidence.
Results
Results from 132 patients were included. The CSF total protein range in confirmed SAH was 0.23–3.08 g/L with a median concentration of 0.7 g/L (n = 51). In the SAH excluded group, the CSF total protein range was 0.43–29 g/L with a median concentration of 1.9 g/L (n = 81).
Conclusions
Although confirmed SAH was not associated with the very highest concentrations of CSF total protein, a definite CSF protein cut-off concentration above which SAH could reliably be excluded cannot be recommended.
Introduction
In patients presenting with headache it is crucially important to detect subarachnoid haemorrhage (SAH) so that re-bleeding can be prevented and patient outcomes are improved. 1 There are now well-established protocols for the investigation of possible SAH so that this important diagnosis is not missed. Typically, a computed tomography (CT) scan is the first line test with spectrophotometric analysis of cerebrospinal fluid (CSF) forming a useful second line test in patients considered to have a high likelihood of SAH despite a negative CT scan. 2
Following a haemorrhage, rapid red blood cell lysis leads to the release of oxyhaemoglobin in the CSF which is then converted into bilirubin by enzymes present in macrophages and other cells of the leptomeninges. Bilirubin is considered the key finding in spectrophotometry since it is the only pigment that will solely form in vivo and will not form in vitro following a traumatic lumbar puncture when blood is introduced into the CSF specimen at the sampling site. 3
Guidelines for analysis of CSF for bilirubin in suspected SAH were originally published by the UK NEQAS Specialist Advisory Group (SAG) for External Quality Assurance (EQA) of CSF Analysis in 2003. 4 It was the aim of these guidelines to harmonise the clinical laboratory approach to analysis and interpretation of CSF spectrophotometry to evidence-based best practice standards. Following a national audit 5 and iterative consultation, 6 a revised version of this guideline was published in 2008. 2
One of the aims of the revised guidelines was to emphasise the clinical significance of increased CSF bilirubin with a visible oxyhaemoglobin absorbance peak irrespective of the CSF total protein concentration. CSF total protein is a non-specific marker and may be increased in inflammatory conditions where there is increased permeability of the blood–CSF barrier or if there is obstructed flow of CSF leading to progressive equilibration of the static CSF with plasma. 7 A raised CSF total protein can make the interpretation of a CSF spectrophotometric scan more difficult. A turbid specimen will have a broad range of absorbance in the region of interest between 400 and 500 nm and whilst a high CSF total protein is typical in infective pathologies such as meningitis, it is also to be expected following SAH. 8 How to interpret CSF spectrophotometry results in patients with a raised CSF total protein therefore presents a challenge.
When the net bilirubin absorbance (NBA) is greater than 0.007 AU and the net oxyhaemoglobin absorbance (NOA) is greater than 0.02 AU with a visible oxyhaemoglobin peak, the revised guidelines recommend reporting these results as ‘Consistent with SAH’ regardless of the CSF total protein so that this important diagnosis is not excluded. However, it is commonly considered that a grossly raised CSF total protein is unlikely to be associated with SAH and is more likely due to an alternative pathology. It was the aim of this study to collect data on the range of CSF total protein concentrations found in patients with confirmed SAH and provide evidence to aid the interpretation of CSF spectrophotometric scans in patients with an elevated CSF total protein concentration.
Method
Data were collated retrospectively from consecutive CSF specimens received at five different hospital sites for xanthochromia analysis between September 2006 and April 2013. All sites determined xanthochromia according to the revised guidelines for analysis of CSF for bilirubin in suspected SAH published by the UK NEQAS SAG for EQA of CSF Analysis. 2 Specimens were included if the NOA was >0.02 AU, with a visible oxyhaemoglobin peak and the NBA was >0.007 AU, i.e. all those specimens that would be reported as ‘Consistent with SAH’ if the guidelines were followed verbatim.
For the CSF specimens identified, the local laboratory information management system (LIMS) was interrogated to retrieve the CSF total protein concentration. The method for CSF total protein analysis varied between sites with three sites using pyrogallol red molybdate in acid, 9 one site using benzethonium chloride 10 and one site using the Lowry protein assay. 11
The patient case notes and subsequent clinical details provided were studied to establish whether or not SAH was confirmed. SAH was considered to be confirmed if there was supporting evidence of haemorrhage from CT imaging or cerebral angiography or if it could be established that the patient had subsequently undergone treatment for SAH, for example coiling of a cerebral aneurysm. SAH was considered to be excluded if there was no evidence of SAH by imaging and another cause for the CSF spectrophotometry results, such as meningitis, was diagnosed.
The sensitivity and specificity of different concentrations of CSF total protein to diagnose SAH in patients with raised NBA and NOA were calculated. Receiver operating characteristics (ROC) curve analysis was performed to identify if there was a suitable CSF total protein cut-off that could be used to distinguish SAH in these patients.
Results
There were 145 sets of results that met the criteria for inclusion. For 13 of these cases the final diagnosis remained unclear and we were unable to establish with certainty whether SAH had ultimately been confirmed or excluded. Of the remaining 132 cases, SAH was confirmed in 51 cases and excluded in 81 cases.
CSF total protein characteristics in patients with NBA>0.007 AU and NOA>0.2 AU (n = 132).
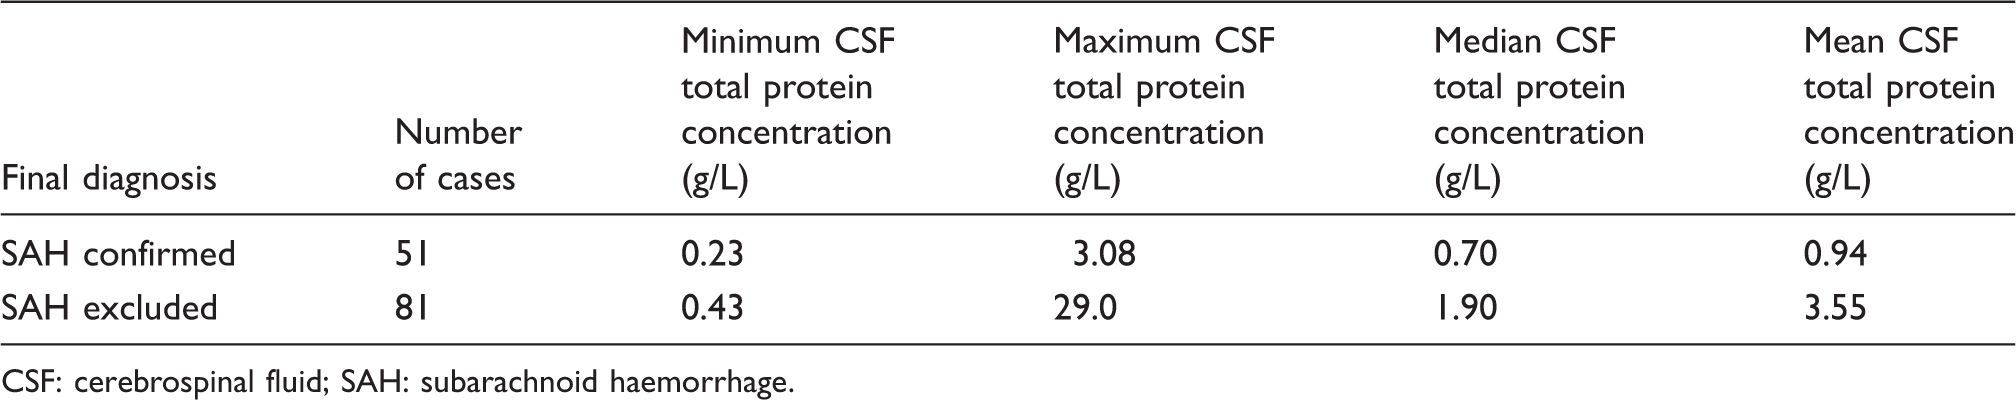
CSF: cerebrospinal fluid; SAH: subarachnoid haemorrhage.
Both of the SAH confirmed and SAH excluded groups showed a wide range of CSF total protein concentrations. No confirmed SAH patients had a CSF total protein greater than 3.08 g/L and no patients with SAH excluded had a CSF total protein concentration less than 0.43 g/L. However, there was an overlap of patients from both groups with CSF total protein in the range 0.43–3.08 g/L (Figure 1).
The proportion of cases of confirmed SAH as the CSF total protein concentration increases. CSF: cerebrospinal fluid; SAH: subarachnoid haemorrhage.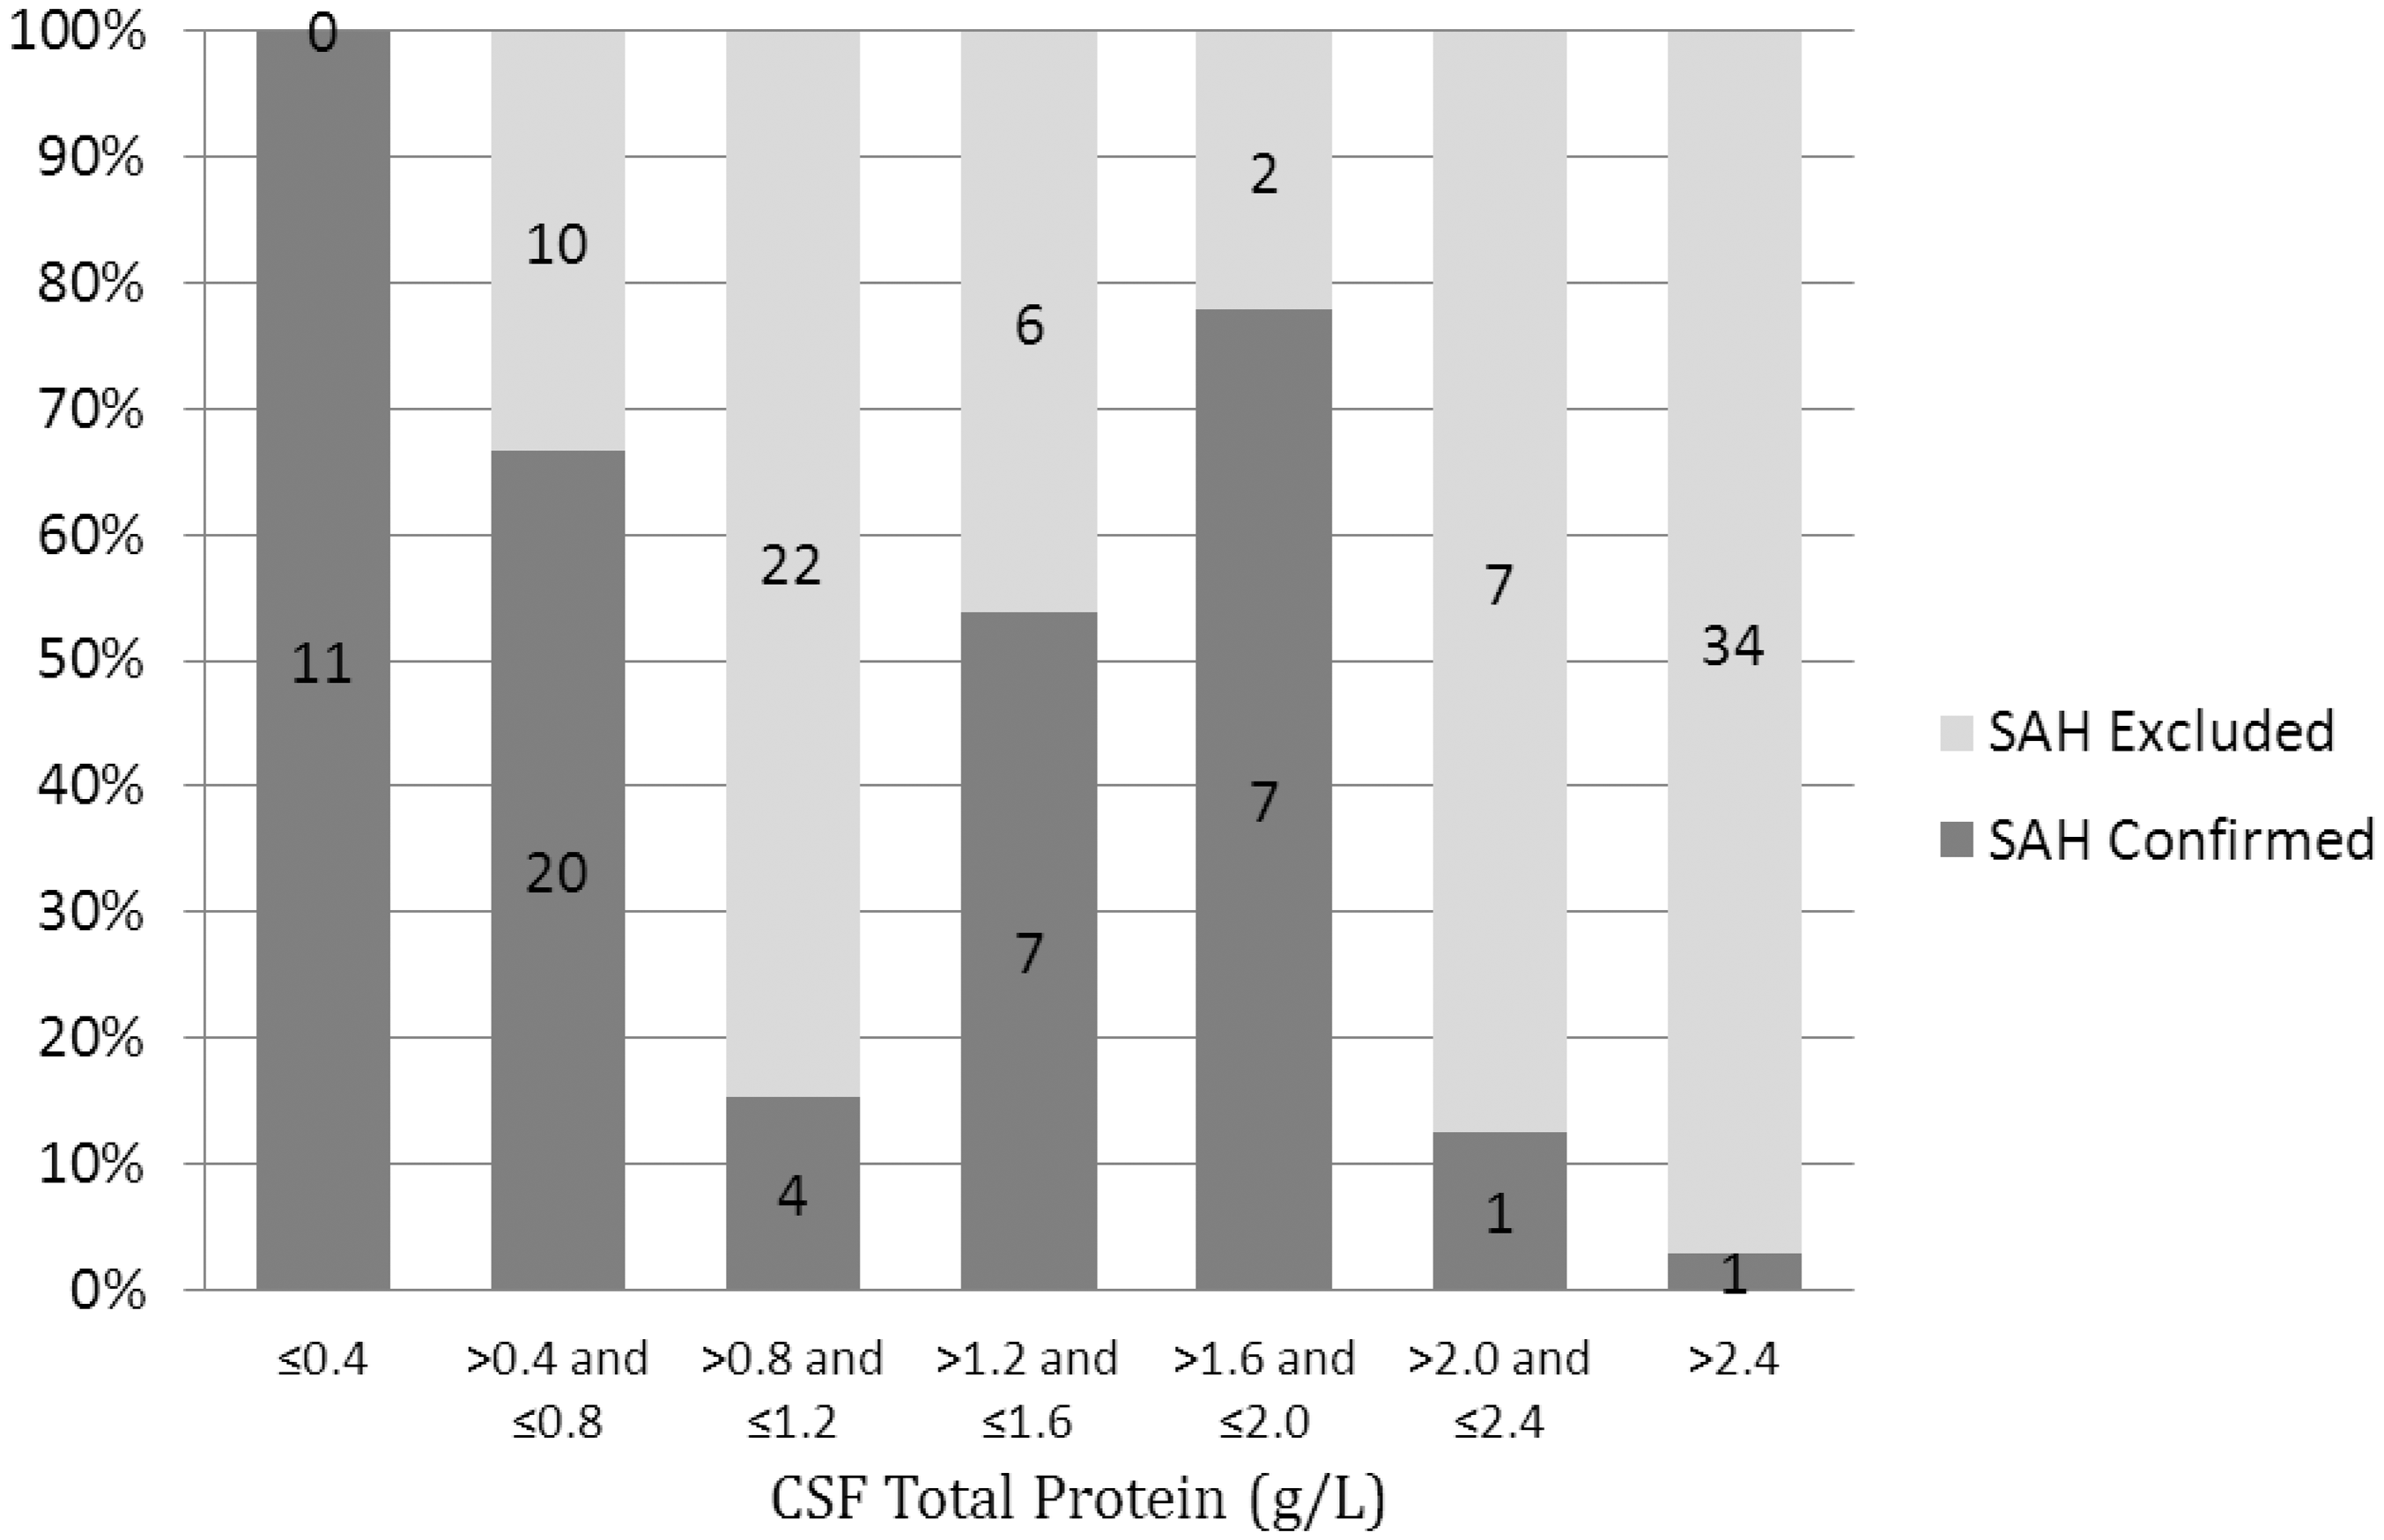
No CSF total protein concentration gives the required sensitivity and specificity for identifying SAH in this group of patients. Although a CSF total protein cut-off of 3.1 g/L has a sensitivity of 100% for ruling out SAH, this cut-off concentration is only associated with a specificity of 37% (Figure 2).
ROC curve for the ability of CSF total protein to predict SAH in patients in whom CSF spectrophotometry has shown NBA>0.007 AU and NOA>0.02 AU with a visible oxyhaemoglobin peak.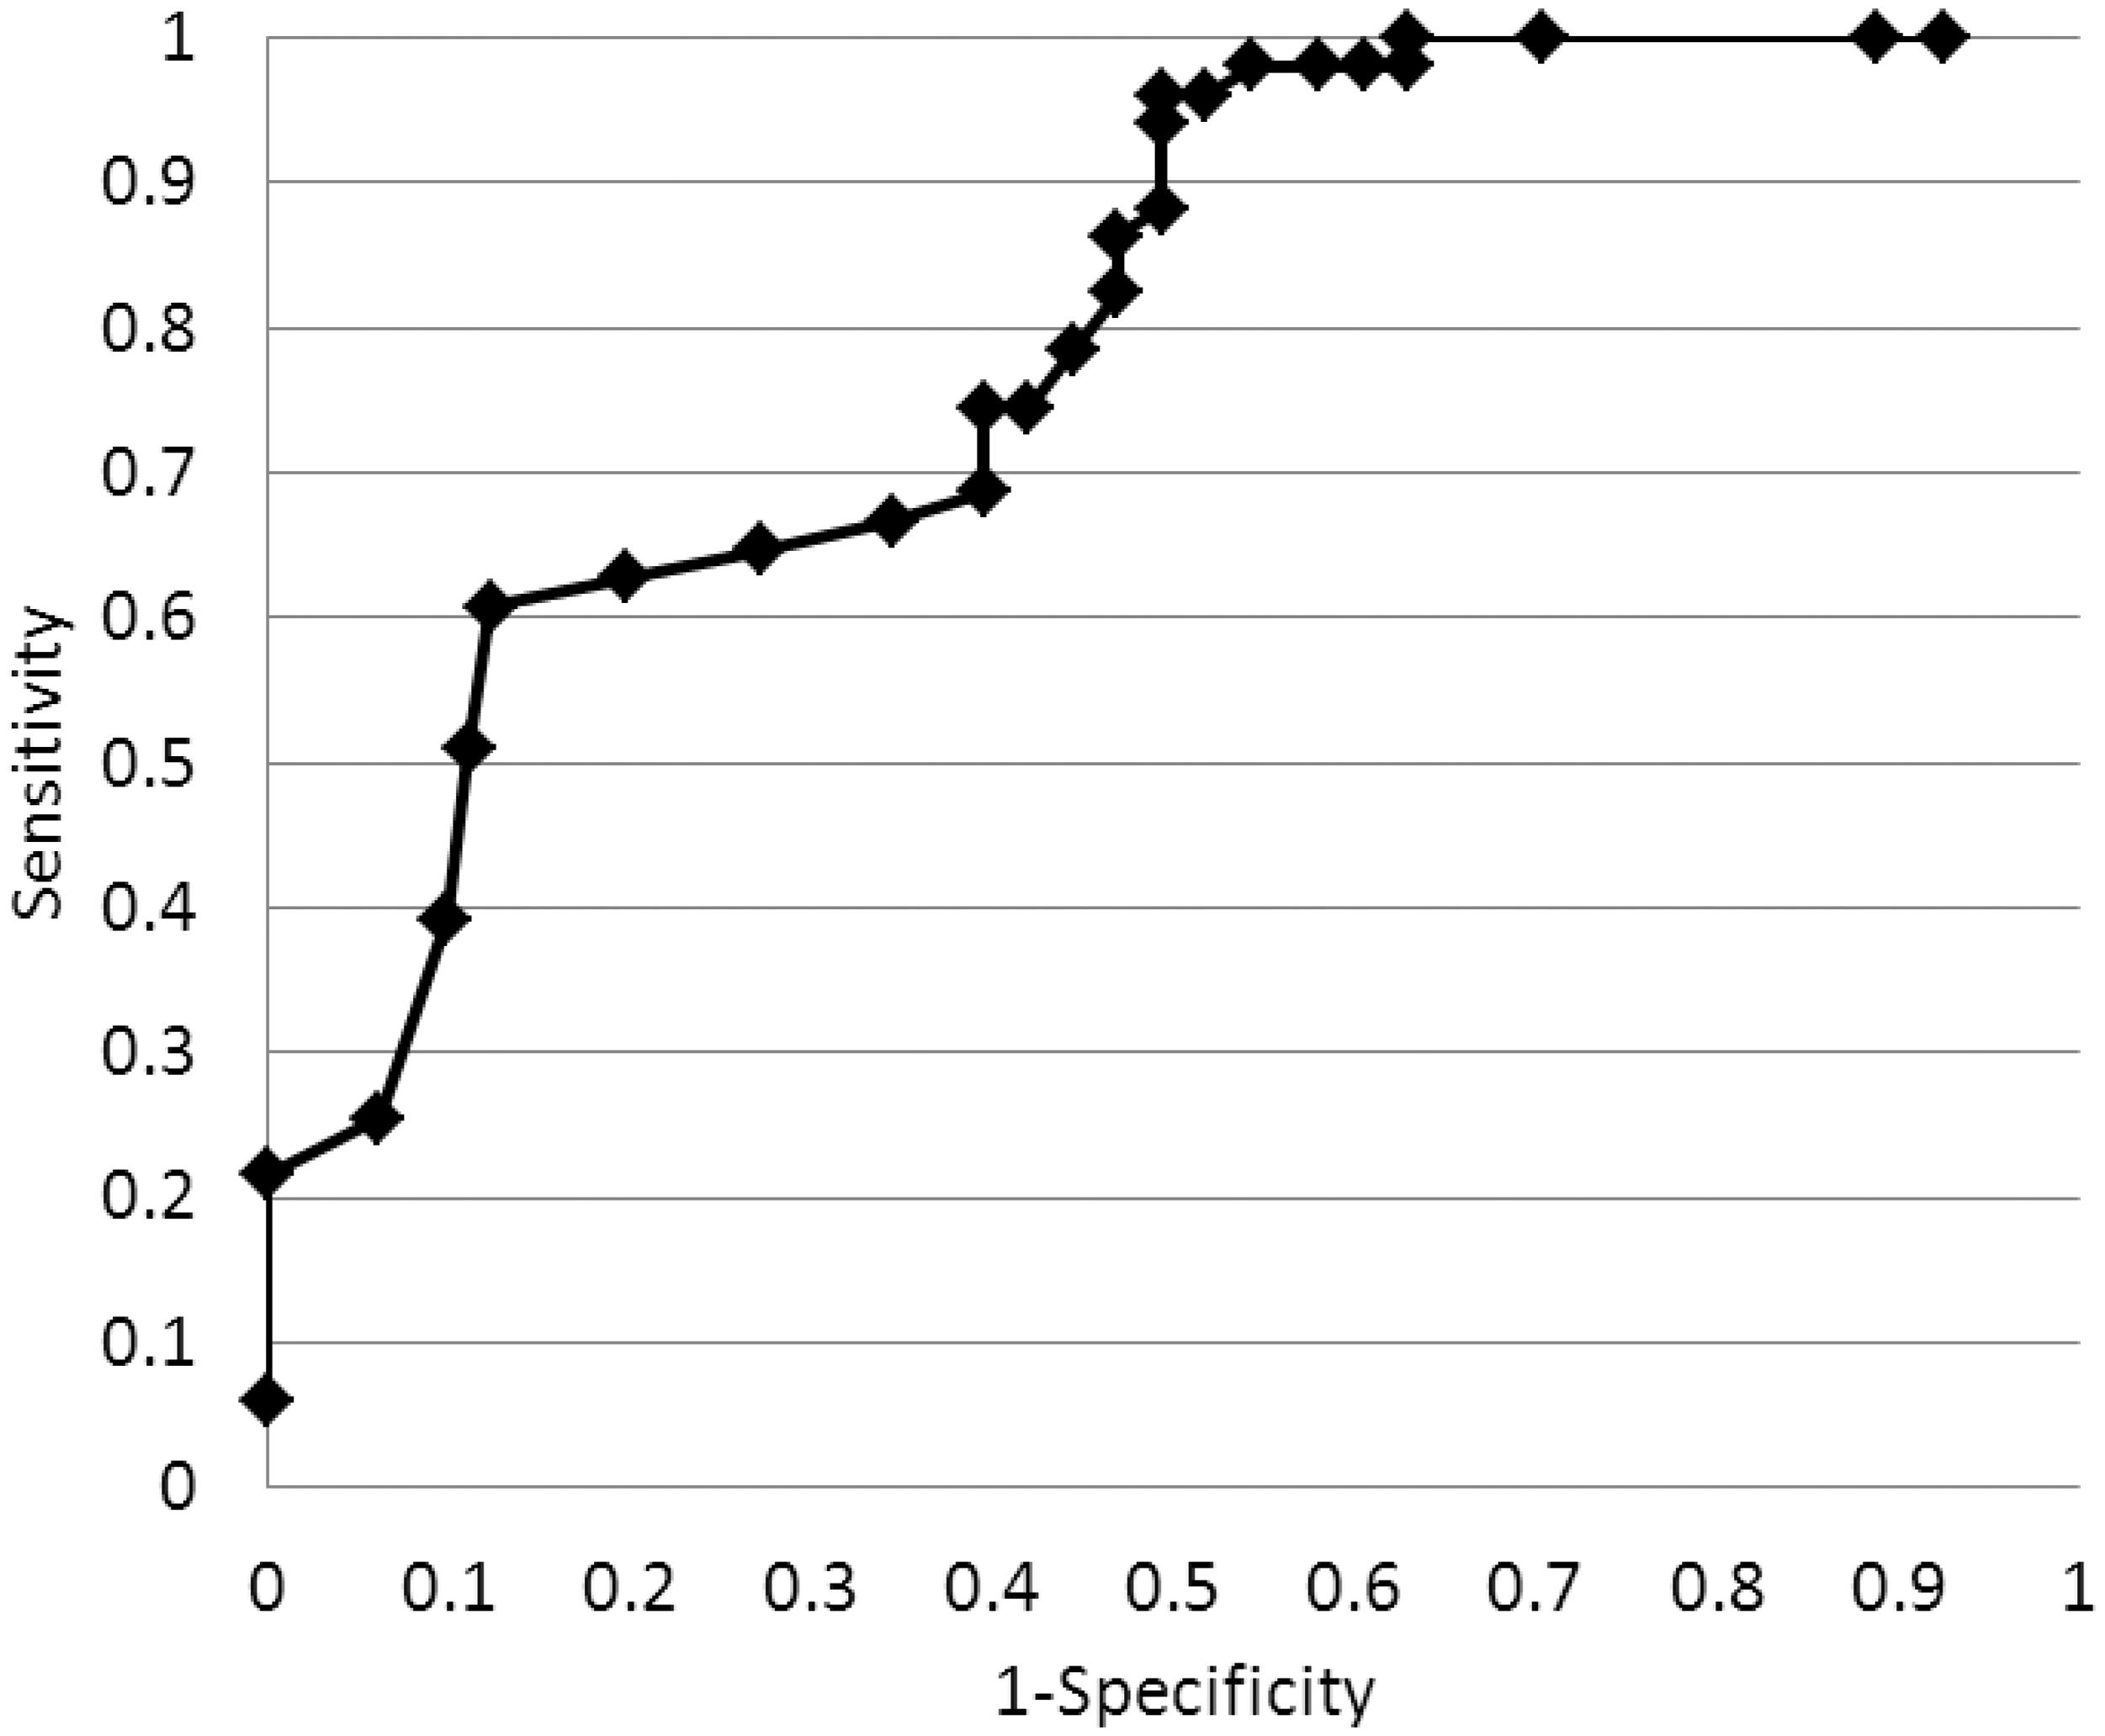
Discussion
A complete set of data was collected for 132 cases all of which had a NBA>0.007 AU and a NOA>0.02 AU with a visible oxyhaemoglobin peak by CSF spectrophotometry. Some sites were unable to collate data from the whole time period due to limited LIMS searching capabilities but all included a minimum data collection period of 3 years and 10 months within the specified timeframe. Of the 132 patients identified, 51 were confirmed to have had SAH (39%). Across the five different sites the proportion of confirmed SAH ranged between 22 and 50%.
The data from these patients show that SAH may be associated with a range of CSF total protein concentrations both within the reference range and above it. This is not unexpected when the variable location of bleeds into the subarachnoid space and the flow of circulating CSF are considered. 7
Although different CSF total protein methods were used across the different sites we do not think that this unduly affects our findings since all methods show comparable EQA performance. 12 The variety of CSF total protein methods reflect the fact that different methods are used by different laboratories nationally but all may refer to the same published guidelines.
We acknowledge that the shape of the ROC curve is somewhat distorted due to insufficient numbers over the required range of CSF total protein concentrations. However, there are sufficient data to conclude that there is no single CSF total protein concentration which gives the necessary sensitivity and specificity to rule SAH out or in. Although the highest CSF total protein concentrations are less likely to be due to SAH, the UK NEQAS SAG cannot recommend nor give prescriptive guidance on a CSF total protein cut-off above which SAH can be confidently excluded.
These results re-iterate the importance of always interpreting CSF spectrophotometric results in the context of the clinical setting. Our findings are consistent with those of others who also concluded that close dialogue with medical colleagues is vital to avoid potential misinterpretation or over-reliance on xanthochromia results. 13 This is particularly evident in cases of meningitis where a raised CSF total protein is typical 14 and the NBA and NOA may also be increased. 15 A discussion of the results with the tending clinician can quickly establish the differential diagnosis and the most likely explanation for the results.
As previously stated, guidelines are not a substitute for professional judgement and the final interpretation should take into account all of the available clinical information. 16 Whilst guidelines do have an essential role in harmonising procedures and encouraging best practice, they cannot cover all eventualities and cannot be used in isolation without consideration of other factors.
Footnotes
Acknowledgements
The Specialist Advisory Group acknowledge with thanks the assistance and advice of former member G Keir in the production of this manuscript and L Owen, J Borzomato and C Williams for their help with data collection.
Declaration of conflicting interests
None declared.
Funding
This research received no specific grant from any funding agency in the public, commercial, or not-for-profit sectors.
Ethical approval
Not applicable.
Guarantor
EL.
Contributorship
KB, GB, AC, IH, JM and VW sourced the data for the manuscript. KB wrote the first draft of the manuscript. All authors reviewed and edited the manuscript and approved the final version of the manuscript.