
Abstract
Over the past five years, a number of papers have appeared describing the assay of free immunoglobulin light chains in cerebrospinal fluid to assist in the diagnosis of multiple sclerosis. The assay of kappa free immunoglobulin chains is being advocated as a technically simpler and cheaper quantitative alternative to the qualitative detection of oligoclonal bands. This article reviews the analytical and clinical characteristics of these immunoglobulin free light chain assays and places them in their historical context and possible future developments.
Introduction
In the last few years, a spate of papers has appeared concerning the assay of free immunoglobulin light chains (FLCs) in cerebrospinal fluid (CSF) for the diagnosis of multiple sclerosis (MS). This review attempts to assess the relevance of this methodology in the context of current practice. MS is an autoimmune disease affecting approximately 150 per 100,000 in white Caucasians in developed countries. The disease commonly presents in young adulthood/early middle age and adversely affects life expectancy. The fundamental disease process is one of demyelination of nerves in the central nervous system and spinal cord. This is thought to arise from an imbalance between activated effector and regulatory T cells; however, B-cells are also involved. 1 These, together with weakening of the blood–brain barrier (BBB), contribute to the presence of immunoglobulin molecules in the CSF. The most common form of MS is where symptoms appear for a time then decline – Relapsing – Remitting MS (RRMS). Over time, this may progress to where symptoms are continuous – secondary progressive MS (SPMS). Most commonly, patients present with a single incidence of an MS-like symptom, clinical isolated syndrome (CIS). Many of these convert to clinically definite MS (CDMS). Approximately 10% of patients, usually older patients, present with continuous manifestation of the disease – primary progressive MS (PPMS).
The diagnosis and monitoring of MS pose a number of problems. These include:
differential diagnosis of MS; prediction of those patients with CIS who will convert to CDMS; prediction of periods of relapse in RRMS; prediction of conversion of RRMS to SPMS.
The only biochemical analysis widely used in MS diagnosis historically is the detection of oligoclonal immunoglobulin bands (OCBs); however, from the beginning of the 21st century, the McDonald criteria for MS diagnosis and its revisions have not included OCB analysis.2–6 Nevertheless, OCB detection is still frequently carried out, particularly where radiological evidence is uncertain. Alongside the detection of OCBs, estimates of the contribution of intrathecal synthesis of immunoglobulin G (IgG) to total CSF IgG concentration have been advocated.7,8 Thus, OCB analysis, together with intrathecal IgG synthesis quantification, forms the current ‘gold standard’ biochemical method.
The methods described above have been centred on the four-chain assembly that is the IgG molecule in CSF. To drive efficient assembly of this molecule, one of the two types of chain involved should be in excess. Thermodynamics dictates that this is the smaller of the two. Consequently, FLCs are synthesized in approximately 20% excess of heavy chains. The presence of κ and λFLCs in CSF has been recognized for almost 50 years. 9 This has led to the development of a variety assays for FLCs. From this body of work, the following were determined:
Despite this work, compared with OCBs, little interest was shown in the assay of FLCs in CSF as a diagnostic and/or prognostic tool until recently. The current interest in FLCs has been sparked by the availability of technically simple assays for κ and λFLCs in serum 16 and the understanding of the significance of the data generated for the management of myeloma and other conditions.17–19
CSF FLC assays and analytical sensitivity
Concentration of kappa free immunoglobulin light chains in neurological disease.
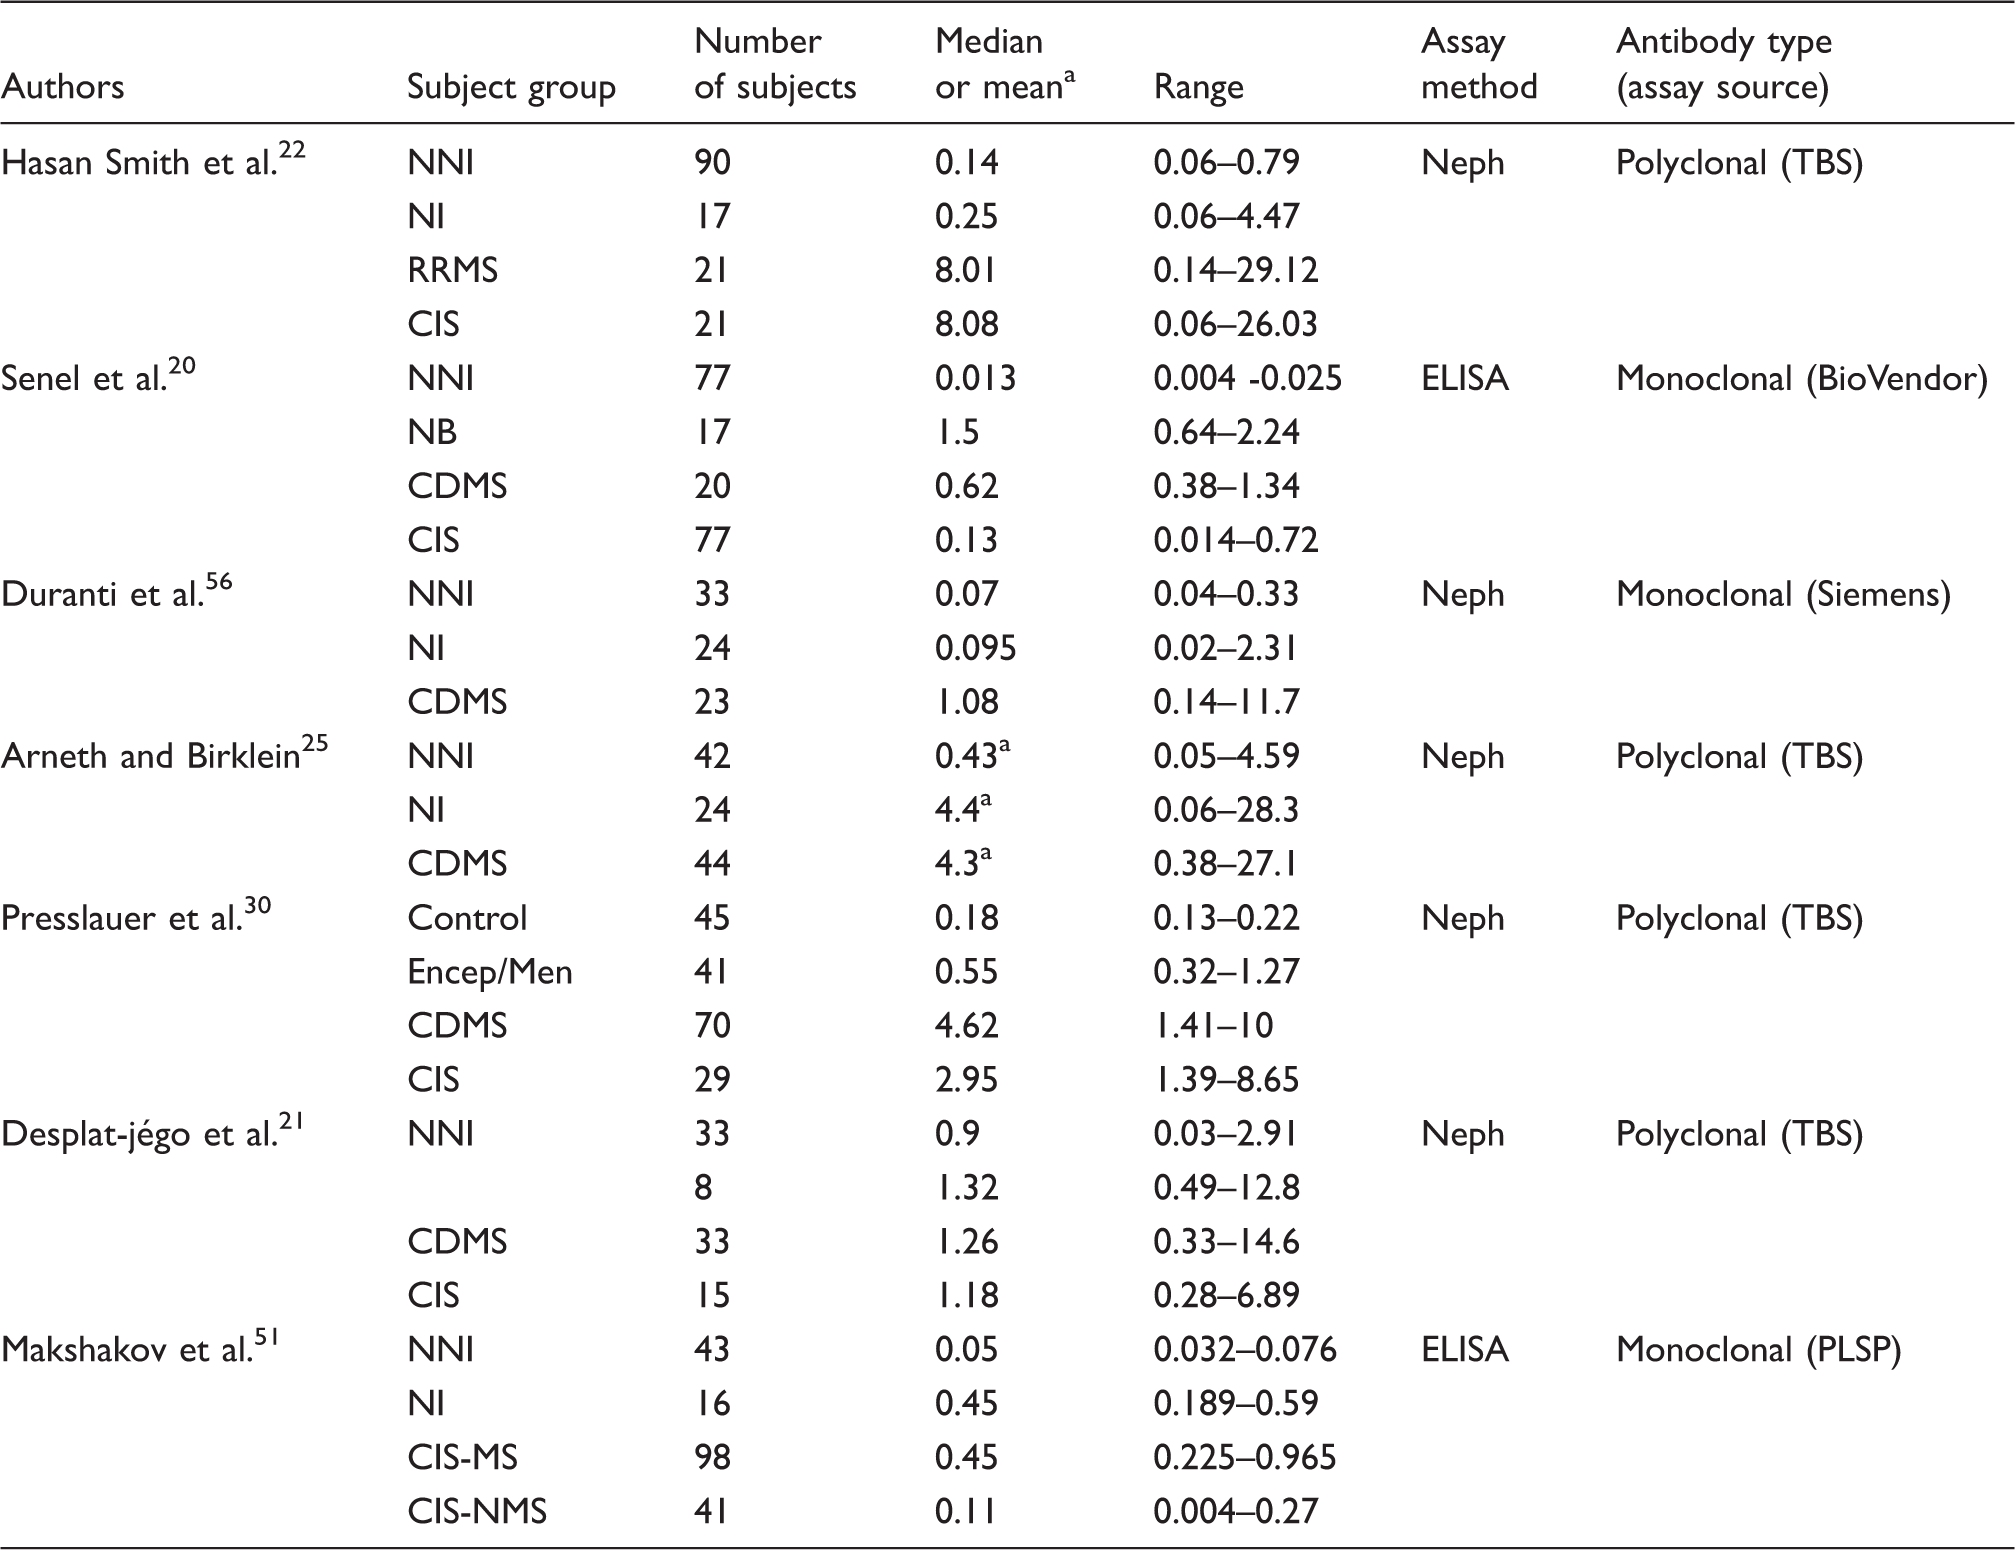
CDMS: clinically definite multiple sclerosis; CIS: clinical isolated syndrome; CIS-MS: clinical isolated syndrome converting to multiple sclerosis within 2 years; CIS-NMS Clinical isolated syndrome not converting to multiple sclerosis within 2 years; Encep/Men: encephalitis and meningitis; Neph: nephelometry; NB: neuroborreliosis; NNI: non-inflammatory neurological disease, NI inflammatory neurological disease other than MS; RRMS: relapsing – remitting multiple sclerosis; TBS: the binding site; PLSP: Polignost Ltd.
Mean.
Typical lower limits of detection quoted by authors are:
Analytes, analyte structure and metrics
The ability to quantify FLCs raises the question as to what analyte(s) is (are) to be assayed, κFLC only or κ and λFLCs, and how is (are) this (these) to be employed. There is universal agreement that κFLC concentration is elevated in CSF from CDMS patients and thus is the more important analyte. Some authors do not assay λFLC concentration. Those who do assay λFLC concentrations report elevated concentrations in MS CSF cf those in CSF from patients with non-infective neurological diseases, although the relative increase is less than that of κFLC concentration in MS.11,22 In patients with infectious neurological diseases, the increase in CSF λFLC concentration is of similar magnitude to or greater than that of κFLC concentration in MS.
Mass spectroscopy analysis of MS CSF showed κFLCs were present as both monomers and dimers, whereas λFLCs were present primarily as dimers. 24 How κFLC dimers and monomers influence the result in assays is unclear. For example, in nephelometric assays, where the rate of aggregation of antibody and antigen is the basis of the assay, does one κFLC dimer bind one or two antibody molecules? Although this may seem esoteric, the monomer:dimer could affect the result in borderline cases. No current literature addresses this question. The other result from this analysis is surprising, in that out of 56 patients' CSF, five were found to have no elevation of κFLC concentration but increased λFLC concentration. This is a high percentage and contrasts with the results of other recent authors who assayed both forms of light chain, but is in agreement with the work of Bracco et al. 10
Metrics used to assess clinical relevance include:
CSF FLC Concentration CSF total protein ratio
κFLC Index, an estimate of κFLC intrathecal synthesis,
21
Another estimate of intrathecal synthesis obtained from plots of CSF QFLC against (CSF albumin)/(serum albumin) (Qalb) using a dividing line described by equation (4a) which gives the theoretical contribution of FLCs diffusing from the blood into the CSF across the BBB to CSF total (FLC) – theoretical QFLC (Theor QFLC) – separating patients displaying intrathecal synthesis (above the line) from ones not doing so25,26
A modified version of (d) using equation (4b), which takes into account the fact that κFLCshave a lower molecular weight than albumin,
27
Intrathecal FLC fraction (κFLCIF), a fourth estimate of intrathecal synthesis.
28
This method first estimates the theoretical upper limit of κFLC diffusion through the BBB (κFLCLim) by reference to albumin diffusion


The disproportionate elevation of CSF κFLC concentration cf λFLC concentration is the most common phenomenon in CDMS and CIS cases (Table 1), but there is no agreement as to how this should be used. Examples of the use of each metric are present in the current literature. Zeman et al. 27 surveyed numerous metrics and found that several of them, including simple ones were good estimates of intrathecal synthesis. Although it may be argued that considering whether CSF κFLC concentration is elevated without considering intrathecal synthesis does not in itself allow one to differentiate among causes of the increase, this logic is equally true if estimates of intrathecal synthesis alone are considered. Thus, in practical terms, the simplest metric may be all that is required to confirm diagnosis of MS in the majority of instances, because of the diverse clinical picture between MS and other diseases with elevated FLCs and OCBs. Elevated λFLCs may be considered chiefly as marker of infection. Nevertheless, in cases where the diagnosis of MS is unclear, λFLC concentrations may need to be taken into account. 29 Further consideration regarding the choice of metric is given in the Conclusions section.
Clinical sensitivity and specificity and differential diagnosis of MS
The first clinical objective in assessing the worth of FLC assays is to distinguish patients with CDMS from patients with (a) other neurological diseases, (b) other neurological inflammatory diseases and (c) non-neurological non-inflammatory disease. Table 1 summarizes the results from seven groups of authors. A quite wide range of values is quoted, even for the control groups (neurological conditions – non-inflammatory) and the CDMS groups. These two patient groups are the easiest to compare because they are the most clinically homogeneous. The high κFLC concentrations in CSF in the CDMS groups are the dominant feature. An elevated κFLC concentration is not unique to MS; however, as Presslauer et al. 30 pointed out, most of the other diseases that do present with a high CSF κFLC concentration have dissimilar clinical characteristics to MS.
The CIS groups have varying numbers of patients who progress to CDMS and the inflammatory non-MS, neurology disease groups in the majority of cases are composed of varying numbers of different diseases. These facts probably account in large part for the disparity in levels reported by the different authors. As a consequence of this diverse nature, half the reports show the median (or mean) κFLC concentration of the inflammatory, non-MS neurology disease group to be notably lower than that of the MS group, with the other half reporting values very similar to or higher than that of the MS group. Only Senel et al. 20 and Presslauer et al. 30 have sufficient numbers to segregate the inflammatory non-MS, neurology disease group into individual diseases, κFLC concentration being higher in neuroborreliosis 20 and lower in encephalitis/meningitis 30 cf CDMS.
Clinical sensitivity and specificity of CSF free immunoglobulin light chain assay in multiple sclerosis.
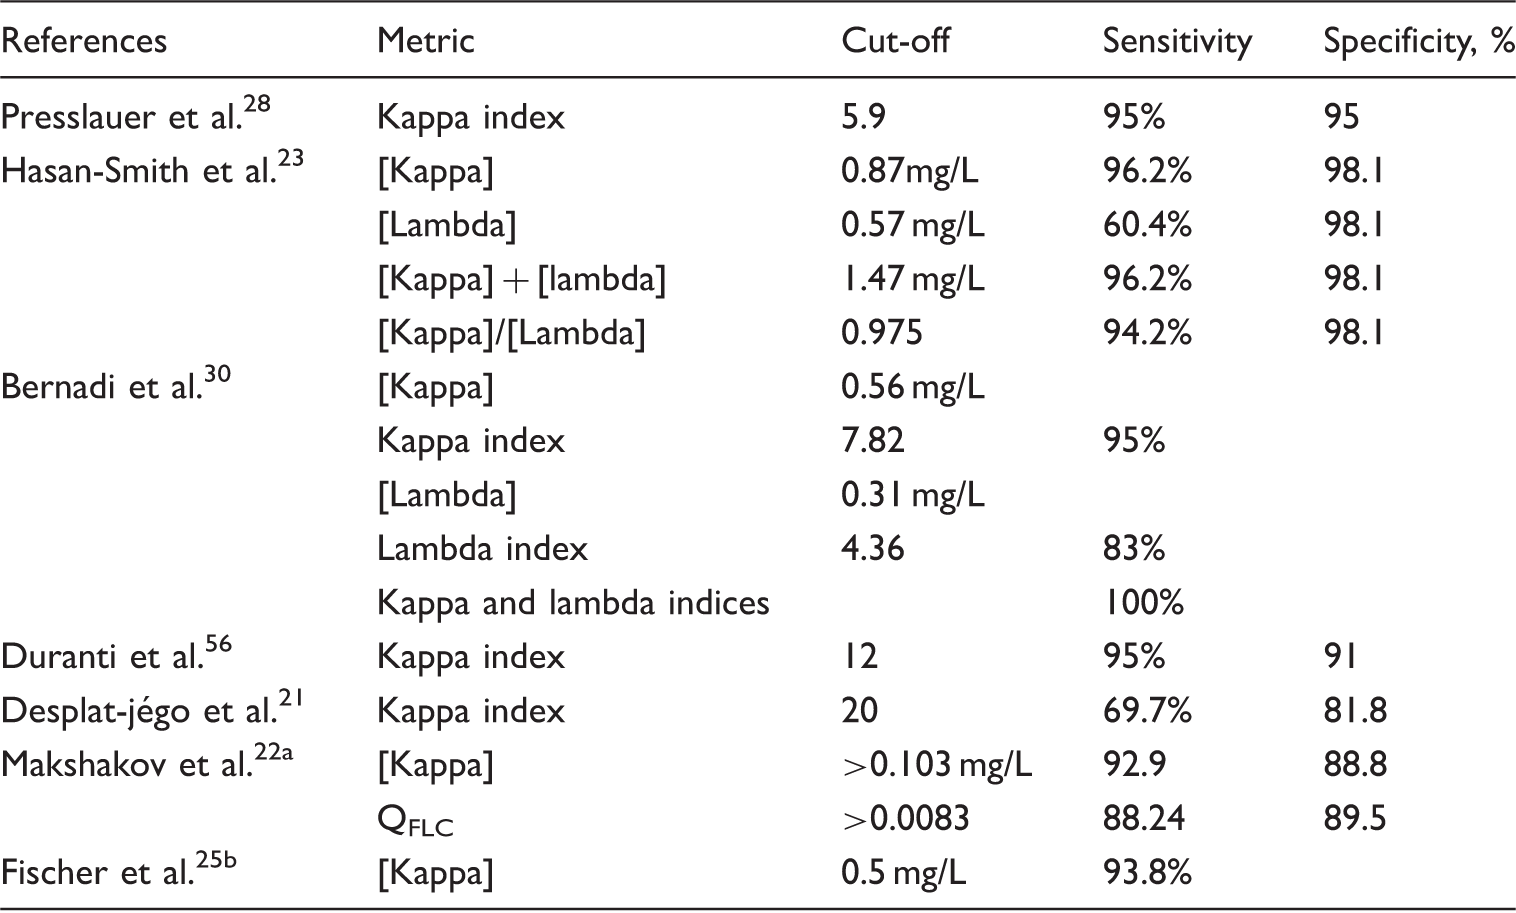
[x]: concentration of variable x.
Determined by ROC analysis between CIS-MS and control group.
Demonstration of intrathecal kappa FLC synthesis in MS.
Prognostic value of free light chain metrics: CIS conversion
Prediction of CIS conversion to CDMS is the second major objective of CSF assays, but the literature on FLC metrics relating to conversion CIS to CDMS is comparatively scarce; therefore, it is relevant to consider the recent literature on OCB analysis. Within the past three years, three major studies have been reported. Dobson et al. 32 described a meta-analysis of 71 scientific papers covering 2685 CIS patients of whom 1841 were OCB positive and 844 OCB negative. From these data, it was concluded that OCB-positive CIS patients had an odds ratio of 9.88 for conversion to CDMS. Subsequently, Kuhle et al. 33 with data from 1047 CIS patients (conversion to CDMS 59.5%) and Tintore et al. 34 with data from 792 CIS patients (conversion to CDMS 57.2%) concluded that the presence of OCBs was a highly significant prognostic factor.
Given that OCBs and FLCs arise from B-cell activity, it would seem logical to assume that FLC metrics would have a similar ability compared with that of either OCBs or estimates of intrathecal IgG synthesis to predict the conversion of CIS to CDMS. This concept is supported by the data of Zeman et al. 20 who assessed an estimate of oligoclonal IgG synthesis compared with a number of FLC metrics in 75 patients. They concluded that CSF κFLC was a reliable predictor of intrathecal synthesis. Villar et al. 35 compared the CSF κFLC concentration of 78 CIS patients – 49 with CSF κFLC concentration above a cut-off of two standard deviations above the CIS mean plus 2 SD of control group values against those with concentrations below this. The group with the higher concentrations had a higher probability of conversion to CDMS (P < 0.0001). After follow-up, most patients with high CSF κFLC concentration were found to have converted to CDMS, whereas more than 70% of those with the lower concentration remained as CIS. ‘Univariate analysis gave a hazard ratio of 9.13 (95% CI=2.8–29.78). These results were confirmed by multivariate analysis adjusted for sex, age and basal MRI findings, where the hazard ratio was 6.41; (95% CI=1.88–162 21.78) (P < 0.003)’. 35
Senel et al. followed 77 CIS patients for two years. They reported that the kappa quotient (equation (2)) was higher in CIS patients (n = 39) who progressed to CDMS than in those who did not (n = 38). They found that 86.8% of CIS patients who converted to MS had elevated kappa quotients, compared with only 61.5% of CIS patients who did not convert (P < 0.001). They proposed that these data are suggestive of the prognostic value of their kappa metric. Nevertheless, when they compared OCB analysis with the kappa quotient, their results were: for the kappa quotient – sensitivity 86.8%; specificity 38.5%; positive predictive value (PPV) 57.9%; negative positive predictive value (NPV) 75%, and for OCB analysis – sensitivity 89.1%; specificity 33.3%; PPV 57.4%; NPV 81.3%. They concluded that the kappa quotient was of similar value but not superior to OCB analysis in predicting conversion of CIS to CDMS.
20
Further support for the fact that a high κFLC metric is predictive of CIS conversion to CDMS comes from the report of Makshakov et al.
22
who followed 141 patients initially presenting with CIS. Of these, 98 had converted to CDMS by the end of the second year. The group of patients who converted to CDMS had a higher median CSF kappa concentration (0.45 mg/L, range: 0.225–0.965; P < 0.0001) compared with that of those who remained clinically stable (0.11mg/L, range 0.004–0.27).
22
In contrast to the suggestion of a positive predictive power for κFLC metrics, Desplat-jégo et al. reached the opposite conclusion. They followed 12 CIS patients over a period of 12 months and correlated CSF kappa index with:
rate of CIS conversion to CDMS according McDonald's criteria; time to conversion to CDMS according McDonald's criteria; number of relapses; number of relapses/length of follow-up; initial and final EDSS score.
They found no correlation between the κFLC index and these variables. 21 Presslauer et al. 36 also claim there is no significant difference between the κFLC index of the CIS group converting to MS (mean = 77.8) compared with the stable CIS group (mean = 82.7).
Prognostic value of free light chain metrics: CDMS progression
Unlike the value of OCB analysis for predicting conversion CIS to CDMS, the prognostic value of any CSF variable to predict progression of the disease once established is open to question. Becker et al., 37 after assessing the results of 409 patients followed up over 4.5 years concluded that none of 11 clinical and biochemical parameters predicted disease progress. These included OCBs and IgG index. Similarly, Anagnostouli et al. 38 assessed 108 MS patients, comparing dysfunction with OCB concentration. They concluded that the presence of CSF OCBs in their MS patients tended to be related to widespread cognitive changes, specifically worse visual memory (Rey's complex figure test-recall; P = 0.006). They proposed that OCB analysis as a prognostic factor needs further study before any firm conclusion can be drawn with regards to its value.
In contrast to the negative opinions cited above regarding OCB analysis, early data on FLCs are more positive. Rudick et al.
39
studied 36 patients over a median follow-up time of 38.9 months. They evaluated myelin basic protein, IgG synthesis rate, IgG index and κ and λFLCs as prognostic factors. Expanded disability status scale, the Ambulation Index, the 9 Hole Peg Test and the Box and Blocks test were used to assess the disease progression. They concluded that CSF κFLC concentrations were the best predictor of physical deterioration.
39
Subsequently, Rinker et al., studied 57 CDMS patients (RRMS 23; SPMS 28; PPMS 6) with a median disease duration of 15 years (range 1 to 30 years). Patients were divided into one group with CSF κFLC concentration ≥ 1.53 mg/L and another with <1.53 mg/L. The high CSF κFLC concentration group had a higher likelihood of a more severe disease course than the low concentration group. This was evidenced by a high likelihood of requiring ambulatory assistance within 10 years and over the disease course. The group also had greater disability relative to disease duration, as estimated by a multiple sclerosis severity score. They reported that the PPV of CSF κFLC concentration ≥ 1.53 mg/L was:
for requiring ambulatory assistance within 10 years – 66.7%; for requiring ambulatory assistance over the course of the disease – 88.9%; for the likelihood of reaching a multiple sclerosis severity score >6 was 88.9% with 95% confidence.
40
These findings contrast with those of Desplat-jégo et al. who followed a group of 15 CIS patients converting to CDMS. They found no correlation between κFLC indices and disease progression as judged by:
time to conversion to MS according McDonald's criteria, number of relapses, number of relapses/length of follow-up, initial and final EDSS score.
21
The findings of Desplat-jégo et al. are in accord with the results of the multicentre Avonex phase III trial described by Rudick et al. in which CSF κFLC concentration did not change significantly in either treatment or placebo groups over the two year period of the trial. 41 Thus, CSF κFLC concentration did not reflect improvement in the clinical status of patients following treatment with the drug. Nevertheless, CSF κFLC concentration was weakly correlated with Gd lesion volume and T2 lesion volume.
Conclusions
Much interest has been generated by the introduction of technically simple, rapid, quantitative assays for determination of CSF κ and λFLC concentrations, allowing the possibility of replacing the technically more difficult, time-consuming, qualitative assay of OCBs still used in many hospitals for the diagnosis of MS. In turn, the use of these assays has opened up the question of what FLC metric to use. The answer depends in part on the question of why the metric is being used – diagnosis of MS or prognosis of conversion of CIS to CDMS. As can be seen above, groups of authors have used a variety of metrics, primarily based on the κFLC concentration. No consensus has as yet been arrived at as to which to use. Applying the philosophical principle advocated by William of Ockham, commonly known as Occam's razor, proposes that when faced with a number of options of indeterminate certainty, often the choice of the option with least complexity is the best. This principal suggests that in the majority of cases it would seem unlikely that the more complex metrics are necessary for a diagnosis of MS to be made. This idea is in accord with the data of Zeman et al.
42
who surveyed numerous metrics using the same patients' serum samples and CSF. They found that several of the metrics, including simple ones such as CSF concentration, were good estimates of intrathecal synthesis. Interestingly, Bonnan points out that none of the estimates of intrathecal IgG synthesis are truly accurate, with the best having possibly up to an error of 20%.
43
Similarly, estimates of intrathecal FLC synthesis, such as kappa index, by definition must be less technically accurate than kappa concentration, because they contain the errors of this parameter plus those of the estimates of serum kappa and albumin and CSF albumin concentrations. Zeman et al.
42
also commented on the lack of an efficient means of estimating intrathecal kappa synthesis when they proposed their modified formula (equation (4b))
42
rather than using for intrathecal FLC synthesis the equation originally proposed by Reiber et al. for IgG synthesis.
44
Given that:
in molecular terms light chains are synthesized at more than twice the rate of the fully formed IgG and approximately 20% greater than individual heavy chains, IgA and IgM may also be formed by intrathecal synthesis, the synthesis of which further contribute to total concentration of FLCs in the CSF because of the necessity to synthesize an excess of light chains compared with that of heavy chains, and the molecular weight of the light chain used to derive formulae such as that proposed by Zeman et al.
42
should take into account the monomer:dimer, estimates of total kappa light chain synthesis (free and incorporated into Ig molecules) may give the clearest picture of B-cell activity. Nevertheless, such a detailed set of analyses is unlikely to be carried out in general practice. Further limited support for the idea that the simplest metric may be all that is necessary comes from Makshakov et al.
22
These authors compared total CSF kappa concentration with kappa quotient for the prediction of conversion of CIS to CDMS and found that the former was a better predictor. Nevertheless, because the diagnosis of MS is such an overwhelmingly important event, it may be necessary to consider estimates of intrathecal synthesis as well as kappa concentration, both being viewed in the context of other biochemical and clinical parameters. All of the above emphasize the fact that consensus guidelines based on data for a large group of patients are required to indicate which кFLC metric or combination of metrics, is the optimum. Possibly these guidelines should include the consideration of λFLC concentration where the results of MRI and the chosen kappa metric are inconclusive. Despite this area of uncertainty, the properties of FLC assay make it an attractive option for CSF analysis in the short to medium term.
Thus said, although there is much recent interest in FLC assay, the results generated have an air of déjà-vu. Much of what is now being reported has been reported before. Examples of this are the recognition of the predominance of the increased CSF κFLC concentration cf λFLC concentration and the near equality or superiority of kappa metrics compared with OCB analysis in the diagnosis of MS. Twenty-seven years ago Rudick et al. wrote, ‘Our results strongly suggest that free kappa light chains in CSF are the single best quantitative assay to support a clinical diagnosis of MS’. 45 Whether CSF FLC quantification has any long-term prognostic value is more doubtful. It is in most instances a one-off assay, giving a unique insight into B-cell activity at that time. The likelihood of a second CSF sample being taken is small. If the level of B-cell activity does not change with time, as asserted for CSF κFLC concentration by Rudick et al., 42 although symptoms might improve following treatment or spontaneous remission, what relevance can CSF κFLC assay have for prognosis once the disease is established. Interestingly, the report of Mehta et al. 46 that urinary excretion of κFLC increased in periods of relapse has never been replicated, for whatever reason. Nonetheless, if this were true, and given we now have the ability to determine the primary sequence of proteins with relative ease, it may be possible to monitor the concentrations of intrathecally produced FLCs specific to the individual patient in an easily obtainable fluid. This would be a sophisticated variation on the theme of detection of measles, rubella and varicella zoster antibodies, which can be detected in a majority of MS patients. 47 Nevertheless, until a widely accepted serum or urine biomarker is developed, the absence of which has been illustrated in the recent reviews of Housey et al. 48 and D’Ambrosio et al. 49 , emphasis on MRI results in any subsequent modification of the McDonald guidelines will remain. This is especially the case because in time there will be increased confidence in MRI diagnostic and prognostic protocols in recently issued guidelines by members of the MAGNIMS group.5,6,50–54 Further, improvements are being made in the ability of software to analyse the ensuing results, such as that described by Abbasian Ardakani et al. which reveals details not visible to the human eye. 55
Websites of commercial sources of FLC assays
Siemens: http://www.healthcare.siemens.co.uk/plasma-protein/assays/n-kappa-and-lambda-assays
The Binding Site Ltd: http://www.bindingsite.com/en/discover/freelite-and-hevylite
Polygnost St Petersburg: http://all-russian-business.com/company/981900
Footnotes
Declaration of conflicting interests
Ad hoc consultation for The Binding Site Ltd., since the company's foundation.
Funding
The author(s) received no financial support for the research, authorship, and/or publication of this article. Following acceptance by ACB the author has has applied for and received a bursary from The Binding Site Ltd.
Ethical approval
Not applicable.
Guarantor
DBR.
Contributorship
DBR sole author.