
Abstract
Background
When preparing dried blood spots (DBSs), haematocrit (Hct) can affect the ability of the blood to spread through the filter paper, thus resulting in varying quantities of sample being measured when fixed subpunches of the DBSs are taken. It may be important to predict the sample Hct to correct volume differences.
Methods
Blood (10 µL) was applied to Perkin Elmer 226® paper. The samples (n = 165) were allowed to dry for 24 h, and the entire blood spots were cut out. Subpunch analysis was also performed on blood spots prepared from 75 µL EDTA blood, taking 6 mm subpunches centrally and peripherally from the spots (n = 59). The spots were eluted with 100 µL water, and a 10 µL aliquot of lysate was added to sulfolyser reagent (80 µL) in a microtitre plate. Hb was measured at 550 nm using an ELISA plate reader. DBS samples were compared against blood samples measured on a routine Sysmex XN-9000 analyser.
Results
The Passing and Bablock regression showed Hct (DBS-predicted) = 0.99 Hct (Sysmex) −0.02, R2 = 0.87. Intra-assay imprecision measured at Hct values of 0.27, 0.40 and 0.52, gave CVs of 4.1%, 2.8% and 4.2%, respectively. Inter-assay imprecision showed CVs of 6.2%, 5.2% and 4.2%, respectively. DBS samples were stable for up to two days at 60℃, one month at room temperature and six months at 4℃.
Conclusion
This method provides a simple and fast estimation of predicted Hct in dried blood spots.
Introduction
The use of dried blood spots (DBSs) for the collection and measurement of blood samples is well established for newborn screening 1 and is becoming popular for toxicology 2 and therapeutic drug monitoring. 3 The principle attractions of using DBSs, compared with venous blood samples, are the low blood volume requirements, minimally invasive collection, favourable stability of many analytes and the potential for home sample collection. 4 However, DBS measurement is not without problems, and it has been well documented that DBS results can be affected by the sample haematocrit (Hct).3,5–7 The Hct reflects the volume percentage of the blood that is taken up by red blood cells and any variability will affect blood viscosity and the ability of the blood to spread through the filter paper. Blood with a high Hct is more viscous and forms a smaller diameter DBS compared with samples with a low Hct. 7 If fixed subpunches are subsequently taken from the DBSs, then varying quantities of blood will be taken depending on the Hct. In addition, the Hct may also influence analyte recovery, matrix effect and DBS homogeneity 8 and it is advantageous to correct for Hct when this is known to affect the test result sufficiently to change its significance. Volumetric application and extraction of the whole spot is proven to work but it requires pipetting skills, is unsuitable for home sampling and does not address the variable partitioning seen between plasma and red blood cells with some analytes. 6 Volumetrically applied micro sampling devices have also been developed (VAMS) to eliminate problems encountered with pipetting blood accurately,9–11 and membrane-based devices to collect plasma albeit in small amounts have also been developed.12,13 Predicting the Hct indirectly from the DBSs has been proposed as a more practical measure for routine use. 3 Measuring the potassium concentration of the DBSs gives a good estimation of the Hct of the DBS sample 14 ; however, the process of measuring the potassium renders the sample unsuitable for further measurement. The most recent strategies utilize near infra-red spectroscopy 15 and non-contact diffuse reflectance spectroscopy. 16 These methods are reported to be fast, robust and non-destructive; however, they require dedicated instruments. We have developed a quick, simple and robust method for measuring haemoglobin (Hb) from a DBS sample, using standard laboratory equipment, from which the Hct can be predicted. The proposed colourimetric method uses sodium lauryl sulphate (SLS) to form an SLS-Hb complex which has an optical absorbance range between 500 nm and 560 nm. The complex formed obeys Beer-Lambert’s law, and the absorbance is linear over the range of Hb concentration expected in patient samples. 17
This method is destructive but uses only a small portion of the sample leaving the bulk of the remaining sample for further analysis.
Methods
Whole blood samples in ethylenediaminetetraaceticacid (K2-EDTA) sample tubes (Beckton Dickinson, Oxford, UK) were collected from the Haematology Department at the University Hospital of South Manchester (UHSM); the samples had all been requested for routine analysis, and the samples were checked to ensure all analysis was complete before being used for this study. The use of anonymized blood samples was approved by the local ethics committee (IRAS225910). There was no selection process for choice of samples, and gender, age and ethnicity were not determined as part of this study, also patient drug history was not considered when identifying samples. The whole blood samples were measured for Hct and Hb routinely on the Sysmex XN-9000 (Sysmex UK Ltd, Milton Keynes, UK); these samples were then anonymized and then pipetted on to Perkin Elmer 226® paper (Sigma-Aldrich, Gillingham, UK). The amount of blood sample added to the paper was 10 µL or 75 µL The sample was allowed to dry overnight, and in the case of the 10 µL DBS samples, the entire spot was excised (n = 165) using scissors (Sysmex Hct range: 0.20 to 0.53, mean: 0.37). The 75 µL DBS samples had manually collected 6 mm subpunches taken centrally and then peripherally, but avoiding the edge of the spot, to assess homogeneity across the spot (n = 59). The Hct range of these samples, measured using the Sysmex analyser, varied from 0.27 to 0.51. Differences in subpunch location were assessed using a paired t-test. A 75 µL sample volume was chosen to permit sufficient space between two subpunches taken centrally and peripherally from the same DBSs.
The effect of storage of the DBSs on the Hct prediction was evaluated by comparing the result from freshly prepared DBSs, at three Hct concentrations (dried overnight) with results obtained after storage at room temperature, 4℃, 30℃ and 60℃ for periods of up to five days, two months and six months, respectively. Samples were analysed daily for two days at 60℃; daily for the first week and then weekly for two months at 30℃; weekly for the first month and then monthly for six months at 4℃. Samples were deemed to be stable, if final results after storage were within 15% of the initial value.
Imprecision (% CV) of the assay was assessed using fully excised DBSs prepared from patient samples with known Hct values measured on the Sysmex analyser. To determine intra-assay imprecision, the DBS samples were analysed 10 times within one batch. To assess inter-assay imprecision, the samples were measured in singleton in 12 batches over a two-week period.
Prepared excised DBSs or subpunches were placed into a 96-well microtitre plate (Porvair Sciences Ltd, Leatherhead, UK), ultrapure water (100 µL) was added to each well and sealed with adhesive seal (Thermo-Scientific, UK). The plate was then placed on a multiplate shaker (Grant Instruments, UK) for varying times; 15 min, 30 min, 45 min and 1 h, at 400 r/min. Elution ability was measured by analysis of the Hct at different time points. Eluted DBS sample (10 µL) was pipetted into a 384-well microtitre plate (Thermo-Fisher, Loughborough, UK) and 80 µL Sulfolyser reagent (Sysmex UK Ltd, Milton Keynes, UK) was added, the plate was gently mixed and left to stand for 5 min. For measurement of Hb, an automated Multiskan FC® plate reader (Thermo-Scientific, Loughborough, UK) was used, and the wavelength was set to 550 nm. A blank of Sulfolyser reagent was measured, and the background absorbance subtracted from the measured absorbance. In total, 165 excised DBSs and 59 subpunch samples, prepared from anonymized patient samples, were analysed, and the predicted Hct (Hct-predicted) was plotted against the measured Hct (Sysmex).
A calibration line was prepared by plotting the absorbance of 10 blood spot samples, prepared from patient venous blood samples, against their known Hct values measured on the Sysmex analyser. The calibrators were chosen to give a range of Hct values from 0.18 to 0.56. A regression line (Passing and Bablock) was constructed from which absorbance values could be converted into the Hct value, DBSs (Hct-predicted)=1.66 × absorbance).
The effect of loading different blood volumes was assessed by pipetting 10 µL, 20 µL, 30 µL, 40 µL, 50 µL, 60 µL and 75 µL of blood from 10 patients onto filter paper. A 6 mm subpunch was taken centrally from each DBS and analysed for Hb.
Results
It was found that 30 min mixing on a multishaker gave the best results to ensure complete desorption of blood from the DBSs (data not shown). Passing and Bablock regression analysis (Figure 1(a)) showed good agreement between Hct (DBS-predicted) and Hct (Sysmex) when using fully excised spots. Hct (DBS-predicted) = 0.99 Hct (Sysmex) −0.01, R2 = 0.87 (n = 165). Bland–Altman analysis (Figure 1(b)) showed very little bias between the two methods (bias = 0.003, 95% limits of agreement: −0.05 to 0.05). The limits of agreement (±0.05) are acceptable for the purposes of the method, i.e. providing an estimation of the original venous blood Hct. Centrally taken 6 mm subpunches taken from 75 µL DBSs also showed good agreement between the calculated Hct and the Hct measured on the Sysmex analyser. Hct (DBS-predicted) = 1.02 Hct (Sysmex)−0.01 (n = 59).
Passing and Bablock regression analysis (a) and Bland-Altman analysis (b) between Hct (DBS-predicted) and Hct (Sysmex) when using fully excised 10 µL DBSs (n = 165).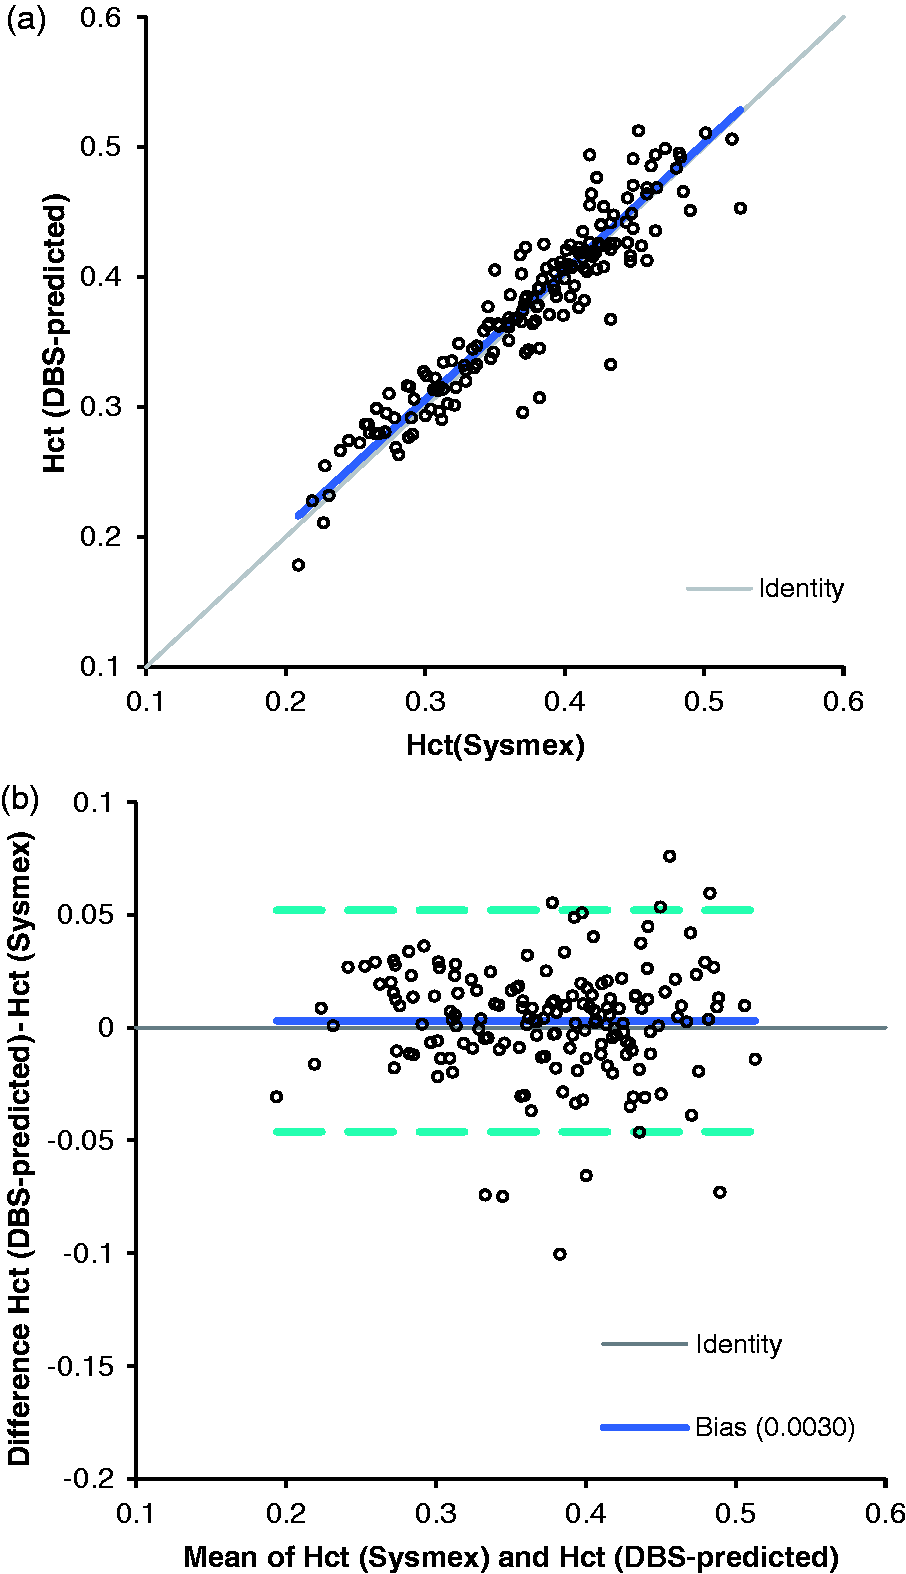
Intra-assay imprecision measured from fully excised spots at Hct values of 0.27, 0.4 and 0.52, gave CVs of 4.1%, 2.8% and 4.2%, respectively (n = 10). Inter-assay imprecision measured over the course of two weeks showed CVs of 6.2%, 5.2% and 4.2%, respectively, at the same Hct values (n = 12). The DBS samples were found to be stable for up to six months at 4℃ (<10% change), for up to two days at 60℃ (<2% change), and for up to two weeks at 30℃ (<10% change) using samples with Hct values of 0.26, 0.41 and 0.53. A change of <20% was deemed to show acceptable stability for this method.
Subpunch analysis showed that there was no significant difference between 6 mm subpunches taken at the centre or the periphery of a 75 µL spot (t-test P = 0.32). Passing and Bablock analysis showed peripheral subpunch Hct = 1.0 (central subpunch Hct) −0.49 (n = 59). When the effect of varying the blood spot volume was examined, a significant increase in measured Hct was found as the volume increased from 10 µL to 75 µL, t-test P ≤ 0.0001, with an average change of 15%. Although significant, this change was deemed acceptable for the purposes of the method. The Sulfolyser reagent was stable at room temperature for at least one month, and there was no difference seen in performance between different batches or lot numbers of reagent.
Discussion
Measurement of total Hb has been previously attempted colourimetrically in DBS extracts using Drabkin's reagent to convert Hb into its cyano-methaemoglobin derivative; however, prolonged storage of the DBS samples influenced the obtained results. 18 In contrast, the Sulfolyser reagent contains SLS, which creates an SLS-Hb complex with an optical absorbance range between 500 nm and 560 nm. 17 Although Hb is a surrogate for Hct, the results nevertheless show that there is a good correlation between the predicted Hct from extracted DBSs and whole blood Hct measured using the Sysmex analyser, across a wide range of Hct values. Bias has been seen in other methods and this was attributed to matrix differences, in calibration and a possible effect of mean corpuscular haemoglobin concentration.14,15 In an attempt to improve calibration, another group found good agreement between the Hct results from DBSs and venous blood samples, when using assigned Hct values from patient samples. 16 We followed this practical approach and calibrated the DBS method using measured Hct values rather than Hb concentration, because this showed closer agreement to the Hct measured on the Sysmex analyser.
Samples were stable for up to six months at 4℃ but also at the relatively higher temperatures encountered during transport to enable safe transport to the laboratory. The impressive long-term stability was due to the property of SLS to convert all Hb present in the sample to SLS-Hb. 17 This allowed for older samples which had been converted to methaemoglobin and haemachrome to also give an accurate measured Hb concentration. Sensitivity of DBS Hb analysis was enhanced by using a 384-well optically pure microtitre plate, the narrow diameter wells compared with a 96-well microtitre plate, and permitted the use of a very small sample size while providing an increased light path for the same sample volume. The method described provides a predicted measurement of the sample’s Hct concentration, while only using 10% of the sample and leaving enough extracted lysate sample for further measurement. The microtitre format allows fast absorbance measurement and the Hct calculation using a plate reader. Furthermore, it is suitable for use with robotic pipetting systems and should enable a high throughput of samples. Further work is required to determine if a non-commercial SLS solution can produce similar results. Preliminary work has shown that the 6 mm subpunches used were optimum for obtaining maximum sensitivity for Hb analysis and subsequent Hct prediction. This method may not be useful for assays requiring smaller subpunches for analysis.
We assessed 6 mm subpunches and in agreement with another study 14 found no difference between central and peripheral subpunching. In agreement with the same study, we also found a small increase in DBS Hct as the blood volume applied to the paper increased, 14 probably caused by higher saturation of the filter paper with higher blood volumes.
The method was primarily validated for fully excised spots but we have also shown the utility of the method for subpunch analysis. A limitation of the study is that anticoagulated blood was used to prepare DBSs, and this will need to be verified with blood taken from fingerprick collection. This is a simple and inexpensive method that does not require expensive or dedicated equipment to provide a simple and fast prediction of the DBS Hct. It remains to be determined whether the predicted Hct determined in this way can be used to correct differences in the actual Hct across a range of analytes that are susceptible to the Hct effect.
Footnotes
Declaration of conflicting interests
The author(s) declared no potential conflicts of interest with respect to the research, authorship, and/or publication of this article.
Funding
The author(s) received no financial support for the research, authorship, and/or publication of this article.
Ethical approval
The use of anonymized blood samples was approved by the Health Research authority (IRAS225910).
Guarantor
BK.
Contributorship
GR and BK co-designed the study.
GR and DM performed the study.
GR, DM and BK wrote the draft paper.
GR, DM and BK revised the draft paper.