
Abstract
Background
LC-MS/MS methods offer high selectivity in cortisol determinations. However, endogenous steroid metabolites may still interfere and compromise the results, for example in the diagnosis of Cushing’s syndrome. Erroneously elevated cortisol may, in particular, be misleading at the low concentrations found in salivary samples obtained at late night and after dexamethasone suppression.
Methods
Interferences in our LC-MS/MS method used for determination of cortisol in saliva and urine were identified by comparing their retention times and mass spectra with those of pure candidate substances. The chromatographic conditions used in our LC-MS/MS method, including column and mobile phase gradient, were varied in order to separate the target compound from the interferences.
Results
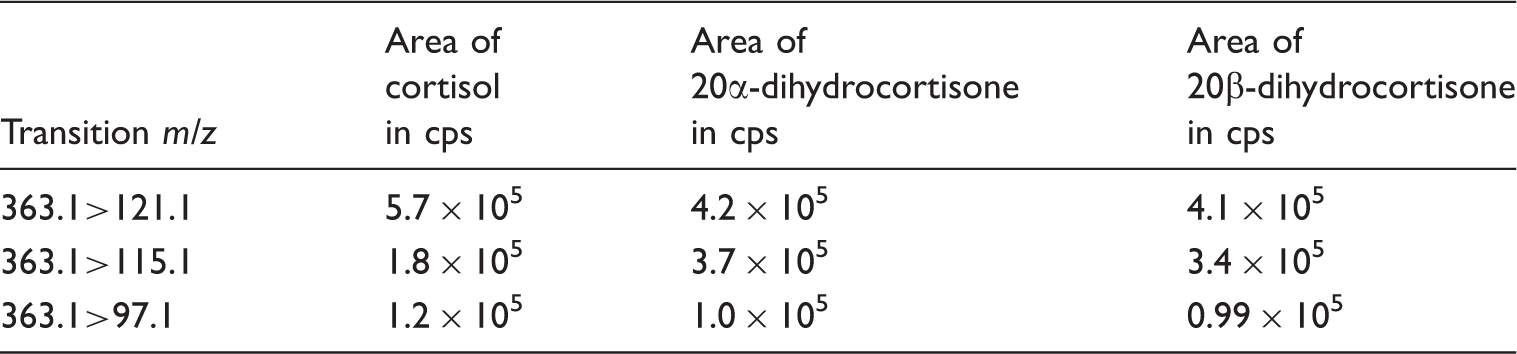
Two interferences, which were co-eluting or eluting close to cortisol in our original method, were successfully separated from cortisol by adjustment of the chromatographic conditions. These interferences were found in both urine and saliva and were identified as the two endogenous cortisol isomers 20α- and 20β-dihydrocortisone. The isomers share molecular mass and mass spectrometric fragmentation pattern with cortisol using electrospray ionization in the positive-ion mode. Both give rise to the transitions m/z 363.1>121.1, 363.1>115.1 and 363.1>97.1. In our original LC-MS/MS setup, the 20β-dihydrocortisone co-eluted with cortisol in the chromatography step resulting in false high determinations.
Conclusions
Cortisol determination by LC-MS/MS may suffer from erroneously elevated results unless 20α- and 20β-dihydrocortisone are chromatographically separated from cortisol.
Keywords
Introduction
Liquid chromatography tandem mass spectrometry (LC-MS/MS) is becoming a routine method for the determination of cortisol in human serum, urine and saliva. As compared with immunochemical methods, in which cortisol tend to cross-react with steroid metabolites, LC-MS/MS methods are considered to offer superior specificity for cortisol alone. However, this requires that cortisol is chromatographically and/or mass spectrometrically separated from interferences. In this report, we show that the cortisol isomers, 20α- and 20β-dihydrocortisone (Figure 1), can be problematic in this sense, since they have similar chemical properties and fragmentation pattern as cortisol. All three compounds give rise to protonated molecular ions (M+1) with m/z 363 in the positive-ion mode using electrospray ionization (ESI).
Structure of cortisol, 20α-dihydrocortisone and 20β-dihydrocortisone.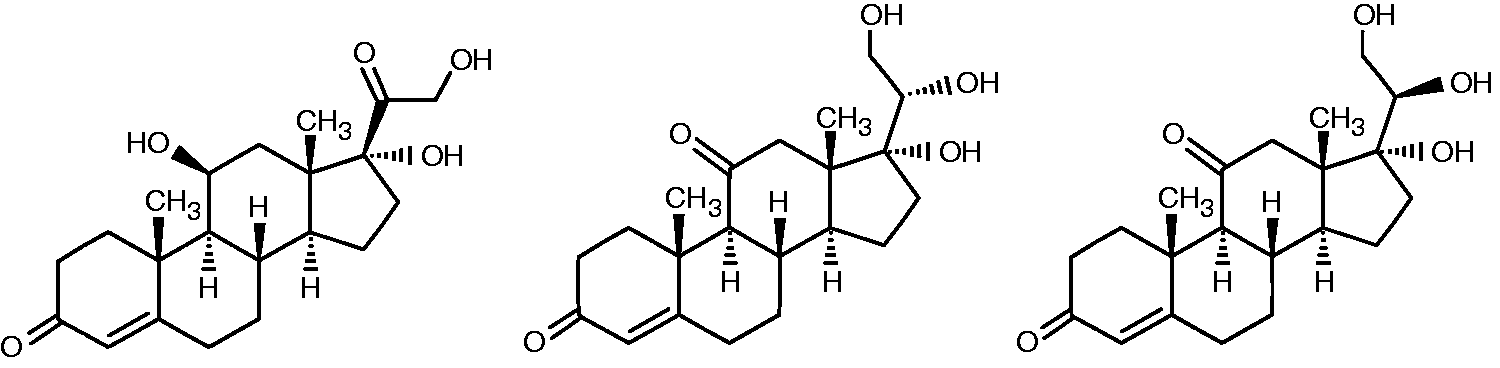
The 20α- and 20β-dihydrocortisones (Reichstein’s substances epi-U and U) have previously been detected in human urine 1 and here we report their presence in saliva. Both isomers are believed to originate from peripheral metabolism of cortisol, 1 but they are expected to lack corticosteroid activity as their structure contains 11-keto and 20-hydroxyl groups. 2 Median urinary excretion of the 20-dihydro isomers in normal subjects are of the same magnitude as for free cortisol. 1
The study reported in this paper originates from the discovery of a number of additional peaks in the chromatograms of cortisol in human saliva and urine samples in routine analysis with LC-MS/MS. The aim was to identify the peaks and separate them from the cortisol.
Material and methods
Chemicals
Cortisol-9,11,12,12-d4 (98% purity) from Cambridge Isotope Laboratories (Tewksbury, MA) served as internal standard. Cortisol (≥98% purity), cortisone (≥98% purity), acetic acid (≥98% purity), methanol and acetonitrile (LC-MS grade) were purchased from Sigma Aldrich Sweden AB (Stockholm, Sweden). Methyl-tert-butyl ether was purchased from Merck Chemicals and Life Science AB (Solna, Sweden). 20α- and 20β-Dihydrocortisone were purchased from Steraloids (Newport, RI). Phosphate-buffered saline (0.1% [wt/vol]) (PBS, pH 7.4) was prepared in-house using sodium chloride purchased from Merck, potassium chloride, sodium phosphate dibasic dihydrate, potassium dihydrogen phosphate purchased from Scharlau (Barcelona, Spain).
Preparation of calibration standards
A stock solution of cortisol (2.76 mmol/L) was prepared in methanol. Calibration standards used were prepared in 0.1% (wt/vol) PBS pH 7.4, at 0, 1, 5, 20, 50, 150, 300 nmol/L.
Sample preparation
Preparation was done by supported liquid extraction: 130 µL sample was diluted with 130 µL water. The diluted sample (190 µL) was then applied to an Isolute SLE+ 200 µL plate (Biotage, Uppsala, Sweden) and eluted with methyl-tert-butyl ether, dried under nitrogen and reconstituted in 110 µL of the starting mobile phases of the first and the second setup, respectively (described below).
Instrumental analysis
The LC-MS/MS analyses were performed with a Shimadzu Nexera UHPLC-system (Shimadzu, Kyoto, Japan) coupled to an AB SCIEX QTRAP 5500 MS (Sciex, Framingham, MA), operated with ESI in the positive-ion mode. MS-settings: Declustering potential 121 V. Exit potential 10 V. Collision energy 31 V (363.1>121.1), 111 V (363.1>115.1) and 31 V (363.1>97.1). Cell exit potential: 14 V. Curtain gas flow: 30 psi. Ion source temperature: 600℃. Ion source gas 1: 50 psi. Ion source gas 2: 60 psi. Nebulizer current: 3 µA. Collision gas (CAD): Medium. Injection volume was 10 µL.
In the first setup, separation was done on an Ascentis Express F5 100 × 2.1 mm, 2.7 µm column (Supelco, Sigma Aldrich Sweden AB, Stockholm, Sweden) using the mobile phases A: water with 0.1% formic acid and B: methanol with 0.1% formic acid, with a gradient of 70:30 to 44:56 (A:B) during 0.5 min and then isocratic until 6 min when increased to 100% B and held for 1 min. Flow was 0.4 mL/min and column oven temperature was 40℃. The total analysis time for one sample was 7.40 min. Product ion scans of unknown peaks and of candidate standards were recorded after separation on another column (Accucore PFP 100 × 2.1 mm, 2.6 µm column, Thermo Fisher Scientific, Göteborg, Sweden) that resulted in purer peaks, but with identical mobile phase and gradient as used with the first column.
In the second setup, separation was done on a Kinetex Biphenyl 100 × 2.1 mm, 2.6 µm column (Phenomenex, Torrance, CA) using the mobile phases A: water with 0.1% formic acid and B: acetonitrile with 0.1% formic acid, with a gradient of 95:5 to 76:24 (A:B) during 0.5 min and then isocratic until 4.6 min when increased to 90% B and held for 1 min. Flow was 0.5 mL/min and column oven temperature was 50℃. Total analysis time for one sample was 6.20 min.
In both setups, cortisol was quantified with the transition m/z 363.1>121.1 and confirmed with m/z 363.1>115.1. The transition m/z 363.1>97.0 was also monitored in the first setup.
Method validation
Both setups were thoroughly validated. The lower limit of quantification (LLOQ) was determined by injection of spiked samples with decreasing cortisol concentrations. LLOQ (defined by signal-to-noise ratio >10:1, accuracy within ±20% and imprecision less than CV 20% for 10 prepared samples at that level) was determined to be 0.25 nmol/L in both setups. Both methods have been shown to be linear (r ≥ 0.9993) in the range 0–300 nmol/L by analysis of 10 calibration curves (weighting 1/×). No matrix effects were found to influence the MS-signal at the retention time of cortisol when prepared saliva and urine samples were injected into the system. Finally, the interassay CVs in clinical routine for the first setup were 9% and 8% at mean concentrations of 1.6 and 50 nmol/L (n = 28) and for the second setup 7% and 6% at mean concentrations of 1.4 and 50 nmol/L, respectively (n = 132).
Results
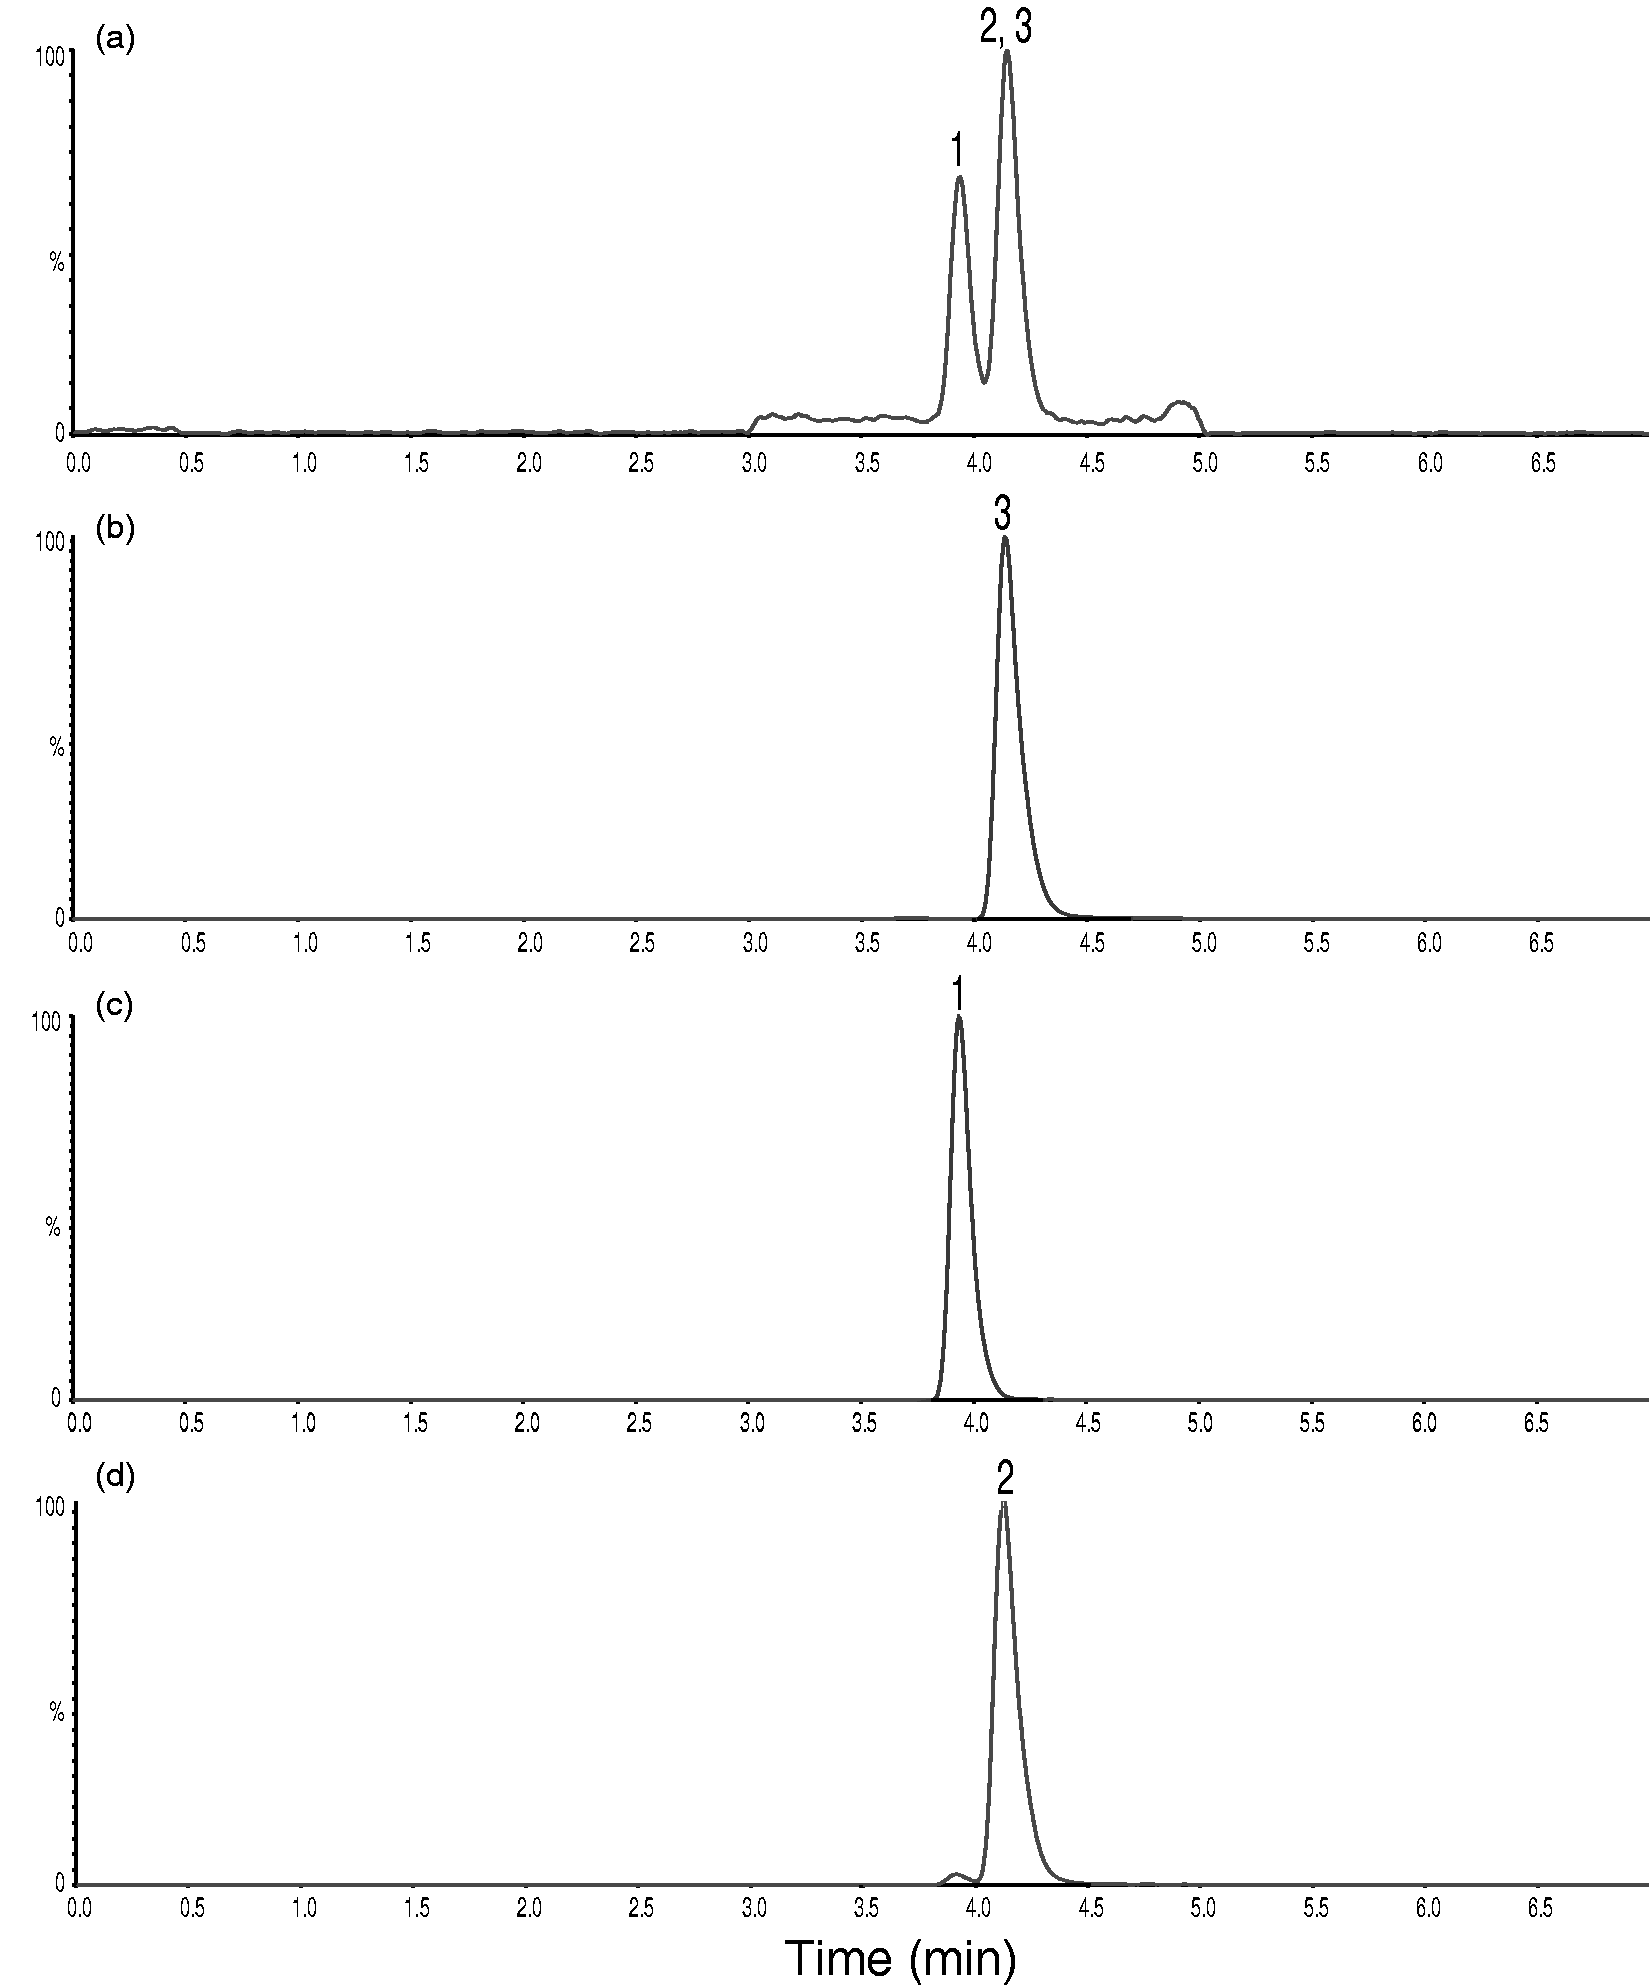
In 2013, our clinical laboratory developed the first LC-MS/MS setup for routine analysis of cortisol in saliva and urine. Retention time of cortisol was approximately 4.20 min. However, we also discovered an unknown peak at approximately 3.95 min (Figure 2(a) and (c)). Identification by injection of pure 20α-dihydrocortisone resulted in a peak with identical retention time and product ion scan as this peak (Figure 3(c) and data not shown). In addition, when different batches of the Ascentis Express F5 column were tested, a second unknown peak, initially co-eluting with cortisol, appeared (Figure 2(b) and (d)). Partial separation of the second peak from cortisol was achieved on 2 of 3 columns tested (data not shown). Injection of pure 20β-dihydrocortisone resulted in a peak with identical retention time and product ion scan as the second unknown peak that initially co-eluted with cortisol (Figure 3(d) and data not shown).
Chromatograms showing transition m/z 363.1>121.1 in the first setup. (a) Representative saliva sample separated on the first Ascentis Express F5 column. Cortisol concentration determined to 0.64 nmol/L, (b) the same saliva sample as in A separated on the second Ascentis Express F5 column. (c) Representative urine sample separated on the first Ascentis Express F5 column. Cortisol concentration determined to 79 nmol/L. (d) The same urine sample as in C separated on the second Ascentis Express F5 column. 1: represents 20α-dihydrocortisone; 2: represents 20β-dihydrocortisone; 3: represents cortisol. Response in percent relative to highest peak. Chromatograms showing transition m/z 363.1>121.1 in the first setup on the first Ascentis Express F5 column. (a) Representative saliva sample. Cortisol concentration determined to 2.1 nmol/L. (b) Pure cortisol. (c) Pure 20α-dihydrocortisone. (d) Pure 20β-dihydrocortisone.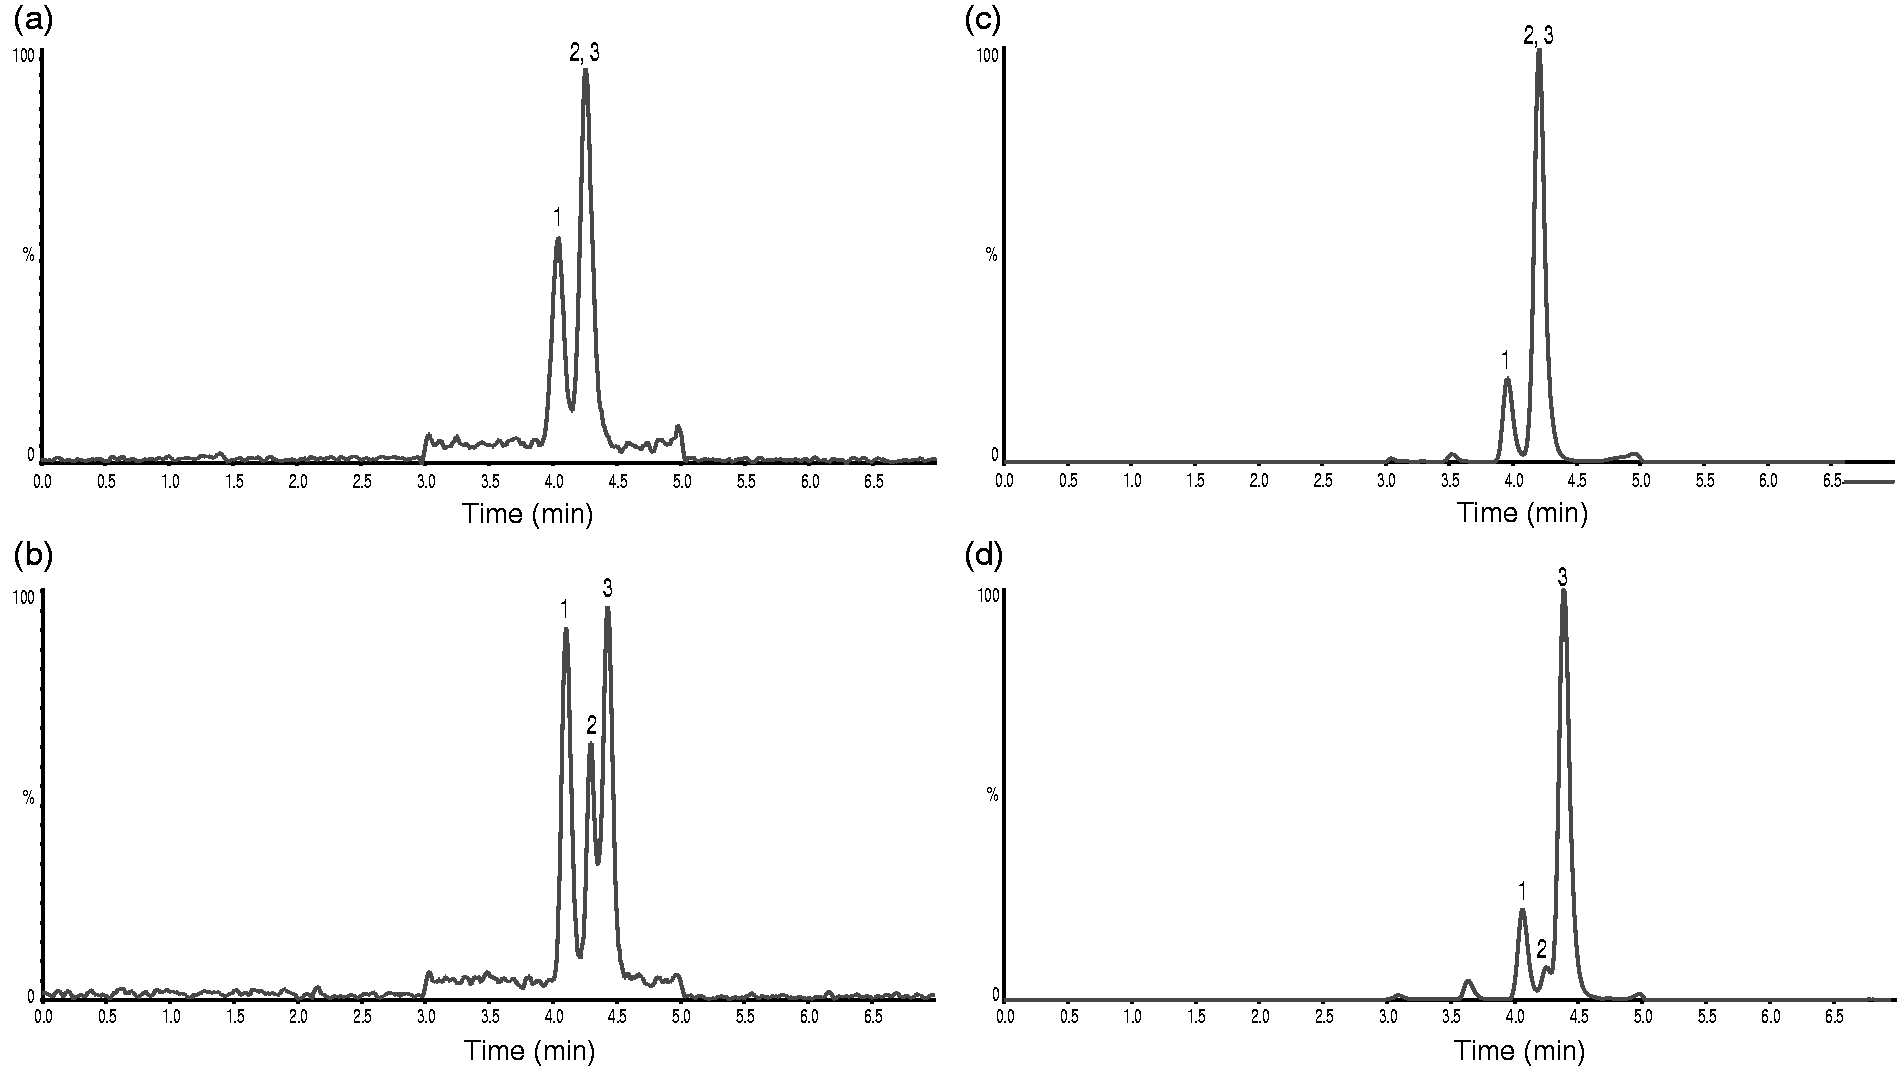
LC-MS/MS response from 160 pg injected cortisol, 20α-dihydrocortisone and 20β-dihydrocortisone, respectively.
We investigated how inclusion of the 20β-isomer affected cortisol determination in randomly chosen clinical routine saliva and urine samples analysed on the second Ascentis Express F5 column that partially resolved cortisol and 20β-dihydrocortisone. Cortisol concentrations were calculated with inclusion of the 20β-dihydrocortisone peak (result A) and without (result B). The difference in results between A and B was variable but most notable at low cortisol concentrations in saliva. Figure 4 shows the relative differences in cortisol determination between inclusion and exclusion of 20β-dihydrocortisone in 58 saliva samples with cortisol concentrations <3 nmol/L. The mean cortisol concentration among those samples was 54% higher (total range: 0–226%) when the 20β-isomer contributed.
Relative difference plot representing 58 saliva samples with cortisol concentration <3 nmol/L. First set up, second Ascentis Express F5 column.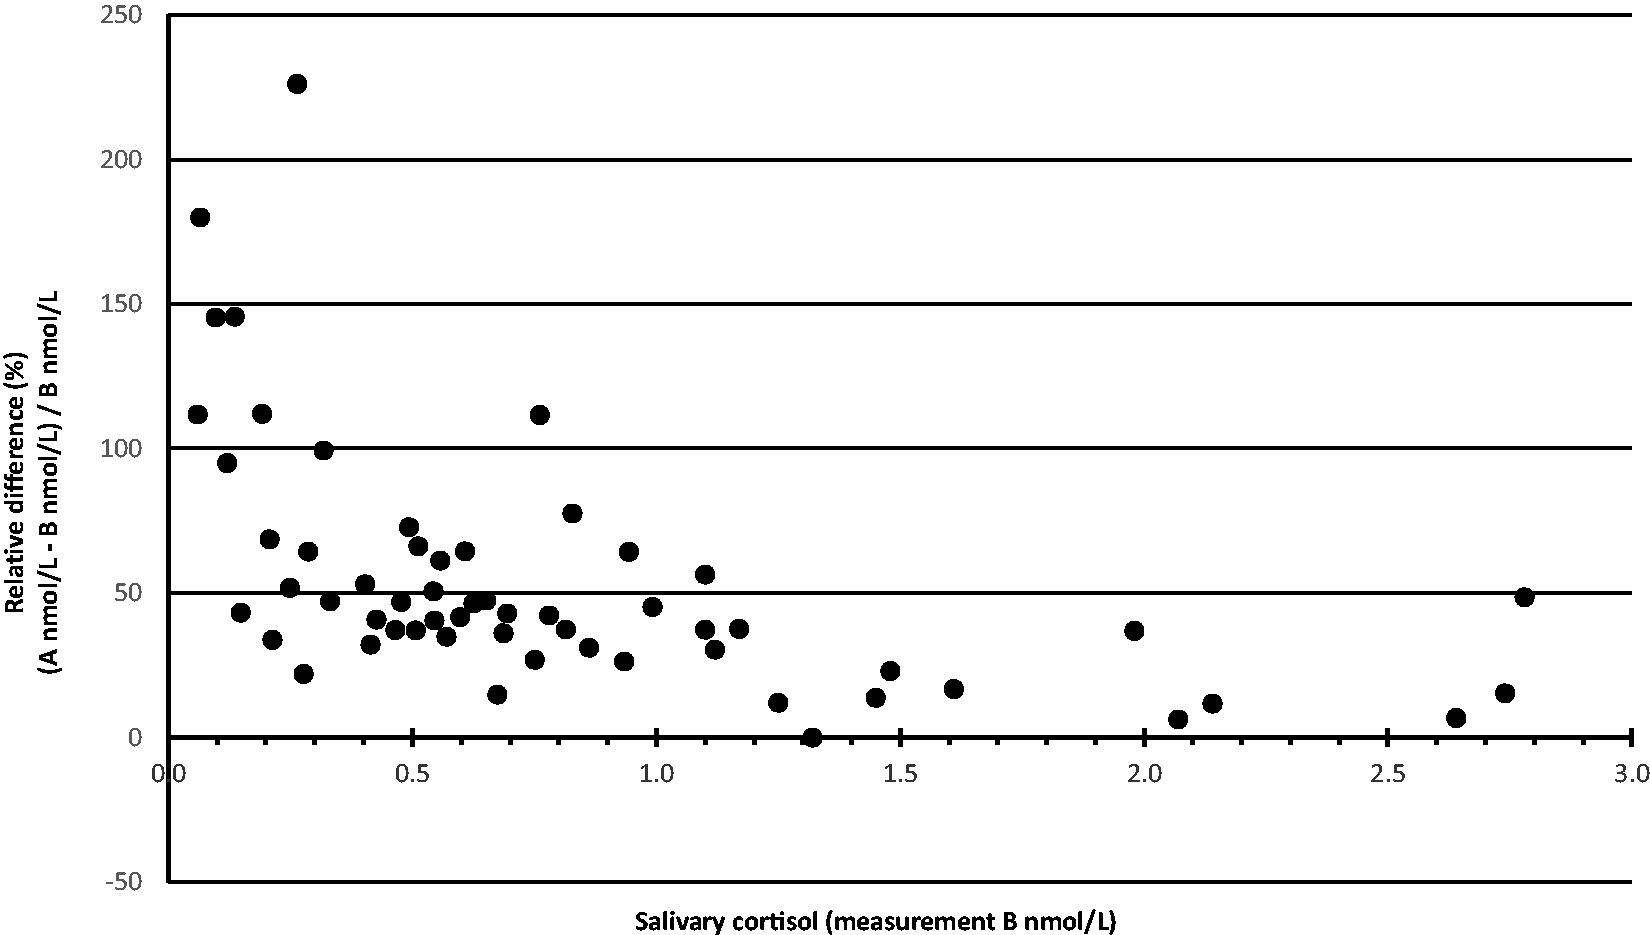
With the modifications described in the Material and methods section, we managed to chromatographically separate the 20α- and 20β-isomers from cortisol in the second LC-MS/MS setup. Cortisol elutes at 3.08 min and is baseline resolved from 20α-dihydrocortisone eluting at 2.47 min and 20β-dihydrocortisone eluting at 2.67 min (Figure 5(a) to (d)). This method also separates cortisol from a prednisolone metabolite
3
(eluting at 2.30 min) that give rise to transition m/z 363.1>121.1 (Figure 5(e)) as well as cortisone (eluting at 3.47 min, data not shown).
Chromatograms showing transition m/z 363.1>121.1 in the second setup using a Kinetex Biphenyl column. (a) Representative saliva sample. Cortisol concentration determined to 7.1 nmol/L. (b) Pure cortisol. (c) Pure 20α-dihydrocortisone (d) Pure 20β-dihydrocortisone. (e) Urine sample from a patient treated with prednisolone showing a prednisolone metabolite separated from a minimal peak representing approximately 0.5 nmol/L of endogenous cortisol.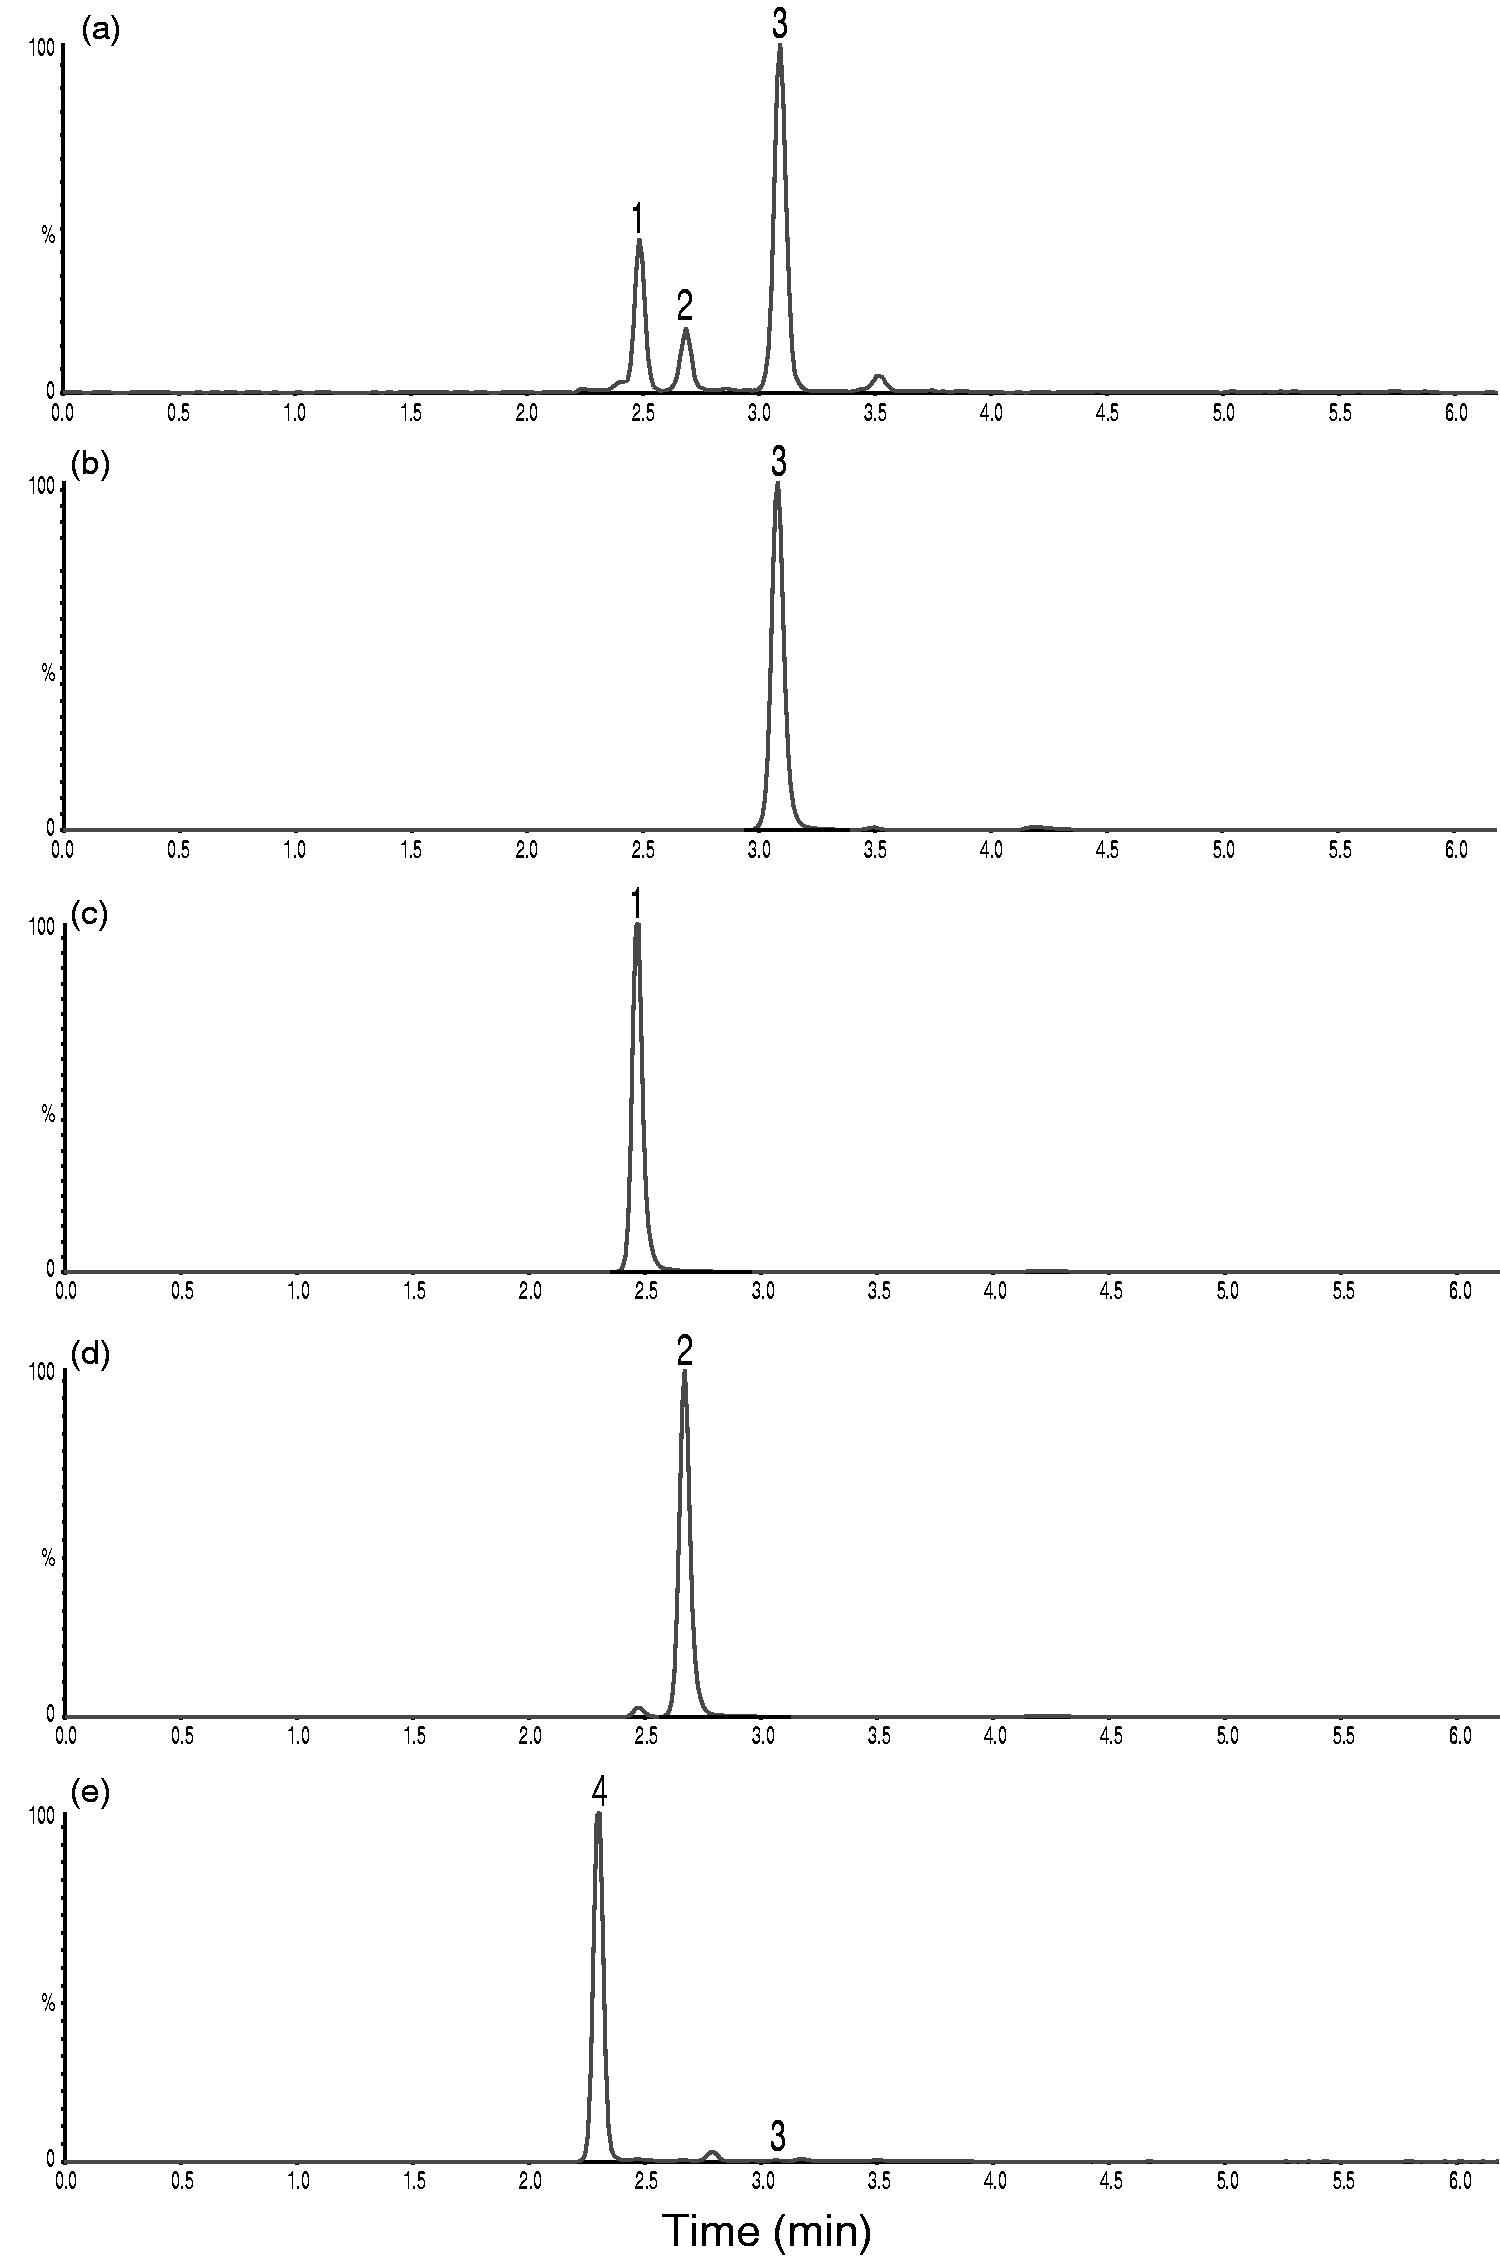
Discussion
Based on the identical retention time and product ion scans compared with reference compounds, we propose that the two unknown peaks appearing in the cortisol chromatogram represent the endogenous cortisol isomers 20α- and 20β-dihydrocortisone. Presence of both isomers is detected in most urine and saliva samples. Cortisol and the 20α- and 20β-dihydrocortisones have similar mass spectrometric product ion pattern, and all three compounds give rise to the transitions m/z 363.1>121.1, 363.1>115.1 and 363.1>97.1. Visual inspection of the product ion scans of pure substances did not, contrary to our wish, suggest any major transitions specific to cortisol alone. The transitions m/z 363.1>121.1 and 363.1>97.1 are commonly used in methods for quantitation of cortisol3,4 including the candidate reference measurement procedure for serum cortisol. 5 The interference by poor separation of 20β-dihydrocortisone from cortisol in our initial setup was most notable at low cortisol concentrations, for example in late night salivary samples. The overestimated recovery was variable but less pronounced in saliva samples with higher cortisol concentrations and in urine samples. We assume that the concentration of 20β-dihydrocortisone and its ratio to cortisol varies considerably in saliva and urine.
With the method described as the second setup in the Material and methods section, we have ensured that 20α-, 20β-dihydrocortisone and the prednisolone metabolite are baseline resolved from cortisol. Furthermore, the second setup may be used for simultaneous quantification of cortisone at an acceptable run time.
Conclusions
Contribution from 20α- and 20β-dihydrocortisone may result in falsely high cortisol concentrations using LC-MS/MS quantifications. We suggest that the validation of LC-MS/MS methods for cortisol determination in body fluids should ensure that both 20α- and 20β-dihydrocortisone are separated from cortisol in the chromatography step. This is particularly important at low cortisol concentrations in saliva. Lack of selectivity, in LC-MS/MS determination of cortisol, will compromise specificity and lead to inappropriate decision values for salivary cortisol at late night and after dexamethasone suppression in the diagnosis of Cushing’s syndrome.
Footnotes
Acknowledgements
Magnus Axelson, Clinical chemistry, Karolinska Institutet is acknowledged for fruitful discussions and Staffan Lundstedt, Medical Biosciences, Umeå University for critical reading of the manuscript.
Declaration of conflicting interests
The author(s) declared no potential conflicts of interest with respect to the research, authorship, and/or publication of this article.
Funding
The author(s) received no financial support for the research, authorship, and/or publication of this article.
Ethical approval
The study has been subject to ethical review by the regional ethical committee at Umeå University (2017/247-31).
Guarantor
GB.
Contributorship
MI has done all experimental work and observations. MI and GB have worked out candidate substances and testing protocol. RB has evaluated glucocorticoid activity. GB wrote the first draft of the manuscript. All authors reviewed and edited the manuscript and approved the final version of the manuscript.